
Apple Inc (AAPL)
Stock Analysis Report
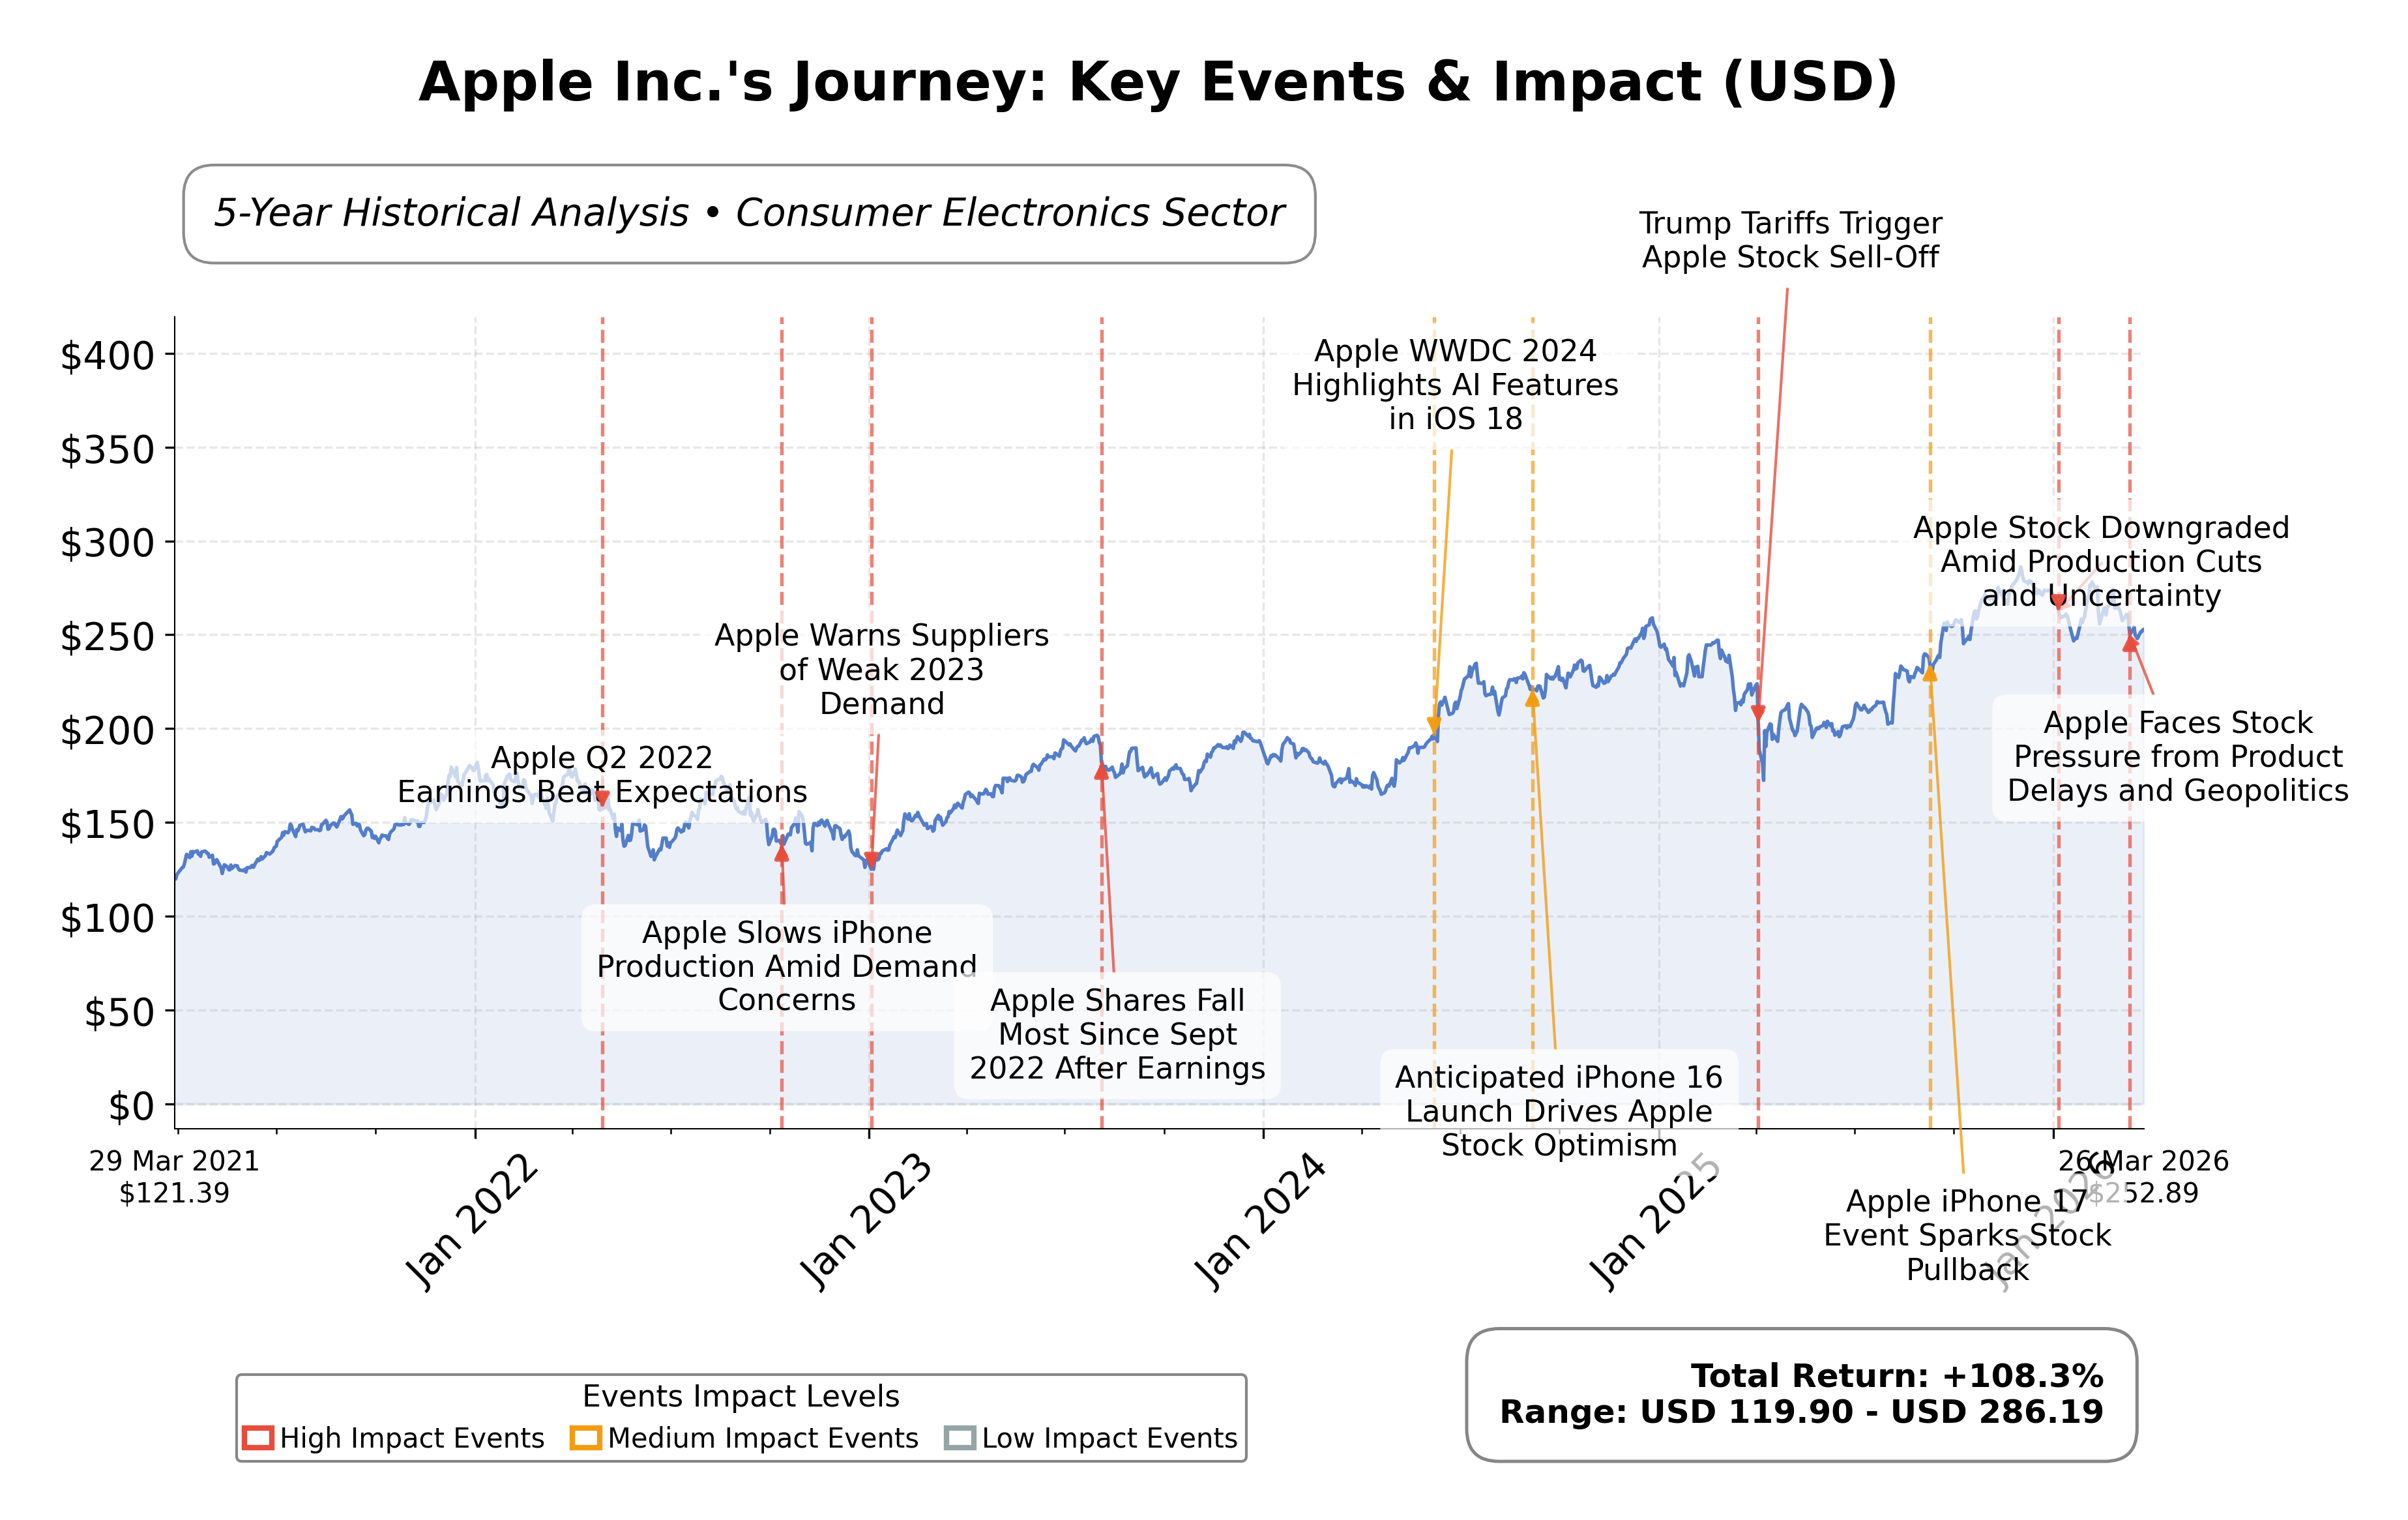
Stock Journey
Key Positives and Key Risks
Pros
- Strong revenue growth of 15.7% year-over-year supports robust business expansion.
- Substantial market capitalization of approximately $3.64 trillion reflects dominant industry position.
- High operating cash flow of $135.5 billion and free cash flow of $106.3 billion indicate strong financial health.
Cons
- Elevated price-to-book ratio of 41.51 suggests premium valuation relative to book value.
- Current ratio below 1 at 0.974 points to tight short-term liquidity considerations.
Disclosure: This information is for general awareness and does not constitute investment advice
Report Summary
Apple Inc. operates as a leading technology company specializing in the design, manufacturing, and marketing of consumer electronics and software products. Its core offerings include the iPhone, Mac computers, iPad tablets, Apple Watch, and a suite of digital services such as the App Store and Apple Music. Positioned prominently in the consumer electronics industry within the technology sector, Apple maintains a vast global footprint supported by extensive retail and online distribution channels.
Financially, Apple demonstrates robust performance with a trailing twelve-month revenue of approximately $435.6 billion and a net income of about $117.8 billion. The company exhibits a profit margin of 27.0% and a gross margin near 48.2%. Valuation metrics show a trailing P/E ratio of 31.51 and a forward P/E of 26.71, with a price-to-book ratio of 41.51 and an enterprise value to EBITDA multiple of 24.15. Appleâs market capitalization stands at roughly $3.64 trillion, reflecting its significant scale and market presence.
Recent technical indicators reveal Appleâs stock trading above its 200-day moving average, indicating sustained upward momentum, with a beta of 1.12 suggesting moderate volatility relative to the market. Strategic initiatives include expansion of the American Manufacturing Program and the launch of Apple Business, a platform targeting enterprise customers. Institutional ownership is substantial at approximately 65%, with recent filings showing mixed accumulation trends among major funds. Notable risks include challenges in AI product development and competitive pressures in the consumer electronics market.
In comparison to regional peers such as Sony Group Corporation, Appleâs market capitalization and valuation multiples are significantly higher, underscoring its dominant position in the consumer electronics sector. While Sony exhibits a lower P/E ratio of 15.68 and a price-to-book ratio of 2.38, Appleâs elevated metrics reflect its premium brand status and growth expectations. Return on equity for Apple is reported at 1.52%, higher than Sonyâs 0.15%, indicating relatively stronger profitability efficiency.
Apple stands as a central figure navigating the evolving technology landscape, marked by its continuous innovation and ecosystem integration. Recent achievements include scaling manufacturing partnerships and launching new enterprise solutions, while ongoing challenges involve product development delays and competitive dynamics. The companyâs strategic direction and market conditions present pivotal moments that could influence its future trajectory. Evaluating the current data suggests a stance that balances recognition of Appleâs strengths with attentiveness to emerging risks and market shifts.
Company and Industry Overview
Company Basics
Price Performance
Company Size
Shareholding Pattern
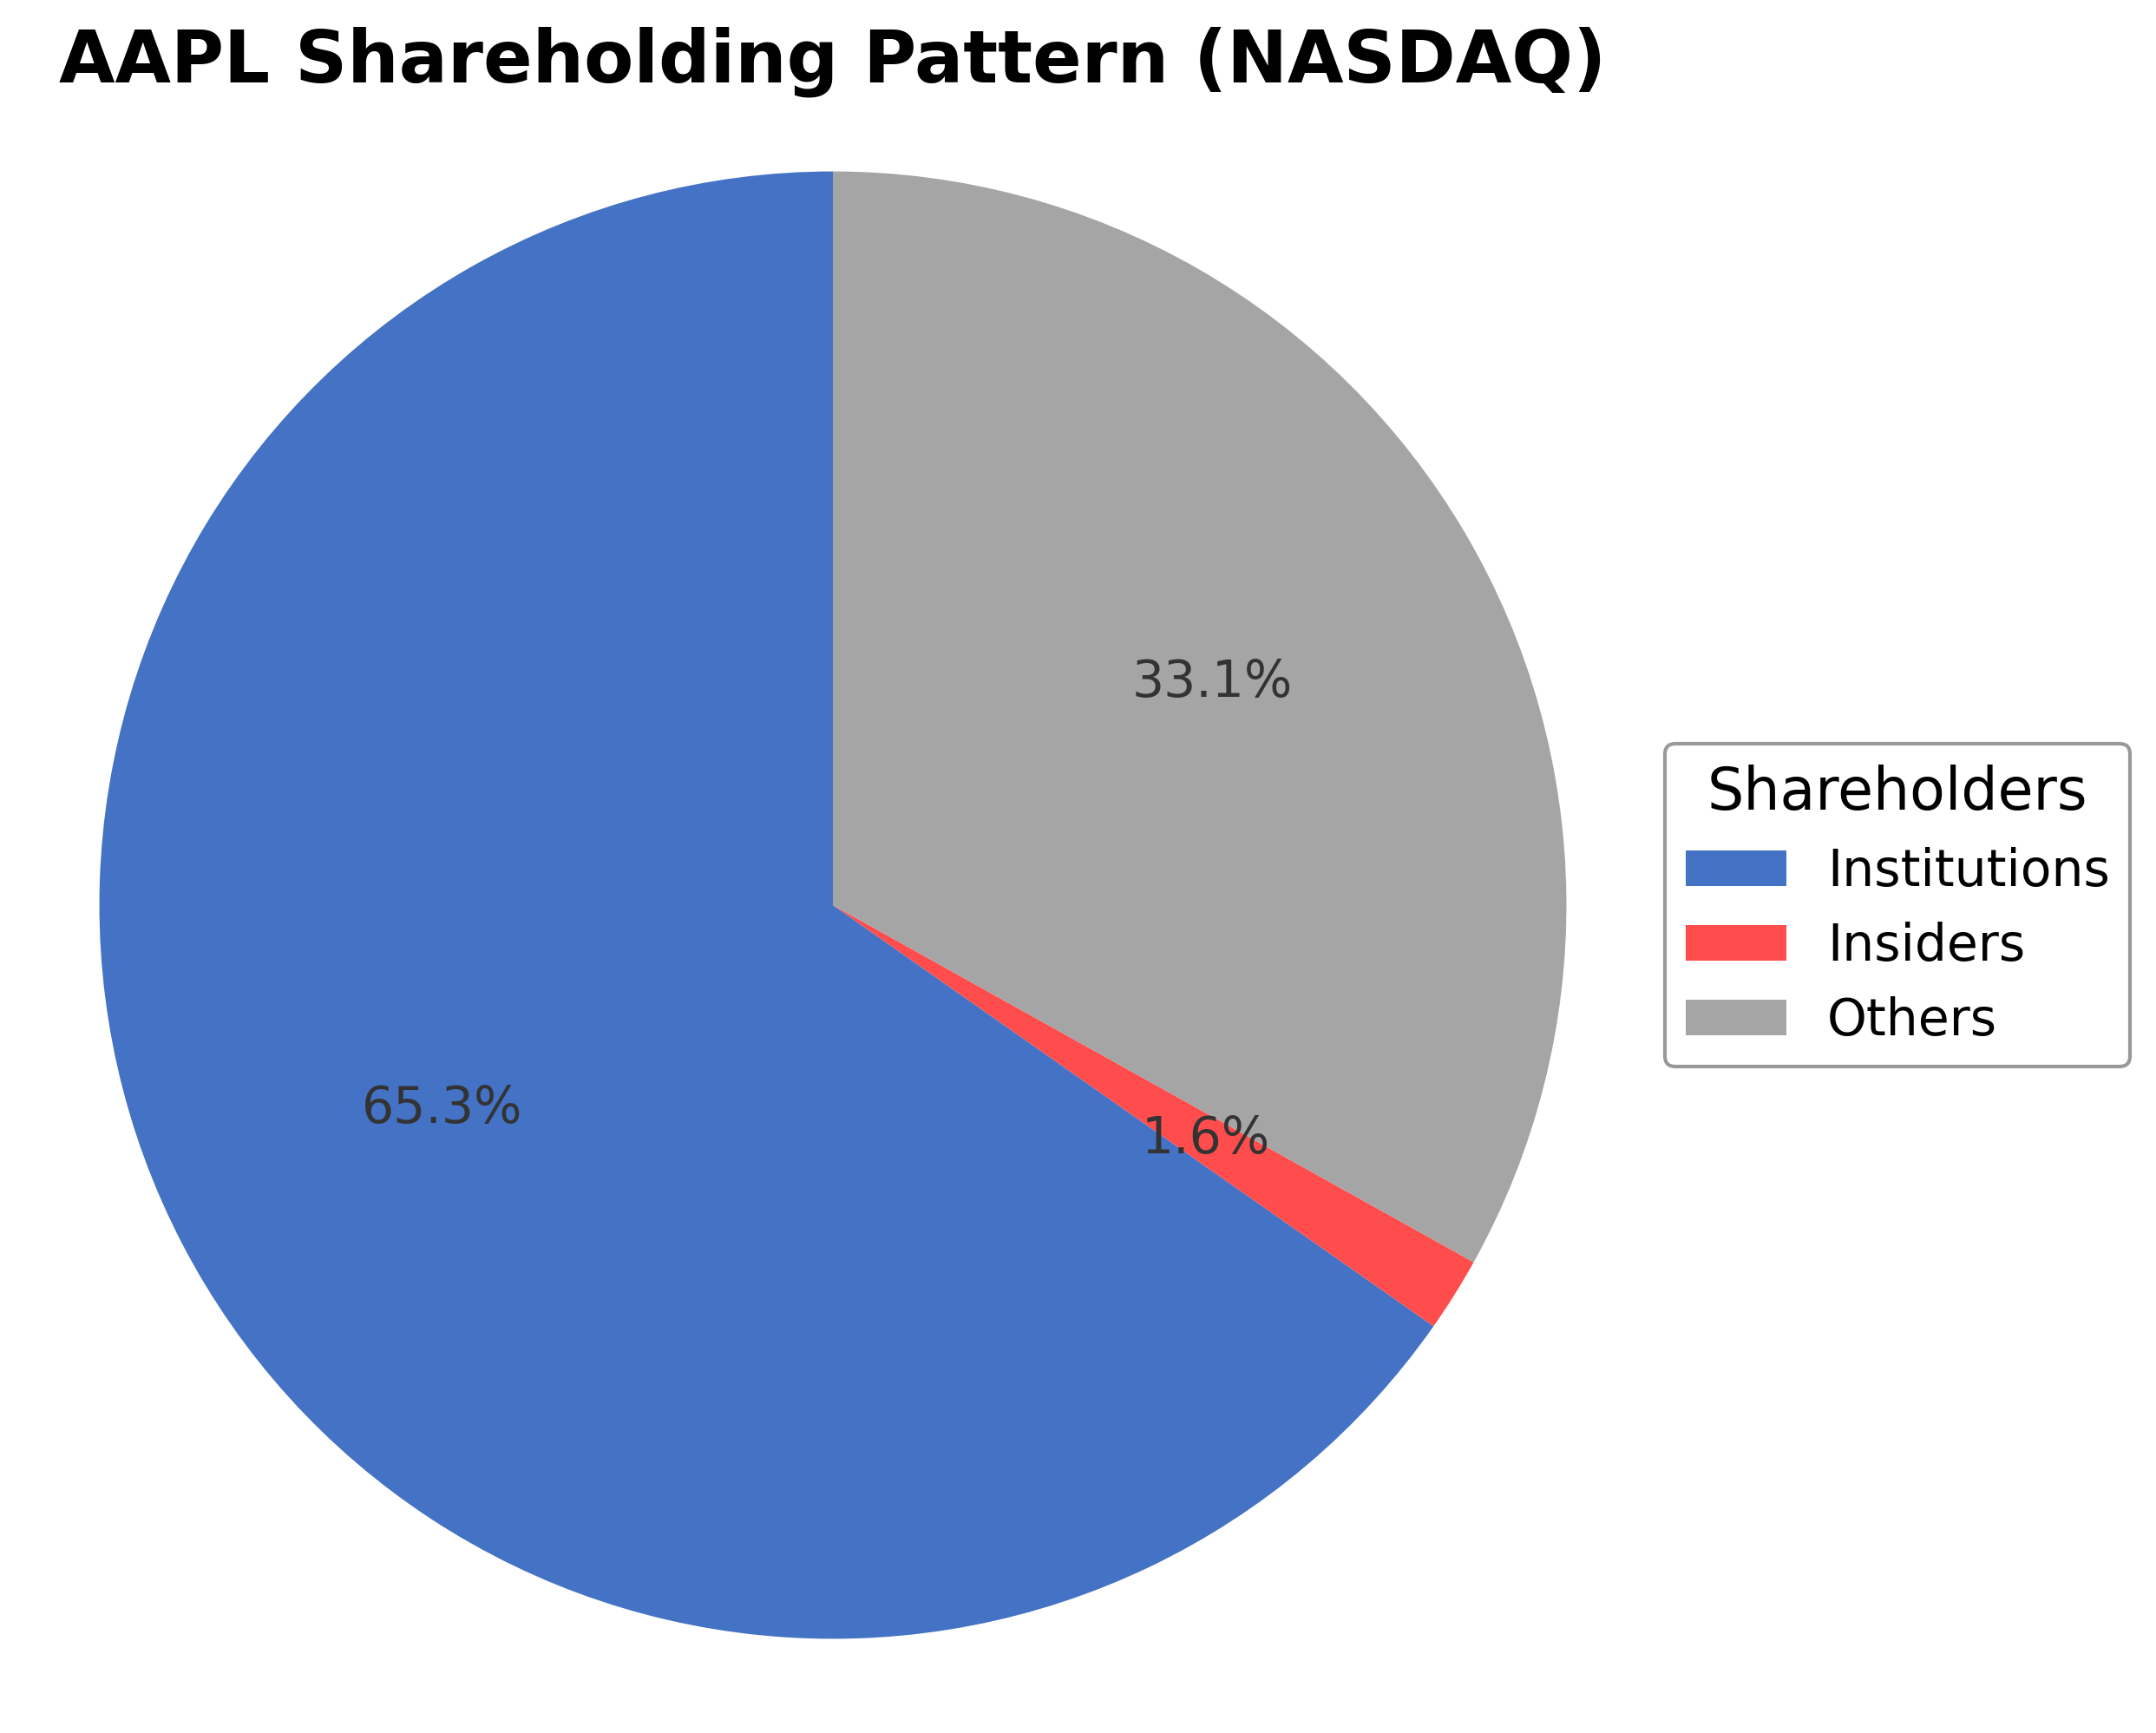
Apple Inc.'s ownership structure is characterized by a dominant institutional investor presence at approximately 65.27%, reflecting strong engagement from mutual funds, pension funds, and asset managers. Insider holdings, including executives and board members, represent about 1.64%, while other shareholders such as retail investors and employee stock plans account for roughly 34.71%. Over the past 12-24 months, institutional accumulation has shown mixed trends with notable increases by firms like Nordea Investment Management AB and Occidental Asset Management LLC, alongside reductions by others such as Northside Capital Management LLC. These patterns suggest a generally positive market sentiment towards Apple, supporting governance stability and strategic continuity, while the broad institutional base may influence future corporate actions and capital allocation decisions.
Sector and Industry Analysis
Apple Inc. (AAPL) operates primarily within the Technology sector, specifically in the Hardware industry, which encompasses consumer electronics, computing devices, and related software ecosystems. The global hardware market is substantial, driven by rapid digital transformation, increasing consumer demand for smart devices, and enterprise adoption of integrated technology solutions. The sector is characterized by high revenue volumes, with Apple among the largest players globally, boasting a market capitalization exceeding $3.7 trillion as of 2026. Other key competitors include Samsung, Microsoft (in hardware segments), and emerging Chinese manufacturers. The sector growth trajectory remains robust, propelled by innovation cycles in smartphones, personal computing, wearables, and expanding software services integrated with hardware platforms.
Industry trends highlight a pronounced shift towards ecosystem-centric product development, where hardware is bundled with proprietary software and cloud services to enhance user engagement and lock-in. Apple exemplifies this with its iPhone-centric ecosystem, integrating Mac, iPad, Apple Watch, and services like streaming and subscription bundles. Technological advancements in semiconductor design, including Apple’s in-house chip development, and augmented reality applications represent emerging opportunities. Consumer behavior increasingly favors seamless, interconnected devices with privacy and security features, influencing product design and marketing strategies. Additionally, sustainability and circular economy initiatives are gaining traction, impacting supply chain and product lifecycle management within the hardware industry.
The regulatory landscape for the hardware industry is complex and multifaceted, encompassing data privacy laws (e.g., GDPR, CCPA), import/export controls, environmental regulations, and antitrust scrutiny. Apple and its peers must comply with stringent standards related to product safety, electronic waste disposal, and increasingly, digital rights management. Trade policies and tariffs, particularly between the U.S. and China, affect supply chain logistics and cost structures. Moreover, regulatory focus on monopolistic practices and platform dominance has intensified, with governments globally examining the competitive impacts of integrated hardware-software ecosystems. Compliance demands necessitate continuous monitoring and adaptation, influencing operational and strategic decisions.
Competitive dynamics in the hardware industry are shaped by high capital intensity, rapid innovation cycles, and significant economies of scale. Barriers to entry are substantial due to the need for advanced R&D capabilities, established supply chain networks, and brand equity. Apple’s competitive positioning is reinforced by its vertically integrated model—designing proprietary chips, software, and hardware—coupled with a strong retail presence and extensive distribution partnerships. Market structure is oligopolistic with a few dominant firms controlling large market shares, while smaller players compete in niche segments or emerging technologies. The industry’s competitive landscape is further complicated by the convergence of hardware with services and software, necessitating cross-domain expertise and strategic alliances.
Note: Analysis synthesized from industry research, market reports, and regulatory filings. Information is subject to change based on market conditions.
Illustrative Scenario Analysis
DCF Assumptions:
Method: Two-Stage EPS-Priority Model
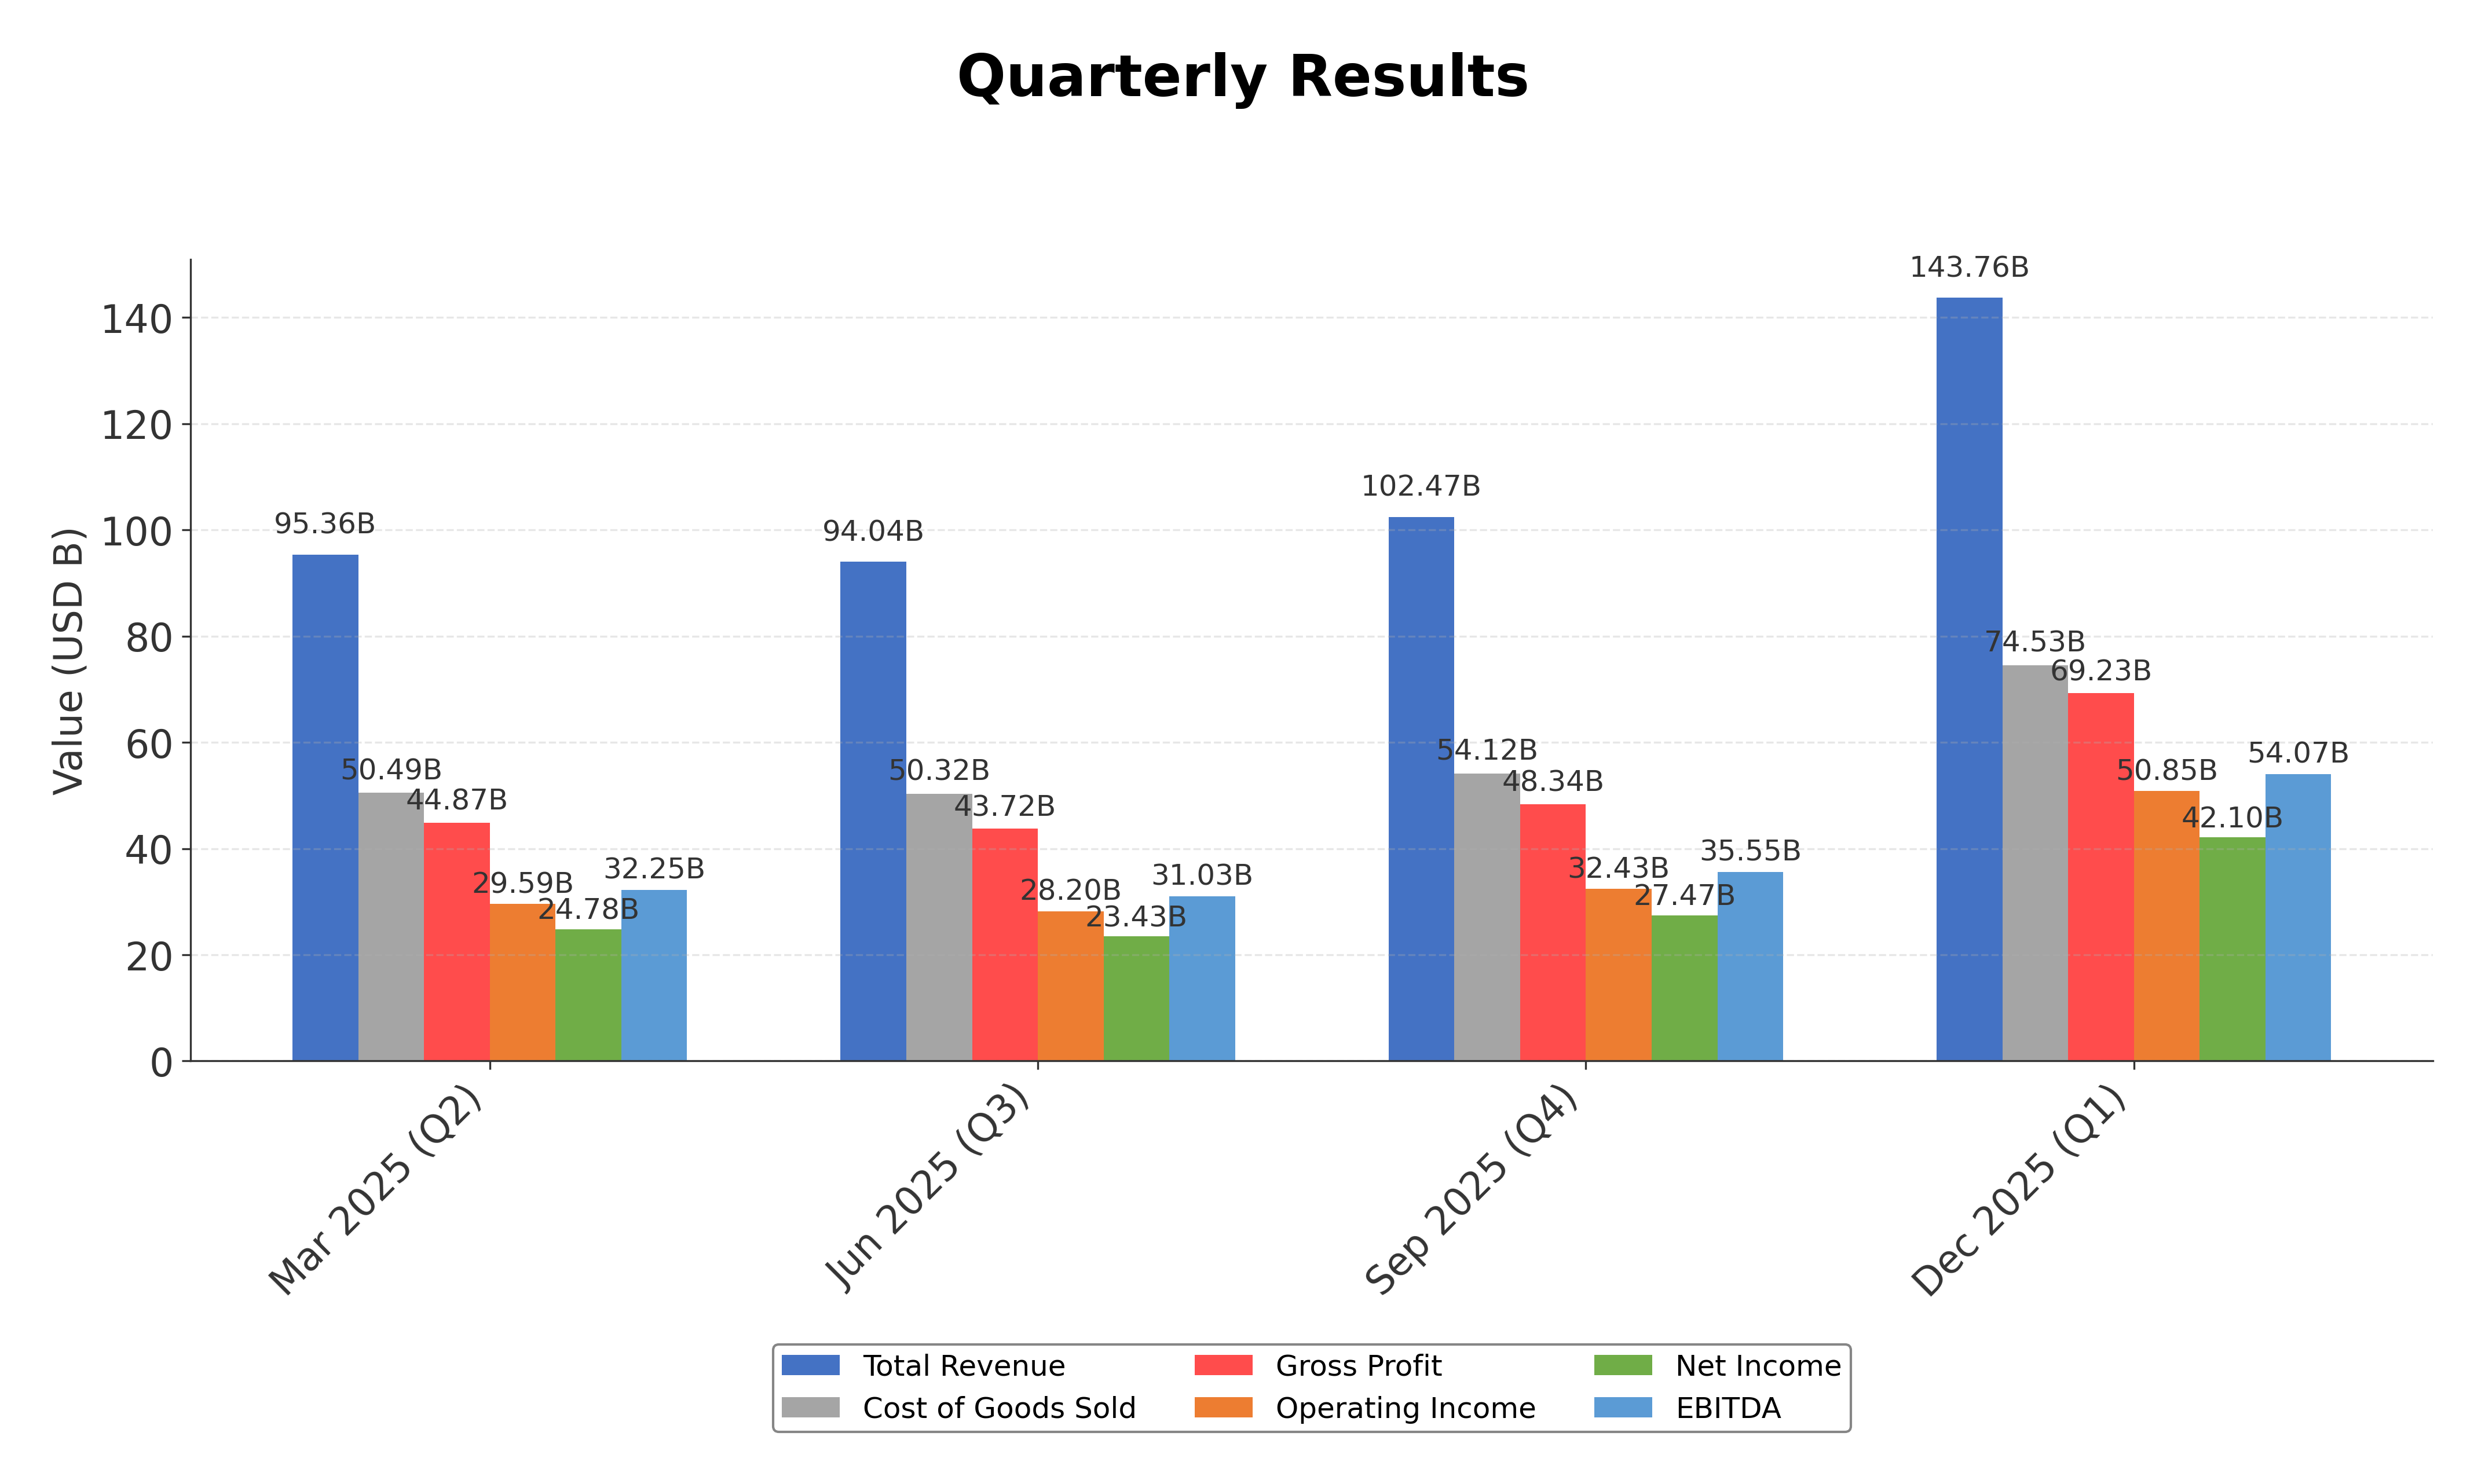
Financials
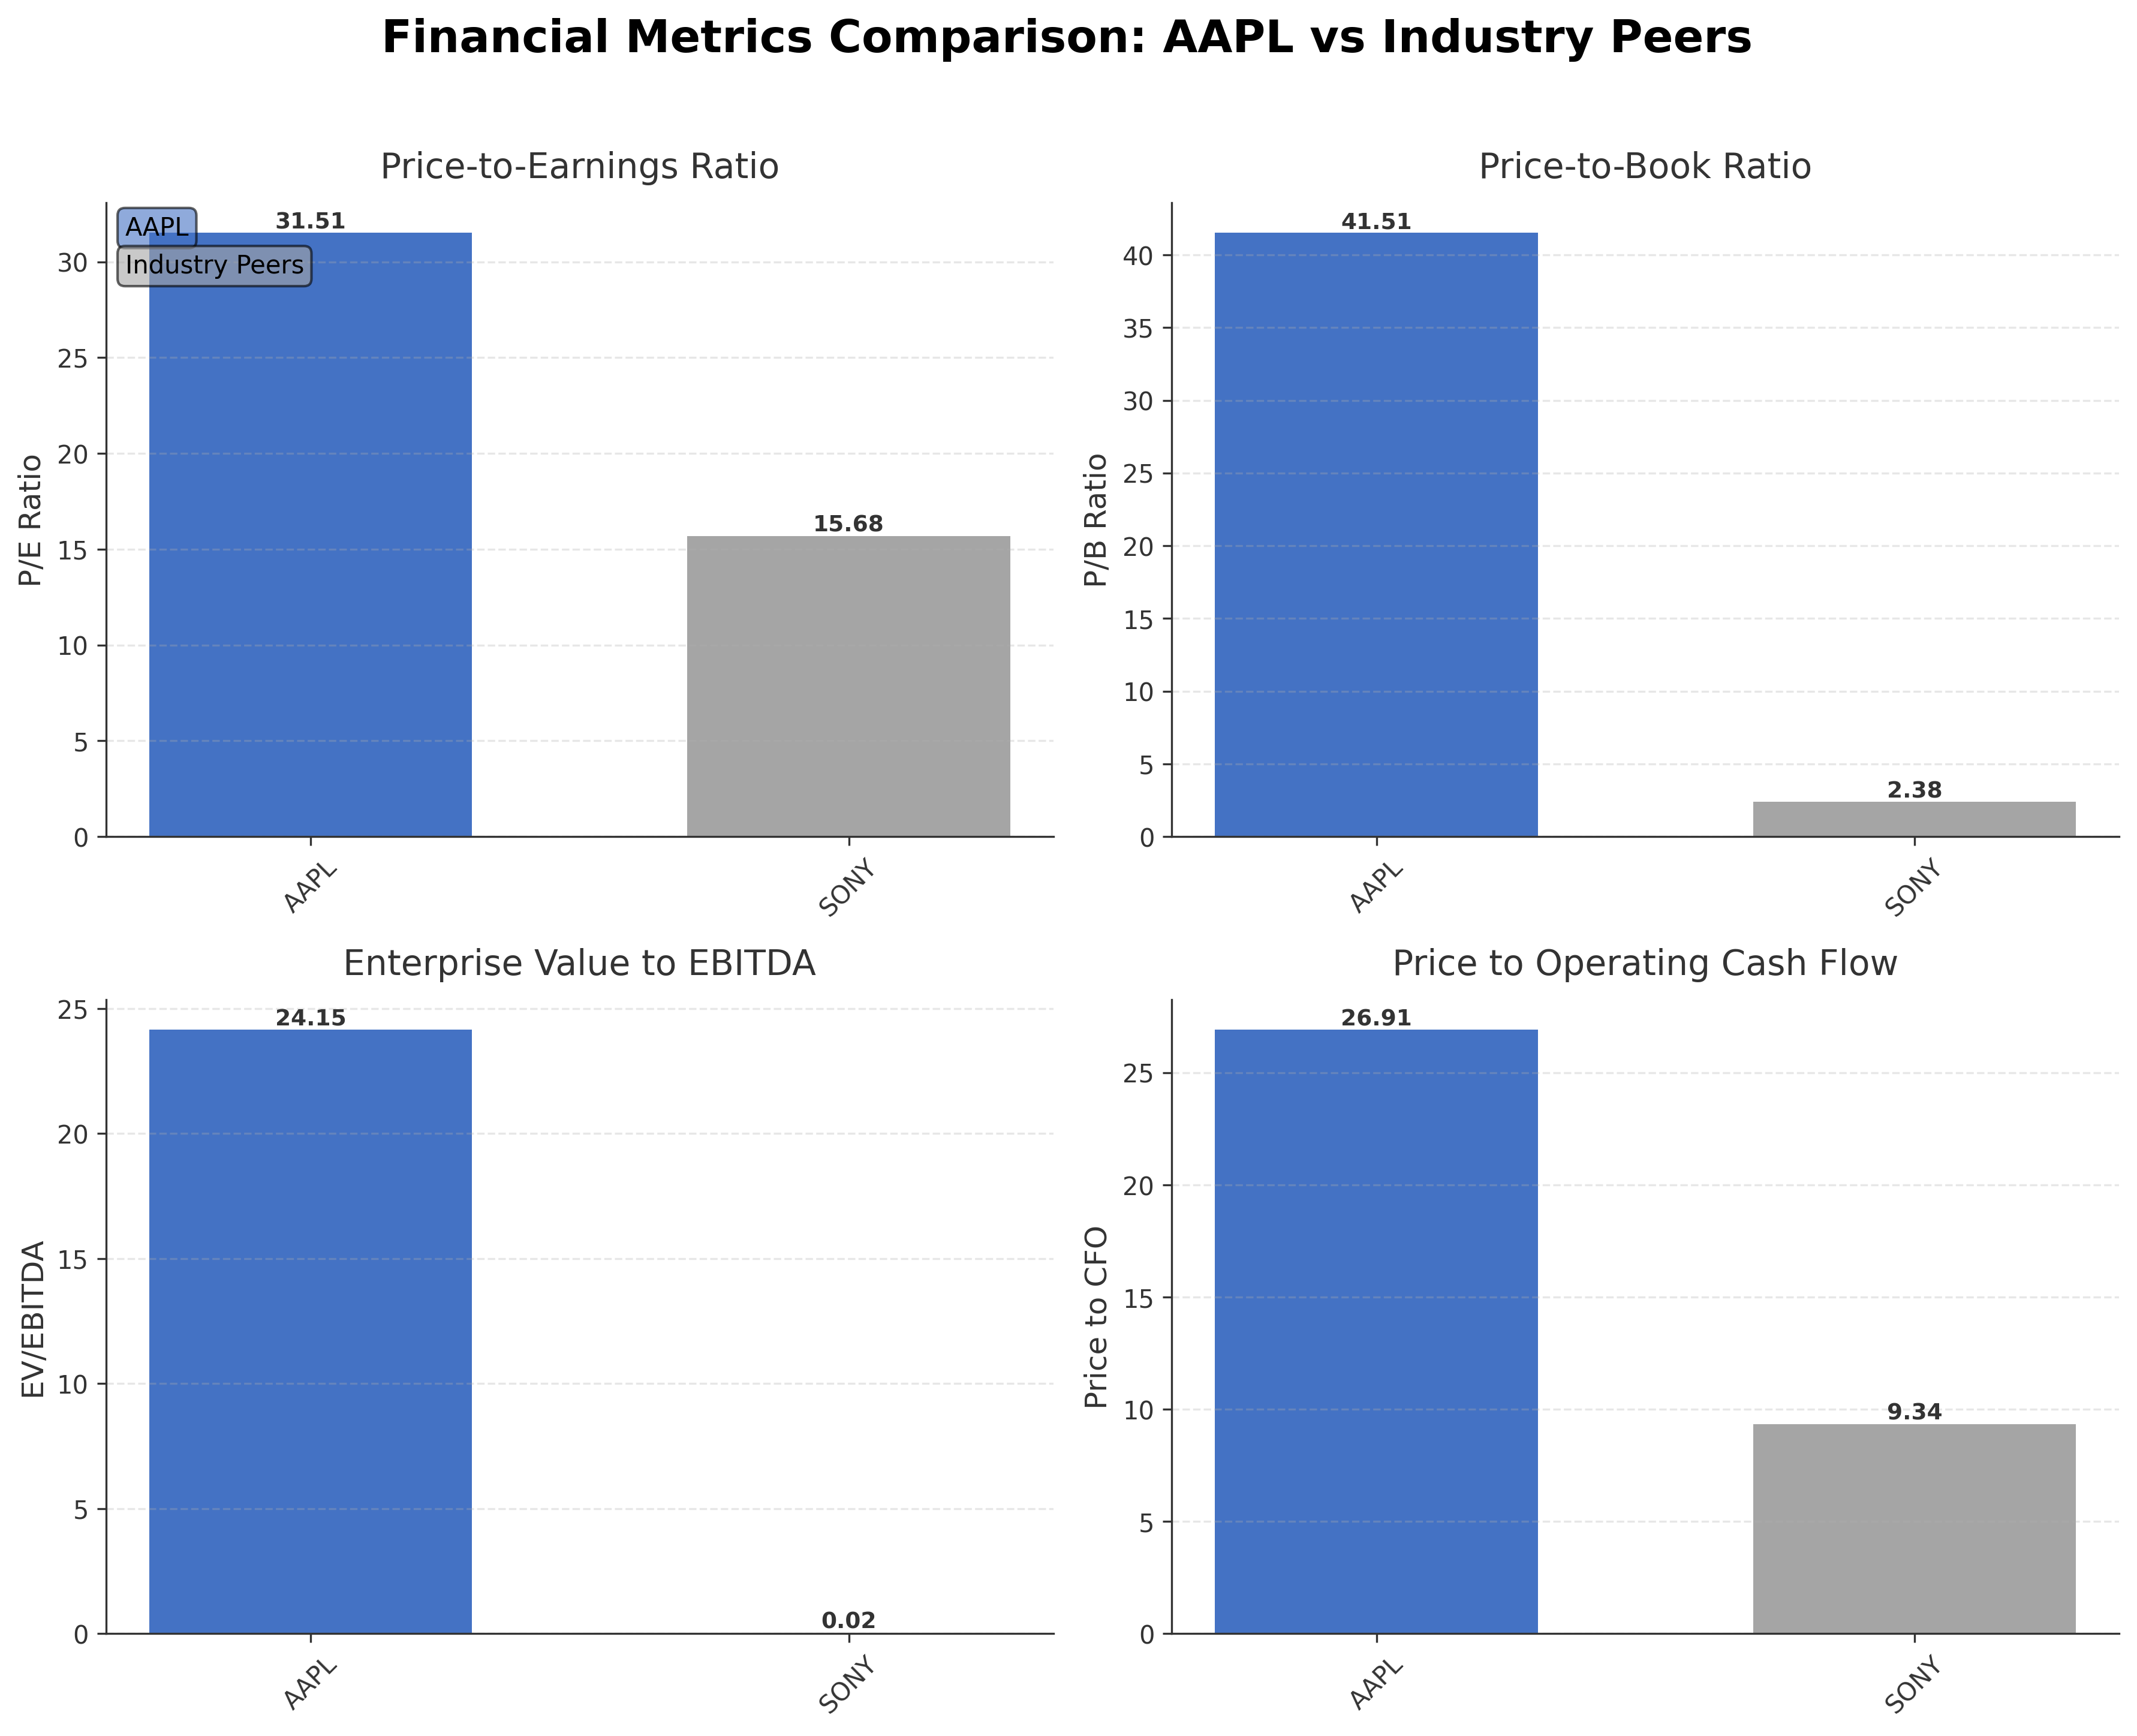
Peer Analysis
| Company Name | Market Cap | P/E Ratio | P/B Ratio | EV/EBITDA | Price to CFO |
|---|---|---|---|---|---|
| Apple Inc. | $3.64T | 31.51 | 41.51 | 24.15 | 26.91 |
| Sony Group Corporation - Sponsored American Depositary Receipt | $120.12B | 15.68 | 2.38 | 0.02 | 9.34 |
Comparison Analysis: Apple Inc. significantly outscales its peer Sony Group Corporation in market capitalization, with a valuation exceeding $3.6 trillion compared to Sony’s $120 billion. Apple’s P/E ratio of 31.51 and price-to-book ratio of 41.51 are markedly higher than Sony’s 15.68 and 2.38 respectively, reflecting premium market expectations and brand valuation. The enterprise value to EBITDA multiple for Apple stands at 24.15, substantially above Sony’s 0.02, indicating differing profitability and capital structure profiles. Return on equity also favors Apple at 1.52% versus Sony’s 0.15%, highlighting stronger profitability efficiency. These metrics collectively underscore Apple’s dominant industry positioning and valuation premium within the regional consumer electronics sector.
Financial Metrics Comparison with Peers
Financial Statements
Comprehensive financial data including income, balance sheet, and cash flow metrics
Income Statement
| fiscal_date | 2025-09-30 | 2024-09-30 | 2023-09-30 | 2022-09-30 | 2021-09-30 |
|---|---|---|---|---|---|
| Sales | 416.16B | 391.04B | 383.29B | 394.33B | 365.82B |
| Cost Of Goods | 220.96B | 210.35B | 214.14B | 223.55B | 212.98B |
| Gross Profit | 195.20B | 180.68B | 169.15B | 170.78B | 152.84B |
| Operating Expense Research And Development | 34.55B | 31.37B | 29.91B | 26.25B | 21.91B |
| Operating Expense Selling General And Administrative | 27.60B | 26.10B | 24.93B | 25.09B | 21.97B |
| Operating Income | 133.05B | 123.22B | 114.30B | 119.44B | 108.95B |
| Other Income Expense | -321.00M | 269.00M | -565.00M | -334.00M | 60.00M |
| Pretax Income | 132.73B | 123.48B | 113.74B | 119.10B | 109.21B |
| Income Tax | 20.72B | 29.75B | 16.74B | 19.30B | 14.53B |
| Net Income | 112.01B | 93.74B | 97.00B | 99.80B | 94.68B |
| Eps Basic | 7.49 | 6.11 | 6.16 | 6.15 | 5.67 |
| Eps Diluted | 7.46 | 6.08 | 6.13 | 6.11 | 5.61 |
| Basic Shares Outstanding | 14.95B | 15.34B | 15.74B | 16.22B | 16.70B |
| Diluted Shares Outstanding | 14.95B | 15.34B | 15.74B | 16.22B | 16.70B |
| Ebit | 133.05B | 123.22B | 114.30B | 119.44B | 111.85B |
| Ebitda | 144.75B | 134.66B | 125.82B | 130.54B | 123.14B |
| Net Income Continuous Operations | 112.01B | 93.74B | 97.00B | 99.80B | 94.68B |
| Non Operating Interest Income | N/A | N/A | 3.75B | 2.83B | 2.84B |
| Non Operating Interest Expense | N/A | N/A | 3.93B | 2.93B | 2.65B |
Data provided by Twelve Data
Balance Sheet
| fiscal_date | 2025-09-30 | 2024-09-30 | 2023-09-30 | 2022-09-30 | 2021-09-30 |
|---|---|---|---|---|---|
| Cash And Cash Equivalents | 35.93B | 29.94B | 29.96B | 23.65B | 34.94B |
| Accounts Receivable | 39.78B | 33.41B | 29.51B | 28.18B | 26.28B |
| Total Assets | 359.24B | 364.98B | 352.58B | 352.75B | 351.00B |
| Total Liabilities | 285.51B | 308.03B | 290.44B | 302.08B | 287.91B |
| Long Term Debt | 78.33B | 85.75B | 95.28B | 109.71B | 119.38B |
| Shareholders Equity | 73.73B | 56.95B | 62.15B | 50.67B | 63.09B |
Data provided by Twelve Data
Cash Flow Statement
| fiscal_date | 2025-09-30 | 2024-09-30 | 2023-09-30 | 2022-09-30 | 2021-09-30 |
|---|---|---|---|---|---|
| Operating Activities Net Income | 112.01B | 93.74B | 97.00B | 99.80B | 94.68B |
| Operating Activities Depreciation | 11.70B | 11.45B | 11.52B | 11.10B | 11.28B |
| Operating Activities Stock Based Compensation | 12.86B | 11.69B | 10.83B | 9.04B | 7.91B |
| Operating Activities Other Non Cash Items | -89.00M | -2.27B | -2.23B | 1.01B | -4.92B |
| Operating Activities Accounts Receivable | -7.03B | -5.14B | -417.00M | -9.34B | -14.03B |
| Operating Activities Accounts Payable | 902.00M | 6.02B | -1.89B | 9.45B | 12.33B |
| Operating Activities Other Assets Liabilities | -18.87B | 2.77B | -4.27B | 1.57B | -1.53B |
| Operating Activities Operating Cash Flow | 111.48B | 118.25B | 110.54B | 123.52B | 100.94B |
| Investing Activities Capital Expenditures | -12.71B | -9.45B | -10.96B | -10.71B | -11.09B |
| Investing Activities Purchase Of Investments | -24.41B | -48.66B | -29.51B | -76.92B | -109.56B |
| Investing Activities Sale Of Investments | 53.80B | 62.35B | 45.51B | 67.36B | 106.48B |
| Investing Activities Other Investing Activity | -1.48B | -1.31B | -1.34B | -2.09B | -385.00M |
| Investing Activities Investing Cash Flow | 15.20B | 2.94B | 3.71B | -22.66B | -14.58B |
| Financing Activities Long Term Debt Issuance | 4.48B | 0.00 | 5.23B | 5.46B | 20.39B |
| Financing Activities Long Term Debt Payments | -10.93B | -9.96B | -11.15B | -9.54B | -8.75B |
| Financing Activities Short Term Debt Issuance | -2.03B | 3.96B | -3.98B | 3.96B | 1.02B |
| Financing Activities Common Stock Repurchase | -90.71B | -94.95B | -77.55B | -89.40B | -85.97B |
| Financing Activities Common Dividends | -15.42B | -15.23B | -15.03B | -14.84B | -14.47B |
| Financing Activities Other Financing Charges | -6.07B | -5.80B | -6.01B | -6.38B | -5.58B |
| Financing Activities Financing Cash Flow | -120.69B | -121.98B | -108.49B | -110.75B | -92.25B |
| End Cash Position | 35.93B | 29.94B | 30.74B | 24.98B | 35.93B |
| Income Tax Paid | 43.37B | 26.10B | 18.68B | 19.57B | 25.39B |
| Free Cash Flow | 98.77B | 108.81B | 99.58B | 111.44B | 92.95B |
| Interest Paid | N/A | N/A | 3.80B | 2.87B | 2.69B |
| Operating Activities Deferred Taxes | N/A | N/A | N/A | 895.00M | -4.77B |
| Investing Activities Net Acquisitions | N/A | N/A | N/A | -306.00M | -33.00M |
| Financing Activities Common Stock Issuance | N/A | N/A | N/A | N/A | 1.10B |
Data provided by Twelve Data
Technical Analysis
Key Insights
- Apple’s stock exhibits an overall upward trend, trading above its 50-day ($261.64) and 200-day ($246.36) moving averages, indicating sustained bullish momentum.
- Key support levels are identified near $246.36 (200-day MA) and $169.21 (52-week low), while resistance is observed around $288.62 (52-week high).
- The current price of $252.64 is below the 50-day moving average but above the 200-day moving average, suggesting potential consolidation in the medium term.
- Momentum indicators show a moderate Relative Strength Index (RSI), with MACD and Stochastic oscillators reflecting neutral to slightly positive momentum.
- Multi-timeframe analysis reveals consistent price strength on the weekly and monthly charts, with short-term daily charts indicating some volatility.
- Potential market scenarios include continuation of the upward trend if support levels hold, or corrective pullbacks if resistance near the 52-week high proves strong.
Trending News
1. Headline: 7 Apple inventions that reinvented Apple | Macworld
Summary: Macworld examines seven pivotal Apple products that transformed the company from near-bankruptcy to tech dominance, including the G3 iMac, iPod, iTunes Store, MacBook Air, Apple Watch, AirPods, and Apple Silicon.
Sentiment: neutral
2. Headline: Apple Inc. $AAPL Position Increased by Nordea Investment Management AB
Summary: Nordea Investment Management AB boosted its position in Apple Inc. (NASDAQ:AAPL - Free Report) by 3.7% during the 4th quarter, according to the company in its most recent disclosure with the Securities & Exchange Commission. The institutional investor owned 22,035,680 shares of the iPhone make
Sentiment: positive
3. Headline: Occidental Asset Management LLC Buys 14,623 Shares of Apple Inc. $AAPL
Summary: Occidental Asset Management LLC raised its stake in Apple Inc. (NASDAQ:AAPL - Free Report) by 8.9% during the 4th quarter, according to the company in its most recent 13F filing with the Securities & Exchange Commission. The firm owned 178,223 shares of the iPhone maker's stock after acquiring
Sentiment: positive
4. Headline: Northside Capital Management LLC Cuts Stock Position in Apple Inc. $AAPL
Summary: Northside Capital Management LLC decreased its holdings in shares of Apple Inc. (NASDAQ:AAPL - Free Report) by 3.7% during the 4th quarter, according to its most recent 13F filing with the Securities and Exchange Commission. The institutional investor owned 94,470 shares of the iPhone maker's stoc
Sentiment: negative
5. Headline: Lake Street Private Wealth LLC Grows Stock Holdings in Apple Inc. $AAPL
Summary: Lake Street Private Wealth LLC lifted its stake in Apple Inc. (NASDAQ:AAPL - Free Report) by 13.5% in the fourth quarter, according to the company in its most recent disclosure with the Securities and Exchange Commission (SEC). The institutional investor owned 170,167 shares of the iPhone maker's
Sentiment: positive
6. Headline: Apple Inc. $AAPL is Cyndeo Wealth Partners LLC's 3rd Largest Position
Summary: Cyndeo Wealth Partners LLC increased its holdings in Apple Inc. (NASDAQ:AAPL - Free Report) by 2.8% during the 4th quarter, according to its most recent Form 13F filing with the SEC. The fund owned 209,696 shares of the iPhone maker's stock after purchasing an additional 5,674 shares during the per
Sentiment: positive
7. Headline: Apple expands American manufacturing program with four new partners
Summary: The expansion builds on Apple’s American Manufacturing Program, a cornerstone of the company’s $600 billion, four-year commitment to U.S. manufacturing and innovation. Initial AMP partners — including Amkor, Broadcom, Corning, GlobalFoundries, and Texas Instruments — are already hitting ...
Sentiment: positive
8. Headline: Henrickson Nauta Wealth Advisors Inc. Purchases 2,860 Shares of Apple Inc. $AAPL
Summary: Henrickson Nauta Wealth Advisors Inc. increased its position in shares of Apple Inc. (NASDAQ:AAPL - Free Report) by 57.8% in the fourth quarter, according to its most recent 13F filing with the Securities & Exchange Commission. The institutional investor owned 7,805 shares of the iPhone maker'
Sentiment: positive
9. Headline: Tealwood Asset Management Inc. Reduces Holdings in Apple Inc. $AAPL
Summary: Tealwood Asset Management Inc. decreased its position in shares of Apple Inc. (NASDAQ:AAPL - Free Report) by 27.6% in the 4th quarter, according to its most recent 13F filing with the SEC. The firm owned 9,833 shares of the iPhone maker's stock after selling 3,750 shares during the quarter. Apple m
Sentiment: negative
10. Headline: Introducing Apple Business — a new all-in-one platform for businesses of all sizes - Apple
Summary: Apple today announced Apple Business, a new all-in-one platform that includes key services companies need to effortlessly manage devices, reach more customers, equip team members with essential apps and tools, and get support from experts to run and grow efficiently and securely.
Sentiment: neutral
Powered by Brave
Recent Updates
News Summary
Recent news highlights Apple's historical innovation legacy and ongoing strategic initiatives. The 1979 Silicon Valley demo led by Steve Jobs is recognized as a foundational moment shaping Apple's trajectory. The company is preparing to introduce local advertising within Apple Maps and has launched Apple Business, a platform aimed at enterprise customers, enhancing device management and advertising capabilities. Development efforts continue on new AI-powered wearable devices, although some challenges have emerged with Siri upgrades. These developments collectively underscore Apple's commitment to innovation, market expansion, and adaptation to evolving technology trends.
News Sentiment
Sentiment across recent news is predominantly neutral to positive, reflecting cautious optimism about Apple's product innovation and strategic expansions. Positive institutional buying trends and new platform launches contrast with some technical development setbacks, resulting in a balanced market perception. The overall tone suggests steady confidence tempered by awareness of execution risks.
Analytical Overview
Analysis Summary
Valuation Metrics: Apple’s trailing P/E ratio of 31.51 and forward P/E of 26.71 are aligned with the consumer electronics industry average of 31.51, indicating valuation in line with sector expectations.
Growth Trajectory: The company shows a strong revenue growth rate of 15.7% year-over-year and positive quarterly earnings growth of 15.9%, supported by robust operating and free cash flow generation.
Financial Health: Apple maintains a total debt to equity ratio of 102.63%, with substantial cash reserves of approximately $66.9 billion, reflecting solid liquidity and manageable leverage levels.
Sector Challenges Opportunities: The consumer electronics sector faces rapid technological change and competitive pressures, while opportunities arise from expanding services and AI integration.
Market Positioning And Competitive Advantages: Apple’s premium brand, integrated ecosystem, and strong institutional ownership provide competitive advantages in a dynamic market environment.
Investment Conclusion
Supporting Factors: Robust revenue and earnings growth with strong cash flow generation.
Risk Factors: High price-to-book ratio indicating elevated valuation levels.
SWOT Analysis
Strengths
- Market leadership with a diversified product and services ecosystem.
- Strong brand recognition and customer loyalty worldwide.
- Robust financial performance with high profit margins.
- Substantial institutional ownership supporting strategic initiatives.
Weaknesses
- High valuation multiples relative to industry peers.
- Dependence on flagship products such as the iPhone for majority of revenue.
- Moderate current ratio below 1 indicating tight short-term liquidity.
- Challenges in timely AI product development and integration.
Opportunities
- Expansion of enterprise solutions through Apple Business platform.
- Growth potential in AI-powered wearable devices and services.
- Increasing manufacturing footprint in the United States.
- Rising demand for subscription-based digital content and cloud services.
Threats
- Intense competition in consumer electronics and technology sectors.
- Regulatory scrutiny and geopolitical risks impacting supply chains.
- Technological disruptions and rapid innovation cycles.
- Potential delays or setbacks in new product launches.
Company Description
Apple Inc. is a leading technology company renowned for designing, manufacturing, and marketing innovative hardware and software products for consumers and businesses worldwide. Its flagship product, the iPhone, accounts for the majority of sales, serving as the central hub of an expansive ecosystem that includes Mac computers, iPad tablets, Apple Watch wearables, and accessories like AirPods. Apple Inc. also offers a suite of services such as the App Store, Apple Music, iCloud, Apple TV+, and Apple Fitness+, providing digital content, cloud storage, and subscription-based platforms. Operating in the consumer electronics industry within the technology sector, the company employs approximately 166,000 people and maintains a broad global presence through online stores, retail outlets, and partnerships with carriers and resellers. With a substantial market capitalization reflecting its scale, Apple Inc. plays a pivotal role in shaping consumer technology trends, emphasizing seamless integration across devices and services to enhance user experience and productivity.