
Apple Inc (AAPL)
Stock Analysis Report
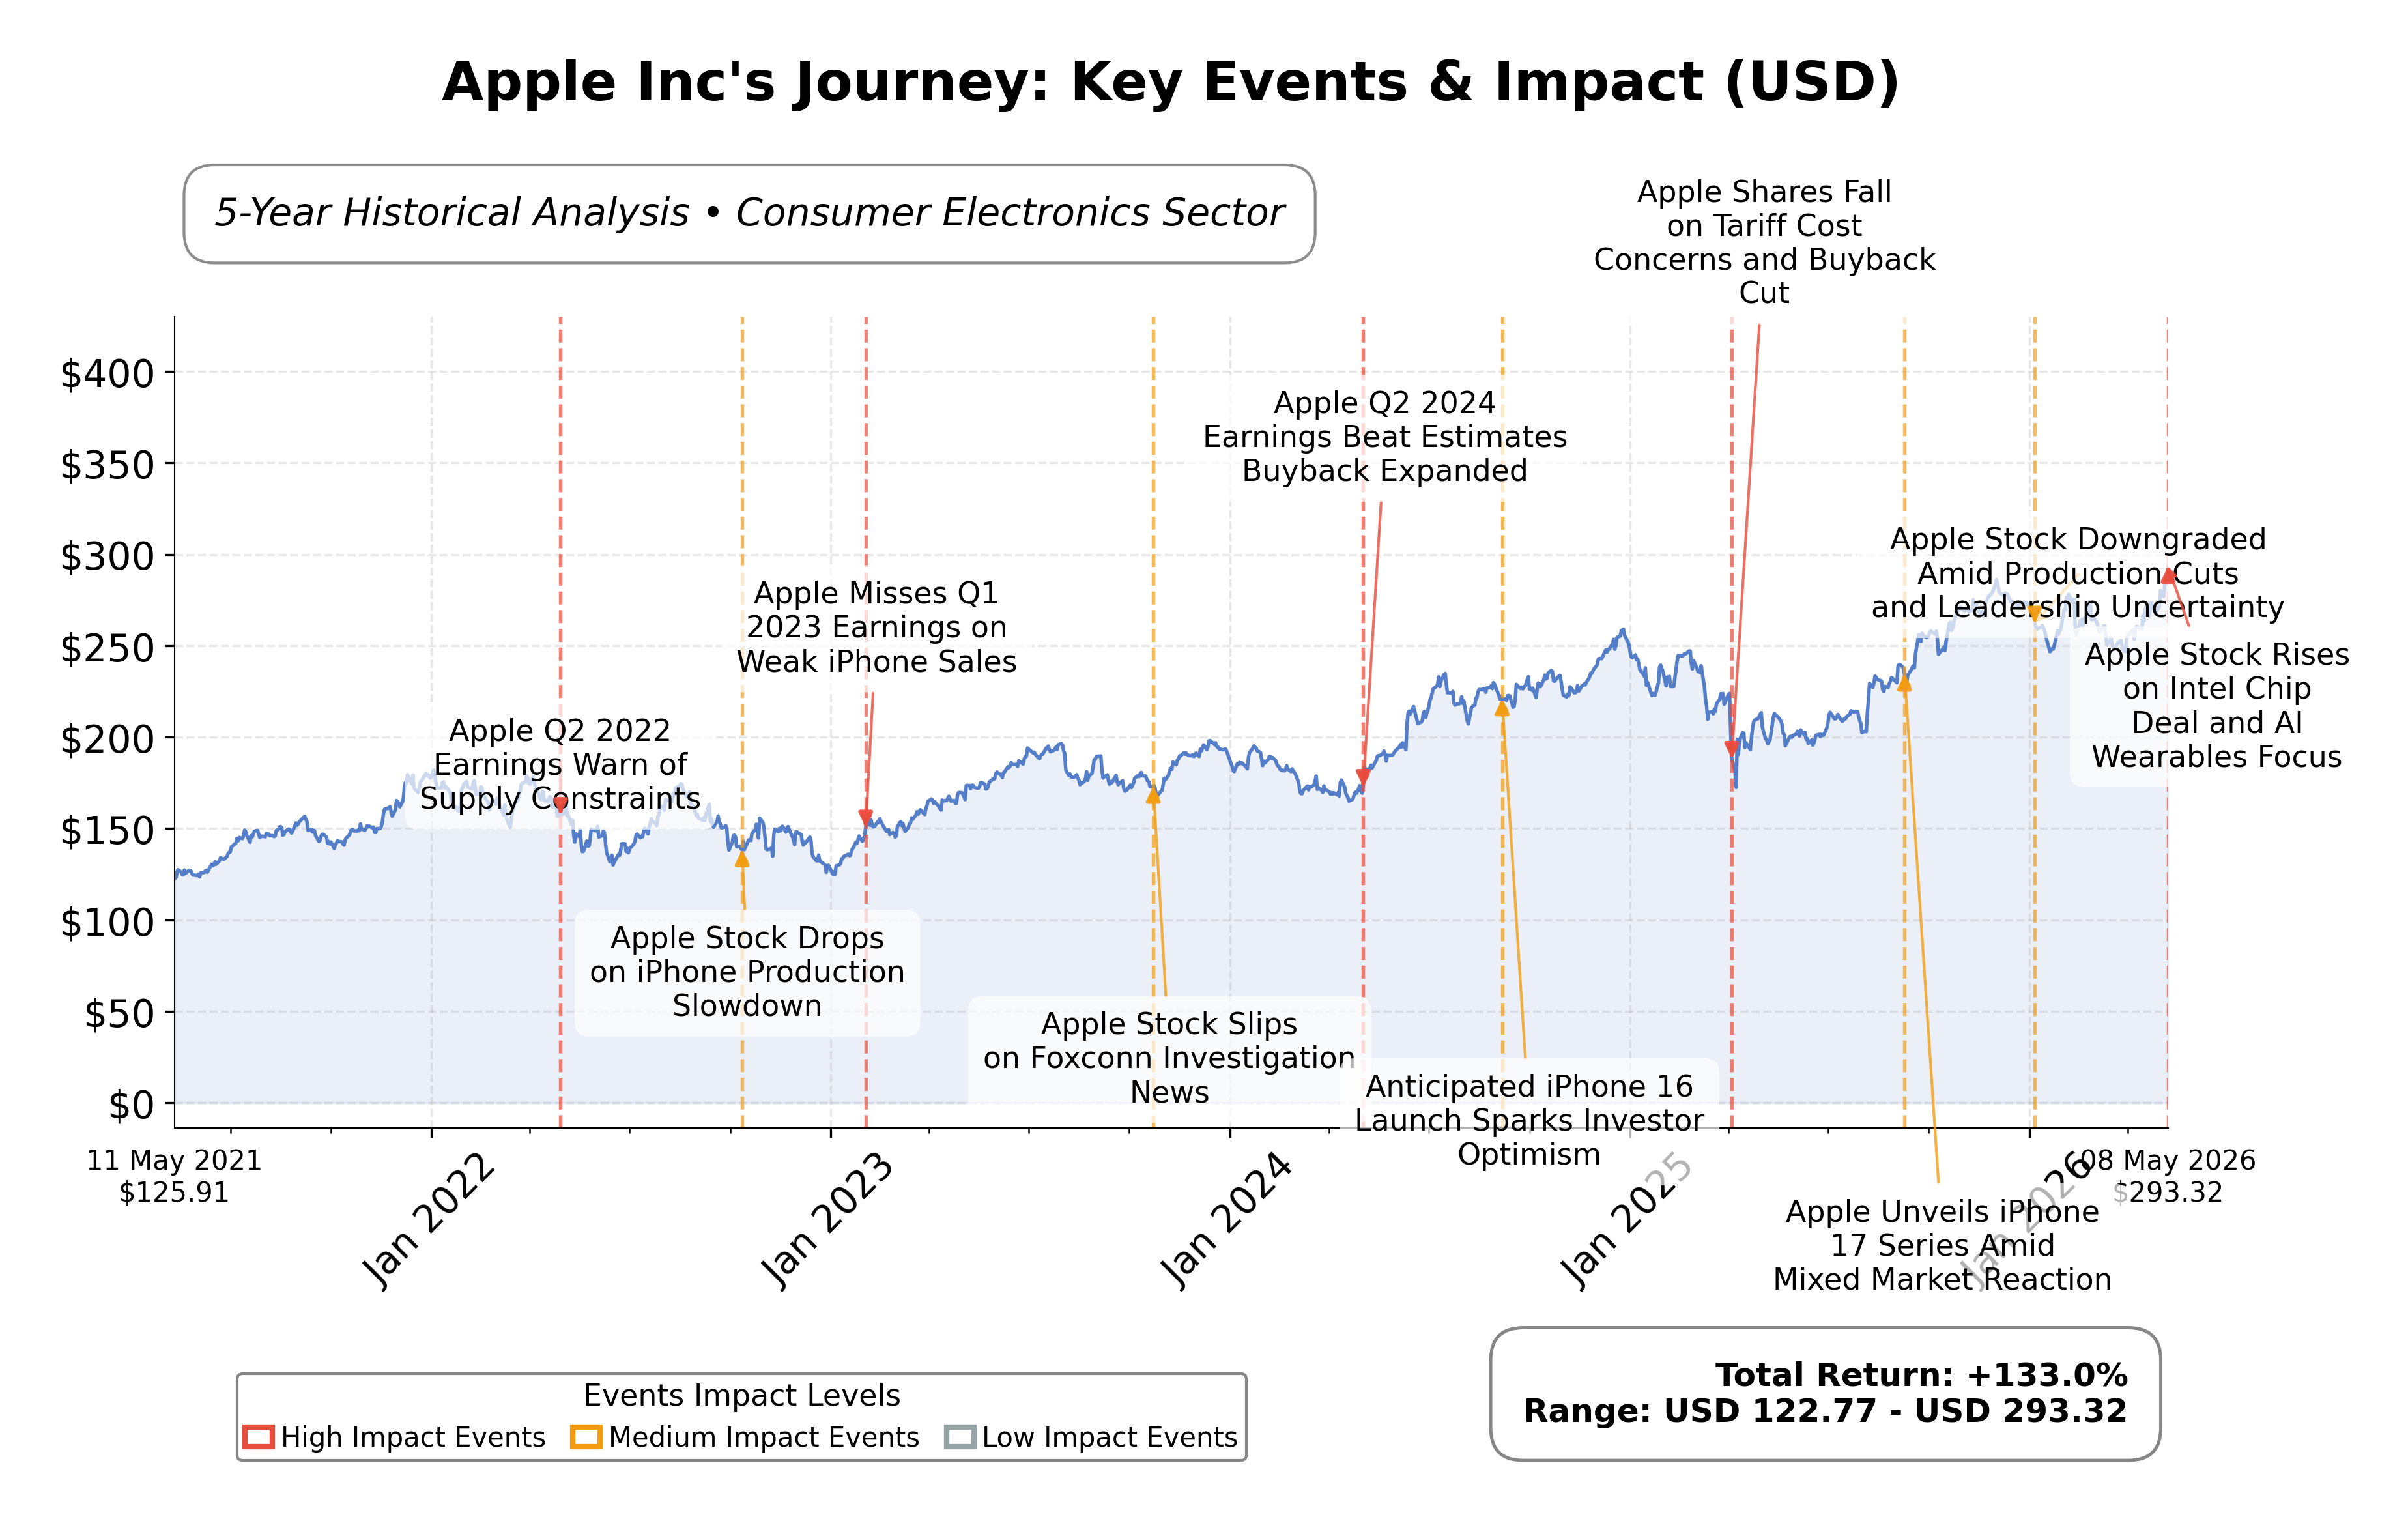
Stock Journey
Key Positives and Key Risks
Pros
- Strong revenue growth of 16.6% year-over-year demonstrates robust demand and market leadership.
- High operating cash flow of $140.2 billion and free cash flow of $101.1 billion indicate excellent cash generation capacity.
- Market capitalization of $4.31 trillion reflects significant scale and investor confidence.
Cons
- Elevated valuation multiples with a trailing P/E of 35.47 and P/B ratio of 40.40 may limit upside potential.
- Rising component costs, including memory, pose margin pressure risks.
- Total debt to equity ratio of 79.55% indicates moderate leverage that requires monitoring.
Disclosure: This information is for general awareness and does not constitute investment advice
Report Summary
Apple Inc. operates as a leading technology company primarily engaged in designing, manufacturing, and marketing consumer electronics and software products globally. Listed on NASDAQ under the technology sector, Apple’s flagship product, the iPhone, drives the majority of its revenue, supported by a broad ecosystem including Mac computers, iPads, wearables, and digital services such as the App Store and Apple Music. The company maintains a significant global presence through retail stores, online platforms, and partnerships, positioning itself as a dominant player in the consumer electronics industry.
Financially, Apple reported trailing twelve months (TTM) revenue of approximately $451.4 billion with a gross margin of 49.27%, operating margin of 32.28%, and net profit margin of 27.15%, reflecting strong profitability and operational efficiency. The company’s return on equity (ROE) stands at 141.47%, and return on assets (ROA) at 26.23%, indicating effective use of shareholder equity and assets to generate earnings. Operating cash flow for the TTM is $140.2 billion, with free cash flow of $101.1 billion, underscoring robust cash generation capabilities.
Apple’s valuation metrics show a trailing price-to-earnings (P/E) ratio of 35.47 and a forward P/E of 30.68, with a price-to-book (P/B) ratio of 40.40 and an enterprise value to EBITDA (EV/EBITDA) ratio of 27.03. The market capitalization is approximately $4.31 trillion, placing it among the largest global companies. The stock trades near its 52-week high of $294.76, currently priced at $292.59, indicating limited upside relative to recent highs.
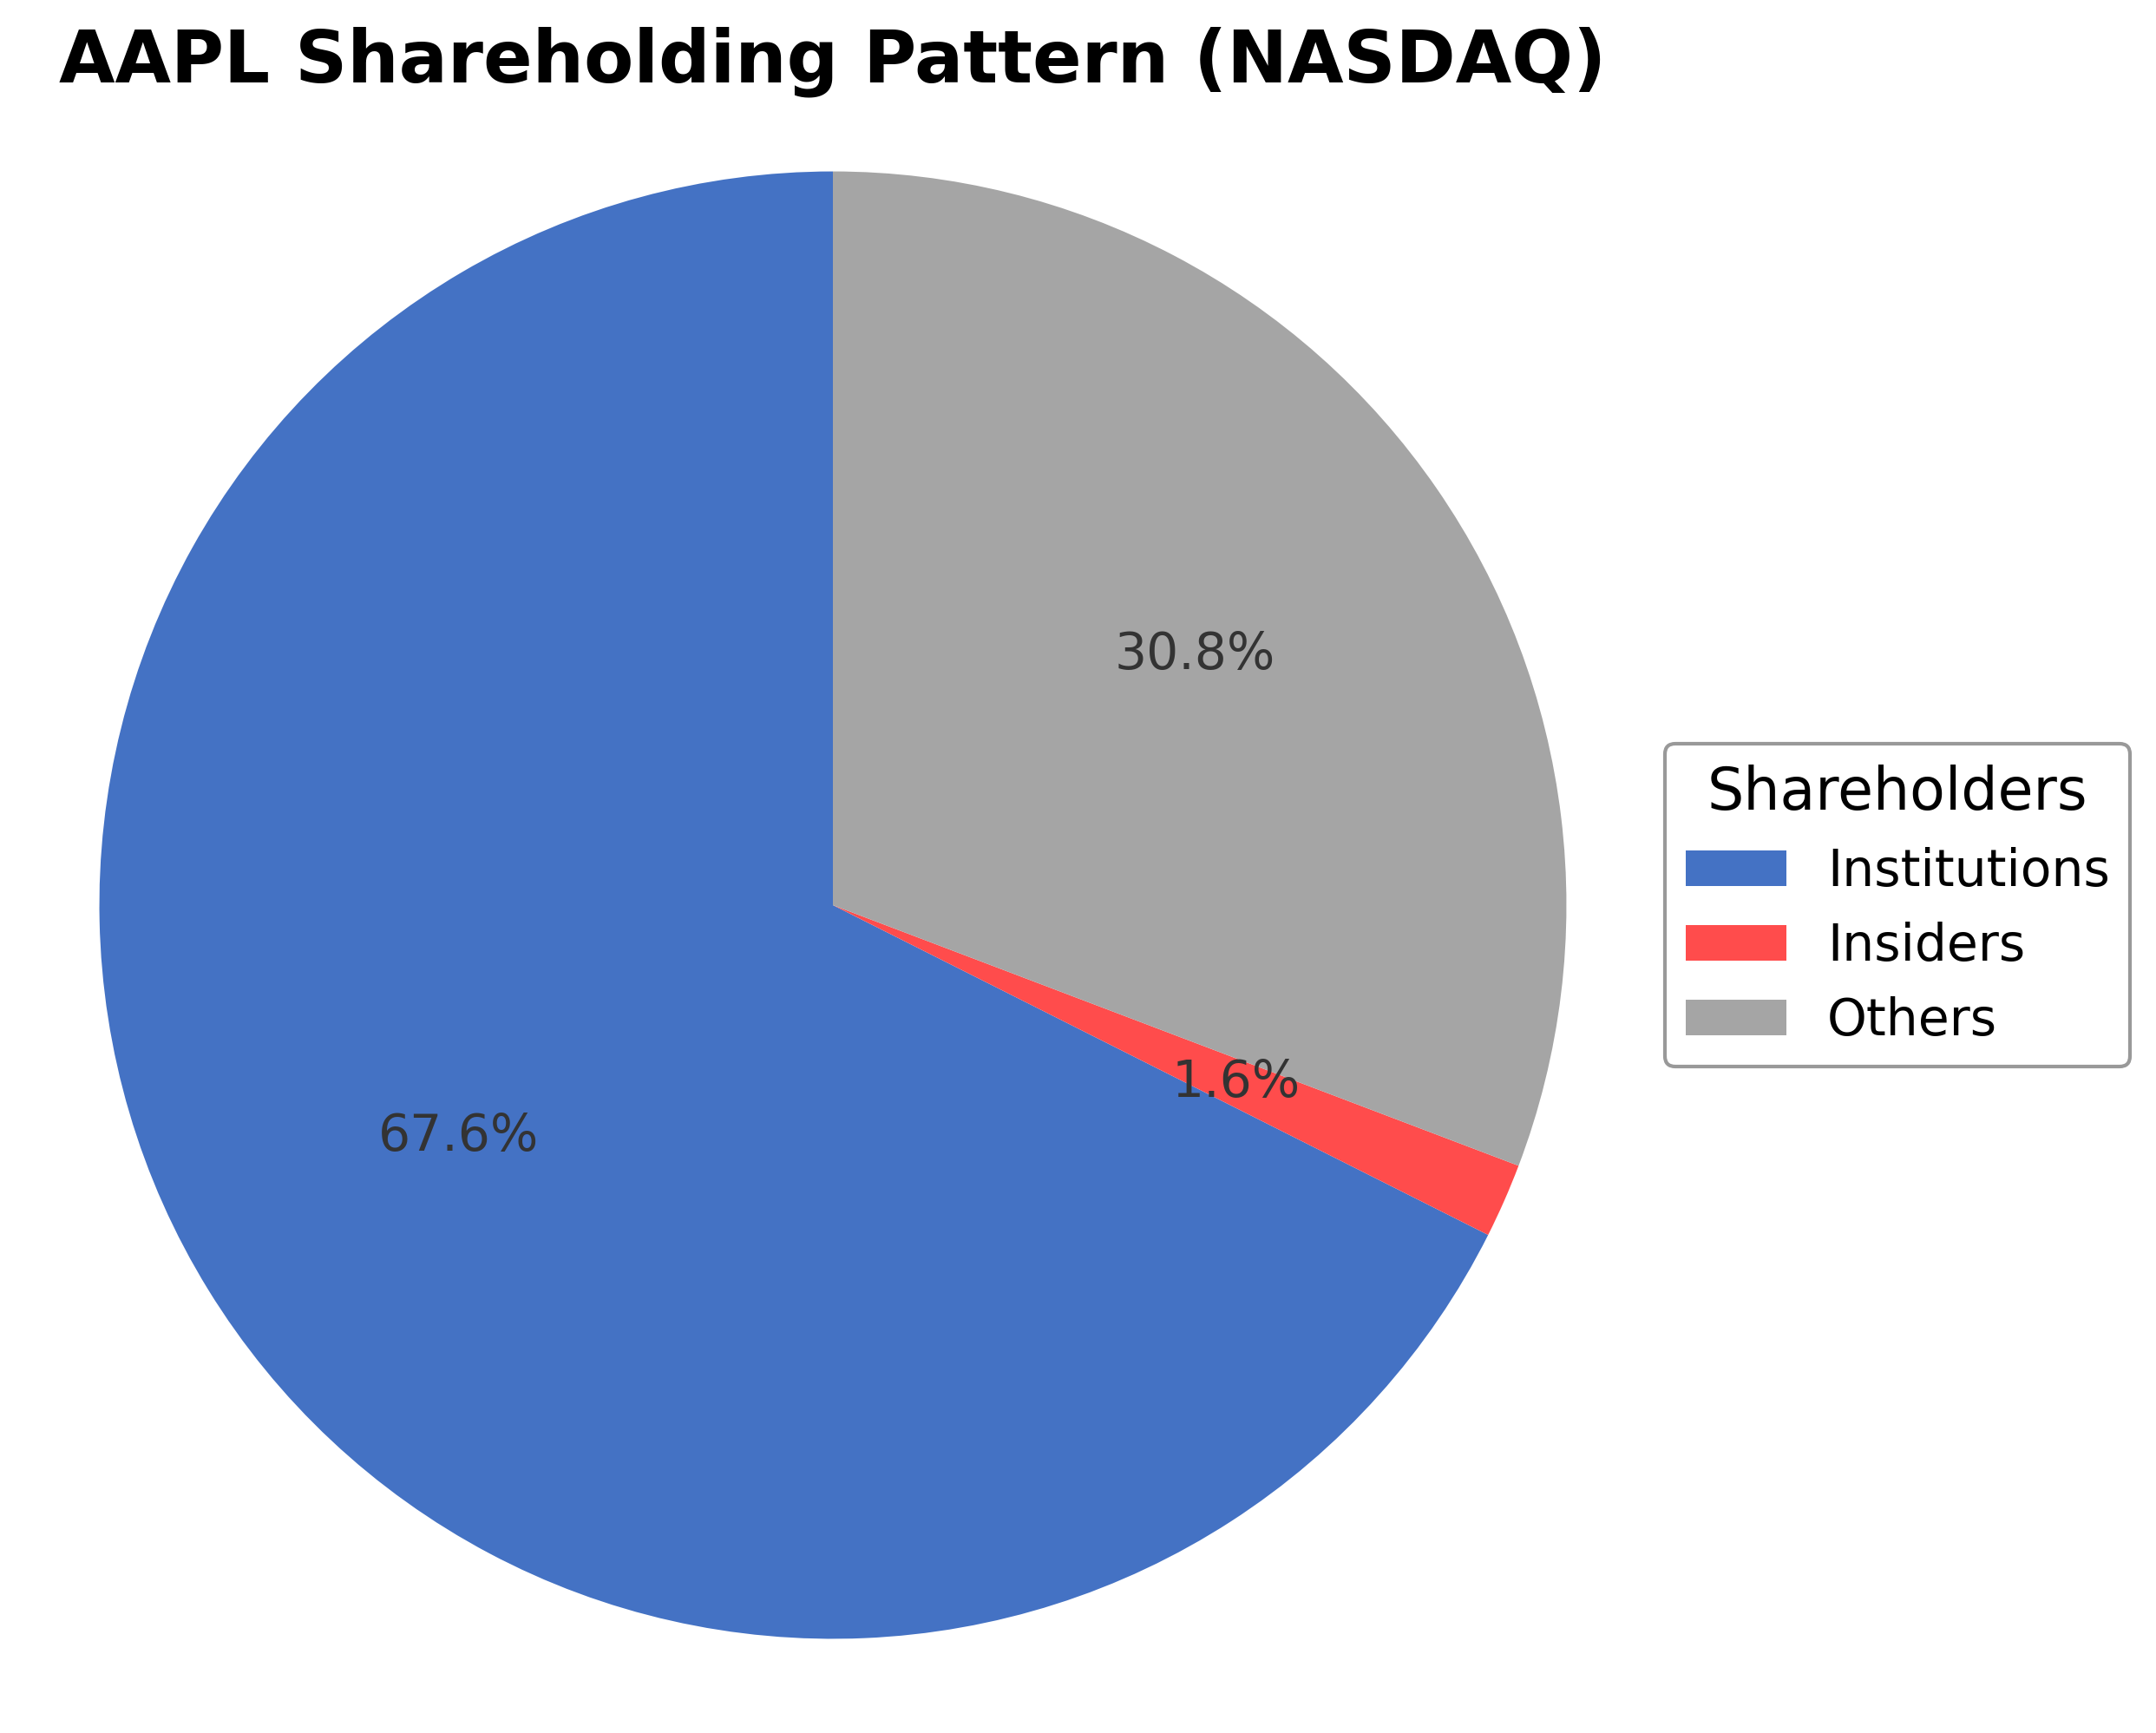
Key strengths include strong cash flow generation, a dominant market position with a diversified product ecosystem, and a substantial institutional ownership of 67.58%. Risks encompass regulatory scrutiny, competitive pressures in technology and chip supply, and margin headwinds from rising memory costs. Recent strategic developments include potential chip supply agreements with Intel and leadership guidance emphasizing product excellence.
Technically, Apple’s stock is in a sustained uptrend, trading above its 50-day and 200-day moving averages, with momentum indicators reflecting positive market sentiment. The stock’s price action near all-time highs suggests a mature phase with potential consolidation. Overall, market conditions appear balanced, warranting attentive observation of fundamental and technical signals for future directional cues.
Company and Industry Overview
Company Basics
Price Performance
Company Size
Shareholding Pattern
Sector and Industry Analysis
The global apple market is projected to grow by approximately USD 15.94 billion from 2024 to 2029, with a compound annual growth rate (CAGR) of 3.4%. The market encompasses various apple types, including red apples and Granny Smith and golden varieties, distributed through both offline and online channels. Key players include established vendors such as Auvil Fruit Co. Inc., Batlow Fruit Co. Pty Ltd, and Stemilt Growers LLC, among others, operating across major geographic regions including APAC, Europe, North America, and others.
Current industry trends highlight increasing consumer demand driven by health benefits and the popularity of superfoods, alongside the rise of urban farming and expansion of private-label brands. Competitive dynamics are shaped by factors such as pricing sensitivity, product differentiation, and distribution channel strategies. Barriers to entry remain moderate due to established vendor presence and the need for efficient supply chain management, while innovation in product varieties and marketing approaches continues to influence market positioning.
The regulatory environment affecting the apple market includes food safety standards and agricultural policies that vary by region, impacting production and distribution practices. Compliance with these regulations is critical for market participants to maintain product quality and consumer trust. Looking ahead, evolving regulations related to sustainability and trade may influence operational costs and market access, shaping the industry's growth trajectory through 2029.
Note: Analysis synthesized from industry research, market reports, and regulatory filings. Information is subject to change based on market conditions.
Financial Ratios Dashboard
Illustrative Scenario Analysis
DCF Assumptions:
Method: Two-Stage EPS-Priority Model
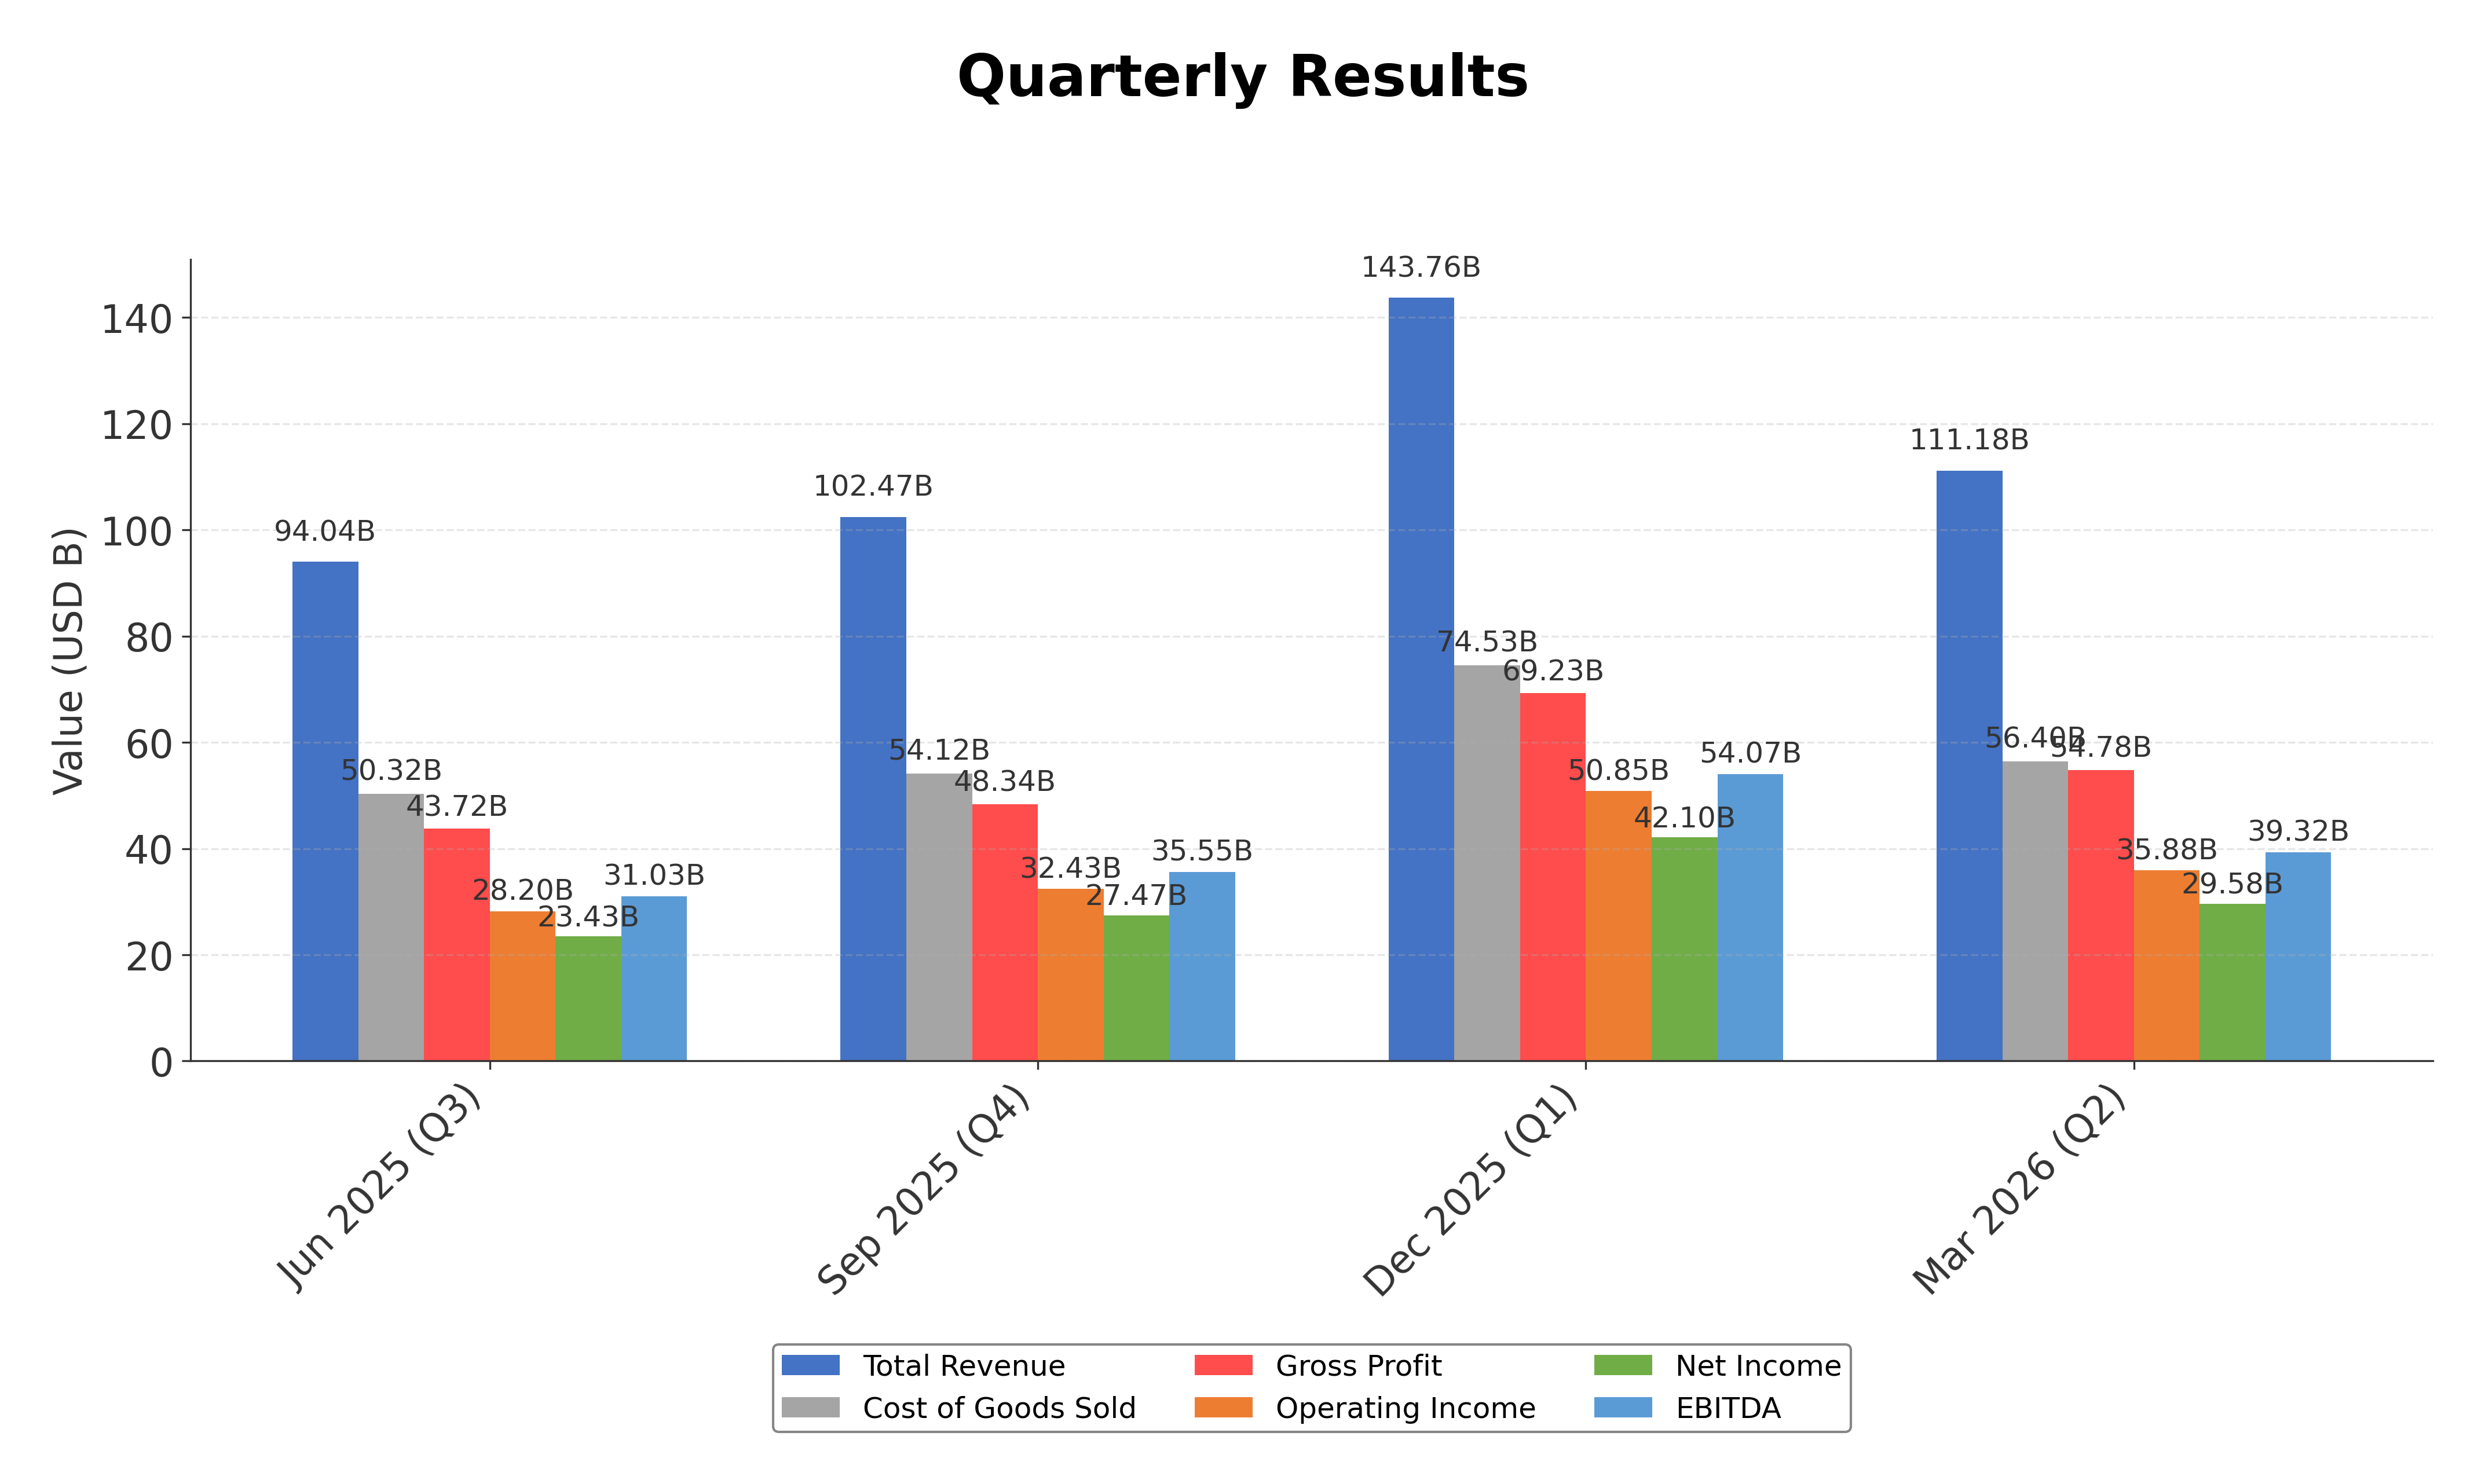
Financials
Peer Analysis
| Company Name | Market Cap | P/E Ratio | P/B Ratio | EV/EBITDA | Price to CFO |
|---|---|---|---|---|---|
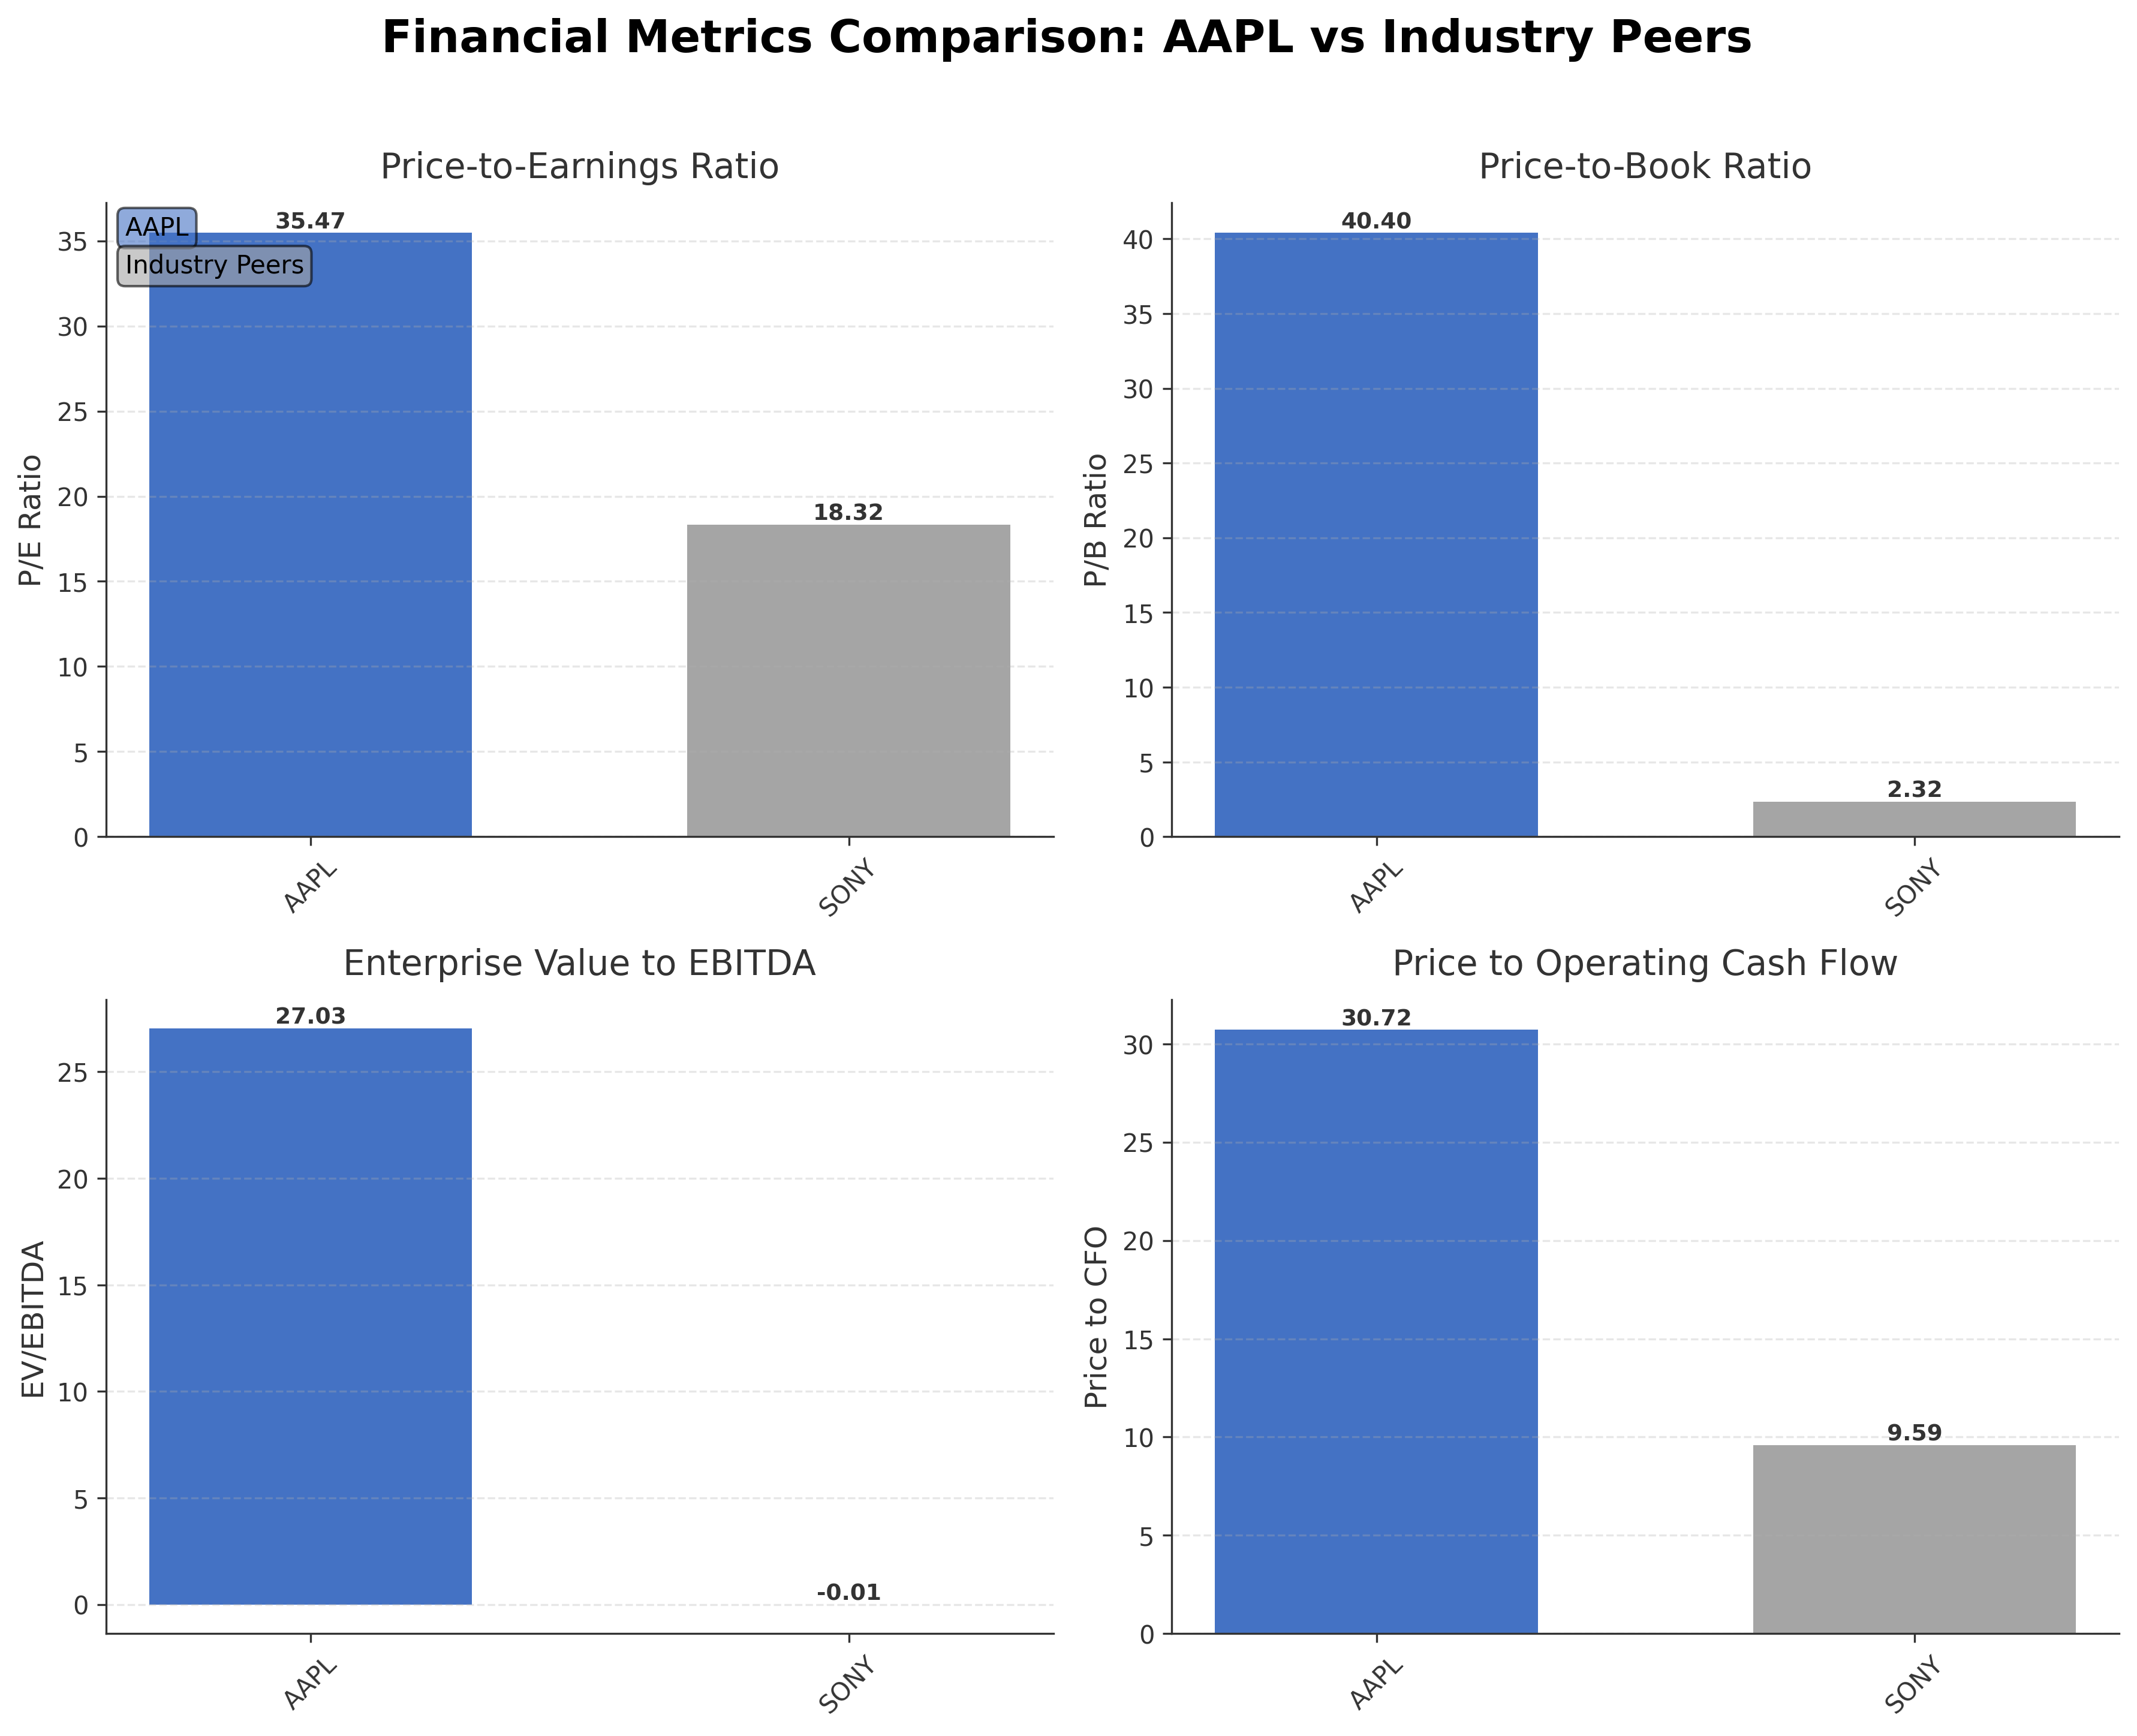
| Apple Inc | $4.31T | 35.47 | 40.40 | 27.03 | 30.72 |
| Sony Group Corporation - Sponsored American Depositary Receipt | $119.04B | 18.32 | 2.32 | -0.01 | 9.59 |
Comparison Analysis: Apple Inc. significantly surpasses its peer Sony Group Corporation in market capitalization, with a valuation exceeding $4 trillion compared to Sony's $119 billion. Apple's P/E ratio of 35.47 is nearly double Sony's 18.32, reflecting higher growth expectations or premium valuation. The price-to-book ratio for Apple is substantially elevated at 40.40 versus Sony's 2.32, indicating market confidence in Apple's intangible assets and brand strength. Enterprise value to EBITDA and price to cash flow ratios also highlight Apple's premium positioning. Return on equity for Apple at 1.41% is notably higher than Sony's 0.12%, underscoring superior profitability and capital efficiency within the technology sector.
Financial Metrics Comparison with Peers
Financial Statements
Comprehensive financial data including income, balance sheet, and cash flow metrics
Income Statement
| fiscal_date | 2025-09-30 | 2024-09-30 | 2023-09-30 | 2022-09-30 | 2021-09-30 |
|---|---|---|---|---|---|
| Sales | 416.16B | 391.04B | 383.29B | 394.33B | 365.82B |
| Cost Of Goods | 220.96B | 210.35B | 214.14B | 223.55B | 212.98B |
| Gross Profit | 195.20B | 180.68B | 169.15B | 170.78B | 152.84B |
| Operating Expense Research And Development | 34.55B | 31.37B | 29.91B | 26.25B | 21.91B |
| Operating Expense Selling General And Administrative | 27.60B | 26.10B | 24.93B | 25.09B | 21.97B |
| Operating Income | 133.05B | 123.22B | 114.30B | 119.44B | 108.95B |
| Other Income Expense | -321.00M | 269.00M | -565.00M | -334.00M | 60.00M |
| Pretax Income | 132.73B | 123.48B | 113.74B | 119.10B | 109.21B |
| Income Tax | 20.72B | 29.75B | 16.74B | 19.30B | 14.53B |
| Net Income | 112.01B | 93.74B | 97.00B | 99.80B | 94.68B |
| Eps Basic | 7.49 | 6.11 | 6.16 | 6.15 | 5.67 |
| Eps Diluted | 7.46 | 6.08 | 6.13 | 6.11 | 5.61 |
| Basic Shares Outstanding | 14.95B | 15.34B | 15.74B | 16.22B | 16.70B |
| Diluted Shares Outstanding | 14.95B | 15.34B | 15.74B | 16.22B | 16.70B |
| Ebit | 133.05B | 123.22B | 114.30B | 119.44B | 111.85B |
| Ebitda | 144.75B | 134.66B | 125.82B | 130.54B | 123.14B |
| Net Income Continuous Operations | 112.01B | 93.74B | 97.00B | 99.80B | 94.68B |
| Non Operating Interest Income | N/A | N/A | 3.75B | 2.83B | 2.84B |
| Non Operating Interest Expense | N/A | N/A | 3.93B | 2.93B | 2.65B |
Source: Financial statements and regulatory filings
Balance Sheet
| fiscal_date | 2025-09-30 | 2024-09-30 | 2023-09-30 | 2022-09-30 | 2021-09-30 |
|---|---|---|---|---|---|
| Cash And Cash Equivalents | 35.93B | 29.94B | 29.96B | 23.65B | 34.94B |
| Accounts Receivable | 39.78B | 33.41B | 29.51B | 28.18B | 26.28B |
| Total Assets | 359.24B | 364.98B | 352.58B | 352.75B | 351.00B |
| Total Liabilities | 285.51B | 308.03B | 290.44B | 302.08B | 287.91B |
| Long Term Debt | 78.33B | 85.75B | 95.28B | 109.71B | 119.38B |
| Shareholders Equity | 73.73B | 56.95B | 62.15B | 50.67B | 63.09B |
Source: Financial statements and regulatory filings
Cash Flow Statement
| fiscal_date | 2025-09-30 | 2024-09-30 | 2023-09-30 | 2022-09-30 | 2021-09-30 |
|---|---|---|---|---|---|
| Operating Activities Net Income | 112.01B | 93.74B | 97.00B | 99.80B | 94.68B |
| Operating Activities Depreciation | 11.70B | 11.45B | 11.52B | 11.10B | 11.28B |
| Operating Activities Stock Based Compensation | 12.86B | 11.69B | 10.83B | 9.04B | 7.91B |
| Operating Activities Other Non Cash Items | -89.00M | -2.27B | -2.23B | 1.01B | -4.92B |
| Operating Activities Accounts Receivable | -7.03B | -5.14B | -417.00M | -9.34B | -14.03B |
| Operating Activities Accounts Payable | 902.00M | 6.02B | -1.89B | 9.45B | 12.33B |
| Operating Activities Other Assets Liabilities | -18.87B | 2.77B | -4.27B | 1.57B | -1.53B |
| Operating Activities Operating Cash Flow | 111.48B | 118.25B | 110.54B | 123.52B | 100.94B |
| Investing Activities Capital Expenditures | -12.71B | -9.45B | -10.96B | -10.71B | -11.09B |
| Investing Activities Purchase Of Investments | -24.41B | -48.66B | -29.51B | -76.92B | -109.56B |
| Investing Activities Sale Of Investments | 53.80B | 62.35B | 45.51B | 67.36B | 106.48B |
| Investing Activities Other Investing Activity | -1.48B | -1.31B | -1.34B | -2.09B | -385.00M |
| Investing Activities Investing Cash Flow | 15.20B | 2.94B | 3.71B | -22.66B | -14.58B |
| Financing Activities Long Term Debt Issuance | 4.48B | 0.00 | 5.23B | 5.46B | 20.39B |
| Financing Activities Long Term Debt Payments | -10.93B | -9.96B | -11.15B | -9.54B | -8.75B |
| Financing Activities Short Term Debt Issuance | -2.03B | 3.96B | -3.98B | 3.96B | 1.02B |
| Financing Activities Common Stock Repurchase | -90.71B | -94.95B | -77.55B | -89.40B | -85.97B |
| Financing Activities Common Dividends | -15.42B | -15.23B | -15.03B | -14.84B | -14.47B |
| Financing Activities Other Financing Charges | -6.07B | -5.80B | -6.01B | -6.38B | -5.58B |
| Financing Activities Financing Cash Flow | -120.69B | -121.98B | -108.49B | -110.75B | -92.25B |
| End Cash Position | 35.93B | 29.94B | 30.74B | 24.98B | 35.93B |
| Income Tax Paid | 43.37B | 26.10B | 18.68B | 19.57B | 25.39B |
| Free Cash Flow | 98.77B | 108.81B | 99.58B | 111.44B | 92.95B |
| Interest Paid | N/A | N/A | 3.80B | 2.87B | 2.69B |
| Operating Activities Deferred Taxes | N/A | N/A | N/A | 895.00M | -4.77B |
| Investing Activities Net Acquisitions | N/A | N/A | N/A | -306.00M | -33.00M |
| Financing Activities Common Stock Issuance | N/A | N/A | N/A | N/A | 1.10B |
Source: Financial statements and regulatory filings
Technical Analysis
Key Insights
- Apple's stock is exhibiting a strong upward trend, maintaining price levels near its 52-week high with consistent higher highs and higher lows.
- Key support levels are identified around $260 and $250, while resistance is near the recent high of $295.
- The stock price is currently above the 10-day, 50-day (approximately $262.80), and 200-day (approximately $257.02) moving averages, indicating bullish momentum across short and long-term timeframes.
- Momentum indicators show the Relative Strength Index (RSI) in the upper range near 70, MACD is positive with a bullish crossover, and Stochastic oscillators reflect overbought conditions.
- Analysis across daily, weekly, and monthly charts confirms a sustained bullish trend, though monthly charts suggest potential consolidation after a strong rally.
- Current technical setup suggests scenarios of continued upward momentum if support levels hold, or a possible short-term pullback to key moving averages before resuming trend.
Trending News
1. Headline: Tim Cook Got His Share Of Advice From Steve Jobs On How To Be Successful At Apple, Now He's Asking John T - Benzinga
Summary: Apple CEO Tim Cook advises incoming CEO John Ternus to prioritize company's North Star and focus on making the best products.
Sentiment: neutral
2. Headline: Apple Stock Week Ahead: AAPL Rally Faces CPI, AI and Intel Chip Deal Test
Summary: Apple shares traded at $293.32 Monday, near record highs, valuing the company at $4.32 trillion. Investors are watching for U.S.
Sentiment: positive
3. Headline: Is Apple Stock Back in Style? | The Motley Fool
Summary: The iPhone maker's business is finally showing signs of life.
Sentiment: positive
4. Headline: 1 Reason You'll Regret Not Buying Apple Stock Now | The Motley Fool
Summary: If you haven't bought Apple stock yet, now's the time. Here's why. Image source: Apple. Apple reported 17% year-over-year sales growth in the 2026 fiscal second quarter (ended March 28), fueled by another quarter of incredible iPhone sales -- they were up 22% over last year in the quarter.
Sentiment: positive
5. Headline: XY Planning Network Inc. Raises Stock Holdings in Apple Inc. $AAPL
Summary: XY Planning Network Inc. raised its stake in Apple Inc. (NASDAQ:AAPL - Free Report) by 49.8% during the fourth quarter, according to the company in its most recent Form 13F filing with the Securities and Exchange Commission. The fund owned 25,550 shares of the iPhone maker's stock after acquiring a
Sentiment: positive
Recent Updates
News Summary
As of 2026-05-09. Apple reported a 17% year-over-year sales growth in its fiscal second quarter ending March 28, 2026, driven by a 22% increase in iPhone sales, underscoring strong product demand and market leadership. Additionally, reports suggest Apple is contemplating a strategic chip supply agreement with Intel, signaling a shift in its hardware sourcing strategy to incorporate advanced AI-capable chips. This potential partnership could enhance Apple's technological capabilities and support future product innovation. These developments reflect Apple's continued focus on growth through product excellence and strategic supply chain management.
News Sentiment
The overall sentiment from recent updates is predominantly positive, driven by strong quarterly sales growth and strategic initiatives such as the potential Intel chip deal. The sales growth highlights Apple's robust market position and operational effectiveness, while the chip deal indicates proactive adaptation to emerging technology trends. Neutral sentiment arises from the uncertainty surrounding the chip agreement's finalization and its long-term impact. Collectively, these factors suggest a constructive business outlook supported by solid fundamentals and strategic foresight.
Source List
Analytical Overview
Analysis Summary
Apple’s valuation metrics, including a trailing P/E of 35.47 and forward P/E of 30.68, are elevated relative to the consumer electronics industry average P/E of 35.47, reflecting market expectations for sustained growth and premium brand positioning. The company’s revenue growth rate of 16.6% year-over-year and strong operating cash flow trends demonstrate a positive growth trajectory supported by robust product demand and service expansion. Financial health is solid, with a total debt to equity ratio of 79.55% balanced by substantial cash reserves of approximately $68.5 billion and strong free cash flow generation exceeding $101 billion, indicating effective leverage management and liquidity. Sector-specific opportunities include AI integration and expanding services, while challenges involve regulatory scrutiny and competitive pressures in chip supply and memory costs. Market positioning and competitive advantages are reinforced by Apple’s extensive ecosystem, brand loyalty, and innovation leadership.
Overall Business and Market Assessment
Supporting Factors: No data
Risk Factors: Apple’s investment appeal is supported by its dominant market position, consistent revenue growth, and strong cash flow generation, which underpin financial stability and capacity for innovation. Key risks to monitor include regulatory developments, supply chain dependencies, and margin pressures from rising component costs. A medium to long-term investment horizon is appropriate to capture potential benefits from strategic initiatives and market trends. Overall, the company presents a balanced risk-reward profile aligned with its premium valuation and growth prospects.
SWOT Analysis
Strengths
- Market leadership with a diversified and integrated product ecosystem.
- Strong profitability with high gross and net margins.
- Robust cash flow generation supporting innovation and shareholder returns.
- Extensive global brand recognition and loyal customer base.
Weaknesses
- High valuation multiples relative to industry peers.
- Significant dependence on iPhone sales for revenue.
- Rising costs of memory and components impacting margins.
- Moderate debt levels with a total debt to equity ratio near 80%.
Opportunities
- Expansion of AI capabilities through strategic chip partnerships.
- Growth in services and subscription-based revenue streams.
- Increasing adoption of wearables and accessories.
- Potential market share gains in emerging markets.
Threats
- Regulatory scrutiny and geopolitical tensions affecting operations.
- Intense competition in consumer electronics and technology sectors.
- Supply chain disruptions impacting product availability.
- Technological obsolescence and rapid innovation cycles.
Company Description
Apple Inc. is a leading technology company renowned for designing, manufacturing, and marketing innovative hardware and software products for consumers and businesses worldwide. Its flagship product, the iPhone, accounts for the majority of sales, serving as the central hub of an expansive ecosystem that includes Mac computers, iPad tablets, Apple Watch wearables, and accessories like AirPods. Apple Inc. also offers a suite of services such as the App Store, Apple Music, iCloud, Apple TV+, and Apple Fitness+, providing digital content, cloud storage, and subscription-based platforms. Operating in the consumer electronics industry within the technology sector, the company employs approximately 166,000 people and maintains a broad global presence through online stores, retail outlets, and partnerships with carriers and resellers. With a substantial market capitalization reflecting its scale, Apple Inc. plays a pivotal role in shaping consumer technology trends, emphasizing seamless integration across devices and services to enhance user experience and productivity.