
Apple Inc (AAPL)
Stock Analysis Report
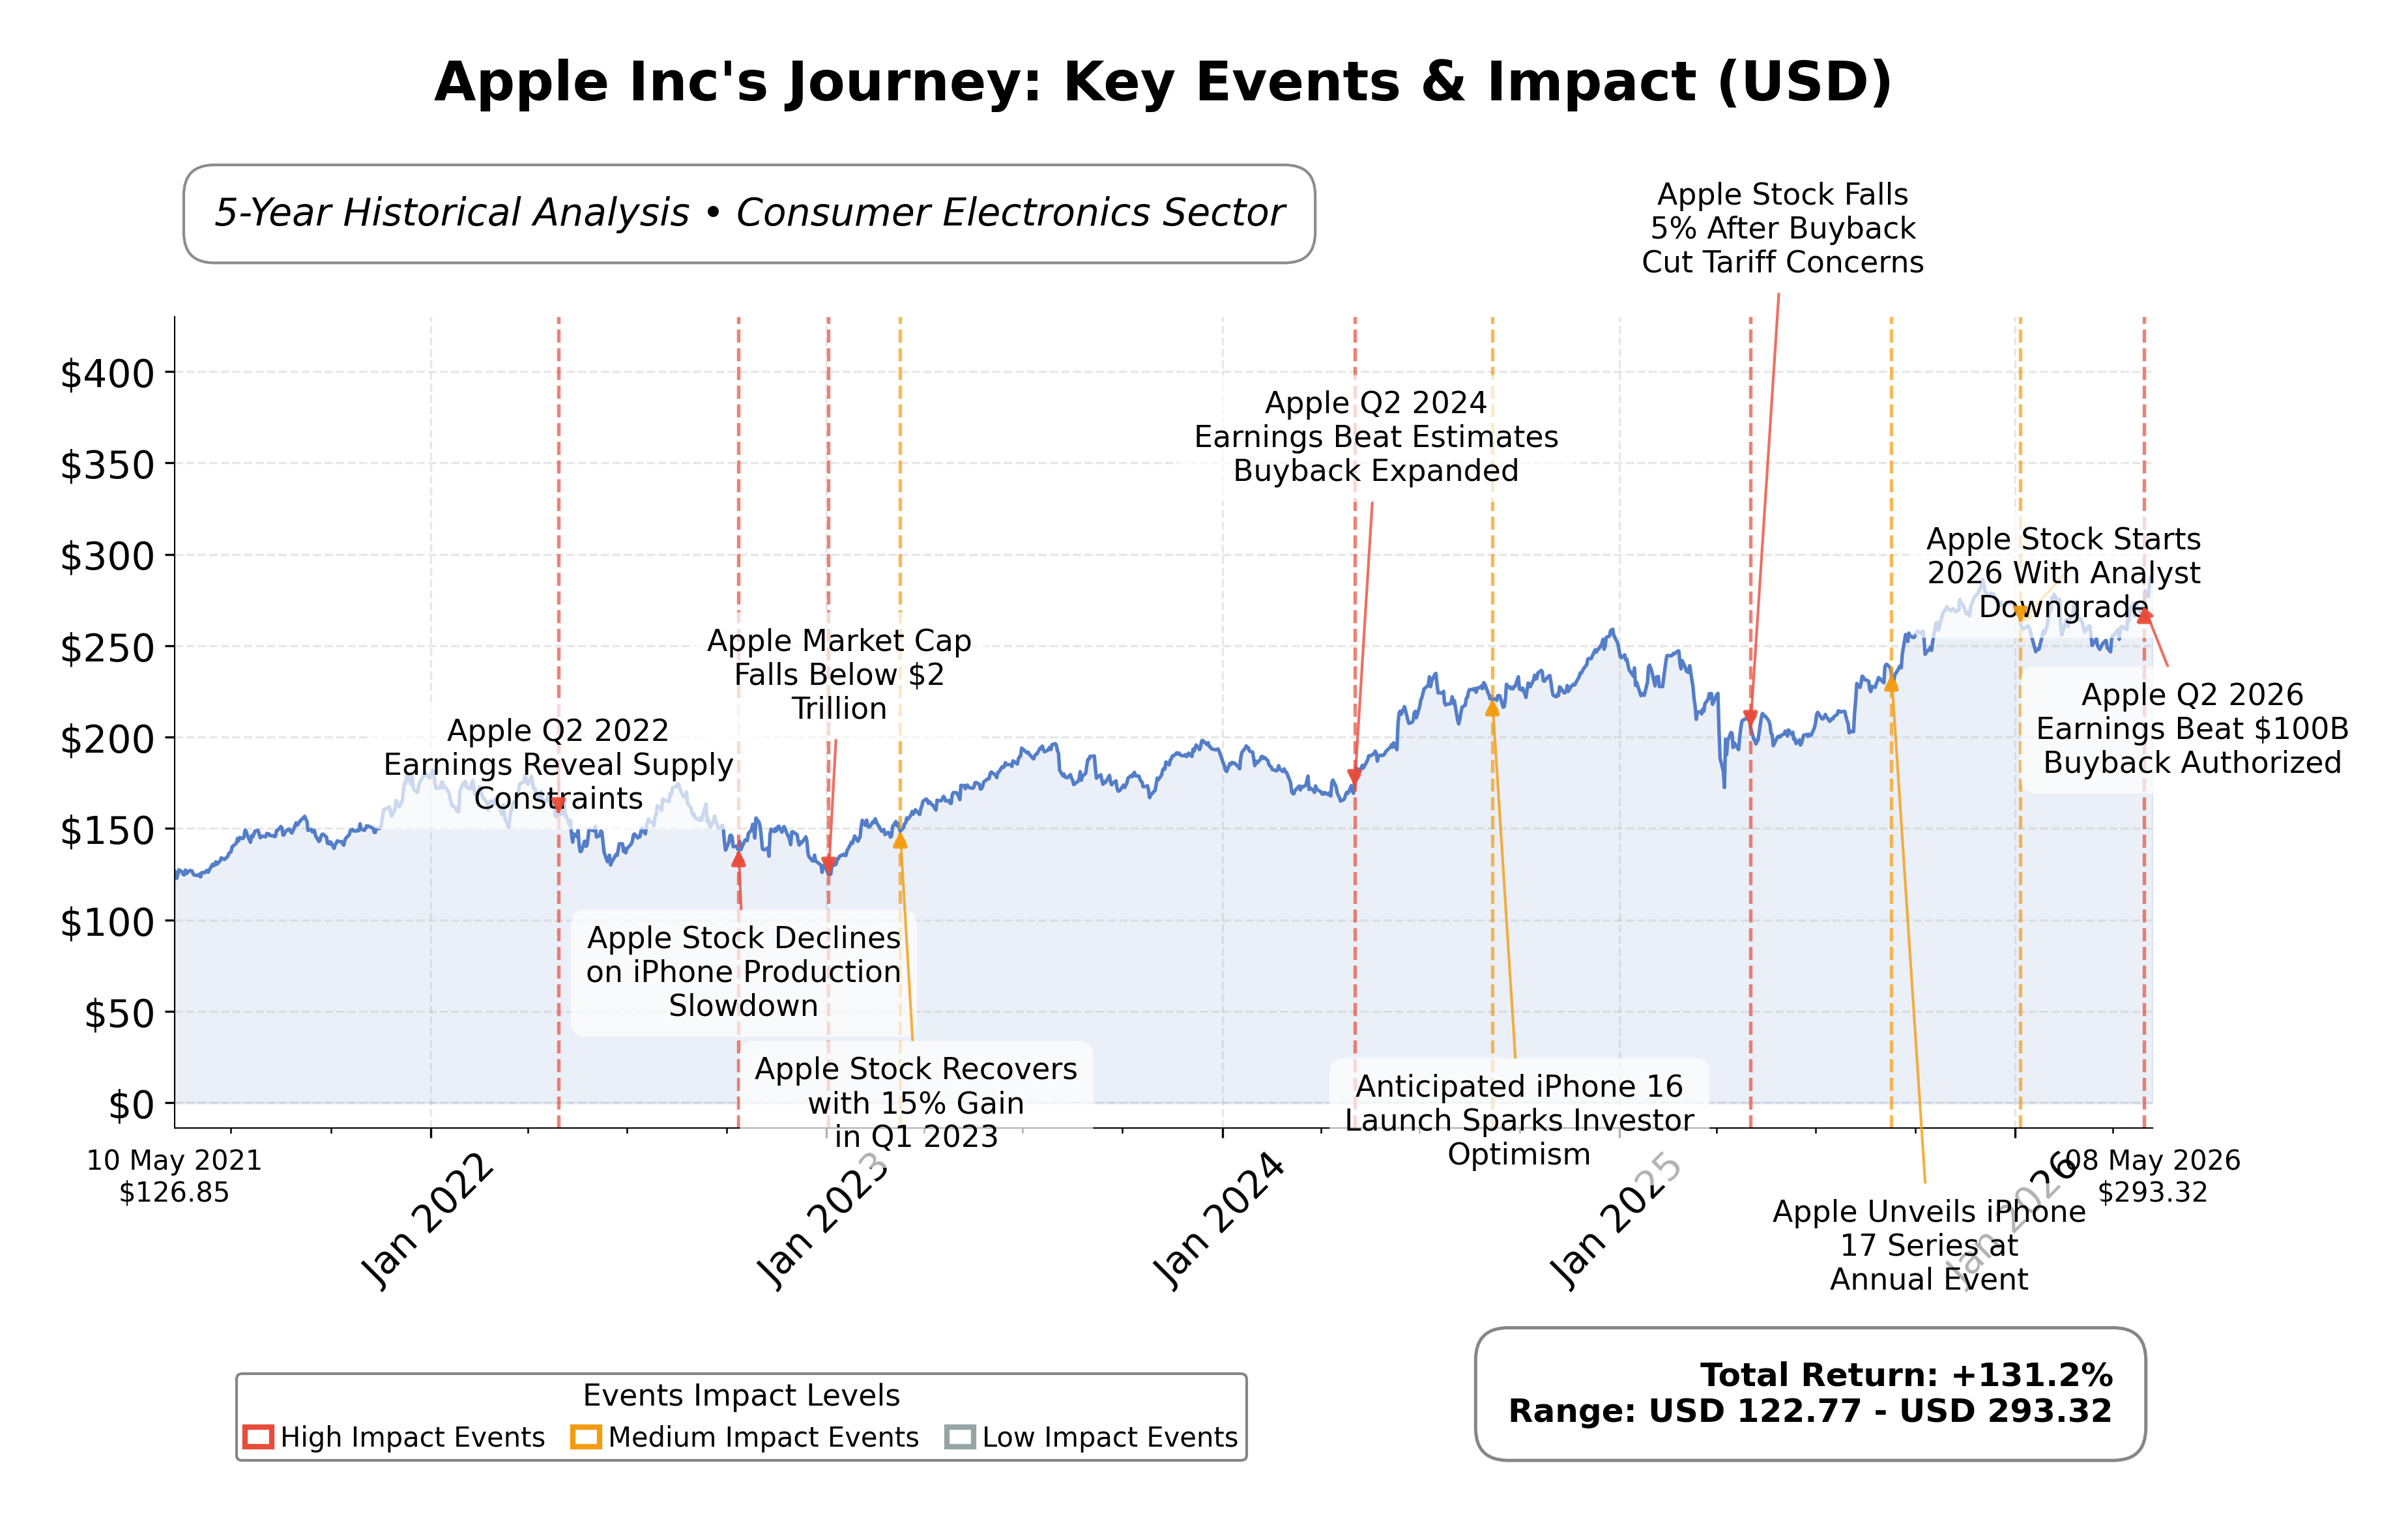
Stock Journey
Key Positives and Key Risks
Pros
- Revenue growth of 16.6% year-over-year demonstrates strong demand and market expansion.
- Free cash flow of $101.1 billion supports financial flexibility and shareholder returns.
- Wide economic moat and integrated ecosystem provide competitive advantages and customer retention.
Cons
- High trailing P/E ratio of 35.47 indicates premium valuation with limited margin for error.
- Rising memory costs pose a risk to profit margins and operating efficiency.
- Total debt to equity ratio of 79.55% reflects elevated leverage compared to industry norms.
Disclosure: This information is for general awareness and does not constitute investment advice
Report Summary
Apple Inc. is a leading technology company listed on the NASDAQ exchange under the symbol AAPL, operating within the technology sector and specializing in consumer electronics. The company designs, manufactures, and markets a broad range of hardware products including the iPhone, iPad, Mac computers, Apple Watch, and accessories such as AirPods. Additionally, Apple offers a suite of digital services like the App Store, Apple Music, iCloud, and Apple TV+, creating a vertically integrated ecosystem that enhances customer engagement and loyalty. With a global presence and a workforce of approximately 166,000 employees, Apple maintains a dominant market position driven by innovation and premium product offerings.
Financially, Apple reported trailing twelve-month revenue of approximately $451.4 billion, with a gross margin of 49.3%, operating margin of 32.3%, and a net profit margin of 27.2%, reflecting strong profitability and operational efficiency. The company’s return on equity (ROE) stands at 141.47%, and return on assets (ROA) at 26.23%, indicating effective use of shareholder capital and assets to generate earnings. Its return on invested capital (ROIC) is robust, supported by operating cash flow of $140.2 billion and free cash flow of $101.1 billion, underscoring Apple’s strong cash generation capabilities.
Apple’s valuation metrics show a trailing price-to-earnings (P/E) ratio of 35.47 and a forward P/E of 30.68, with a price-to-book (P/B) ratio of 40.40 and an enterprise value to EBITDA (EV/EBITDA) multiple of 27.03. The company’s market capitalization is approximately $4.31 trillion, positioning it among the largest global technology firms. The stock trades near its 52-week high of $294.76, currently priced at $293.28, reflecting a 52-week price appreciation of 28.14%, which suggests strong market confidence but also a premium valuation relative to fundamentals.
Apple’s key strengths include its substantial cash reserves of $68.5 billion, manageable total debt of $84.7 billion, and a current ratio of 1.07, indicating liquidity adequacy. The company benefits from market leadership in smartphones and services, a wide economic moat, and a loyal customer base. Risks include regulatory scrutiny, competitive pressures in technology and semiconductor supply chains, and margin compression from rising memory costs. Recent strategic developments include a preliminary chip manufacturing deal with Intel and continued expansion of AI capabilities, which may influence future growth trajectories.
Technically, Apple’s stock is in an uptrend, trading above its 50-day and 200-day moving averages, with momentum indicators such as RSI and MACD reflecting positive momentum across daily and weekly timeframes. The stock faces resistance near its 52-week high and support around the $260 level. Recent news highlights strong quarterly earnings and analyst optimism, balanced by some caution regarding valuation and cost pressures. Overall, the data suggests a market environment where accumulation and monitoring of developments are prudent, given the balance of growth prospects and valuation considerations.
Company and Industry Overview
Company Basics
Price Performance
Company Size
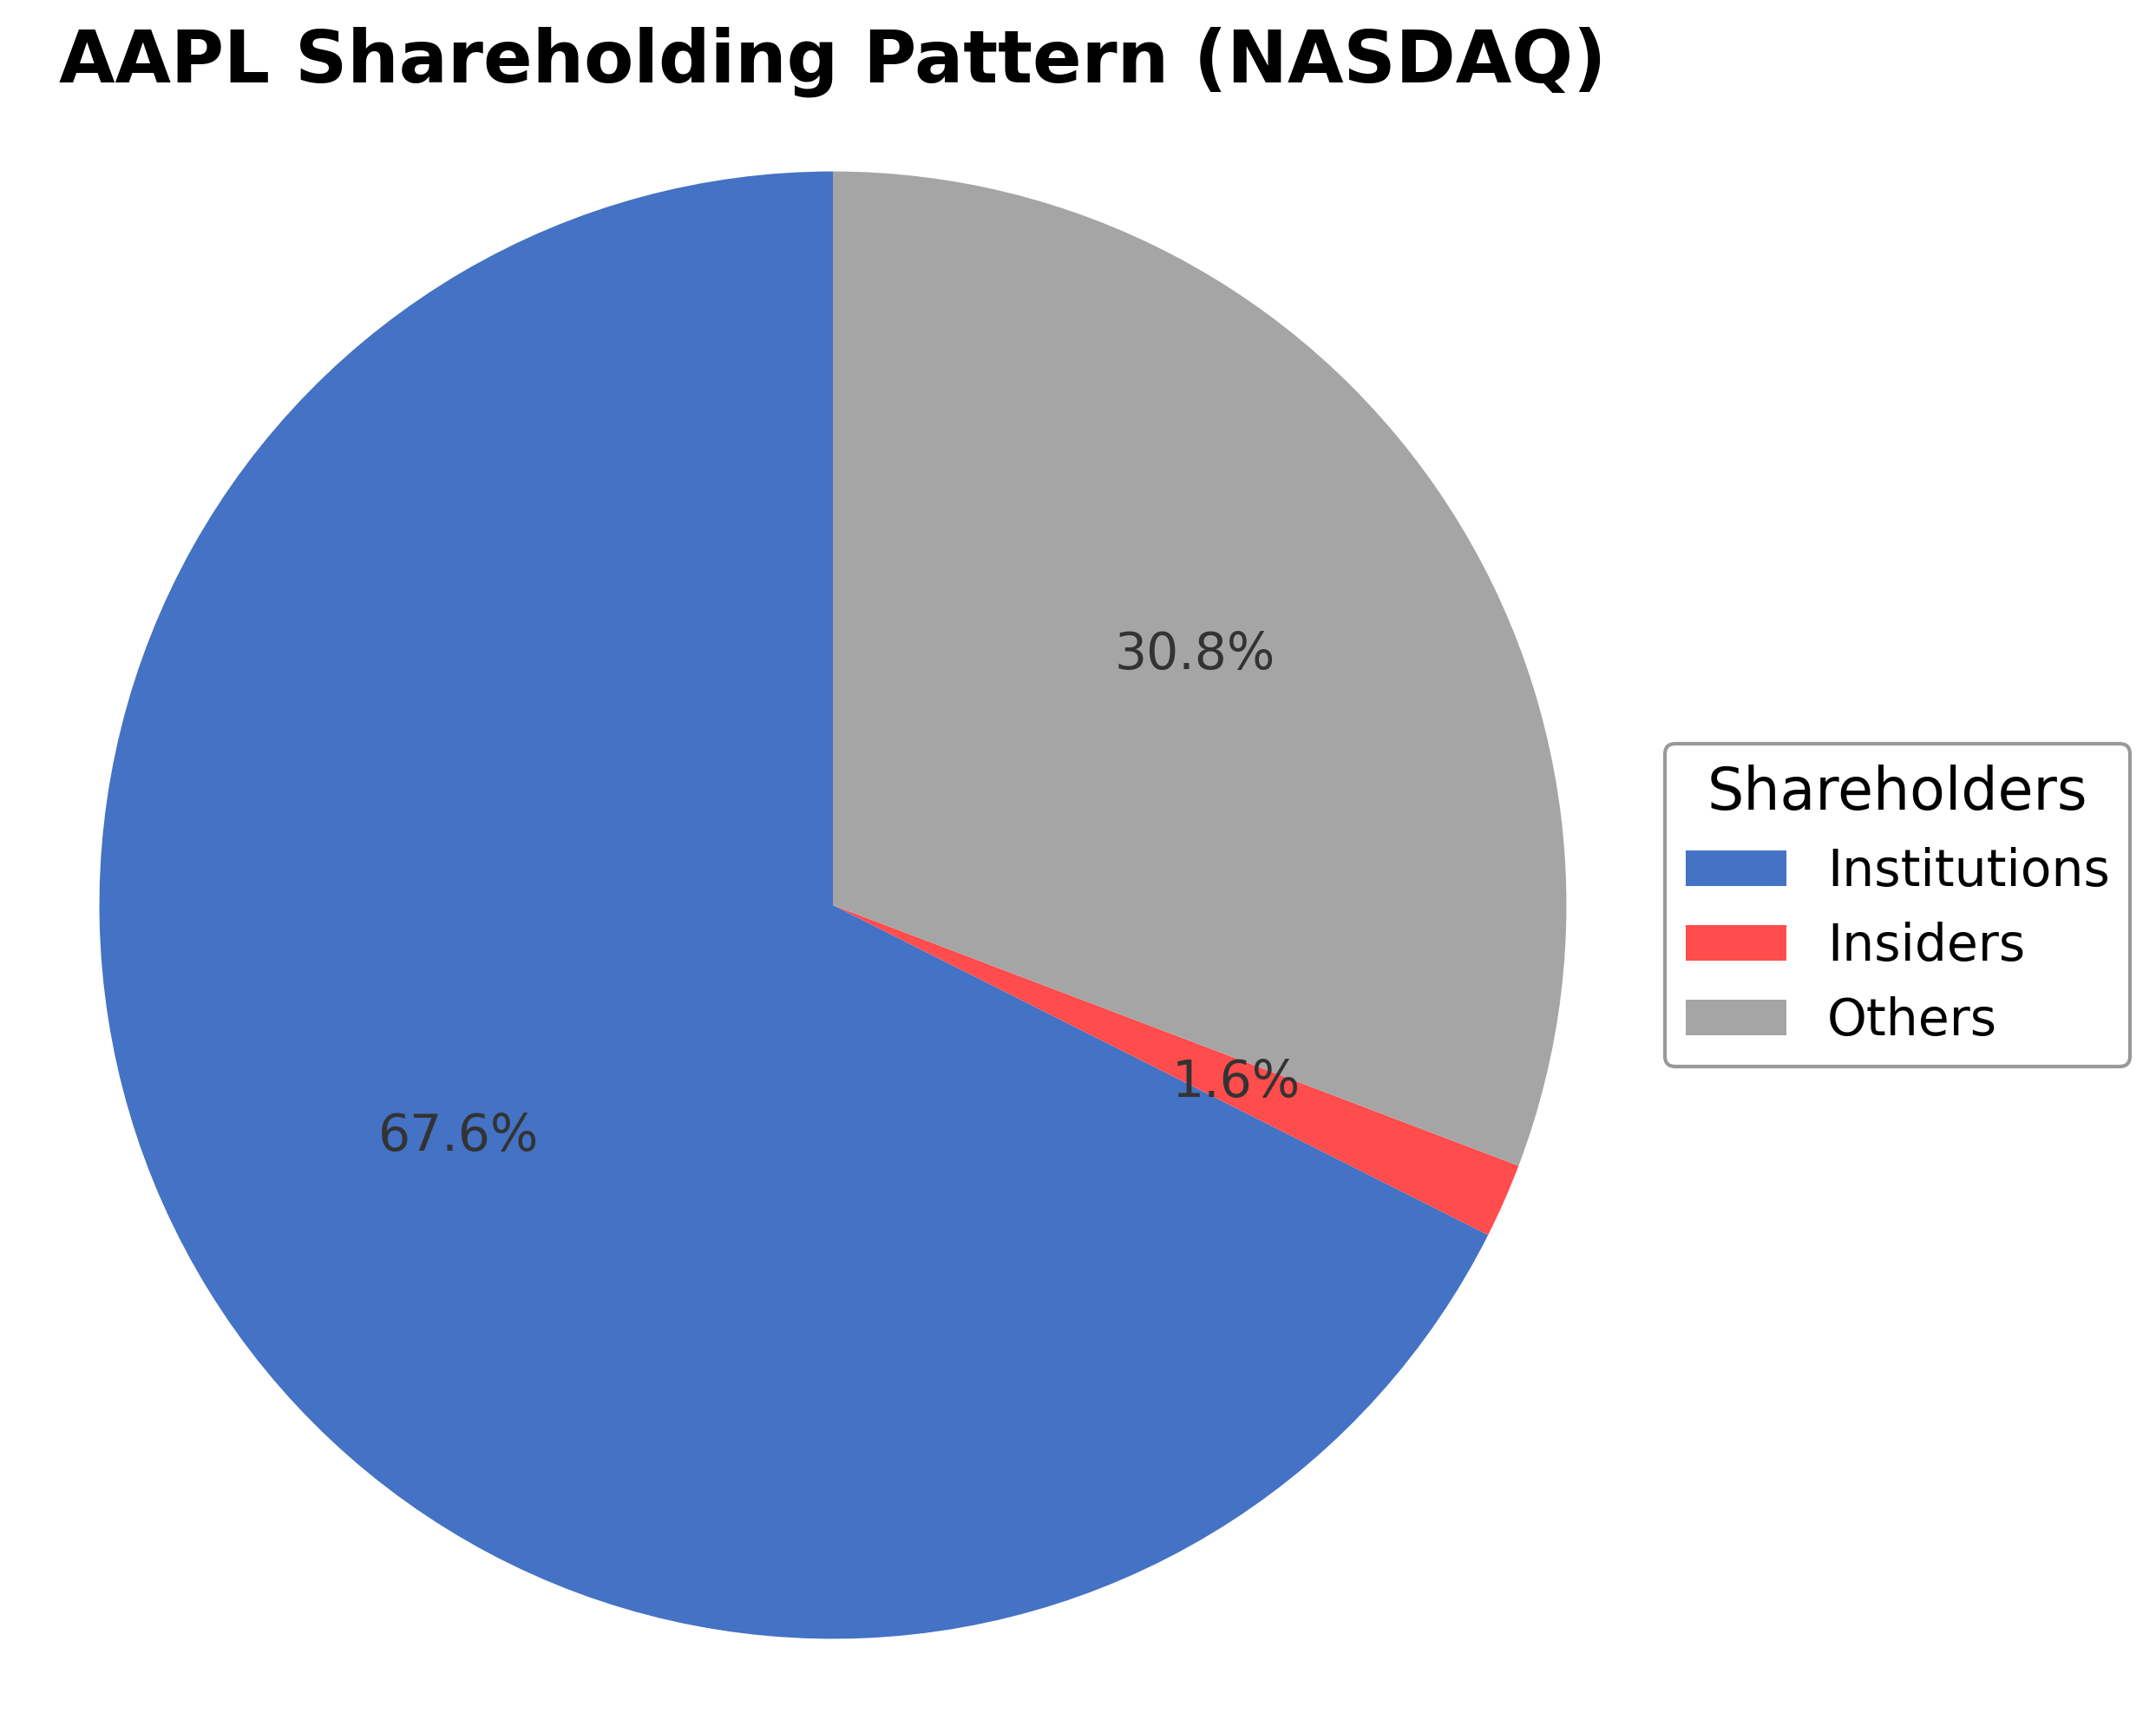
Shareholding Pattern
Sector and Industry Analysis
The global apple market is projected to grow by approximately USD 15.94 billion between 2024 and 2029, with a compound annual growth rate (CAGR) of 3.4%. This growth is supported by increasing consumer demand driven by health benefits and the introduction of new apple varieties. The market comprises around 25 key vendors, including notable players such as Auvil Fruit Co. Inc., Batlow Fruit Co. Pty Ltd, and Stemilt Growers LLC, which collectively shape the competitive landscape.
Industry trends highlight the rising popularity of urban farming and the expansion of retail sectors as significant growth drivers. Private-label brands are increasingly offering apples, intensifying competition among vendors. Barriers to entry remain moderate due to established supply chains and the need for scale in production and distribution, while differentiation is achieved through product variety and distribution channels, both offline and online.
Regulatory factors impacting the apple market primarily involve food safety standards and import-export regulations across different regions. Compliance with these regulations ensures quality control and market access but can also increase operational costs for producers and distributors. The regulatory environment is expected to remain stable, supporting steady market growth while encouraging innovation in product offerings and supply chain practices.
Note: Analysis synthesized from industry research, market reports, and regulatory filings. Information is subject to change based on market conditions.
Financial Ratios Dashboard
Illustrative Scenario Analysis
DCF Assumptions:
Method: Two-Stage EPS-Priority Model
Financials
Peer Analysis
| Company Name | Market Cap | P/E Ratio | P/B Ratio | EV/EBITDA | Price to CFO |
|---|---|---|---|---|---|
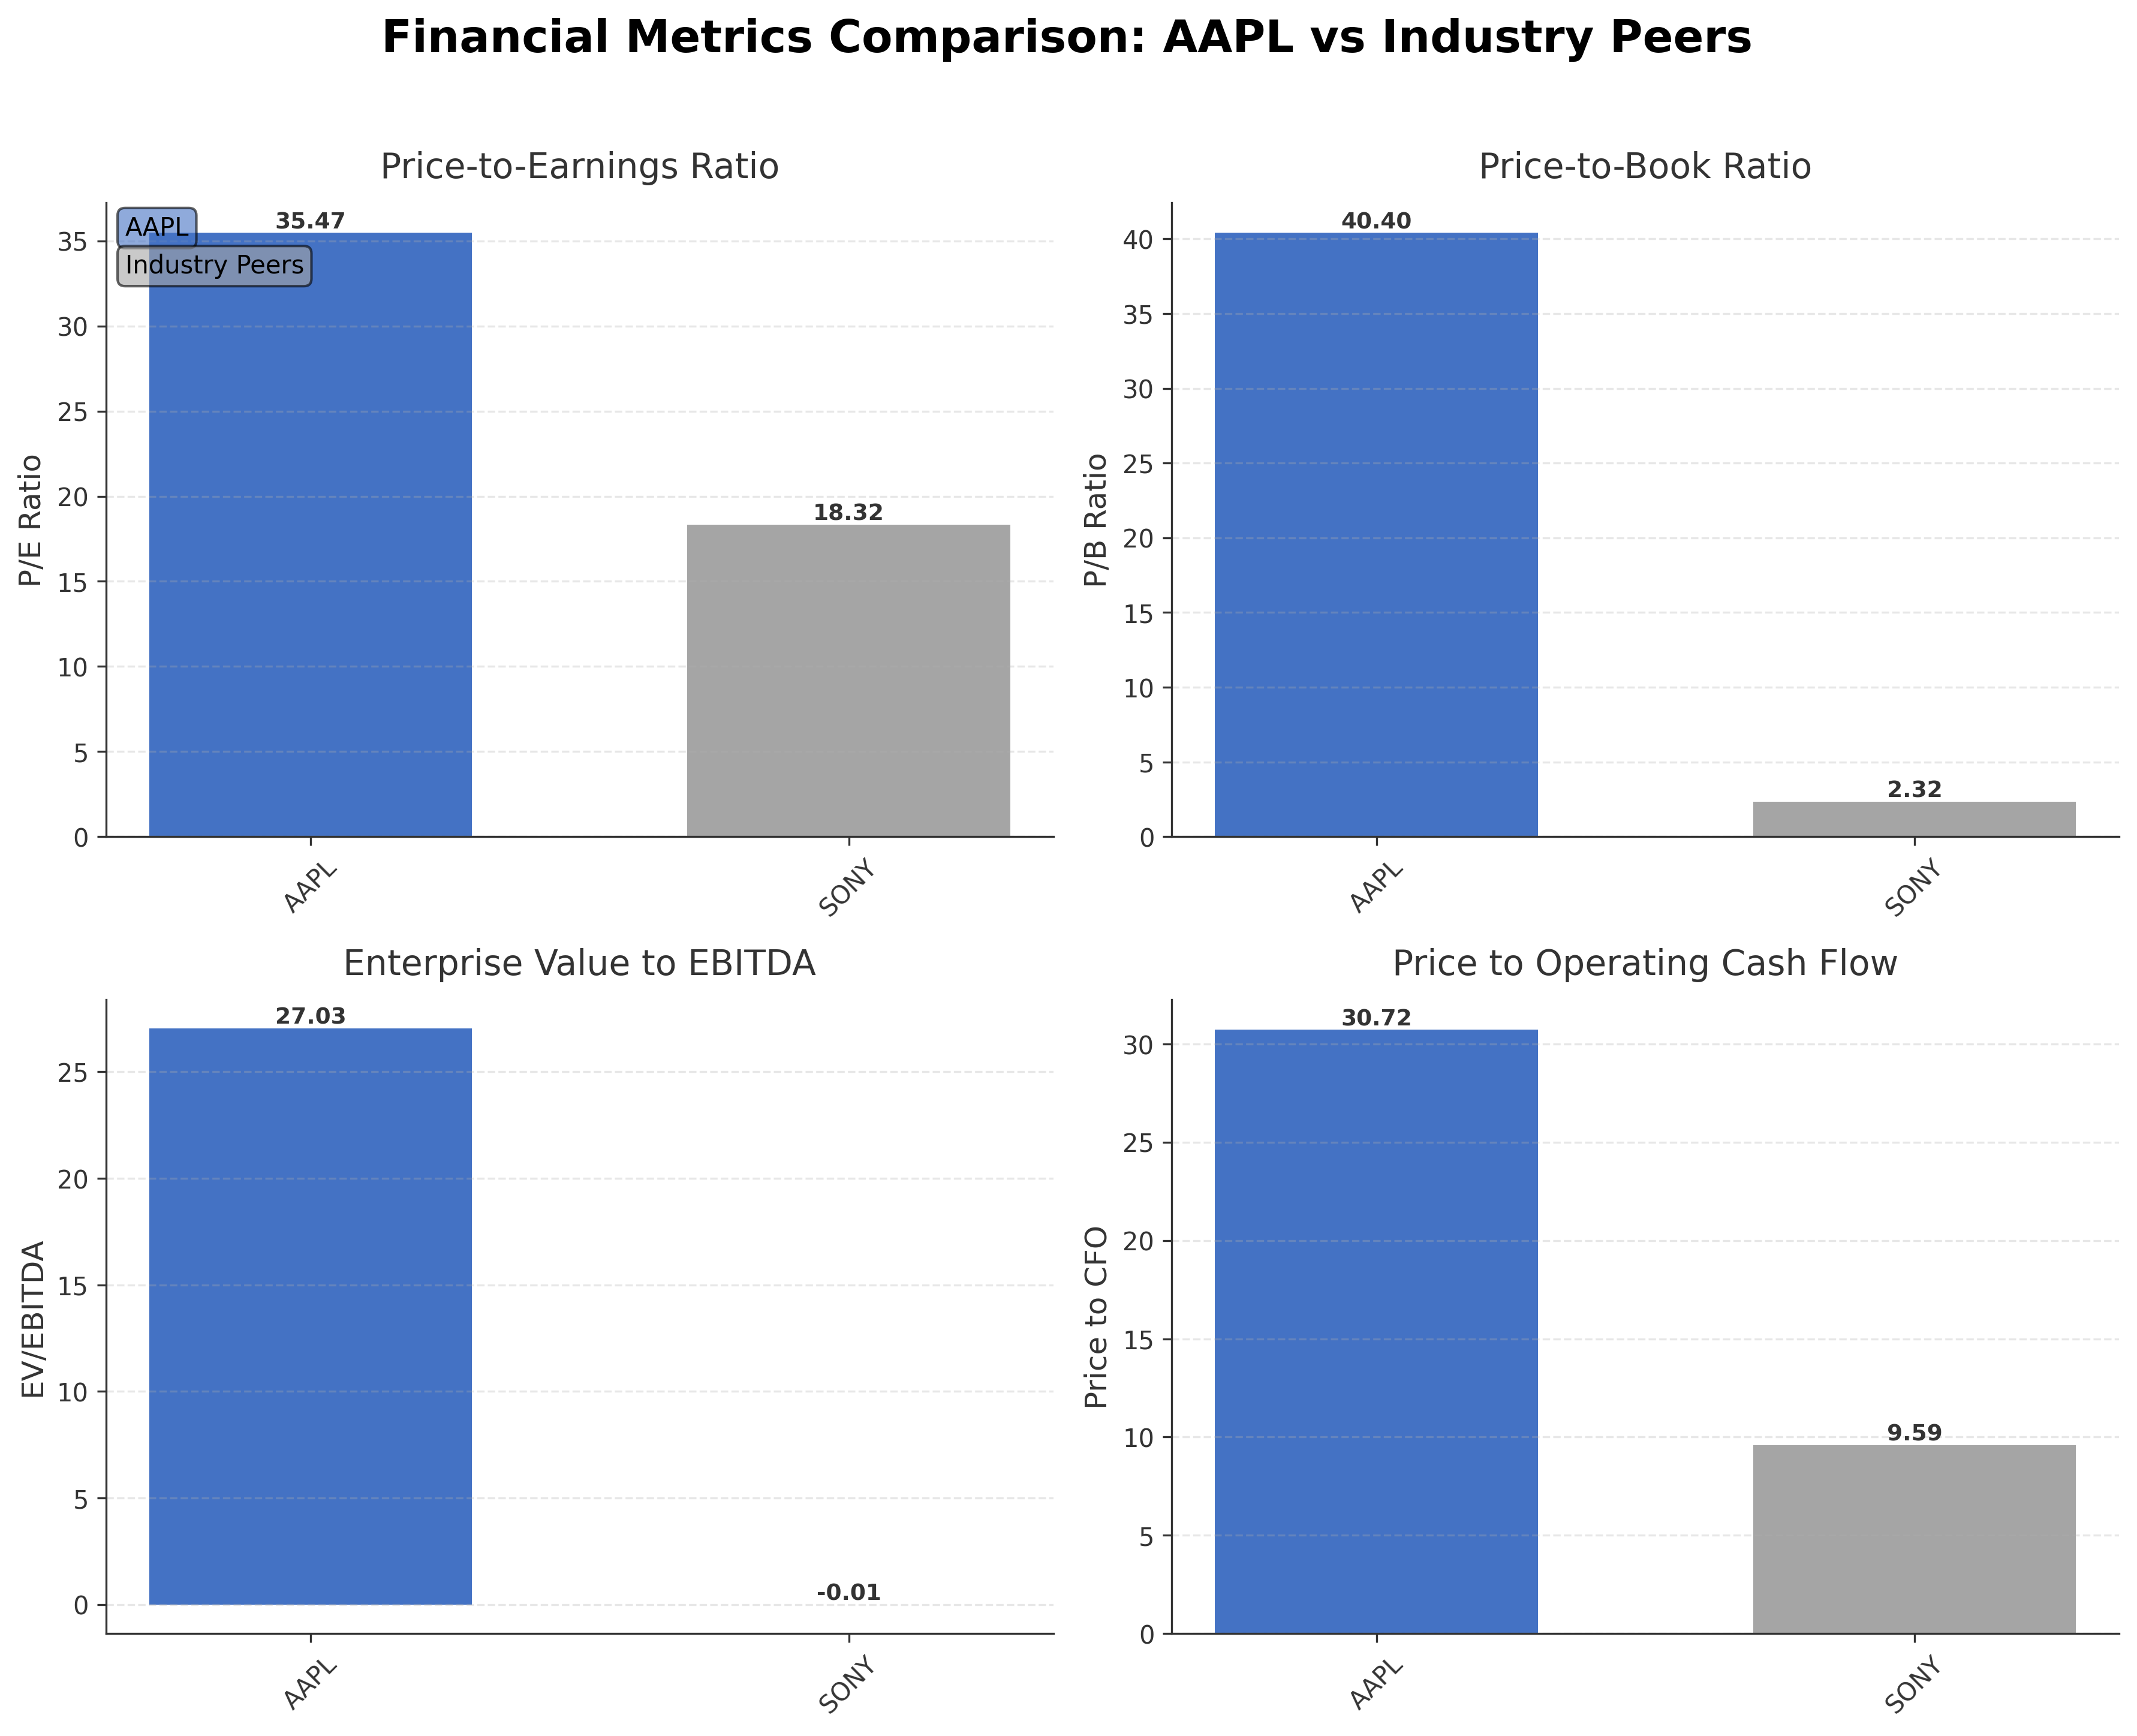
| Apple Inc. | $4.31T | 35.47 | 40.40 | 27.03 | 30.72 |
| Sony Group Corporation - Sponsored American Depositary Receipt | $119.04B | 18.32 | 2.32 | -0.01 | 9.59 |
Comparison Analysis: Apple Inc. significantly outpaces its peer Sony Group Corporation in market capitalization, with a valuation exceeding $4 trillion compared to Sony's $119 billion. Apple's P/E ratio of 35.47 is nearly double Sony's 18.32, reflecting higher growth expectations and premium valuation. The P/B ratio of Apple at 40.40 far exceeds Sony's 2.32, indicating substantial intangible assets and brand value. Apple's EV/EBITDA multiple of 27.03 contrasts with Sony's negative figure, underscoring Apple's strong earnings before interest, taxes, depreciation, and amortization. Return on equity for Apple at 1.41% is also higher than Sony's 0.12%, demonstrating superior profitability and capital efficiency within the consumer electronics sector.
Financial Metrics Comparison with Peers
Financial Statements
Comprehensive financial data including income, balance sheet, and cash flow metrics
Income Statement
| fiscal_date | 2025-09-30 | 2024-09-30 | 2023-09-30 | 2022-09-30 | 2021-09-30 |
|---|---|---|---|---|---|
| Sales | 416.16B | 391.04B | 383.29B | 394.33B | 365.82B |
| Cost Of Goods | 220.96B | 210.35B | 214.14B | 223.55B | 212.98B |
| Gross Profit | 195.20B | 180.68B | 169.15B | 170.78B | 152.84B |
| Operating Expense Research And Development | 34.55B | 31.37B | 29.91B | 26.25B | 21.91B |
| Operating Expense Selling General And Administrative | 27.60B | 26.10B | 24.93B | 25.09B | 21.97B |
| Operating Income | 133.05B | 123.22B | 114.30B | 119.44B | 108.95B |
| Other Income Expense | -321.00M | 269.00M | -565.00M | -334.00M | 60.00M |
| Pretax Income | 132.73B | 123.48B | 113.74B | 119.10B | 109.21B |
| Income Tax | 20.72B | 29.75B | 16.74B | 19.30B | 14.53B |
| Net Income | 112.01B | 93.74B | 97.00B | 99.80B | 94.68B |
| Eps Basic | 7.49 | 6.11 | 6.16 | 6.15 | 5.67 |
| Eps Diluted | 7.46 | 6.08 | 6.13 | 6.11 | 5.61 |
| Basic Shares Outstanding | 14.95B | 15.34B | 15.74B | 16.22B | 16.70B |
| Diluted Shares Outstanding | 14.95B | 15.34B | 15.74B | 16.22B | 16.70B |
| Ebit | 133.05B | 123.22B | 114.30B | 119.44B | 111.85B |
| Ebitda | 144.75B | 134.66B | 125.82B | 130.54B | 123.14B |
| Net Income Continuous Operations | 112.01B | 93.74B | 97.00B | 99.80B | 94.68B |
| Non Operating Interest Income | N/A | N/A | 3.75B | 2.83B | 2.84B |
| Non Operating Interest Expense | N/A | N/A | 3.93B | 2.93B | 2.65B |
Source: Financial statements and regulatory filings
Balance Sheet
| fiscal_date | 2025-09-30 | 2024-09-30 | 2023-09-30 | 2022-09-30 | 2021-09-30 |
|---|---|---|---|---|---|
| Cash And Cash Equivalents | 35.93B | 29.94B | 29.96B | 23.65B | 34.94B |
| Accounts Receivable | 39.78B | 33.41B | 29.51B | 28.18B | 26.28B |
| Total Assets | 359.24B | 364.98B | 352.58B | 352.75B | 351.00B |
| Total Liabilities | 285.51B | 308.03B | 290.44B | 302.08B | 287.91B |
| Long Term Debt | 78.33B | 85.75B | 95.28B | 109.71B | 119.38B |
| Shareholders Equity | 73.73B | 56.95B | 62.15B | 50.67B | 63.09B |
Source: Financial statements and regulatory filings
Cash Flow Statement
| fiscal_date | 2025-09-30 | 2024-09-30 | 2023-09-30 | 2022-09-30 | 2021-09-30 |
|---|---|---|---|---|---|
| Operating Activities Net Income | 112.01B | 93.74B | 97.00B | 99.80B | 94.68B |
| Operating Activities Depreciation | 11.70B | 11.45B | 11.52B | 11.10B | 11.28B |
| Operating Activities Stock Based Compensation | 12.86B | 11.69B | 10.83B | 9.04B | 7.91B |
| Operating Activities Other Non Cash Items | -89.00M | -2.27B | -2.23B | 1.01B | -4.92B |
| Operating Activities Accounts Receivable | -7.03B | -5.14B | -417.00M | -9.34B | -14.03B |
| Operating Activities Accounts Payable | 902.00M | 6.02B | -1.89B | 9.45B | 12.33B |
| Operating Activities Other Assets Liabilities | -18.87B | 2.77B | -4.27B | 1.57B | -1.53B |
| Operating Activities Operating Cash Flow | 111.48B | 118.25B | 110.54B | 123.52B | 100.94B |
| Investing Activities Capital Expenditures | -12.71B | -9.45B | -10.96B | -10.71B | -11.09B |
| Investing Activities Purchase Of Investments | -24.41B | -48.66B | -29.51B | -76.92B | -109.56B |
| Investing Activities Sale Of Investments | 53.80B | 62.35B | 45.51B | 67.36B | 106.48B |
| Investing Activities Other Investing Activity | -1.48B | -1.31B | -1.34B | -2.09B | -385.00M |
| Investing Activities Investing Cash Flow | 15.20B | 2.94B | 3.71B | -22.66B | -14.58B |
| Financing Activities Long Term Debt Issuance | 4.48B | 0.00 | 5.23B | 5.46B | 20.39B |
| Financing Activities Long Term Debt Payments | -10.93B | -9.96B | -11.15B | -9.54B | -8.75B |
| Financing Activities Short Term Debt Issuance | -2.03B | 3.96B | -3.98B | 3.96B | 1.02B |
| Financing Activities Common Stock Repurchase | -90.71B | -94.95B | -77.55B | -89.40B | -85.97B |
| Financing Activities Common Dividends | -15.42B | -15.23B | -15.03B | -14.84B | -14.47B |
| Financing Activities Other Financing Charges | -6.07B | -5.80B | -6.01B | -6.38B | -5.58B |
| Financing Activities Financing Cash Flow | -120.69B | -121.98B | -108.49B | -110.75B | -92.25B |
| End Cash Position | 35.93B | 29.94B | 30.74B | 24.98B | 35.93B |
| Income Tax Paid | 43.37B | 26.10B | 18.68B | 19.57B | 25.39B |
| Free Cash Flow | 98.77B | 108.81B | 99.58B | 111.44B | 92.95B |
| Interest Paid | N/A | N/A | 3.80B | 2.87B | 2.69B |
| Operating Activities Deferred Taxes | N/A | N/A | N/A | 895.00M | -4.77B |
| Investing Activities Net Acquisitions | N/A | N/A | N/A | -306.00M | -33.00M |
| Financing Activities Common Stock Issuance | N/A | N/A | N/A | N/A | 1.10B |
Source: Financial statements and regulatory filings
Technical Analysis
Key Insights
- Apple's stock is currently exhibiting a strong upward trend, with price action forming higher highs and higher lows over recent weeks.
- Key support levels are identified near $260, while resistance is observed close to the 52-week high around $295.
- The stock is trading above its 10-day, 50-day ($262.80), and 200-day ($257.02) moving averages, indicating bullish momentum across short and long-term timeframes.
- Momentum indicators show the Relative Strength Index (RSI) in the upper range, suggesting strong buying pressure; MACD is positive with a bullish crossover; Stochastic oscillator confirms momentum strength.
- Analysis across daily, weekly, and monthly charts consistently reflects a positive trend with no immediate signs of reversal.
- Potential market scenarios include continuation of the uptrend if resistance at $295 is breached, or consolidation around current levels if selling pressure increases near resistance.
Trending News
1. Headline: Apple Inc. stock (US0378331005): Shares near record highs after strong Q2 results and analyst optimi
Summary: Apple Inc. stock is trading near a new 52?week high after a record March quarter and a fresh round o
Sentiment: positive
2. Headline: XY Planning Network Inc. Raises Stock Holdings in Apple Inc. $AAPL
Summary: XY Planning Network Inc. raised its stake in Apple Inc. (NASDAQ:AAPL - Free Report) by 49.8% during the fourth quarter, according to the company in its most recent Form 13F filing with the Securities and Exchange Commission. The fund owned 25,550 shares of the iPhone maker's stock after acquiring a
Sentiment: positive
3. Headline: Intel shares soar on Apple chip deal report. Here's why it signals a total pivot for chipmaking
Summary: Samsung, Intel and Taiwan Semiconductor are the only three companies in the world capable of manufacturing the most advanced chips needed for AI.
Sentiment: positive
4. Headline: Intel stock hits fourth straight record high as Apple report fuels chip rally
Summary: Click here for in-depth analysis of the latest stock market news and events moving stock prices · Read the latest financial and business news from Yahoo Finance ... INOD Innodata Inc.
Sentiment: positive
5. Headline: Is Apple Stock Headed to $400? 1 Analyst Says Apple Is a "Sleeping Giant" With a Major AI Catalyst. | The Motley Fool
Summary: Sure, Apple stock's price-to-earnings ratio sits in the mid-30s, so the stock is by no means cheap. And risks remain, including rising memory costs that Cook flagged in the company's fiscal second-quarter update as a growing margin headwind, alongside the ongoing regulatory and geopolitical ...
Sentiment: negative
Recent Updates
News Summary
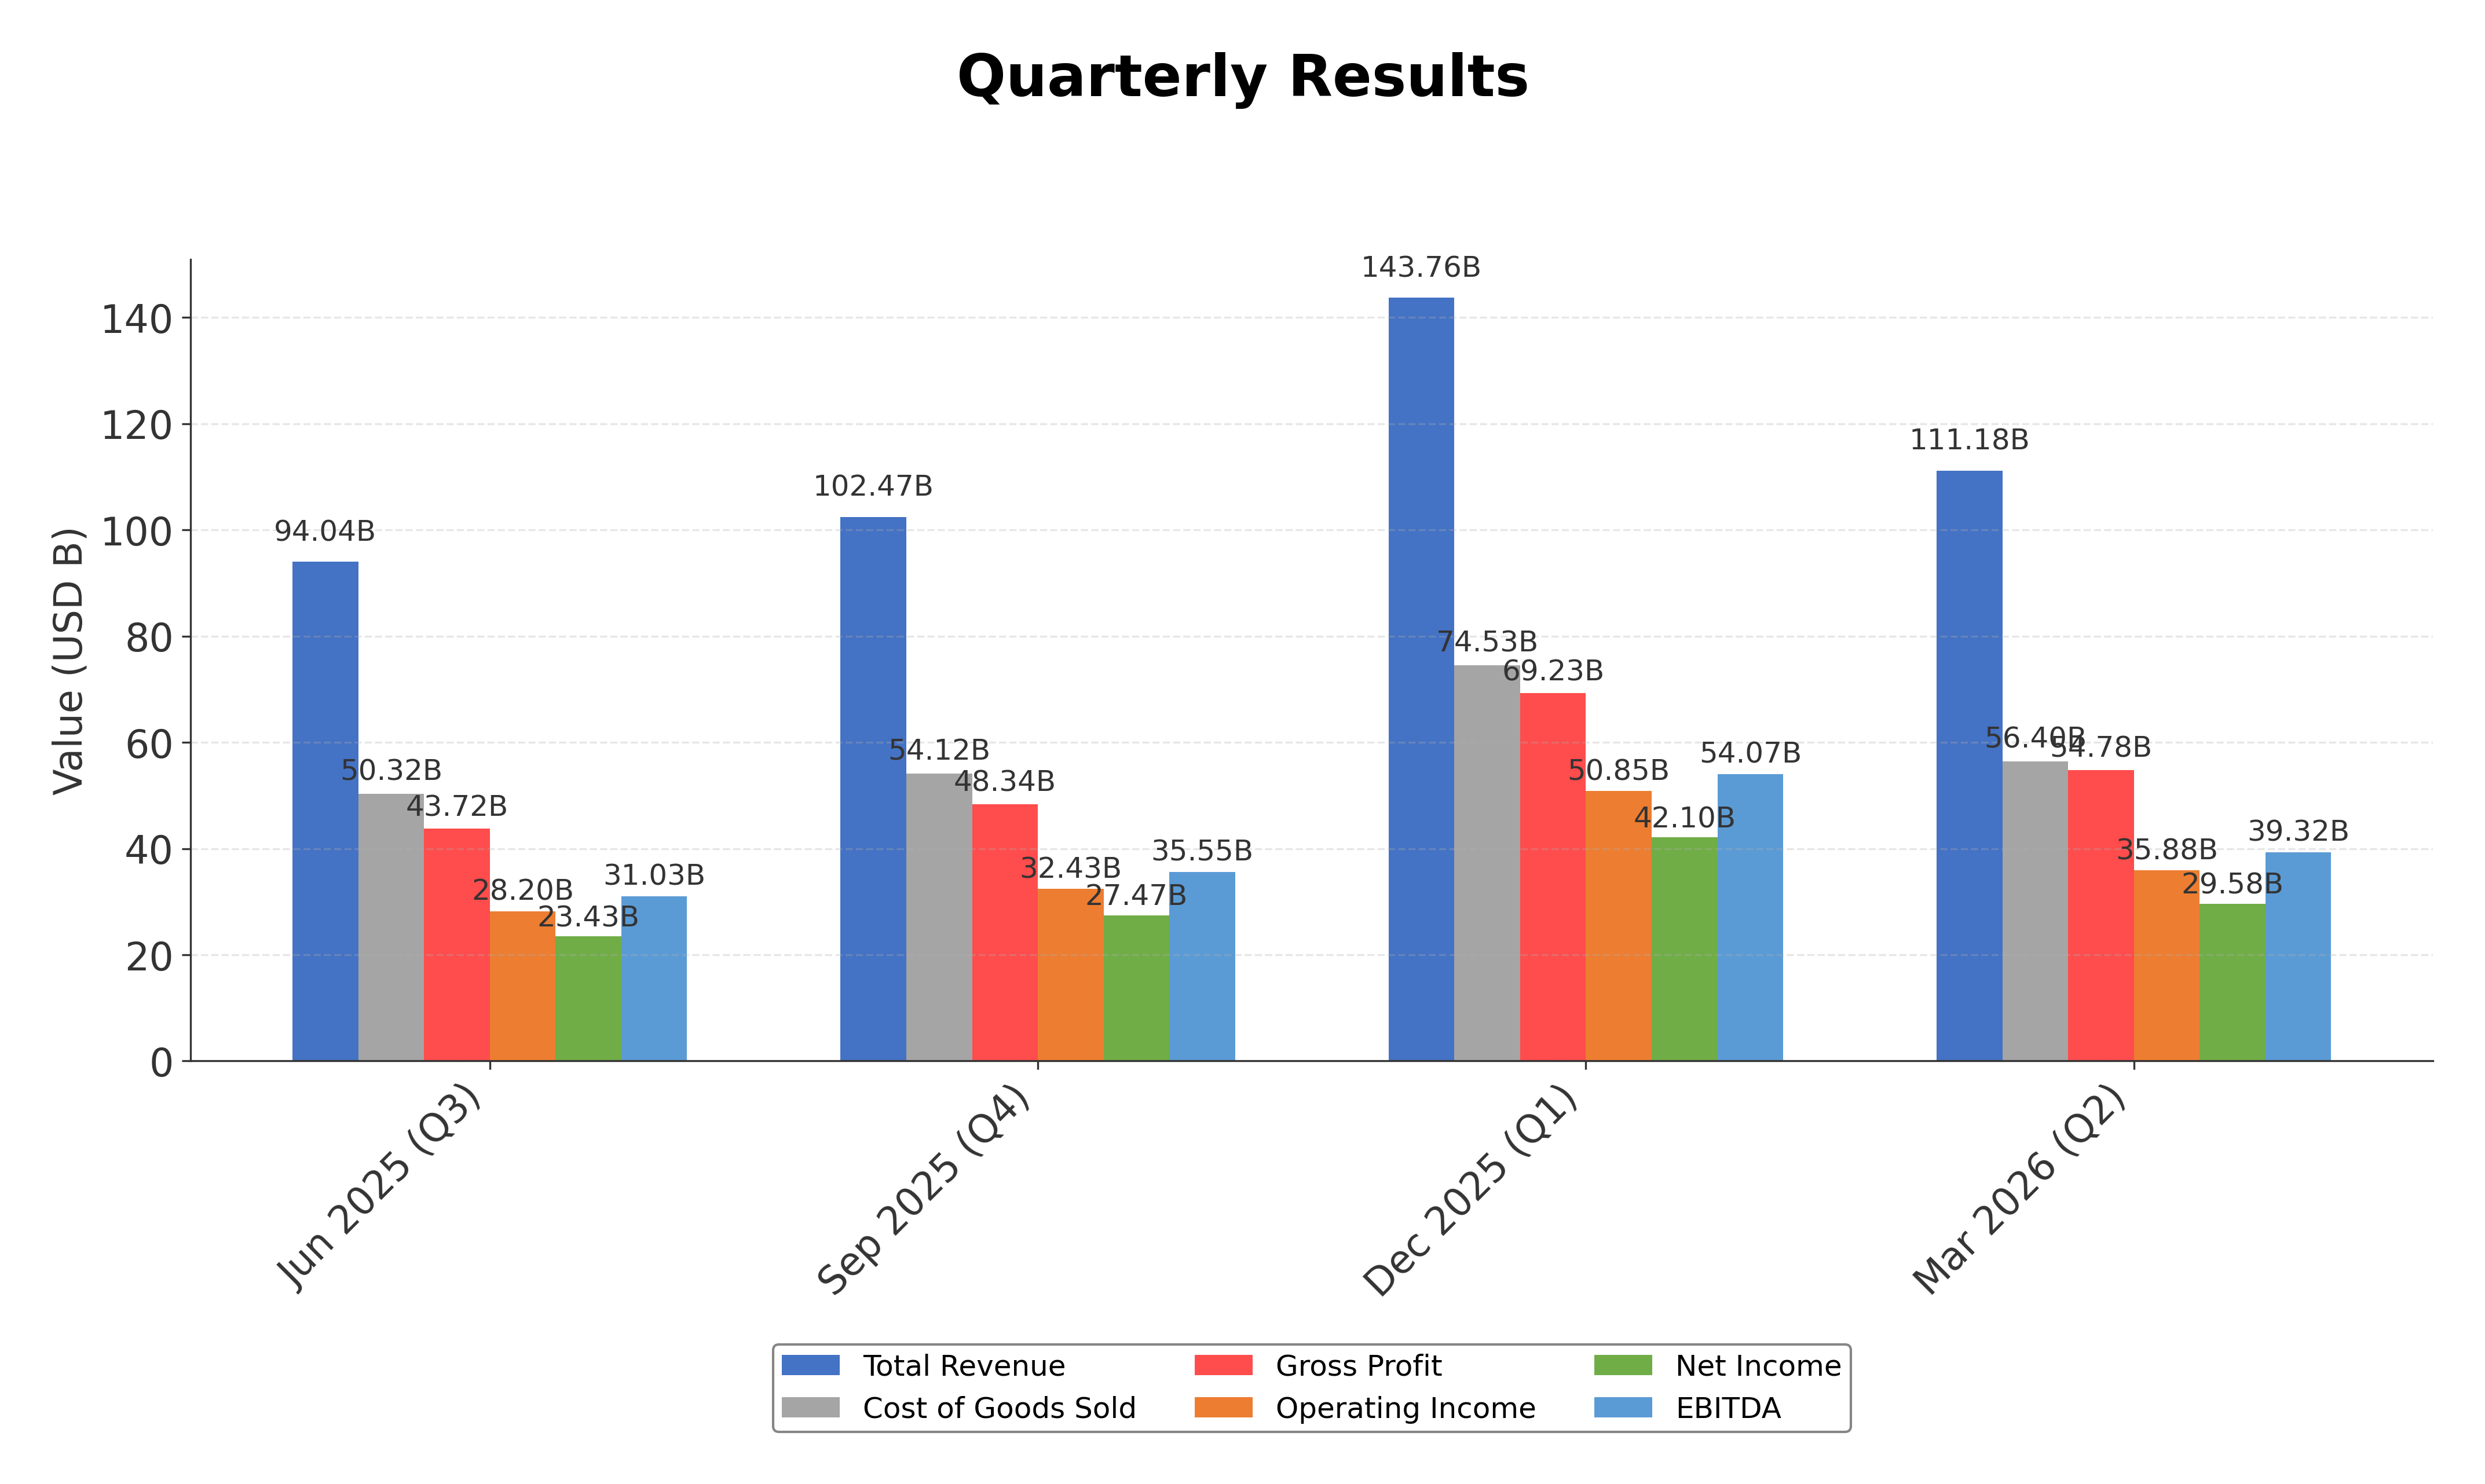
As of May 9, 2026. Apple Inc. shares are trading near record highs following a strong fiscal second quarter, with revenue reaching $111.18 billion, a 16.6% increase year-over-year, driven by a 21.7% rise in iPhone sales and 16.3% growth in Services revenue. Earnings per share increased by 21.8% to $2.01, surpassing analyst expectations. Institutional investors have shown increased confidence, exemplified by XY Planning Network Inc.'s 49.8% stake increase. Additionally, Apple has reached a preliminary chip manufacturing agreement with Intel, which may enhance supply chain resilience and support future product innovation. Despite strong earnings and positive market sentiment, some analysts caution about valuation levels and margin pressures due to rising memory costs.
News Sentiment
The overall sentiment from recent updates is predominantly positive, driven by robust earnings results, strong iPhone and Services growth, and strategic developments such as the Intel chip deal. Institutional accumulation further supports confidence in Apple's prospects. However, tempered caution arises from concerns about valuation multiples and cost headwinds, reflecting a balanced market view. The combination of strong fundamentals and strategic initiatives underpins a constructive outlook tempered by awareness of potential risks.
Source List
- https://www.marketbeat.com/instant-alerts/filing-xy-planning-network-inc-raises-stock-holdings-in-apple-inc-aapl-2026-05-09/
Analytical Overview
Analysis Summary
Apple’s valuation metrics, including a trailing P/E of 35.47 and forward P/E of 30.68, are elevated relative to the consumer electronics industry average P/E of 35.47, reflecting premium pricing supported by strong brand equity and growth prospects. The company’s revenue growth of 16.6% year-over-year and robust operating cash flow of $140.2 billion demonstrate a solid growth trajectory and healthy cash generation. Financial health is sound, with a total debt to equity ratio of 79.55%, manageable leverage, and a current ratio of 1.07 indicating adequate liquidity. Sector-specific opportunities include expansion in AI integration and services growth, while challenges encompass supply chain constraints and regulatory scrutiny. Market positioning and competitive advantages such as a wide economic moat and ecosystem integration support sustained performance.
Overall Business and Market Assessment
Supporting Factors: strong revenue and earnings growth driven by the iPhone 17 cycle and expanding services segment, alongside robust cash flow generation and a wide economic moat
Risk Factors: margin pressures from rising memory costs and ongoing regulatory and geopolitical challenges
SWOT Analysis
Strengths
- Apple maintains a strong brand with a loyal customer base.
- The company has a diversified product and services ecosystem.
- Robust cash flow generation supports investment and shareholder returns.
- Wide economic moat due to integrated hardware-software ecosystem.
Weaknesses
- High valuation multiples may limit near-term upside.
- Dependence on iPhone sales for a significant portion of revenue.
- Rising memory and component costs pressure profit margins.
- Relatively high debt to equity ratio compared to peers.
Opportunities
- Expansion of AI capabilities and integration across products.
- Growth in services segment with recurring revenue streams.
- Strategic partnerships such as the Intel chip manufacturing deal.
- Increasing adoption of wearable and accessory products.
Threats
- Regulatory scrutiny and potential antitrust actions.
- Intense competition in consumer electronics and technology sectors.
- Supply chain disruptions impacting product availability.
- Geopolitical tensions affecting global markets and operations.
Company Description
Apple Inc. is a leading technology company renowned for designing, manufacturing, and marketing innovative hardware and software products for consumers and businesses worldwide. Its flagship product, the iPhone, accounts for the majority of sales, serving as the central hub of an expansive ecosystem that includes Mac computers, iPad tablets, Apple Watch wearables, and accessories like AirPods. Apple Inc. also offers a suite of services such as the App Store, Apple Music, iCloud, Apple TV+, and Apple Fitness+, providing digital content, cloud storage, and subscription-based platforms. Operating in the consumer electronics industry within the technology sector, the company employs approximately 166,000 people and maintains a broad global presence through online stores, retail outlets, and partnerships with carriers and resellers. With a substantial market capitalization reflecting its scale, Apple Inc. plays a pivotal role in shaping consumer technology trends, emphasizing seamless integration across devices and services to enhance user experience and productivity.