


Apple Inc (AAPL)
Stock Analysis Report
Stock Journey
Key Positives and Key Risks
Pros
- Revenue growth of 16.4% year-over-year demonstrates strong top-line expansion.
- Free cash flow generation of approximately $106.9 billion supports operational flexibility and shareholder returns.
- Market capitalization of $4.54 trillion reflects dominant industry positioning and investor confidence.
Cons
- High price-to-book ratio of 42.55 indicates significant premium valuation relative to book value.
- Ongoing regulatory and antitrust challenges in the EU and other markets pose operational risks.
- Stock price declined approximately 10% recently amid negative sentiment related to AI investment stance.
Disclosure: This information is for general awareness and does not constitute investment advice
Report Summary
Apple Inc. is a leading global technology company listed on the NASDAQ exchange under the symbol AAPL. Operating primarily in the Consumer Electronics sector within the Technology industry, Apple designs, manufactures, and markets a broad portfolio of products including iPhone smartphones, Mac personal computers, iPads, wearables, and accessories. The company also operates various service platforms such as the App Store and Apple Music, serving individual consumers, businesses, and government sectors worldwide. Apple’s market positioning is characterized by its integration of hardware, software, and services into cohesive ecosystems, making it a dominant player in mobile communication, personal computing, and digital content delivery.
Financially, Apple reported trailing twelve months (TTM) revenue of approximately $466.8 billion with a gross margin of 50.06%, operating margin of 32.62%, and net profit margin of 27.62%. The company’s return on equity (ROE) stands at 148.75%, while return on assets (ROA) is 27.08%, reflecting strong profitability and efficient asset utilization. Its return on invested capital (ROIC) is robust, supported by operating cash flow of $146.7 billion and free cash flow of $106.9 billion, indicating excellent cash generation capabilities. These metrics underscore Apple’s operational efficiency and capacity to generate shareholder value.
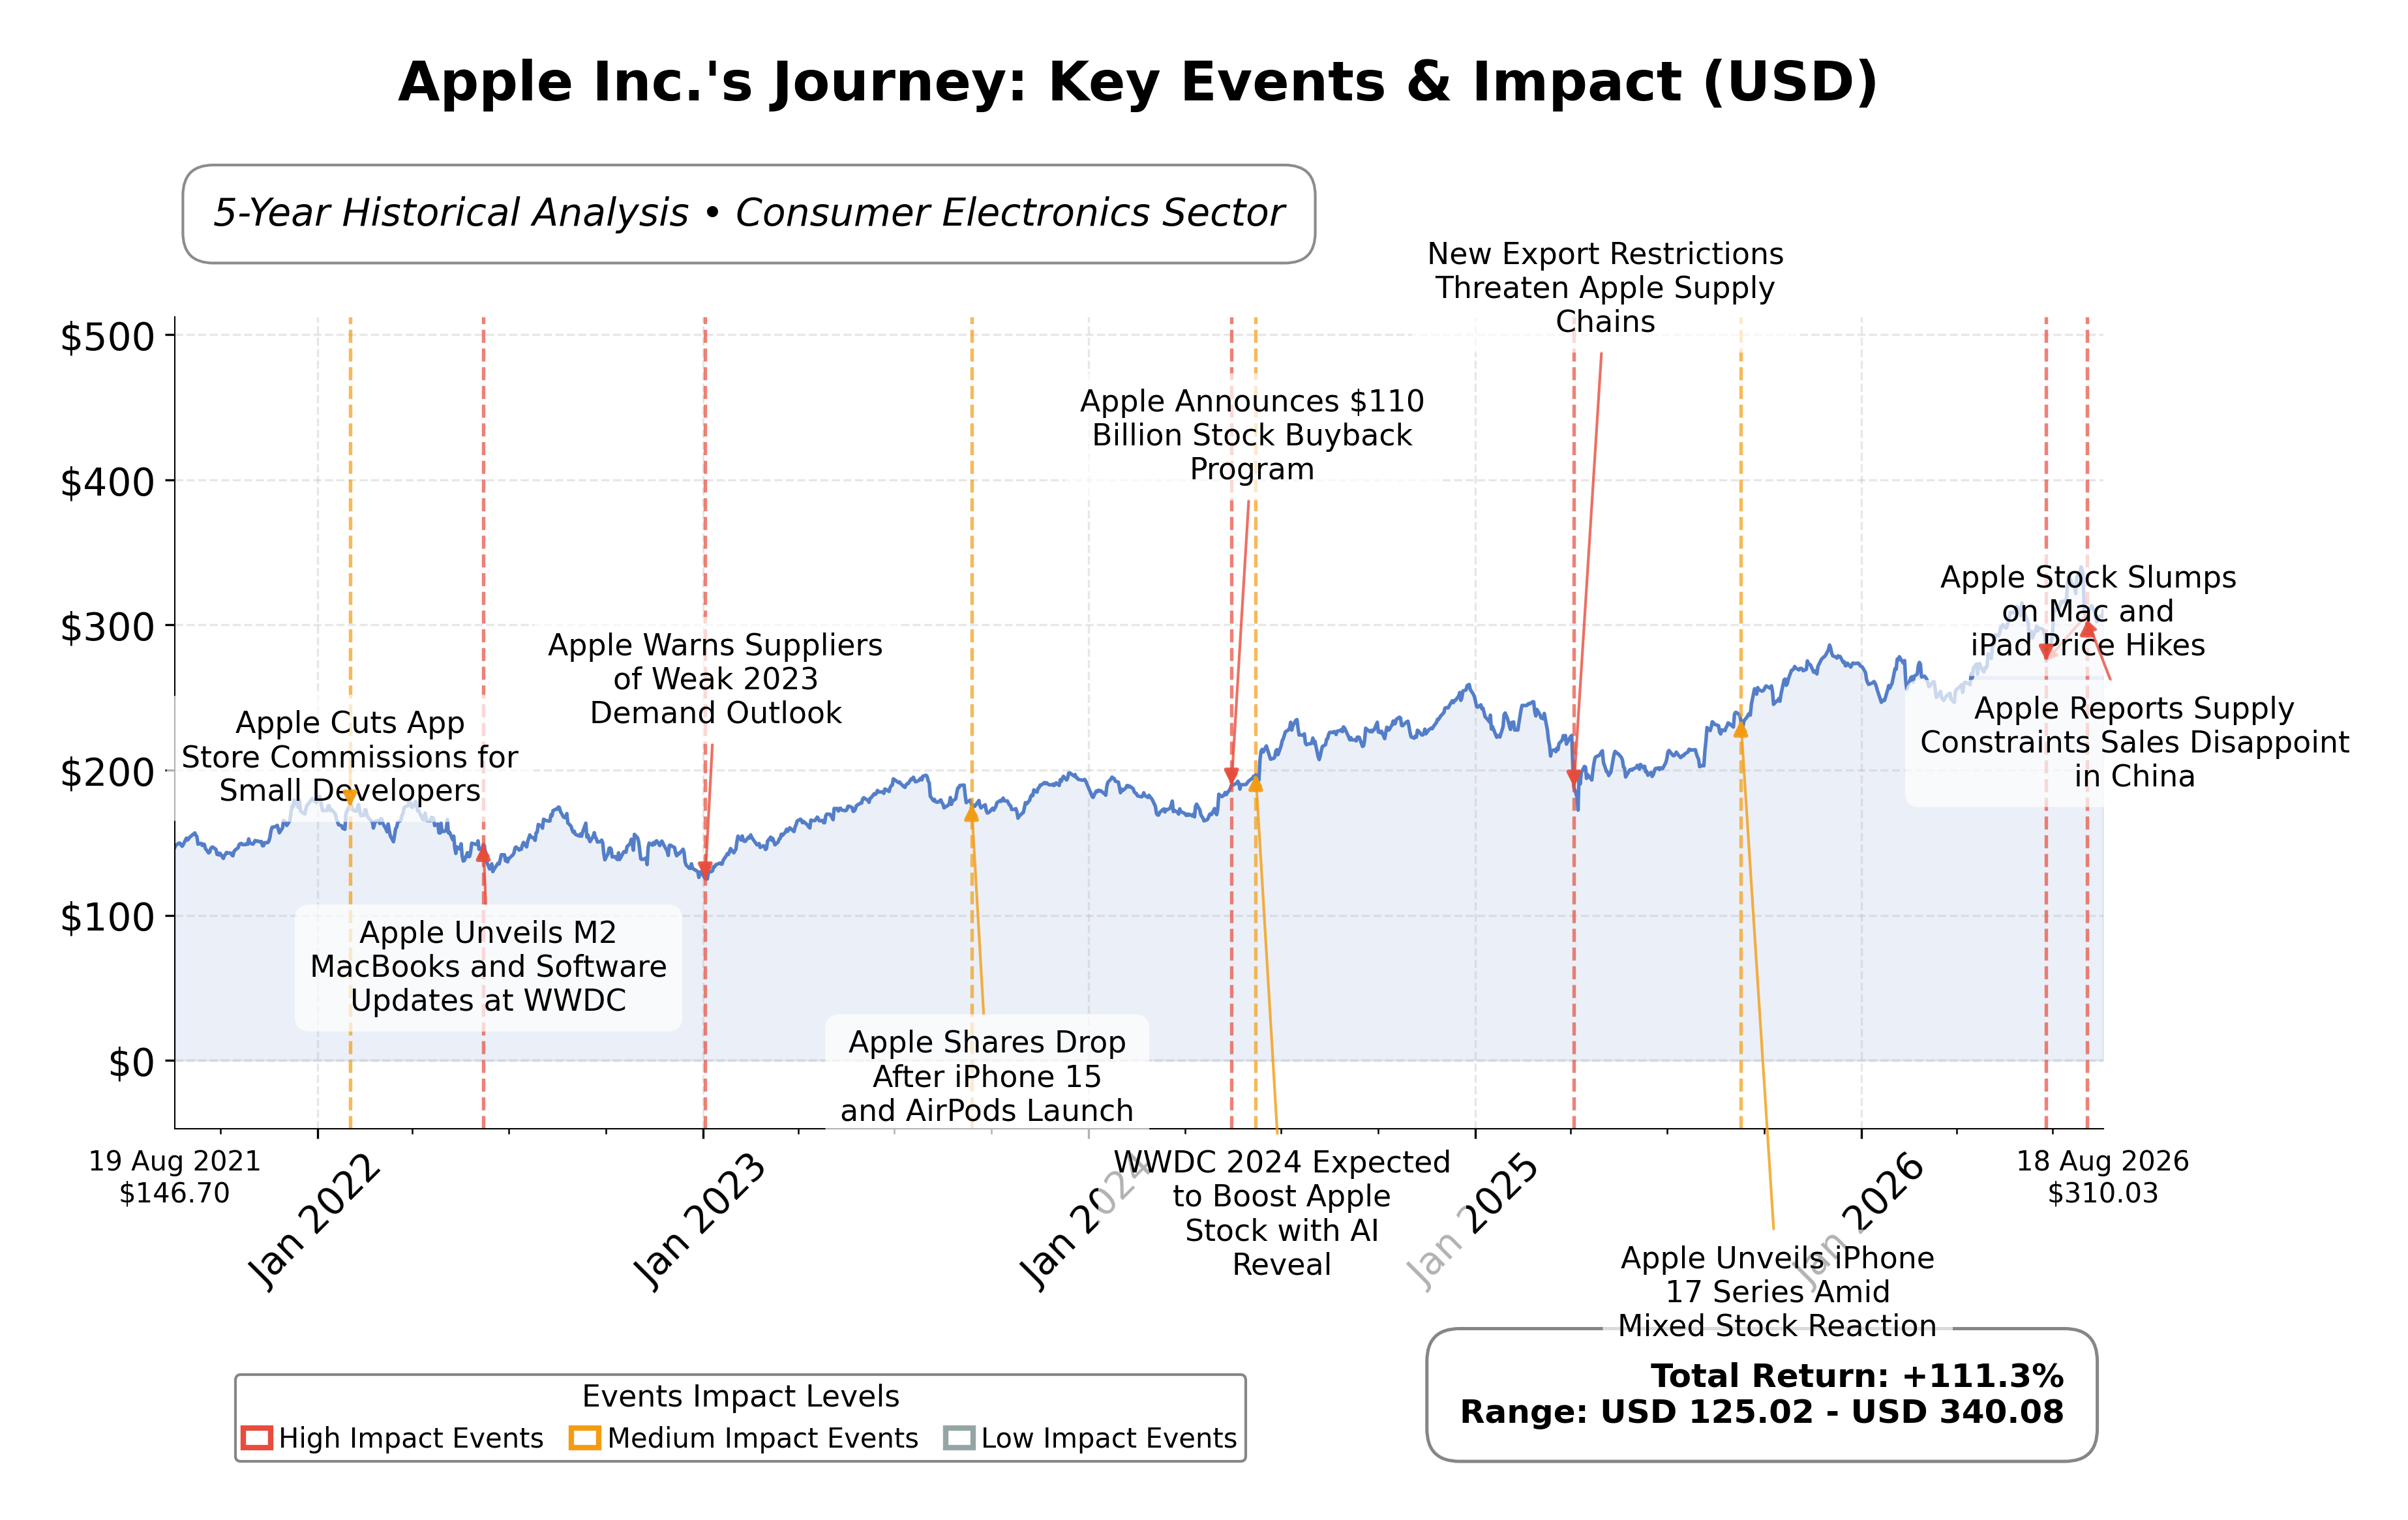
Apple’s valuation metrics show a trailing price-to-earnings (P/E) ratio of 35.34, a forward P/E of 32.28, and an enterprise value to EBITDA (EV/EBITDA) multiple of 27.00. The price-to-book (P/B) ratio is notably high at 42.55, reflecting significant market premium relative to book value. The company’s market capitalization is approximately $4.54 trillion, positioning it among the largest publicly traded firms globally. The stock’s 52-week price range spans from $201.68 to $344.57, with the current price of $316.56 situated closer to the upper end, indicating a strong market valuation relative to its recent trading range.
Apple’s strengths include substantial cash reserves of $62.4 billion, manageable total debt of $84.3 billion, and a current ratio near 1.0, demonstrating liquidity adequacy. The company maintains a dominant market position with a diversified product and service portfolio, supported by ongoing investments in manufacturing and innovation, such as the new Advanced Manufacturing Center in Houston. Key risks involve regulatory challenges in the European Union, antitrust scrutiny impacting its App Store business, and competitive pressures in the technology sector. Recent strategic actions include adjustments to EU app business terms and expansion of manufacturing capabilities domestically.
Technically, Apple’s stock price is above its 50-day and 200-day moving averages, indicating a prevailing upward trend, though recent news highlights some market headwinds related to AI investment sentiment. Momentum indicators show mixed readings across daily and weekly timeframes, suggesting cautious market dynamics. Overall, current conditions suggest a nuanced environment where accumulation and profit realization considerations coexist, warranting attentive monitoring of evolving market and regulatory developments.
Company and Industry Overview
Company Basics
Price Performance
Company Size
Shareholding Pattern
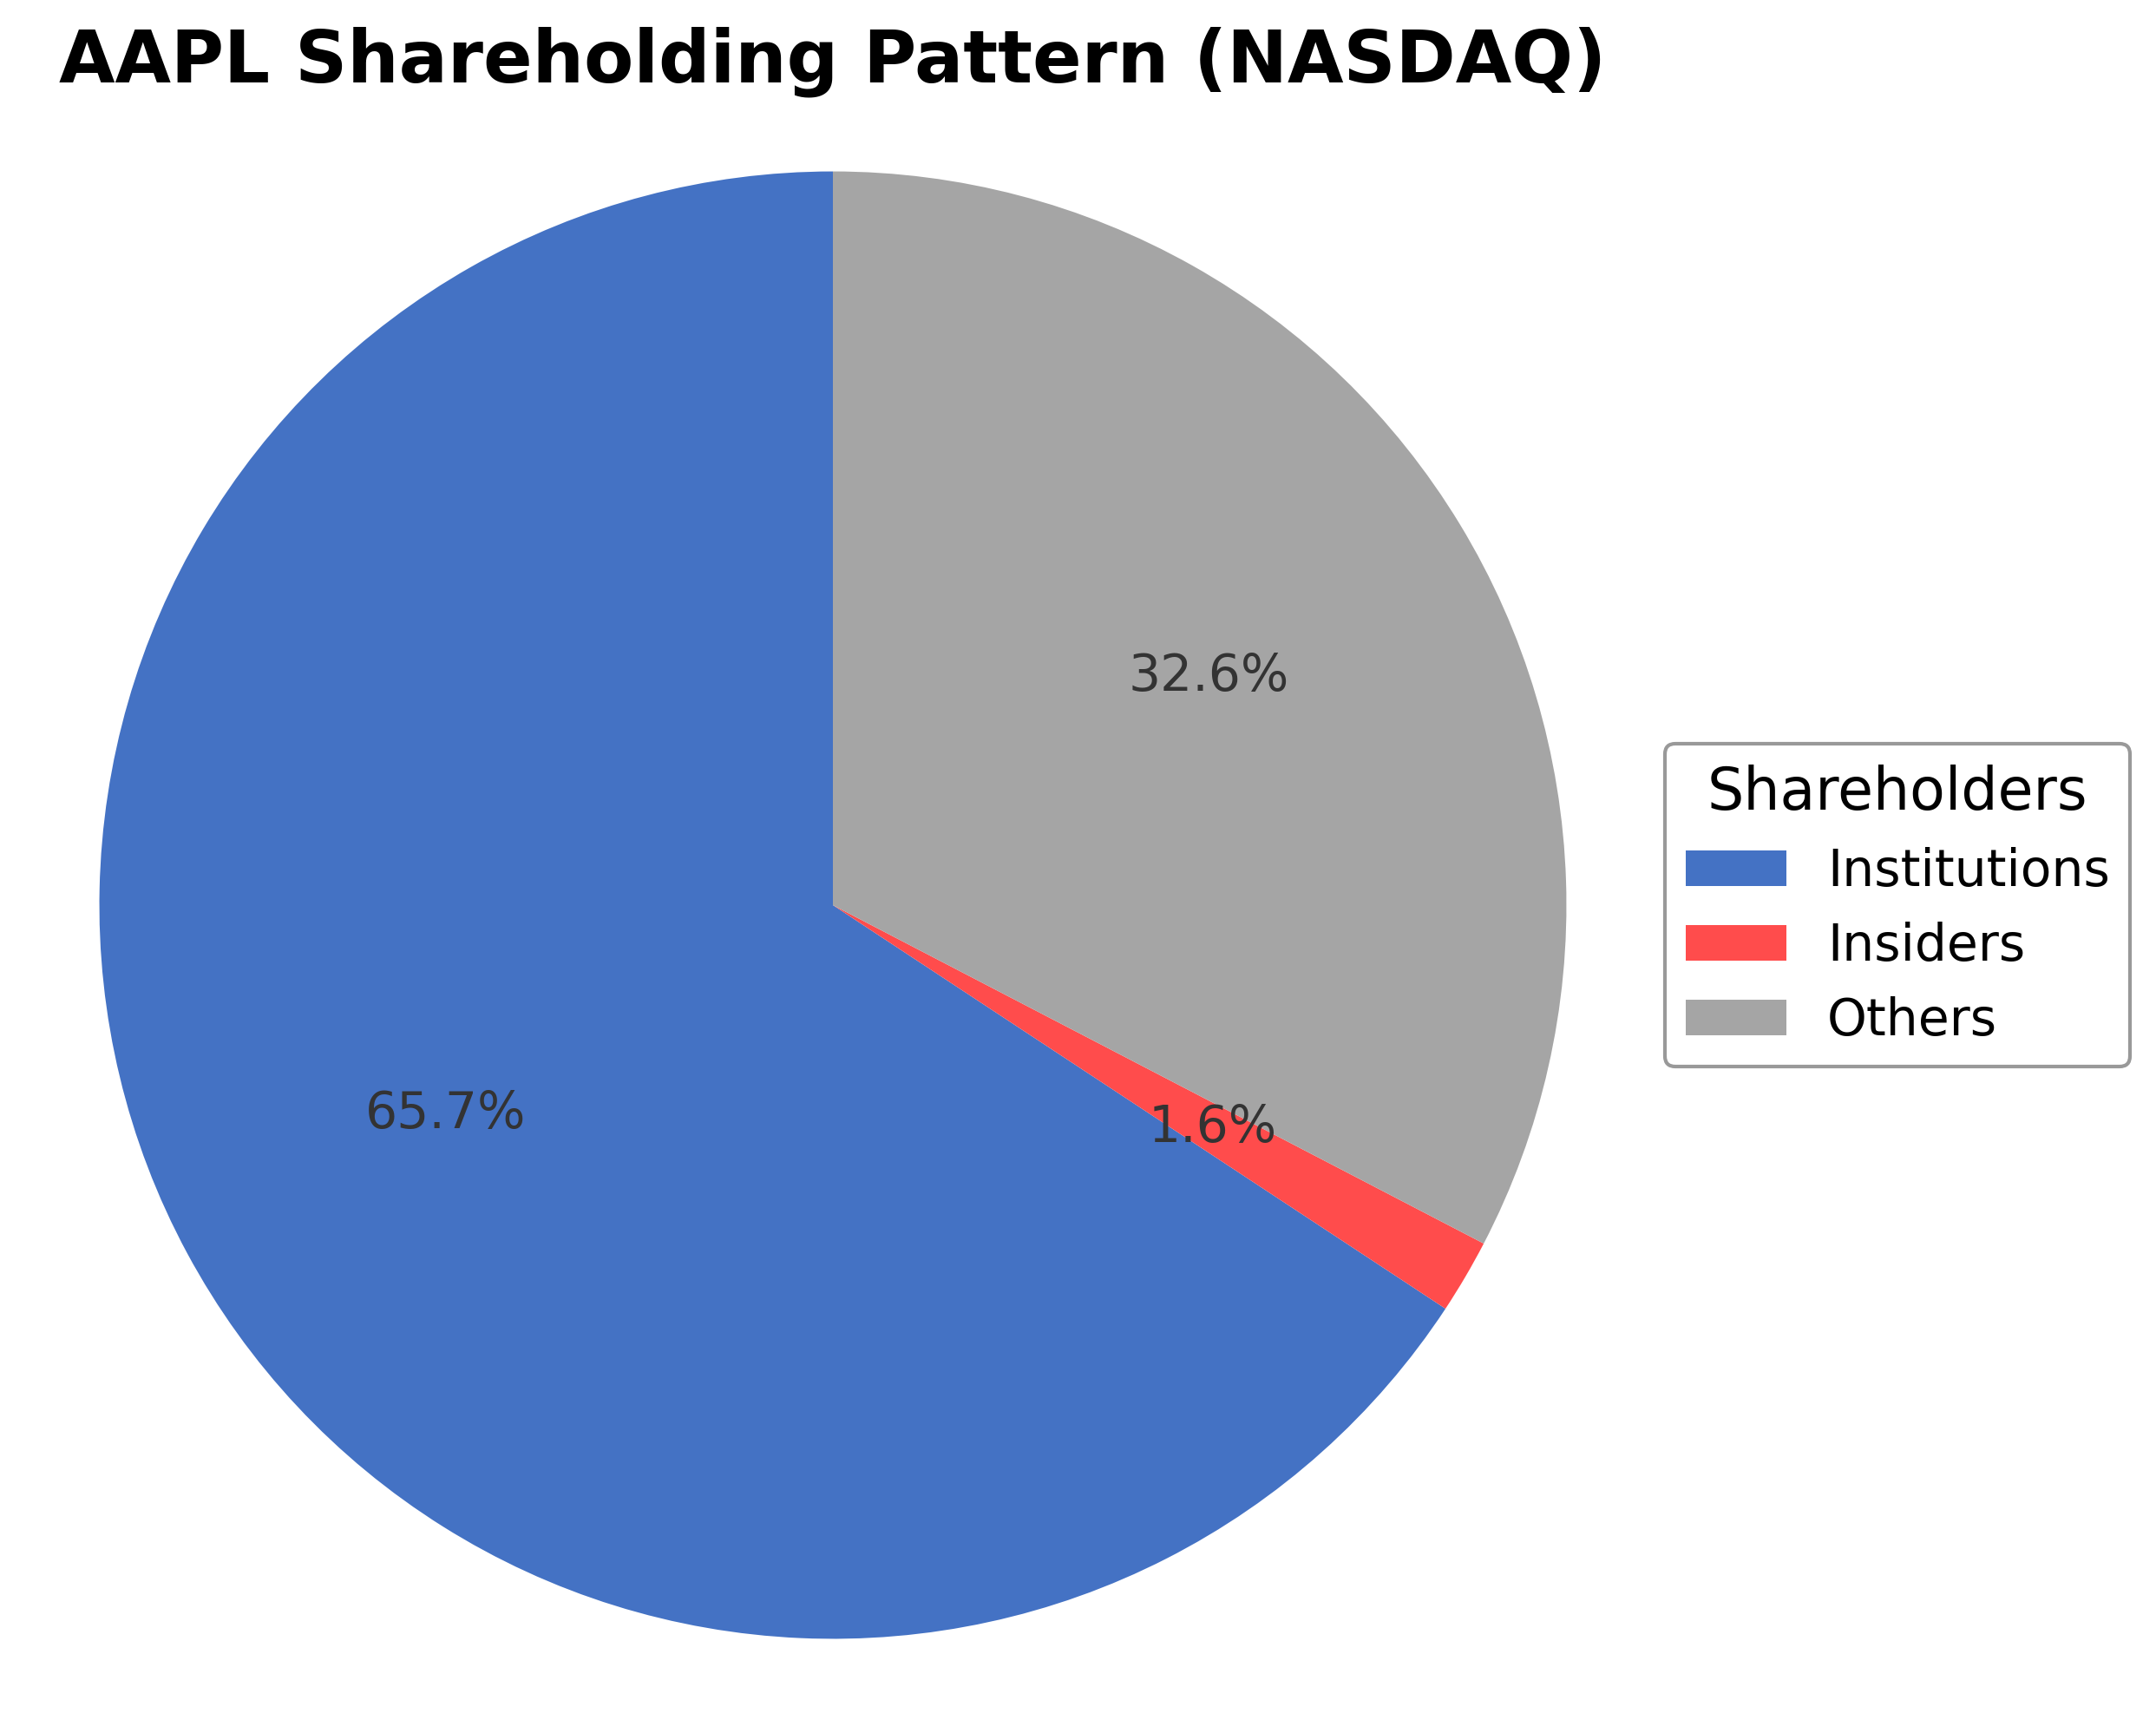
Apple Inc.'s ownership structure features approximately 1.64% held by insiders, 65.73% by institutional investors including mutual funds and asset managers, and 33.81% by other shareholders such as retail investors and employee stock plans. Institutional ownership has remained robust, reflecting continued confidence from major funds, while insider holdings remain minimal and stable. Recent trends indicate sustained institutional accumulation, underscoring positive market sentiment toward the company. This ownership distribution supports strong governance and strategic direction, with institutional investors playing a significant role in oversight and long-term value creation. The structure aligns with Apple’s position as a leading technology firm in the consumer electronics industry, facilitating continued innovation and market leadership.
Sector and Industry Analysis
The global apple market is a significant segment within the agricultural sector, encompassing a wide variety of apple types and a complex value chain from cultivation to retail. The market is projected to grow steadily through 2034, driven by rising global population and increasing disposable incomes, with major production and consumption hubs in Asia, Europe, and North America. Leading players include both multinational corporations and local producers, competing across diverse regional markets with varying consumer preferences and supply chain efficiencies.
Emerging trends in the apple industry include a growing consumer preference for organic and locally sourced produce, alongside innovations in packaging and storage technologies that extend shelf life and reduce post-harvest losses. The competitive landscape is intensifying as international firms expand operations, challenging smaller producers to innovate and diversify. Barriers such as climate change impacts, stringent food safety standards, and fluctuating trade tariffs influence market entry and operational strategies, while smart farming and data analytics are increasingly adopted to enhance productivity and sustainability.
Regulatory frameworks are becoming more rigorous, particularly regarding food safety, quality standards, and organic certification, shaping production and marketing practices globally. Trade policies and geopolitical developments, including export-import agreements and regional conflicts, affect distribution channels and pricing dynamics. The outlook for the apple market involves continued adaptation to these regulatory pressures, with an emphasis on sustainable practices and strategic partnerships to navigate evolving compliance requirements and market conditions.
Note: Analysis synthesized from industry research, market reports, and regulatory filings. Information is subject to change based on market conditions.
Financial Ratios Dashboard
Illustrative Scenario Analysis
DCF Assumptions:
Method: Two-Stage EPS-Priority Model
Financials
Peer Analysis
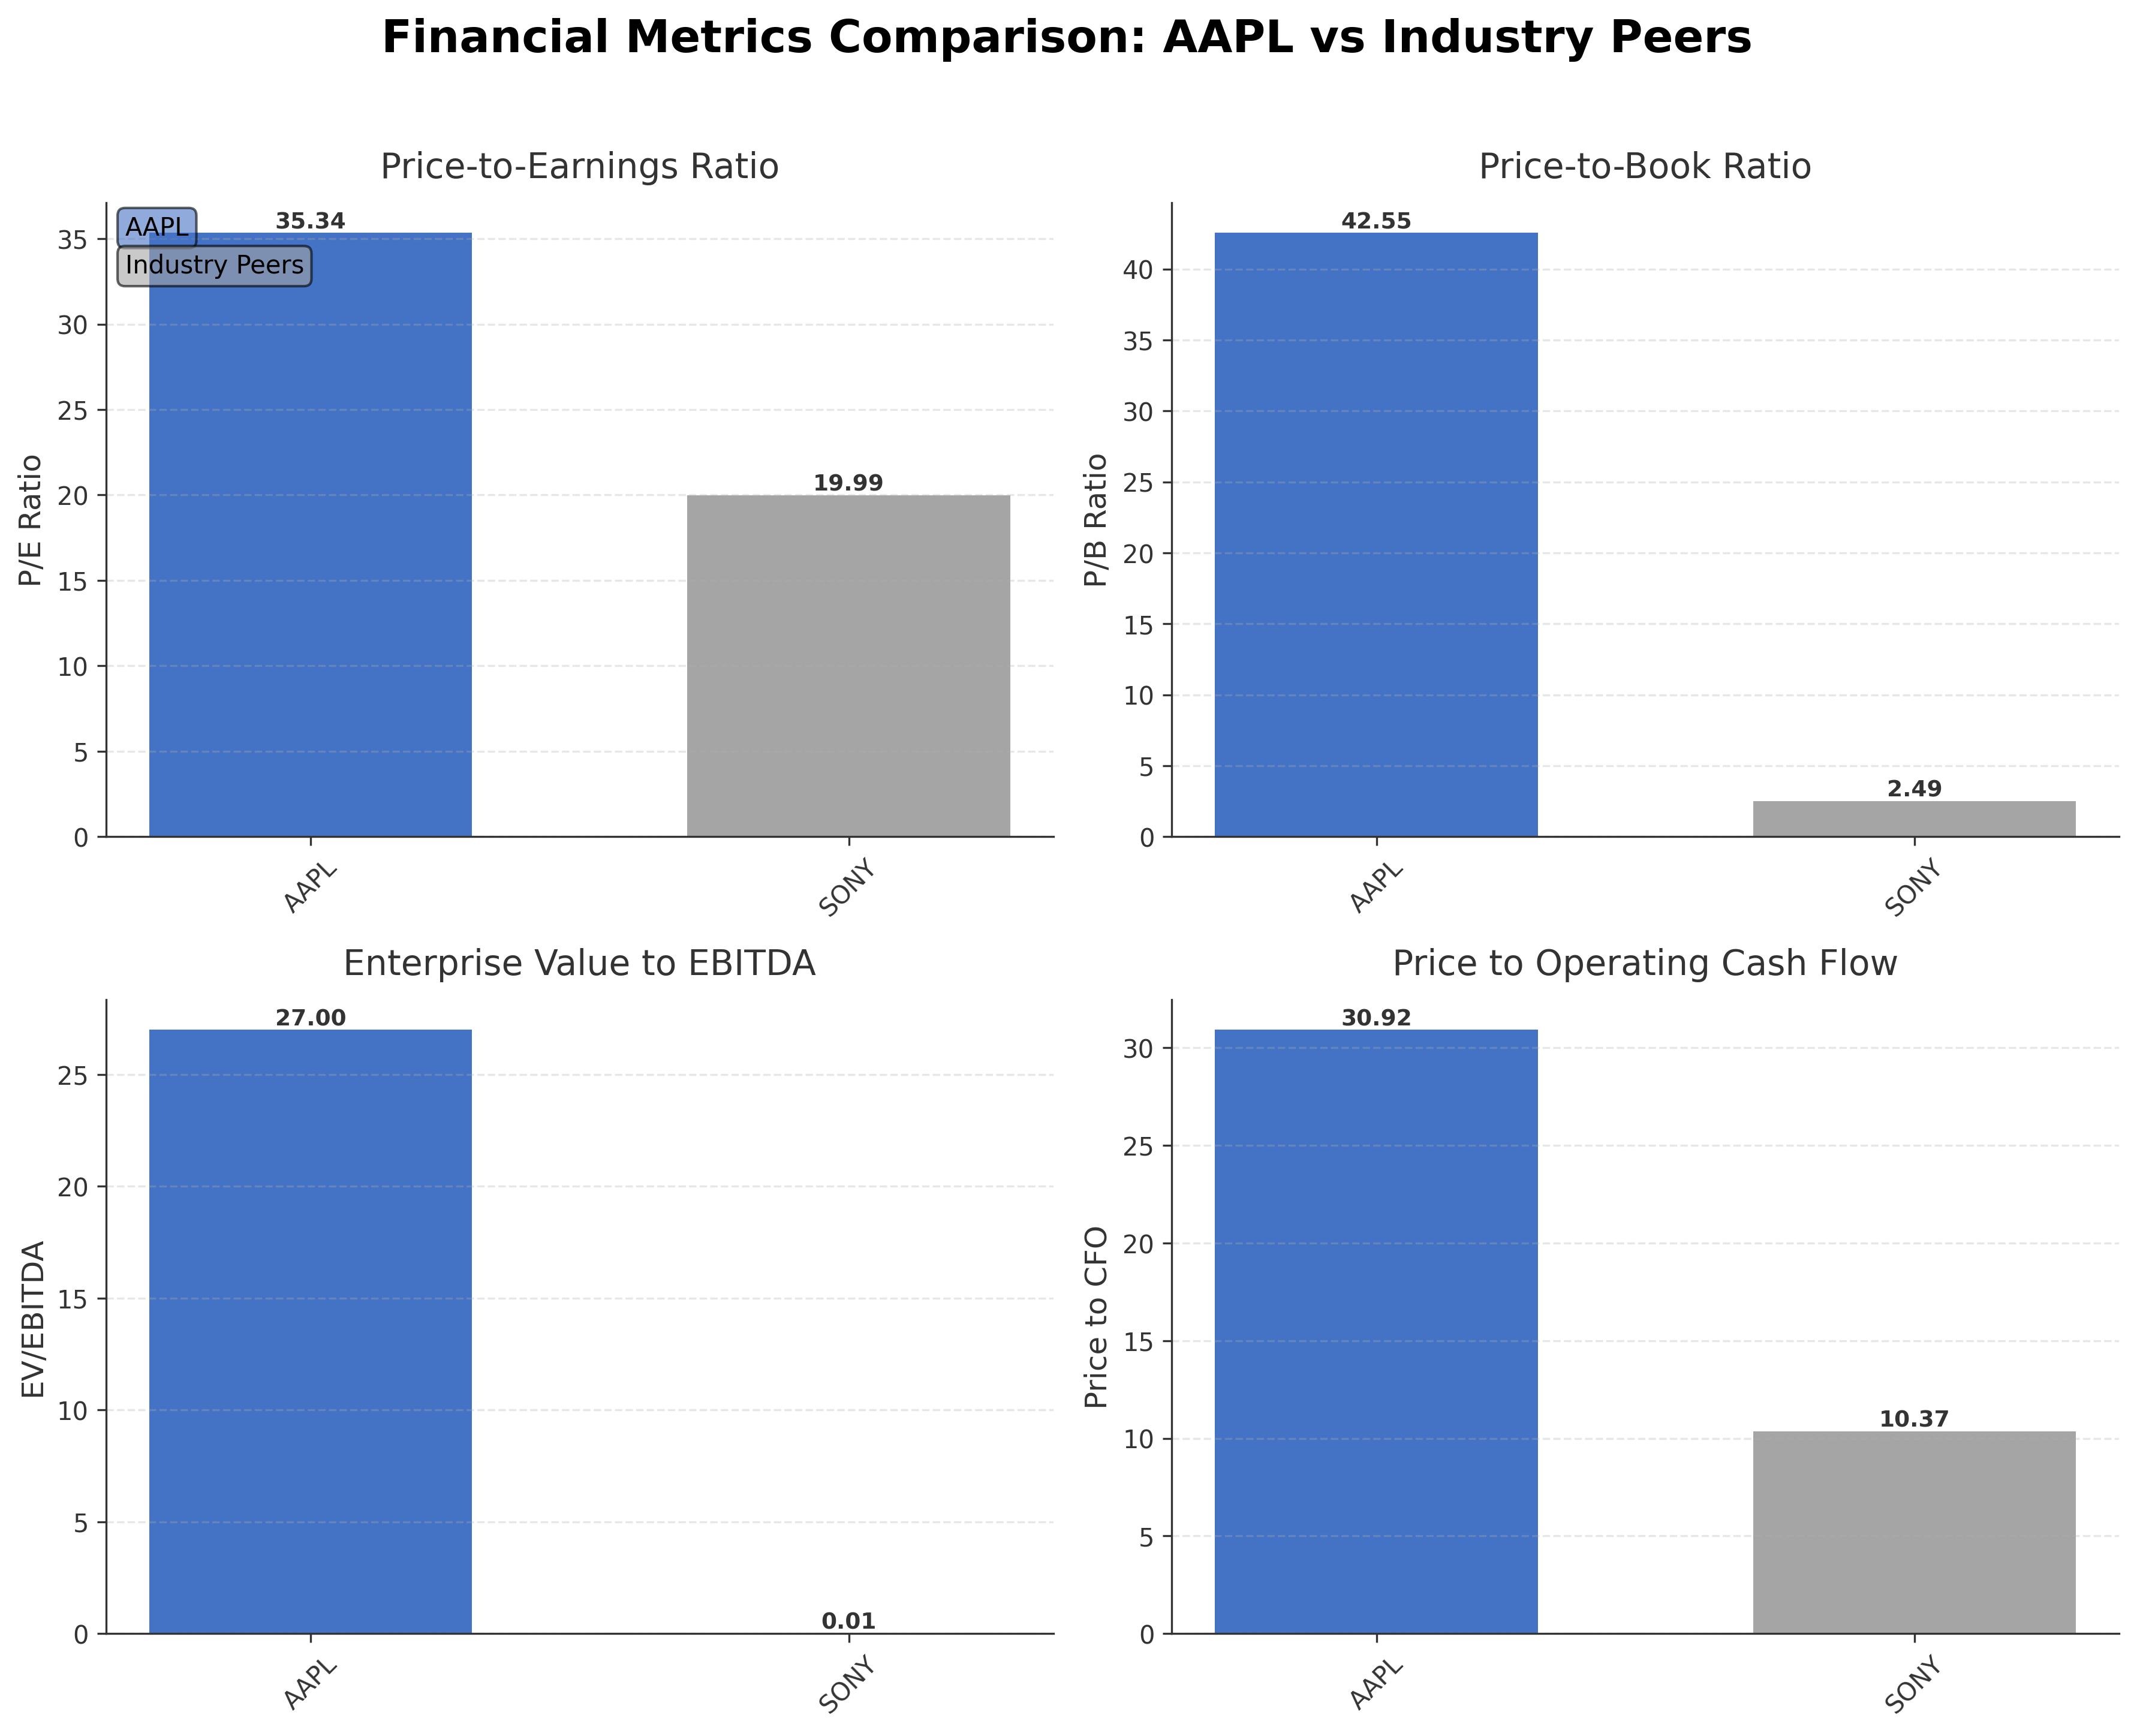
| Company Name | Market Cap | P/E Ratio | P/B Ratio | EV/EBITDA | Price to CFO |
|---|---|---|---|---|---|
| Apple Inc. | $4.54T | 35.34 | 42.55 | 27.00 | 30.92 |
| Sony Group Corporation - Sponsored American Depositary Receipt | $123.20B | 19.99 | 2.49 | 0.01 | 10.37 |
Comparison Analysis: Apple Inc. significantly exceeds its peer Sony Group Corporation in market capitalization, reflecting its dominant industry position. Apple's P/E ratio of 35.34 is substantially higher than Sony's 19.99, indicating a premium valuation consistent with its growth expectations and profitability. The P/B ratio for Apple is markedly elevated at 42.55 compared to Sony's 2.49, reflecting strong investor confidence and intangible asset value. Apple's EV/EBITDA multiple of 27.00 is also higher than Sony's near zero, suggesting a market premium on operating earnings. Return on equity for Apple is lower at 1.49% relative to Sony's 12.34%, highlighting differences in capital efficiency and business models. Overall, Apple commands a premium valuation with robust cash flow metrics but shows comparatively modest ROE among peers.
Financial Metrics Comparison with Peers
Financial Statements
Comprehensive financial data including income, balance sheet, and cash flow metrics
Income Statement
| fiscal_date | 2025-09-30 | 2024-09-30 | 2023-09-30 | 2022-09-30 | 2021-09-30 |
|---|---|---|---|---|---|
| Sales | 416.16B | 391.04B | 383.29B | 394.33B | 365.82B |
| Cost Of Goods | 220.96B | 210.35B | 214.14B | 223.55B | 212.98B |
| Gross Profit | 195.20B | 180.68B | 169.15B | 170.78B | 152.84B |
| Operating Expense Research And Development | 34.55B | 31.37B | 29.91B | 26.25B | 21.91B |
| Operating Expense Selling General And Administrative | 27.60B | 26.10B | 24.93B | 25.09B | 21.97B |
| Operating Income | 133.05B | 123.22B | 114.30B | 119.44B | 108.95B |
| Other Income Expense | -321.00M | 269.00M | -565.00M | -334.00M | 60.00M |
| Pretax Income | 132.73B | 123.48B | 113.74B | 119.10B | 109.21B |
| Income Tax | 20.72B | 29.75B | 16.74B | 19.30B | 14.53B |
| Net Income | 112.01B | 93.74B | 97.00B | 99.80B | 94.68B |
| Eps Basic | 7.49 | 6.11 | 6.16 | 6.15 | 5.67 |
| Eps Diluted | 7.46 | 6.08 | 6.13 | 6.11 | 5.61 |
| Basic Shares Outstanding | 14.95B | 15.34B | 15.74B | 16.22B | 16.70B |
| Diluted Shares Outstanding | 14.95B | 15.34B | 15.74B | 16.22B | 16.70B |
| Ebit | 133.05B | 123.22B | 114.30B | 119.44B | 111.85B |
| Ebitda | 144.75B | 134.66B | 125.82B | 130.54B | 123.14B |
| Net Income Continuous Operations | 112.01B | 93.74B | 97.00B | 99.80B | 94.68B |
| Non Operating Interest Income | N/A | N/A | 3.75B | 2.83B | 2.84B |
| Non Operating Interest Expense | N/A | N/A | 3.93B | 2.93B | 2.65B |
Data provided by Twelve Data
Balance Sheet
| fiscal_date | 2025-09-30 | 2024-09-30 | 2023-09-30 | 2022-09-30 | 2021-09-30 |
|---|---|---|---|---|---|
| Cash And Cash Equivalents | 35.93B | 29.94B | 29.96B | 23.65B | 34.94B |
| Accounts Receivable | 39.78B | 33.41B | 29.51B | 28.18B | 26.28B |
| Total Assets | 359.24B | 364.98B | 352.58B | 352.75B | 351.00B |
| Total Liabilities | 285.51B | 308.03B | 290.44B | 302.08B | 287.91B |
| Long Term Debt | 78.33B | 85.75B | 95.28B | 109.71B | 119.38B |
| Shareholders Equity | 73.73B | 56.95B | 62.15B | 50.67B | 63.09B |
Data provided by Twelve Data
Cash Flow Statement
| fiscal_date | 2025-09-30 | 2024-09-30 | 2023-09-30 | 2022-09-30 | 2021-09-30 |
|---|---|---|---|---|---|
| Operating Activities Net Income | 112.01B | 93.74B | 97.00B | 99.80B | 94.68B |
| Operating Activities Depreciation | 11.70B | 11.45B | 11.52B | 11.10B | 11.28B |
| Operating Activities Stock Based Compensation | 12.86B | 11.69B | 10.83B | 9.04B | 7.91B |
| Operating Activities Other Non Cash Items | -89.00M | -2.27B | -2.23B | 1.01B | -4.92B |
| Operating Activities Accounts Receivable | -7.03B | -5.14B | -417.00M | -9.34B | -14.03B |
| Operating Activities Accounts Payable | 902.00M | 6.02B | -1.89B | 9.45B | 12.33B |
| Operating Activities Other Assets Liabilities | -18.87B | 2.77B | -4.27B | 1.57B | -1.53B |
| Operating Activities Operating Cash Flow | 111.48B | 118.25B | 110.54B | 123.52B | 100.94B |
| Investing Activities Capital Expenditures | -12.71B | -9.45B | -10.96B | -10.71B | -11.09B |
| Investing Activities Purchase Of Investments | -24.41B | -48.66B | -29.51B | -76.92B | -109.56B |
| Investing Activities Sale Of Investments | 53.80B | 62.35B | 45.51B | 67.36B | 106.48B |
| Investing Activities Other Investing Activity | -1.48B | -1.31B | -1.34B | -2.09B | -385.00M |
| Investing Activities Investing Cash Flow | 15.20B | 2.94B | 3.71B | -22.66B | -14.58B |
| Financing Activities Long Term Debt Issuance | 4.48B | 0.00 | 5.23B | 5.46B | 20.39B |
| Financing Activities Long Term Debt Payments | -10.93B | -9.96B | -11.15B | -9.54B | -8.75B |
| Financing Activities Short Term Debt Issuance | -2.03B | 3.96B | -3.98B | 3.96B | 1.02B |
| Financing Activities Common Stock Repurchase | -90.71B | -94.95B | -77.55B | -89.40B | -85.97B |
| Financing Activities Common Dividends | -15.42B | -15.23B | -15.03B | -14.84B | -14.47B |
| Financing Activities Other Financing Charges | -6.07B | -5.80B | -6.01B | -6.38B | -5.58B |
| Financing Activities Financing Cash Flow | -120.69B | -121.98B | -108.49B | -110.75B | -92.25B |
| End Cash Position | 35.93B | 29.94B | 30.74B | 24.98B | 35.93B |
| Income Tax Paid | 43.37B | 26.10B | 18.68B | 19.57B | 25.39B |
| Free Cash Flow | 98.77B | 108.81B | 99.58B | 111.44B | 92.95B |
| Interest Paid | N/A | N/A | 3.80B | 2.87B | 2.69B |
| Operating Activities Deferred Taxes | N/A | N/A | N/A | 895.00M | -4.77B |
| Investing Activities Net Acquisitions | N/A | N/A | N/A | -306.00M | -33.00M |
| Financing Activities Common Stock Issuance | N/A | N/A | N/A | N/A | 1.10B |
Data provided by Twelve Data
Technical Analysis
Key Insights
- Apple's stock is currently in an upward trend, trading above its 10-day, 50-day (approximately $309.30), and 200-day (approximately $277.65) moving averages, indicating bullish price momentum.
- Key support levels are identified near $300 and $280, while resistance is observed around the recent 52-week high of $344.57.
- The stock price's position above major moving averages suggests sustained buying interest over short and long-term horizons.
- Momentum indicators show mixed signals: RSI is near neutral levels, MACD indicates a recent weakening of bullish momentum, and stochastic oscillators reflect consolidation.
- Multi-timeframe analysis reveals daily charts exhibiting steady gains, weekly charts showing moderate strength, and monthly charts indicating long-term upward bias.
- Current technical setup suggests potential for continued price consolidation with possible breakout scenarios contingent on broader market and sector developments.
Trending News
1. Headline: Interesting News for Apple Stock Investors | The Motley Fool
Summary: The app store is one of the most lucrative parts of Apple's business.
Sentiment: neutral
2. Headline: Apple Faces Stock Struggles Amid AI Investment Shift (AAPL)
Summary: On August 18, 2026, Apple Inc. (AAPL) has faced a notable decline in its stock price, dropping approximately 10% since reaching record highs on July 28. This do
Sentiment: negative
3. Headline: Apple’s Anti-AI Position Is Becoming Stock Market Baggage - Bloomberg
Summary: Apple Inc.’s status as an anti-artificial intelligence play helped the stock tear through the first half of the year as investors grew skeptical of the AI trade. But that sentiment has flipped, and the shares are struggling.
Sentiment: negative
4. Headline: Apple’s Anti-AI Position Suddenly Becomes Stock Market Baggage
Summary: Apple Inc.’s status as an anti-artificial intelligence play helped the stock tear through the first half of the year as investors grew skeptical of the AI trade. But that sentiment has flipped, and the shares are suddenly struggling.
Sentiment: negative
5. Headline: Apple’s $100bn services business starts to feel the cost of antitrust attacks
Summary: Court rulings and new App Store rules are beginning to weigh on one of the iPhone maker’s profitable growth engines
Sentiment: negative
Powered by Brave
Recent Updates
News Summary
As of August 18, 2026. Apple announced significant changes to its app business terms in the European Union following collaboration with the European Commission. The new terms simplify commission structures, replace the Core Technology Fee with a 5% commission on digital transactions outside the App Store, and permit developers to offer alternative payment options alongside Apple In-App Purchase. These changes aim to resolve regulatory disputes and will take effect from October 1, 2026. Additionally, Apple opened its Advanced Manufacturing Center in Houston, Texas, providing training and resources to small- and medium-sized businesses to enhance smart manufacturing capabilities. This facility supports domestic production with plans to start Mac mini production later this year, reflecting Apple's commitment to American manufacturing and innovation.
News Sentiment
The overall sentiment from recent updates is cautiously positive, driven by Apple's proactive regulatory compliance in the EU and strategic investments in domestic manufacturing infrastructure. While regulatory challenges persist, particularly around app store commissions, Apple's collaborative approach mitigates some risks. The opening of the manufacturing center signals long-term operational strengthening. However, broader market concerns about Apple's AI positioning temper enthusiasm, suggesting mixed investor sentiment. The balance of developments indicates a company adapting to regulatory pressures while investing in growth and innovation.
Source List
- https://www.apple.com/newsroom/2026/08/apple-announces-changes-for-apps-in-the-european-union/
- https://www.apple.com/newsroom/2026/08/apple-opens-advanced-manufacturing-center-in-houston/
Analytical Overview
Analysis Summary
Apple’s valuation metrics, including a trailing P/E of 35.34 and forward P/E of 32.28, are elevated relative to industry averages, reflecting premium pricing justified by strong brand equity and growth prospects. The company’s PEG ratio of 1.21 suggests a reasonable balance between price and earnings growth expectations. Revenue growth of 16.4% year-over-year and robust operating cash flow trends indicate a solid growth trajectory supported by diversified product and service lines. Financial health is sound with a total debt to equity ratio of 78.45%, manageable given substantial cash reserves of $62.4 billion and strong free cash flow generation exceeding $106 billion. Sector-specific challenges include regulatory scrutiny on App Store practices and competitive pressures in AI, while opportunities arise from expanding services and manufacturing investments. Market positioning and competitive advantages bolster Apple’s resilience in the technology sector.
Overall Business and Market Assessment
Supporting Factors: Apple’s robust revenue growth of 16.4%, strong cash flow generation exceeding $106 billion, and strategic investments in manufacturing and regulatory compliance
Risk Factors: ongoing antitrust challenges impacting the services segment and evolving market sentiment around AI adoption
SWOT Analysis
Strengths
- Strong brand recognition and market leadership in consumer electronics.
- Robust revenue growth and high profit margins.
- Significant cash reserves and strong free cash flow generation.
- Diversified product and service ecosystem enhancing customer loyalty.
Weaknesses
- High valuation multiples relative to industry peers.
- Dependence on iPhone sales for a substantial portion of revenue.
- Exposure to regulatory scrutiny, particularly in app store operations.
- Limited insider ownership potentially reducing direct management alignment.
Opportunities
- Expansion of services business and subscription models.
- Growth potential from new product categories such as foldables and AI integration.
- Increased domestic manufacturing capabilities supporting supply chain resilience.
- Regulatory changes enabling alternative payment options in the EU.
Threats
- Intensifying competition in AI and consumer technology sectors.
- Ongoing antitrust investigations and regulatory challenges.
- Market sentiment volatility due to technology adoption shifts.
- Potential supply chain disruptions impacting product availability.
Company Description
Apple Inc. designs, manufactures, and markets a wide range of technology products worldwide. These include the iPhone, a line of smartphones; Mac, a line of personal computers; iPad, a line of multi-purpose tablets; and wearables, home, and accessories such as AirPods, Apple Vision Pro, Apple TV, Apple Watch, Beats products, HomePod, as well as Apple branded and third-party accessories. The company operates service platforms including the App Store, Apple Music, and subscription models that provide curated content, cloud services, and digital offerings. Apple Inc. serves individual consumers, businesses, and government sectors through online stores, retail outlets, and partnerships with cellular carriers and resellers. Its products span the information technology sector, impacting mobile communication, personal computing, entertainment, and health monitoring. Founded in 1976 and headquartered in Cupertino, California, Apple Inc. plays a pivotal role in the global technology market by integrating hardware, software, and services into seamless ecosystems.