
Apple Inc (AAPL)
Stock Analysis Report
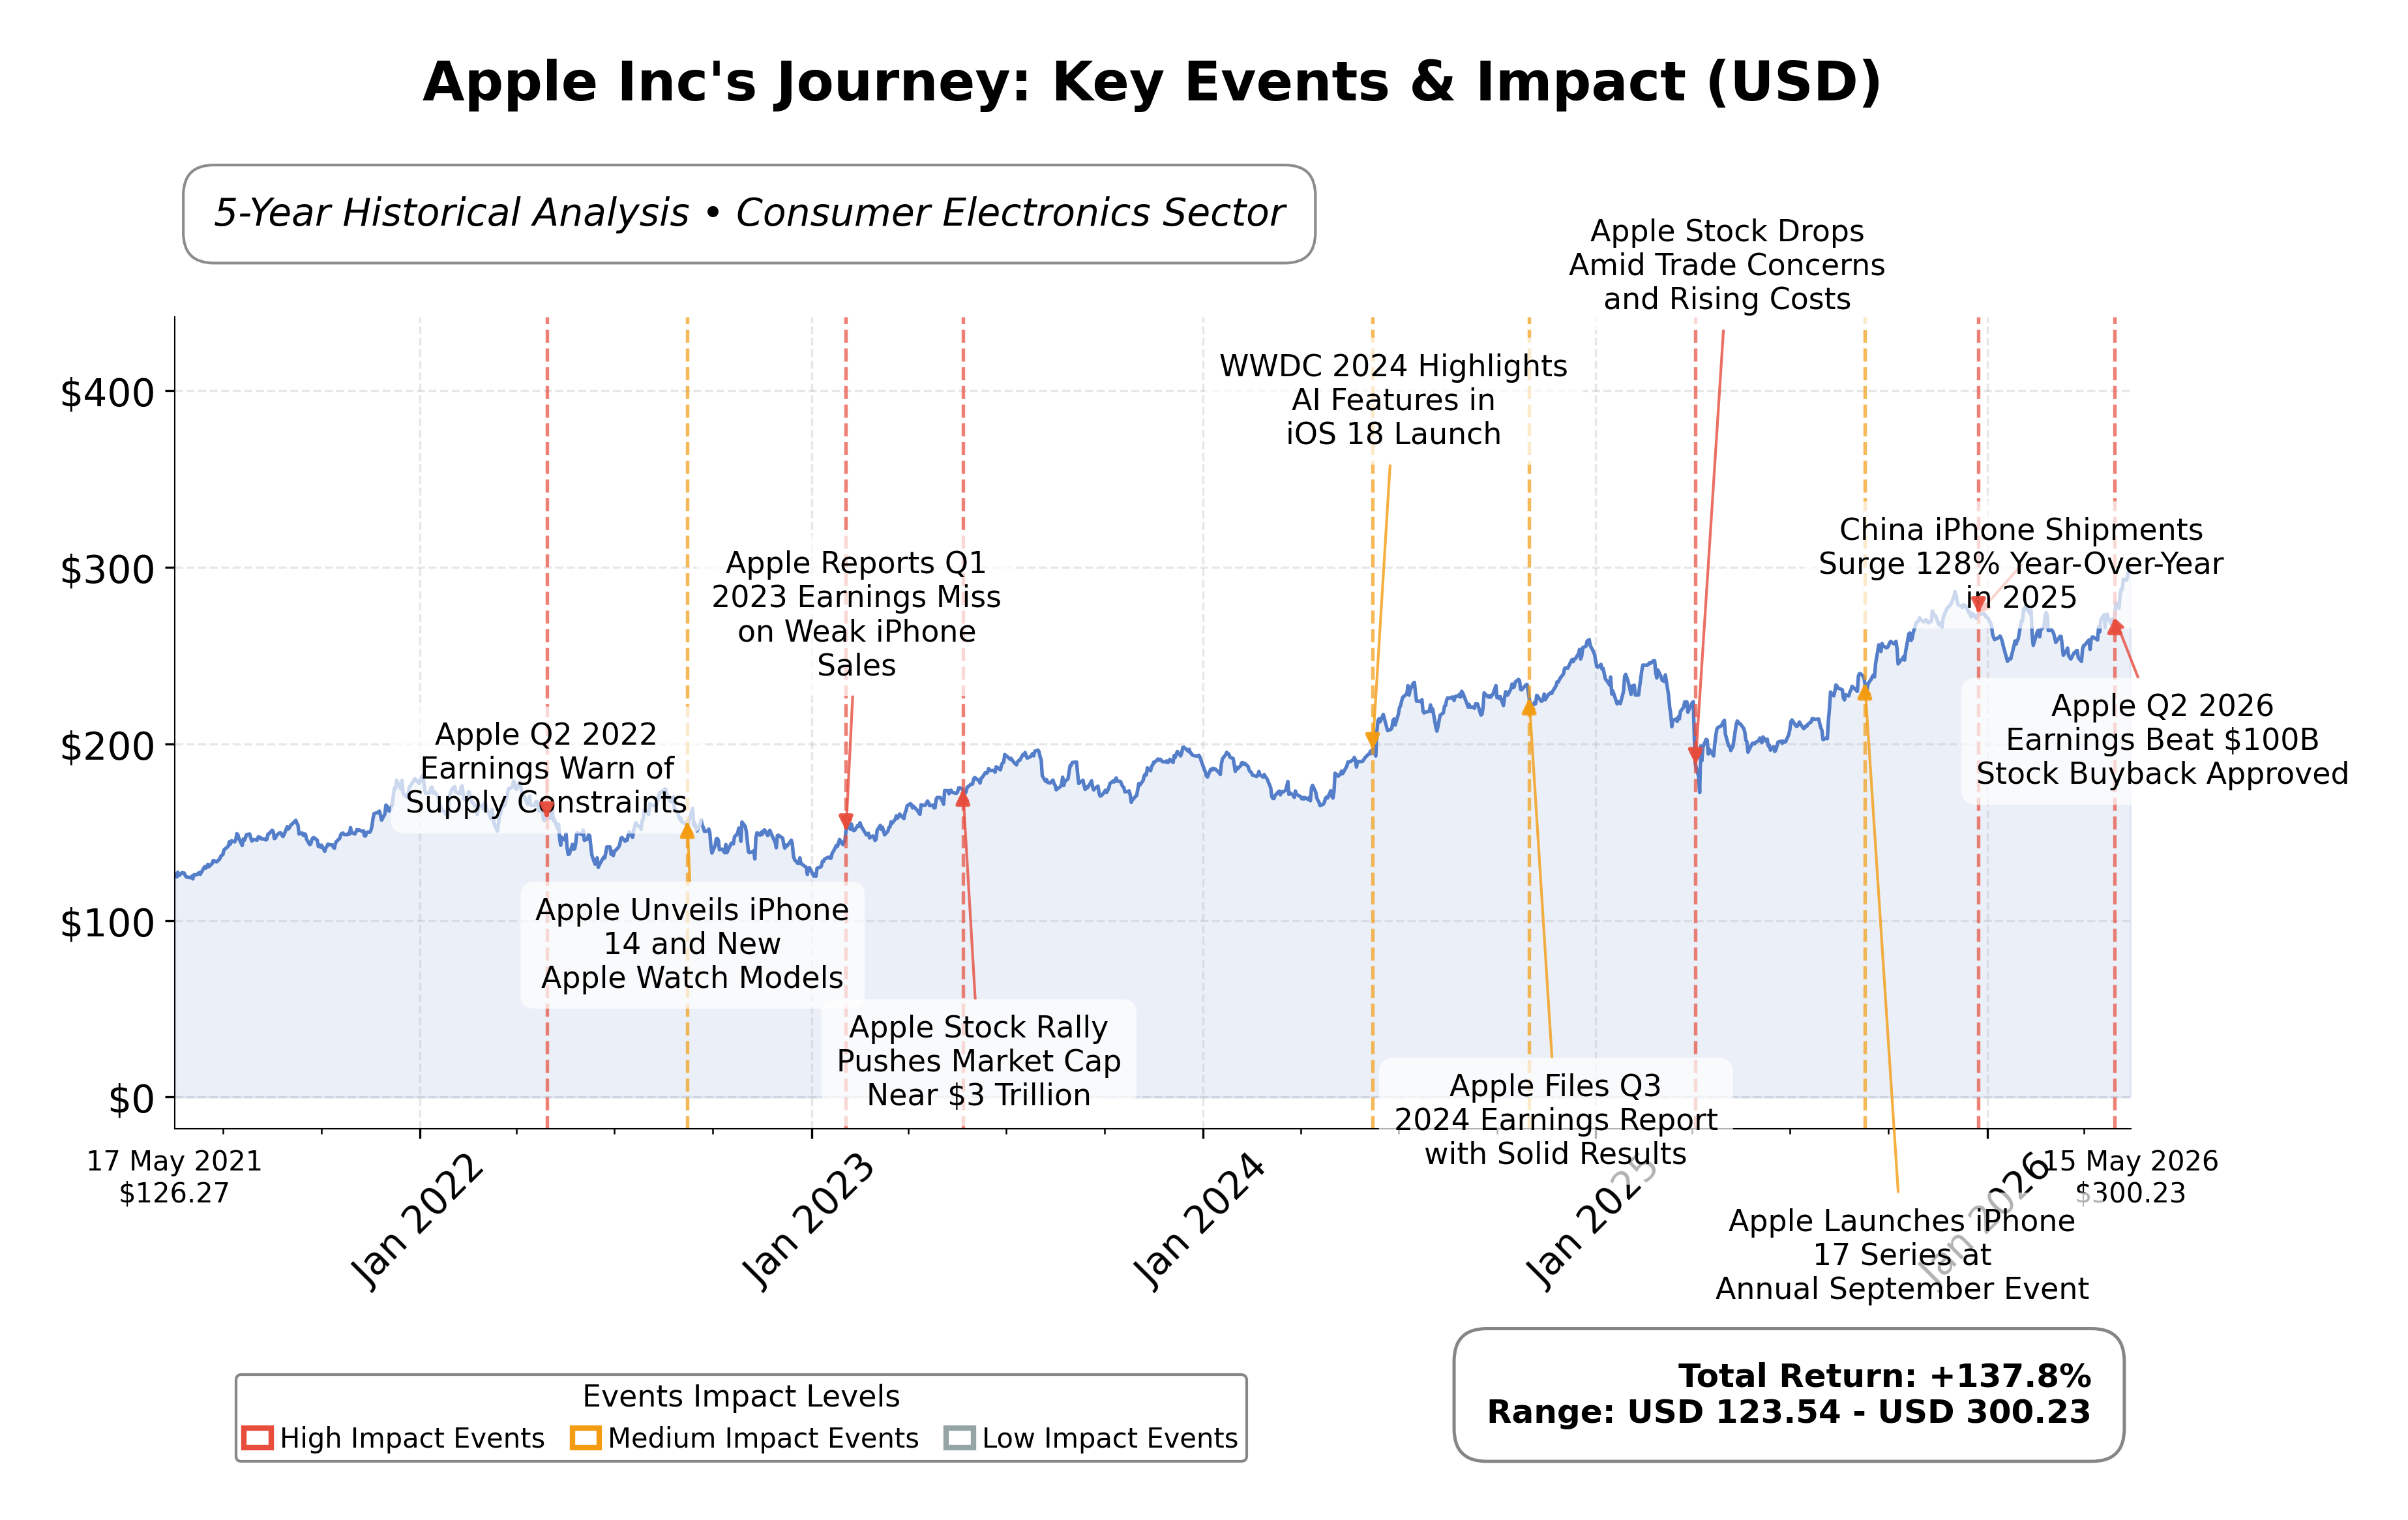
Stock Journey
Key Positives and Key Risks
Pros
- Revenue growth of 16.6% year-over-year demonstrates strong top-line momentum.
- Free cash flow of $101.1 billion TTM supports robust capital allocation including dividends and buybacks.
- Return on equity of 141.5% indicates exceptional profitability and efficient use of shareholder capital.
Cons
- High trailing P/E ratio of 35.47 and price-to-book ratio of 40.40 suggest elevated valuation levels.
- Legal risks related to potential disputes with OpenAI could impact AI strategy and services.
- Debt-to-equity ratio near 79.5% reflects moderate leverage that may constrain financial flexibility.
Disclosure: This information is for general awareness and does not constitute investment advice
Report Summary
Apple Inc. operates as a leading technology company primarily engaged in designing, manufacturing, and marketing consumer electronics and software products globally. Its core offerings include the iPhone, Mac computers, iPad tablets, Apple Watch wearables, and accessories like AirPods, complemented by a suite of digital services such as the App Store, Apple Music, iCloud, and Apple TV+. Listed on NASDAQ under the technology sector, Apple holds a dominant market position with a broad global footprint and a strong ecosystem that integrates hardware and services seamlessly.
Financially, Apple reported trailing twelve months (TTM) revenue of approximately $451.4 billion with a gross margin of 49.3%, operating margin of 32.3%, and a net profit margin of 27.2%. The company’s return on equity (ROE) stands at 141.5%, and return on assets (ROA) is 26.2%, reflecting exceptional profitability and efficient asset utilization. Operating cash flow totaled $140.2 billion TTM, with free cash flow of $101.1 billion, underscoring strong cash generation capabilities supporting ongoing investments and shareholder returns.
Valuation metrics show Apple’s market capitalization at $4.31 trillion, with a trailing price-to-earnings (P/E) ratio of 35.47 and a forward P/E of 30.68, indicating a premium valuation relative to earnings growth prospects. The price-to-book (P/B) ratio is notably high at 40.40, and the enterprise value to EBITDA (EV/EBITDA) ratio is 27.03, suggesting the market prices Apple’s growth and profitability at a substantial premium. The stock trades near its 52-week high of $294.76, currently priced at $300.22, reflecting strong investor demand and momentum.
Apple’s strengths include robust cash flow generation, a low debt-to-equity ratio of approximately 79.5%, and market leadership in consumer electronics and digital services. Key risks involve regulatory scrutiny, competitive pressures in technology innovation, and supply chain constraints. Recent strategic actions include new product launches such as the iPhone 17 series, M4-powered iPad Air, and MacBook Neo, alongside leadership transition plans with Tim Cook moving to Executive Chairman and John Ternus assuming CEO responsibilities.
Technically, Apple’s stock exhibits a bullish trend, trading well above major moving averages with momentum indicators signaling overbought conditions. Recent news highlights ongoing product innovation and strong earnings growth, balanced by potential legal challenges involving AI partnerships. Overall, the data suggests a market environment favoring continued interest and accumulation, tempered by caution around valuation levels and external uncertainties.
Company and Industry Overview
Company Basics
Price Performance
Company Size
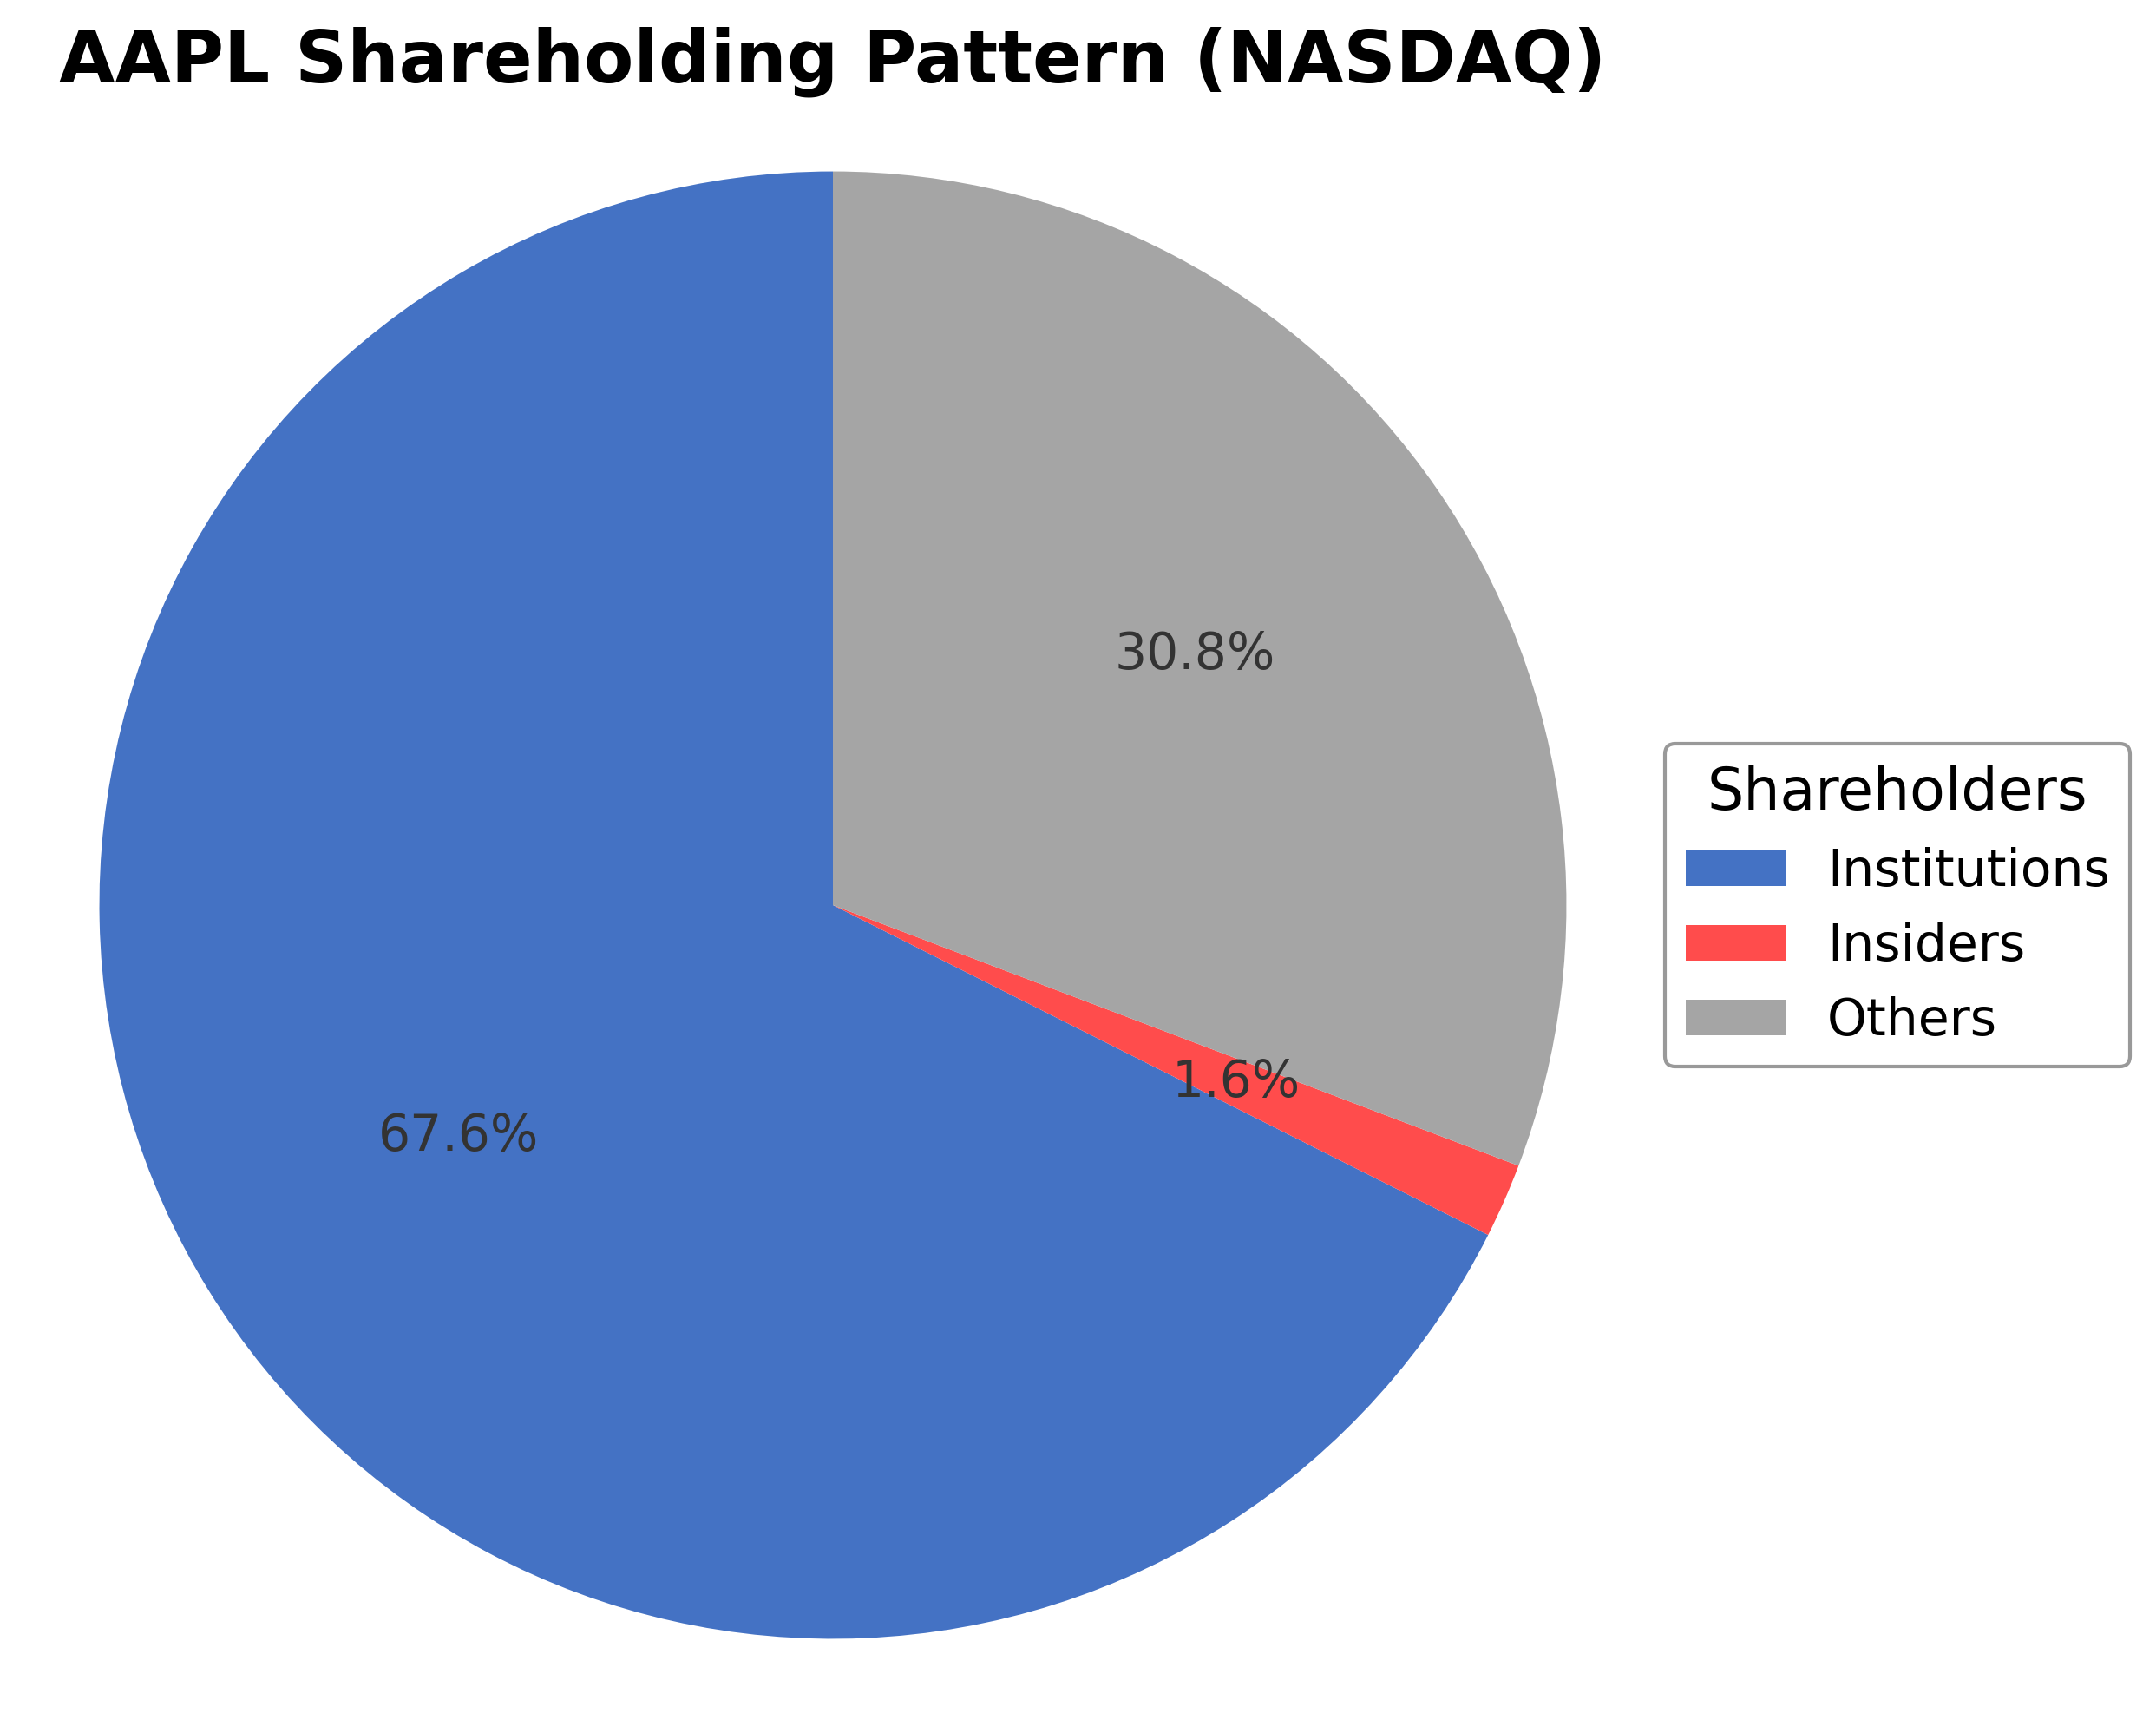
Shareholding Pattern
Sector and Industry Analysis
The global apple sector is a significant segment within the broader agricultural industry, encompassing cultivation, harvesting, distribution, and retail of various apple varieties. The market is expanding steadily, driven by increasing health awareness and demand for organic produce, with growth projected through 2034 across major regions including North America, Europe, and Asia-Pacific. Key players range from multinational corporations to local producers, all competing to capture market share in a landscape influenced by technological advancements and evolving consumer preferences.
Industry trends highlight a shift towards organic and locally sourced apples, alongside innovations in packaging and storage that extend shelf life and reduce post-harvest losses. Competitive dynamics are shaped by rising consumer demand, climatic challenges affecting yields, and intensified rivalry as international firms expand operations, compelling producers to innovate and diversify. Barriers to entry include stringent food safety regulations and the need for investment in resilient farming technologies, while strategic partnerships and alliances are becoming crucial for market penetration and resource optimization.
The regulatory environment is increasingly focused on food safety, quality standards, and sustainability, with stricter compliance requirements influencing production and distribution practices. Trade policies and tariffs, alongside geopolitical tensions, impact supply chains and pricing, necessitating adaptive strategies from market participants. Looking ahead, policy frameworks related to carbon pricing and energy security, combined with technological adoption, will play a pivotal role in shaping the sector’s trajectory and competitive landscape.
Note: Analysis synthesized from industry research, market reports, and regulatory filings. Information is subject to change based on market conditions.
Financial Ratios Dashboard
Illustrative Scenario Analysis
DCF Assumptions:
Method: Two-Stage EPS-Priority Model
Financials
Peer Analysis
| Company Name | Market Cap | P/E Ratio | P/B Ratio | EV/EBITDA | Price to CFO |
|---|---|---|---|---|---|
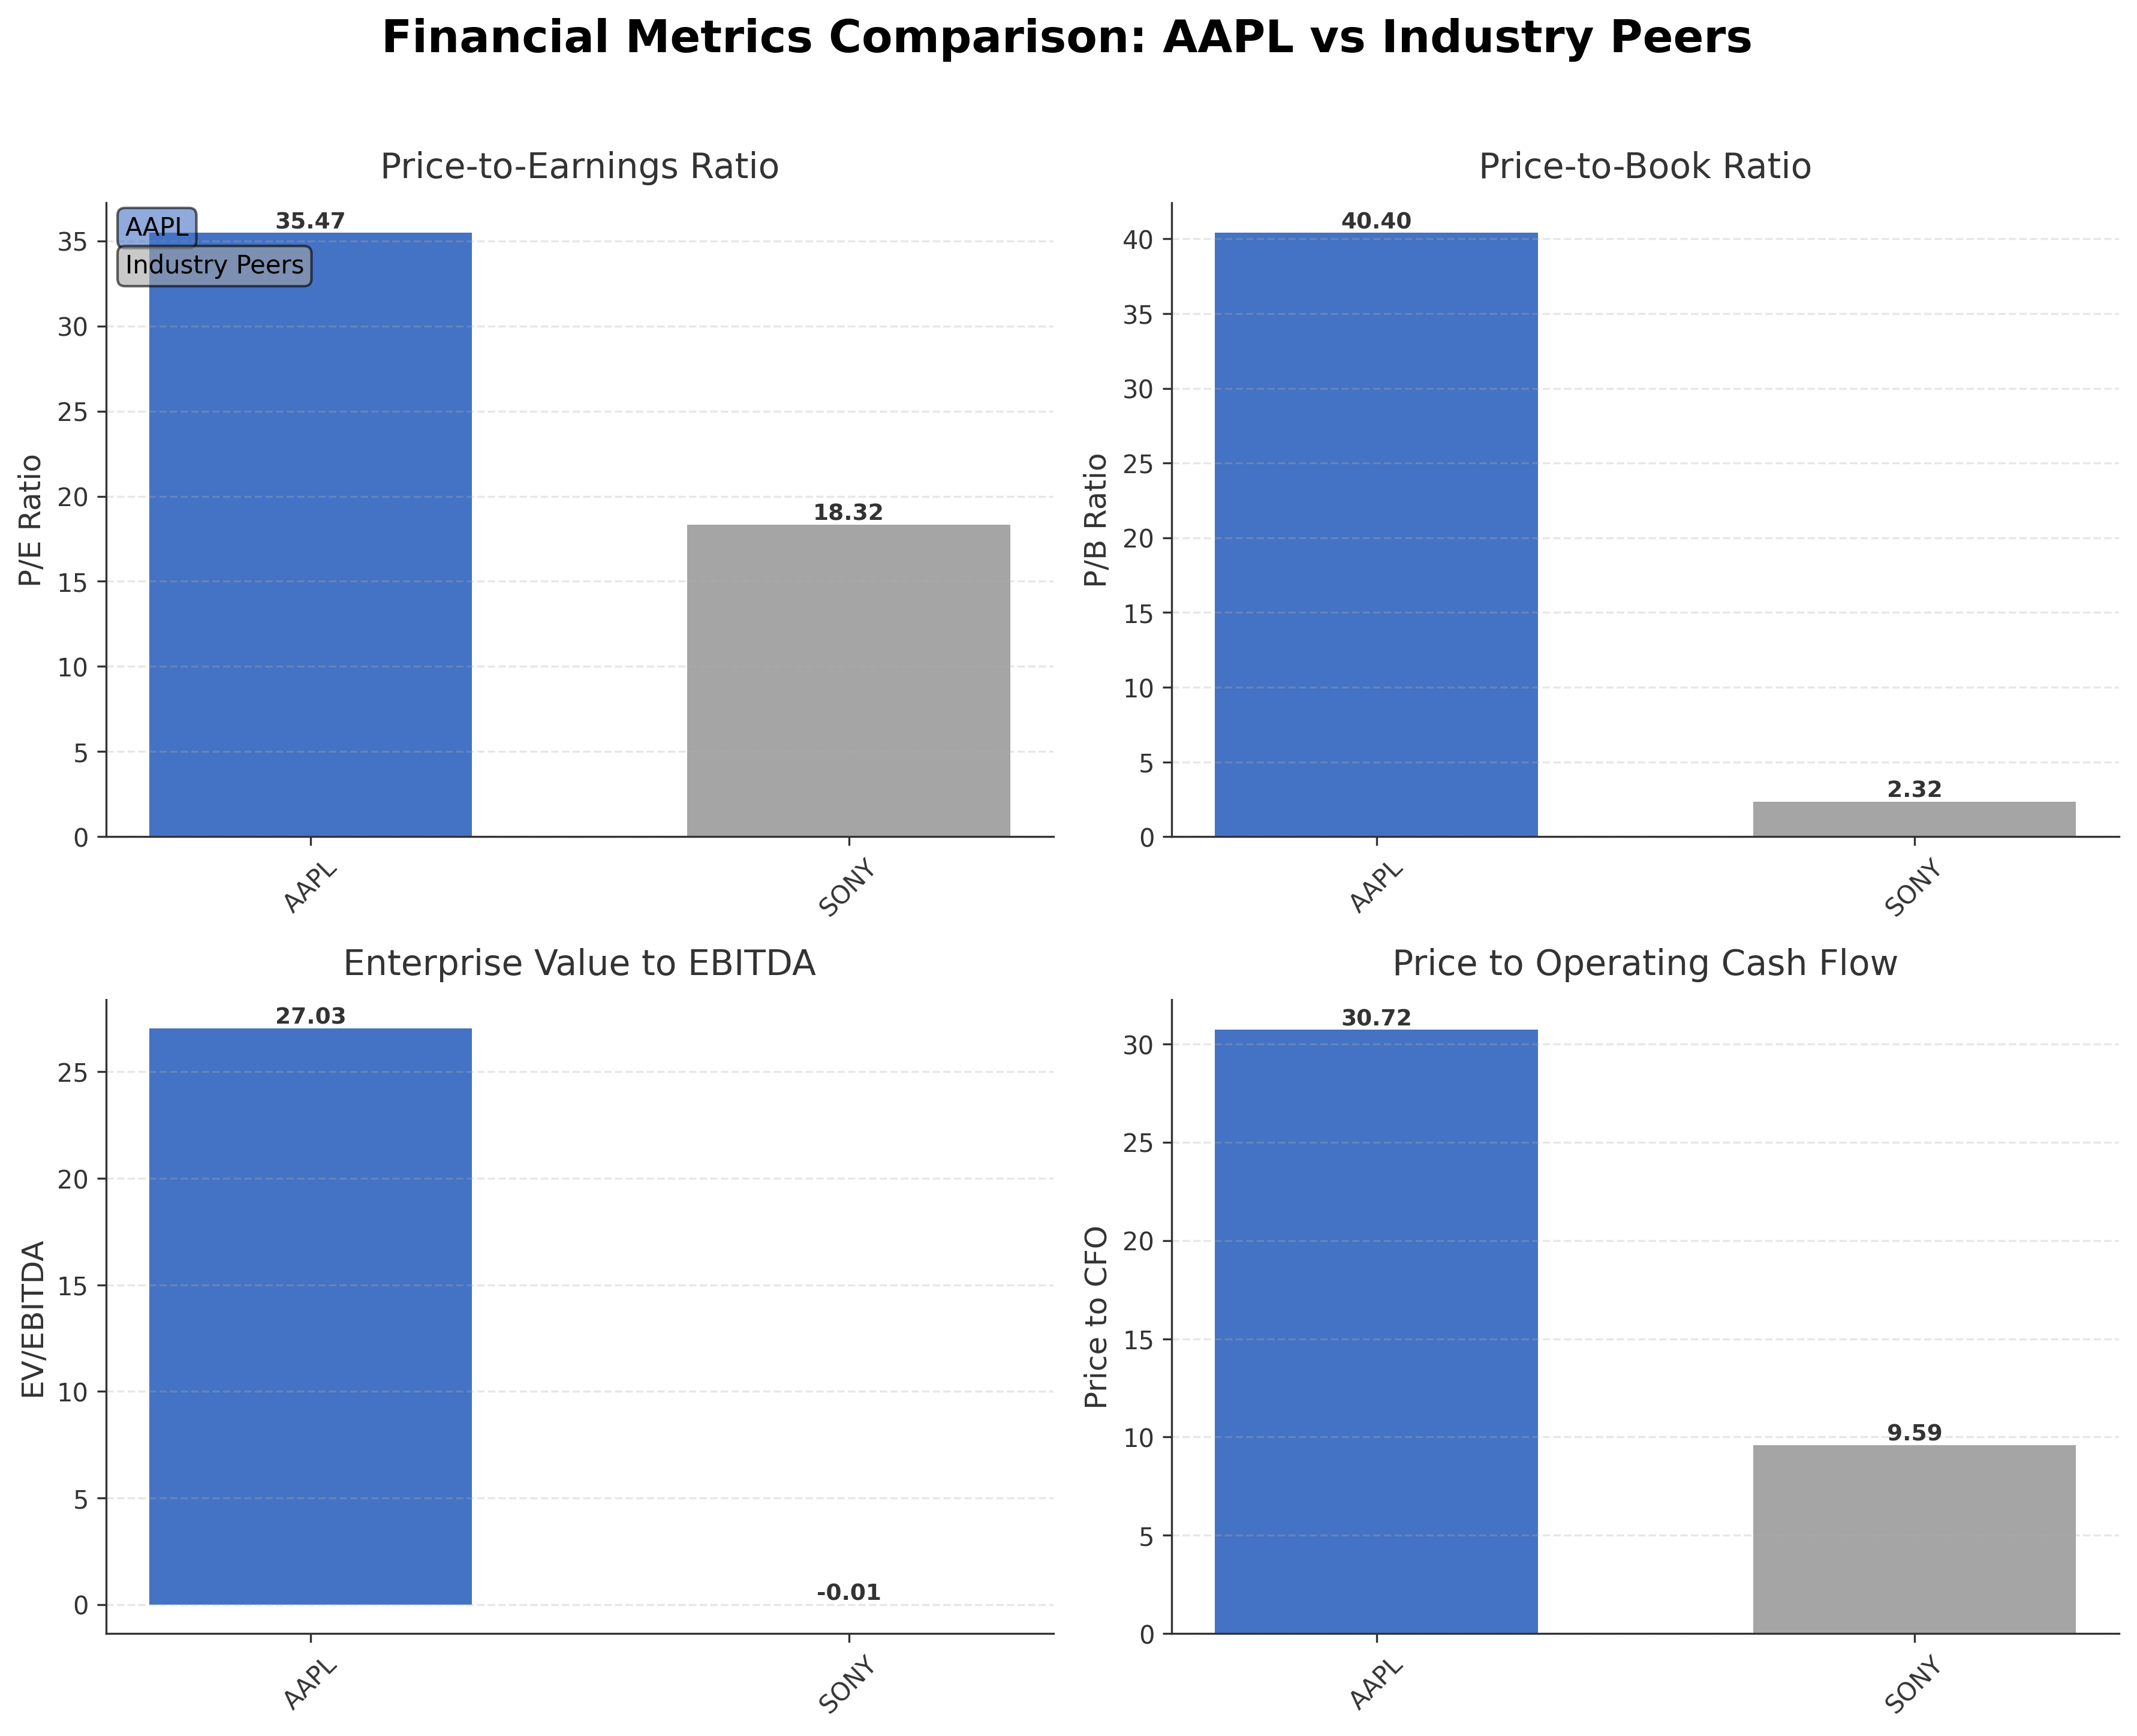
| Apple Inc | $4.31T | 35.47 | 40.40 | 27.03 | 30.72 |
| Sony Group Corporation - Sponsored American Depositary Receipt | $119.04B | 18.32 | 2.32 | -0.01 | 9.59 |
Comparison Analysis: Apple Inc. significantly outpaces its peer Sony Group Corporation in market capitalization, trading at $4.31 trillion compared to Sony's $119.04 billion. Apple's valuation multiples such as P/E (35.47) and P/B (40.40) are markedly higher than Sony's 18.32 and 2.32 respectively, reflecting a premium valuation driven by stronger profitability and growth expectations. Apple’s EV/EBITDA ratio of 27.03 also contrasts with Sony's negative figure, indicating more consistent earnings before interest, taxes, depreciation, and amortization. The return on equity of 1.41% for Apple exceeds Sony’s 0.12%, underscoring superior capital efficiency. Overall, Apple stands as a dominant industry leader with premium valuation metrics relative to regional peers.
Financial Metrics Comparison with Peers
Financial Statements
Comprehensive financial data including income, balance sheet, and cash flow metrics
Income Statement
| fiscal_date | 2025-09-30 | 2024-09-30 | 2023-09-30 | 2022-09-30 | 2021-09-30 |
|---|---|---|---|---|---|
| Sales | 416.16B | 391.04B | 383.29B | 394.33B | 365.82B |
| Cost Of Goods | 220.96B | 210.35B | 214.14B | 223.55B | 212.98B |
| Gross Profit | 195.20B | 180.68B | 169.15B | 170.78B | 152.84B |
| Operating Expense Research And Development | 34.55B | 31.37B | 29.91B | 26.25B | 21.91B |
| Operating Expense Selling General And Administrative | 27.60B | 26.10B | 24.93B | 25.09B | 21.97B |
| Operating Income | 133.05B | 123.22B | 114.30B | 119.44B | 108.95B |
| Other Income Expense | -321.00M | 269.00M | -565.00M | -334.00M | 60.00M |
| Pretax Income | 132.73B | 123.48B | 113.74B | 119.10B | 109.21B |
| Income Tax | 20.72B | 29.75B | 16.74B | 19.30B | 14.53B |
| Net Income | 112.01B | 93.74B | 97.00B | 99.80B | 94.68B |
| Eps Basic | 7.49 | 6.11 | 6.16 | 6.15 | 5.67 |
| Eps Diluted | 7.46 | 6.08 | 6.13 | 6.11 | 5.61 |
| Basic Shares Outstanding | 14.95B | 15.34B | 15.74B | 16.22B | 16.70B |
| Diluted Shares Outstanding | 14.95B | 15.34B | 15.74B | 16.22B | 16.70B |
| Ebit | 133.05B | 123.22B | 114.30B | 119.44B | 111.85B |
| Ebitda | 144.75B | 134.66B | 125.82B | 130.54B | 123.14B |
| Net Income Continuous Operations | 112.01B | 93.74B | 97.00B | 99.80B | 94.68B |
| Non Operating Interest Income | N/A | N/A | 3.75B | 2.83B | 2.84B |
| Non Operating Interest Expense | N/A | N/A | 3.93B | 2.93B | 2.65B |
Source: Financial statements and regulatory filings
Balance Sheet
| fiscal_date | 2025-09-30 | 2024-09-30 | 2023-09-30 | 2022-09-30 | 2021-09-30 |
|---|---|---|---|---|---|
| Cash And Cash Equivalents | 35.93B | 29.94B | 29.96B | 23.65B | 34.94B |
| Accounts Receivable | 39.78B | 33.41B | 29.51B | 28.18B | 26.28B |
| Total Assets | 359.24B | 364.98B | 352.58B | 352.75B | 351.00B |
| Total Liabilities | 285.51B | 308.03B | 290.44B | 302.08B | 287.91B |
| Long Term Debt | 78.33B | 85.75B | 95.28B | 109.71B | 119.38B |
| Shareholders Equity | 73.73B | 56.95B | 62.15B | 50.67B | 63.09B |
Source: Financial statements and regulatory filings
Cash Flow Statement
| fiscal_date | 2025-09-30 | 2024-09-30 | 2023-09-30 | 2022-09-30 | 2021-09-30 |
|---|---|---|---|---|---|
| Operating Activities Net Income | 112.01B | 93.74B | 97.00B | 99.80B | 94.68B |
| Operating Activities Depreciation | 11.70B | 11.45B | 11.52B | 11.10B | 11.28B |
| Operating Activities Stock Based Compensation | 12.86B | 11.69B | 10.83B | 9.04B | 7.91B |
| Operating Activities Other Non Cash Items | -89.00M | -2.27B | -2.23B | 1.01B | -4.92B |
| Operating Activities Accounts Receivable | -7.03B | -5.14B | -417.00M | -9.34B | -14.03B |
| Operating Activities Accounts Payable | 902.00M | 6.02B | -1.89B | 9.45B | 12.33B |
| Operating Activities Other Assets Liabilities | -18.87B | 2.77B | -4.27B | 1.57B | -1.53B |
| Operating Activities Operating Cash Flow | 111.48B | 118.25B | 110.54B | 123.52B | 100.94B |
| Investing Activities Capital Expenditures | -12.71B | -9.45B | -10.96B | -10.71B | -11.09B |
| Investing Activities Purchase Of Investments | -24.41B | -48.66B | -29.51B | -76.92B | -109.56B |
| Investing Activities Sale Of Investments | 53.80B | 62.35B | 45.51B | 67.36B | 106.48B |
| Investing Activities Other Investing Activity | -1.48B | -1.31B | -1.34B | -2.09B | -385.00M |
| Investing Activities Investing Cash Flow | 15.20B | 2.94B | 3.71B | -22.66B | -14.58B |
| Financing Activities Long Term Debt Issuance | 4.48B | 0.00 | 5.23B | 5.46B | 20.39B |
| Financing Activities Long Term Debt Payments | -10.93B | -9.96B | -11.15B | -9.54B | -8.75B |
| Financing Activities Short Term Debt Issuance | -2.03B | 3.96B | -3.98B | 3.96B | 1.02B |
| Financing Activities Common Stock Repurchase | -90.71B | -94.95B | -77.55B | -89.40B | -85.97B |
| Financing Activities Common Dividends | -15.42B | -15.23B | -15.03B | -14.84B | -14.47B |
| Financing Activities Other Financing Charges | -6.07B | -5.80B | -6.01B | -6.38B | -5.58B |
| Financing Activities Financing Cash Flow | -120.69B | -121.98B | -108.49B | -110.75B | -92.25B |
| End Cash Position | 35.93B | 29.94B | 30.74B | 24.98B | 35.93B |
| Income Tax Paid | 43.37B | 26.10B | 18.68B | 19.57B | 25.39B |
| Free Cash Flow | 98.77B | 108.81B | 99.58B | 111.44B | 92.95B |
| Interest Paid | N/A | N/A | 3.80B | 2.87B | 2.69B |
| Operating Activities Deferred Taxes | N/A | N/A | N/A | 895.00M | -4.77B |
| Investing Activities Net Acquisitions | N/A | N/A | N/A | -306.00M | -33.00M |
| Financing Activities Common Stock Issuance | N/A | N/A | N/A | N/A | 1.10B |
Source: Financial statements and regulatory filings
Technical Analysis
Key Insights
- Apple's stock is currently in a strong uptrend, trading above its 10-day, 50-day, and 200-day moving averages, indicating sustained bullish momentum.
- Key support levels are identified near $260 and $257, corresponding to the 50-day and 200-day moving averages, while resistance is observed around the recent high near $295-$300.
- The stock is trading approximately 8.7% above the 20-day SMA, 13.9% above the 50-day SMA, and 16.7% above the 200-day SMA, reflecting strong upward price momentum.
- Momentum indicators show the RSI at 73.27, signaling overbought conditions; MACD remains positive but may be approaching a peak; Stochastic oscillator also indicates elevated momentum.
- Across daily, weekly, and monthly timeframes, the trend remains bullish with consistent higher highs and higher lows, though short-term overextension suggests potential for consolidation.
- Current technical setup suggests a scenario where the stock may continue to test new highs but faces increased risk of short-term pullbacks or volatility due to stretched momentum indicators.
Trending News
1. Headline: Viking Global Investors Lp Reports Share Stake Of 3.6 Million Shares In Apple - SEC Filing — TradingView News
Summary: Search · Get started · Viking Global Investors Lp Reports Share Stake Of 3.6 Million Shares In Apple - SEC Filing · RefinitivLess than 1 min read · AAPLMETATSLA · Login or create a forever free account to read this news · Let's go · Compare charts · Analyze on Supercharts · Latest news
Sentiment: neutral
2. Headline: Intel Stock (NASDAQ:INTC) Plunges as Apple Deal Looks Focused on Legacy Chips - TipRanks.com
Summary: Chip stock Intel ($INTC) was on top of the world recently as word emerged that Apple ($AAPL) was looking to team up with Intel to produce chips. New reports suggest...
Sentiment: positive
3. Headline: Rep. John McGuire Purchases Shares of Apple Inc. (NASDAQ:AAPL)
Summary: Representative John McGuire (Republican-Virginia) recently bought shares of Apple Inc. (NASDAQ:AAPL). In a filing disclosed on May 13th, the Representative disclosed that they had bought between $1,001 and $15,000 in Apple stock on April 15th. The trade occurred in the Representative's "MERRILL LYNC
Sentiment: neutral
4. Headline: Cerebras IPO Stock Pop; Apple-OpenAI Drama — The Information
Summary: This was quite the day. OpenAI is jumping up and down about its unhappiness with Apple (it’s doubtful Tim Cook is shaking in his boots). Big telecom threw down the gauntlet to Elon Musk and Amazon (not that they should worry). We get to both news items lower down.
Sentiment: negative
5. Headline: Apple stock keeps surging to new highs — it’s more than just the iPhone
Summary: Apple stock continues to hit new record highs, extending this year’s impressive rebound. Evercore ISI sees the momentum continuing for some time, and it’s about more than just iPhone sales. Analyst Amit Daryanani raised his price target for Apple to $365 from $330 on Thursday, implying roughly 22% upside from today. ... Daryanani’s increased ...
Sentiment: positive
Recent Updates
News Summary
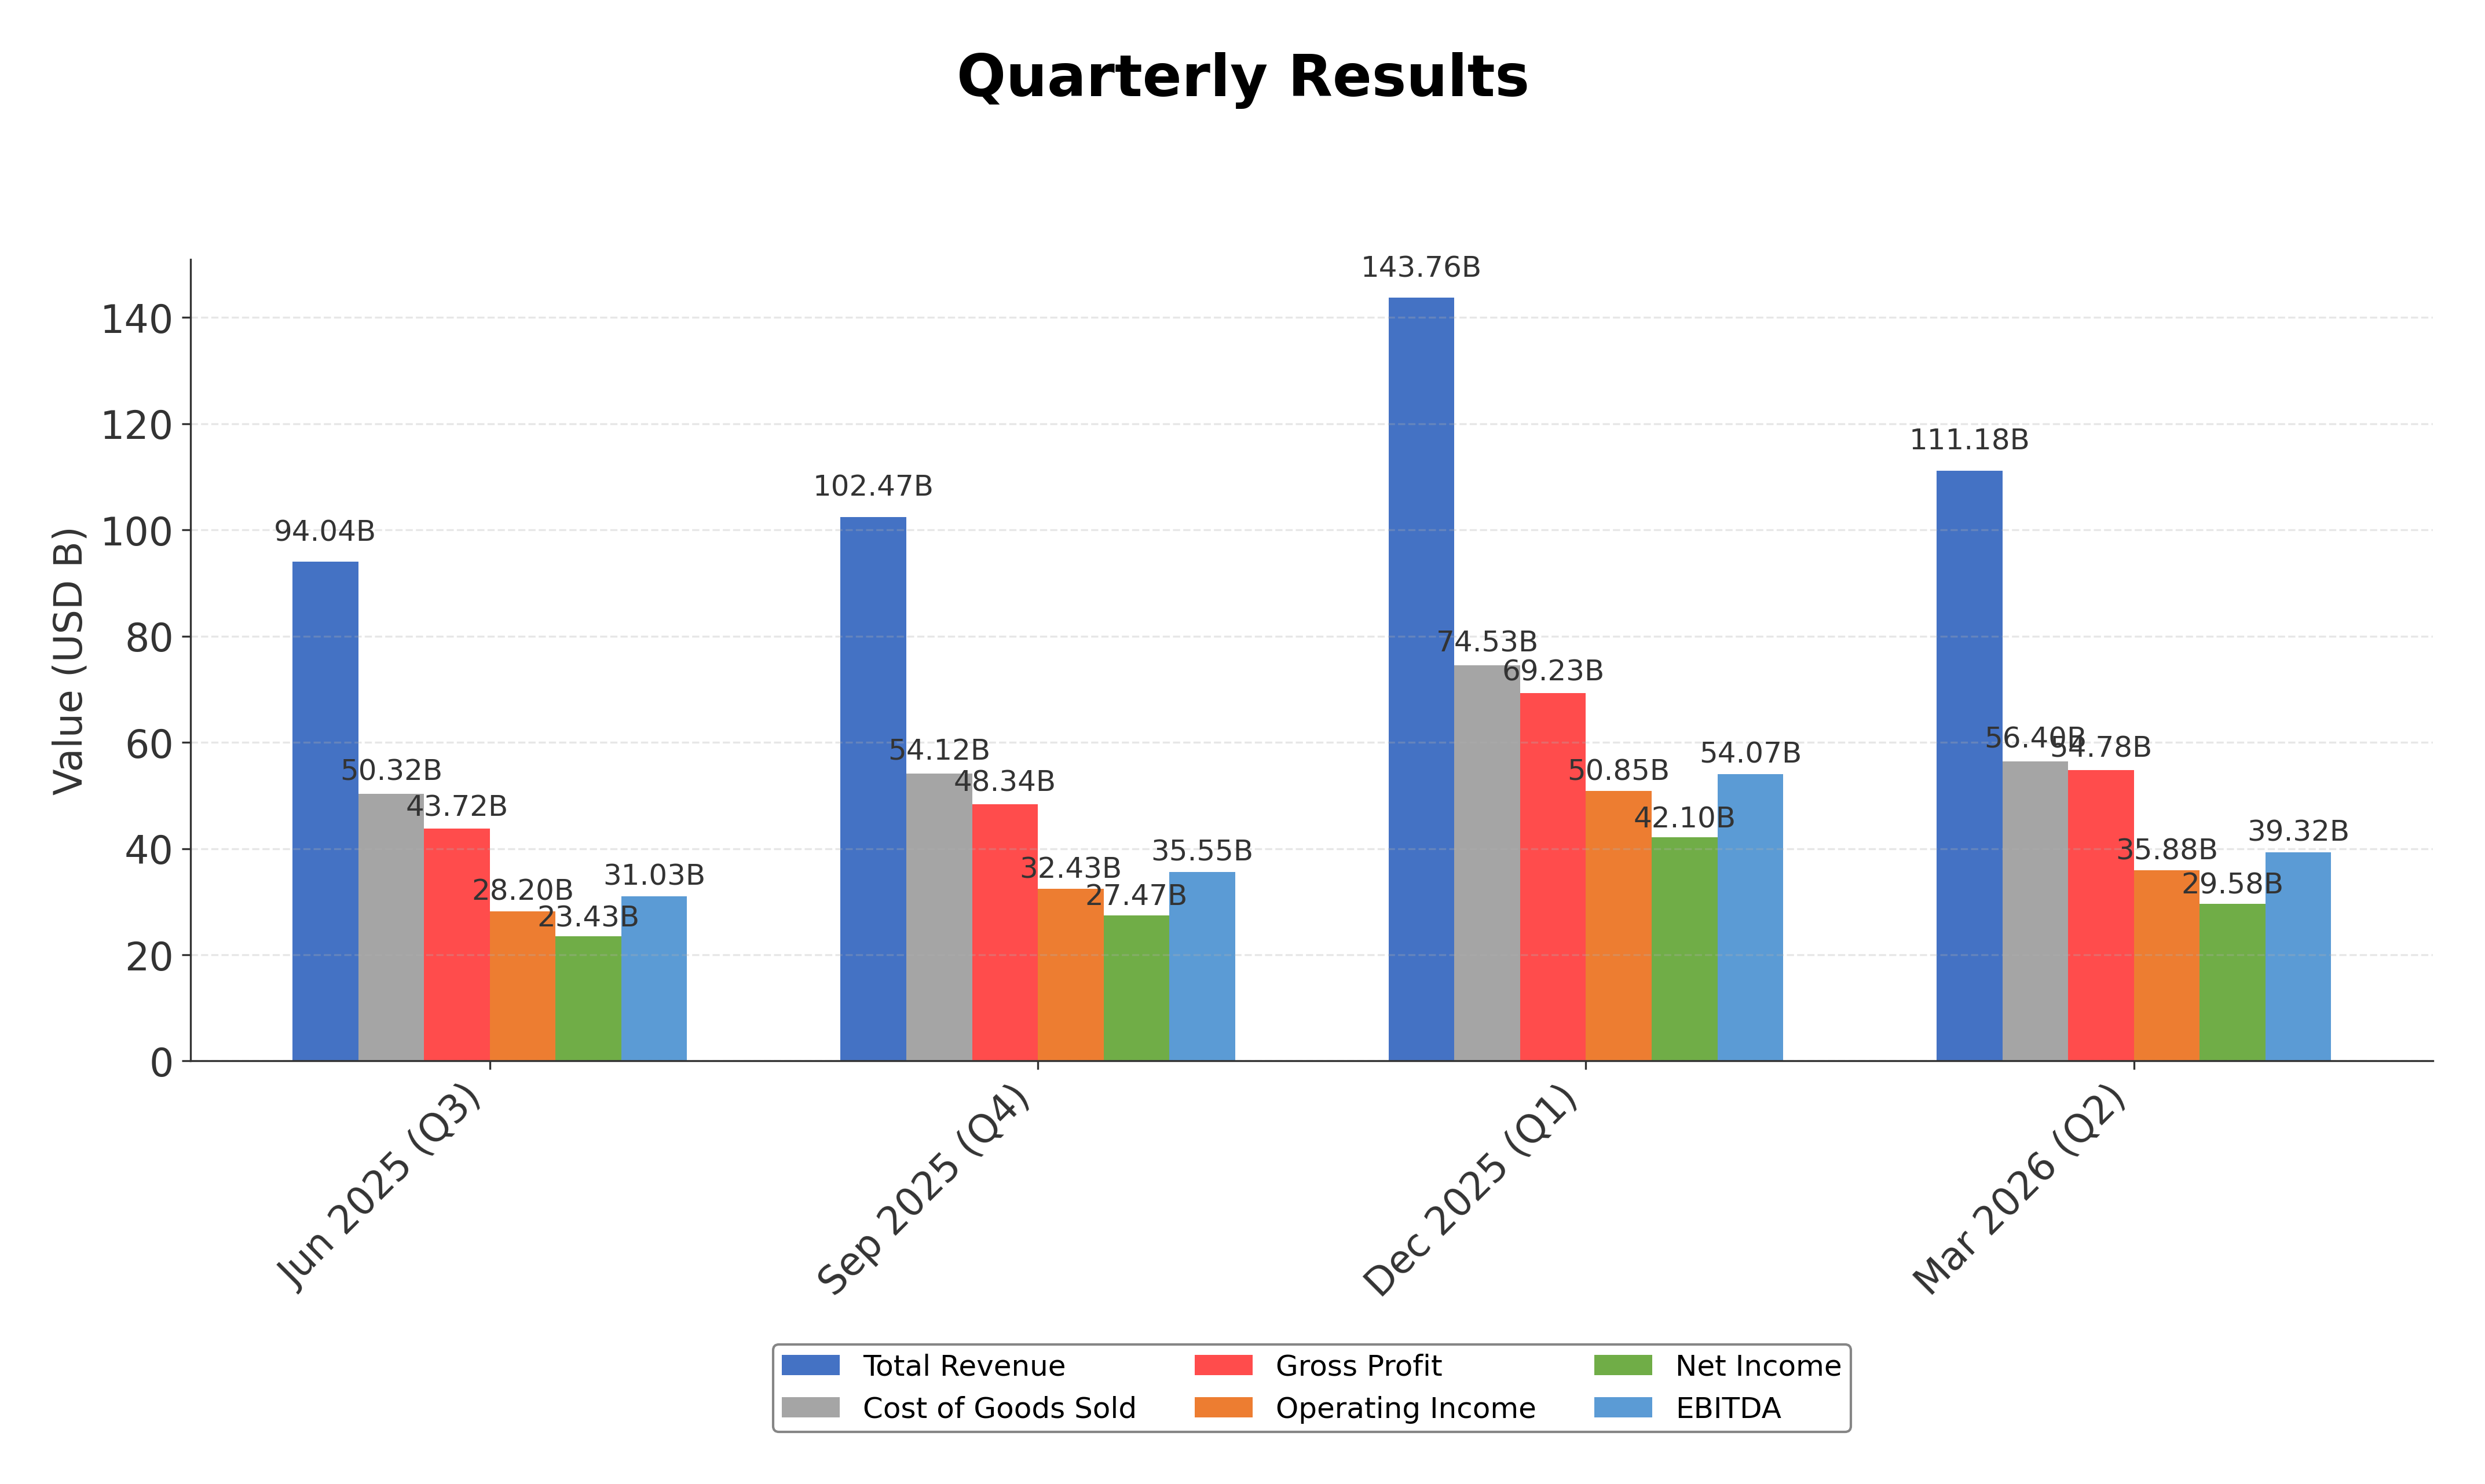
As of April 30, 2026. Apple reported its fiscal 2026 second quarter results with record revenue of $111.2 billion, marking a 17% increase year-over-year, and diluted earnings per share of $2.01, up 22%. The quarter was driven by strong demand for the iPhone 17 lineup and record Services revenue. The company announced a 4% increase in its quarterly dividend to $0.27 per share and authorized an additional $100 billion share repurchase program. Product innovation continued with launches including the iPhone 17e, M4-powered iPad Air, and MacBook Neo. CEO Tim Cook will transition to Executive Chairman, with John Ternus named as the new CEO, signaling a leadership change. Additionally, Apple is preparing a major iPhone software update featuring a redesigned Camera app and enhanced Siri capabilities to improve user experience.
News Sentiment
The overall sentiment from recent updates is predominantly positive, supported by strong financial results, record revenue growth, and robust product launches. The dividend increase and substantial share repurchase authorization further reinforce confidence in Apple's cash flow and capital allocation strategy. Leadership transition news has been neutral, reflecting orderly succession planning. Some negative sentiment arises from legal tensions with OpenAI, which introduces potential risks to Apple's AI integration efforts. However, this is balanced by positive momentum in software innovation and strategic partnerships, resulting in a cautiously optimistic outlook grounded in solid operational performance.
Source List
- https://stocktwits.com/news-articles/markets/equity/aapl-stock-slips-from-record-highs-as-legal-action-threatens-open-ai-alliance-report/cZX16MNReSW
Analytical Overview
Analysis Summary
Apple’s valuation metrics, including a trailing P/E of 35.47 and forward P/E of 30.68, exceed the industry average P/E of 35.47, reflecting a premium valuation justified by strong earnings growth and market leadership. The PEG ratio of 1.58 indicates moderate growth expectations relative to price, aligning with the company’s robust revenue growth of 16.6% year-over-year and consistent cash flow generation exceeding $101 billion in free cash flow TTM. Financial health appears solid with a manageable debt-to-equity ratio near 79.5% and a current ratio of 1.07, supported by substantial cash reserves of $68.5 billion. Sector-specific opportunities include expanding services revenue and AI integration, while challenges involve supply chain constraints and regulatory scrutiny. Considering Apple’s global market positioning and competitive advantages, the company remains well-placed to capitalize on evolving consumer technology trends.
Overall Business and Market Assessment
Supporting Factors: Key supporting factors include record revenue and EPS growth, strong cash flow generation, and successful product innovation driving market leadership. Risks to monitor encompass potential legal disputes related to AI partnerships, regulatory pressures, and valuation premium that may limit upside. The appropriate investment timeframe is medium to long-term, given the company’s strategic initiatives and stable financial foundation. Overall, Apple presents a balanced profile with robust fundamentals tempered by external uncertainties and elevated valuation metrics.
Risk Factors: No data
SWOT Analysis
Strengths
- Market leadership in consumer electronics and integrated services.
- Strong profitability with high gross and net margins.
- Robust cash flow generation supporting dividends and buybacks.
- Extensive global presence and diversified product ecosystem.
Weaknesses
- High valuation multiples relative to industry peers.
- Dependence on iPhone sales for a significant portion of revenue.
- Moderate debt levels with a debt-to-equity ratio near 79.5%.
- Potential vulnerability to supply chain disruptions.
Opportunities
- Expansion of services and subscription-based revenue streams.
- Advancements in AI and software integration across devices.
- Growth in emerging markets and new product categories.
- Strategic partnerships and acquisitions to enhance technology.
Threats
- Regulatory scrutiny and antitrust investigations.
- Intense competition in technology and consumer electronics.
- Legal disputes impacting AI collaborations and intellectual property.
- Macroeconomic uncertainties affecting consumer spending.
Company Description
Apple Inc. is a leading technology company renowned for designing, manufacturing, and marketing innovative hardware and software products for consumers and businesses worldwide. Its flagship product, the iPhone, accounts for the majority of sales, serving as the central hub of an expansive ecosystem that includes Mac computers, iPad tablets, Apple Watch wearables, and accessories like AirPods. Apple Inc. also offers a suite of services such as the App Store, Apple Music, iCloud, Apple TV+, and Apple Fitness+, providing digital content, cloud storage, and subscription-based platforms. Operating in the consumer electronics industry within the technology sector, the company employs approximately 166,000 people and maintains a broad global presence through online stores, retail outlets, and partnerships with carriers and resellers. With a substantial market capitalization reflecting its scale, Apple Inc. plays a pivotal role in shaping consumer technology trends, emphasizing seamless integration across devices and services to enhance user experience and productivity.