
Apple Inc (AAPL)
Stock Analysis Report
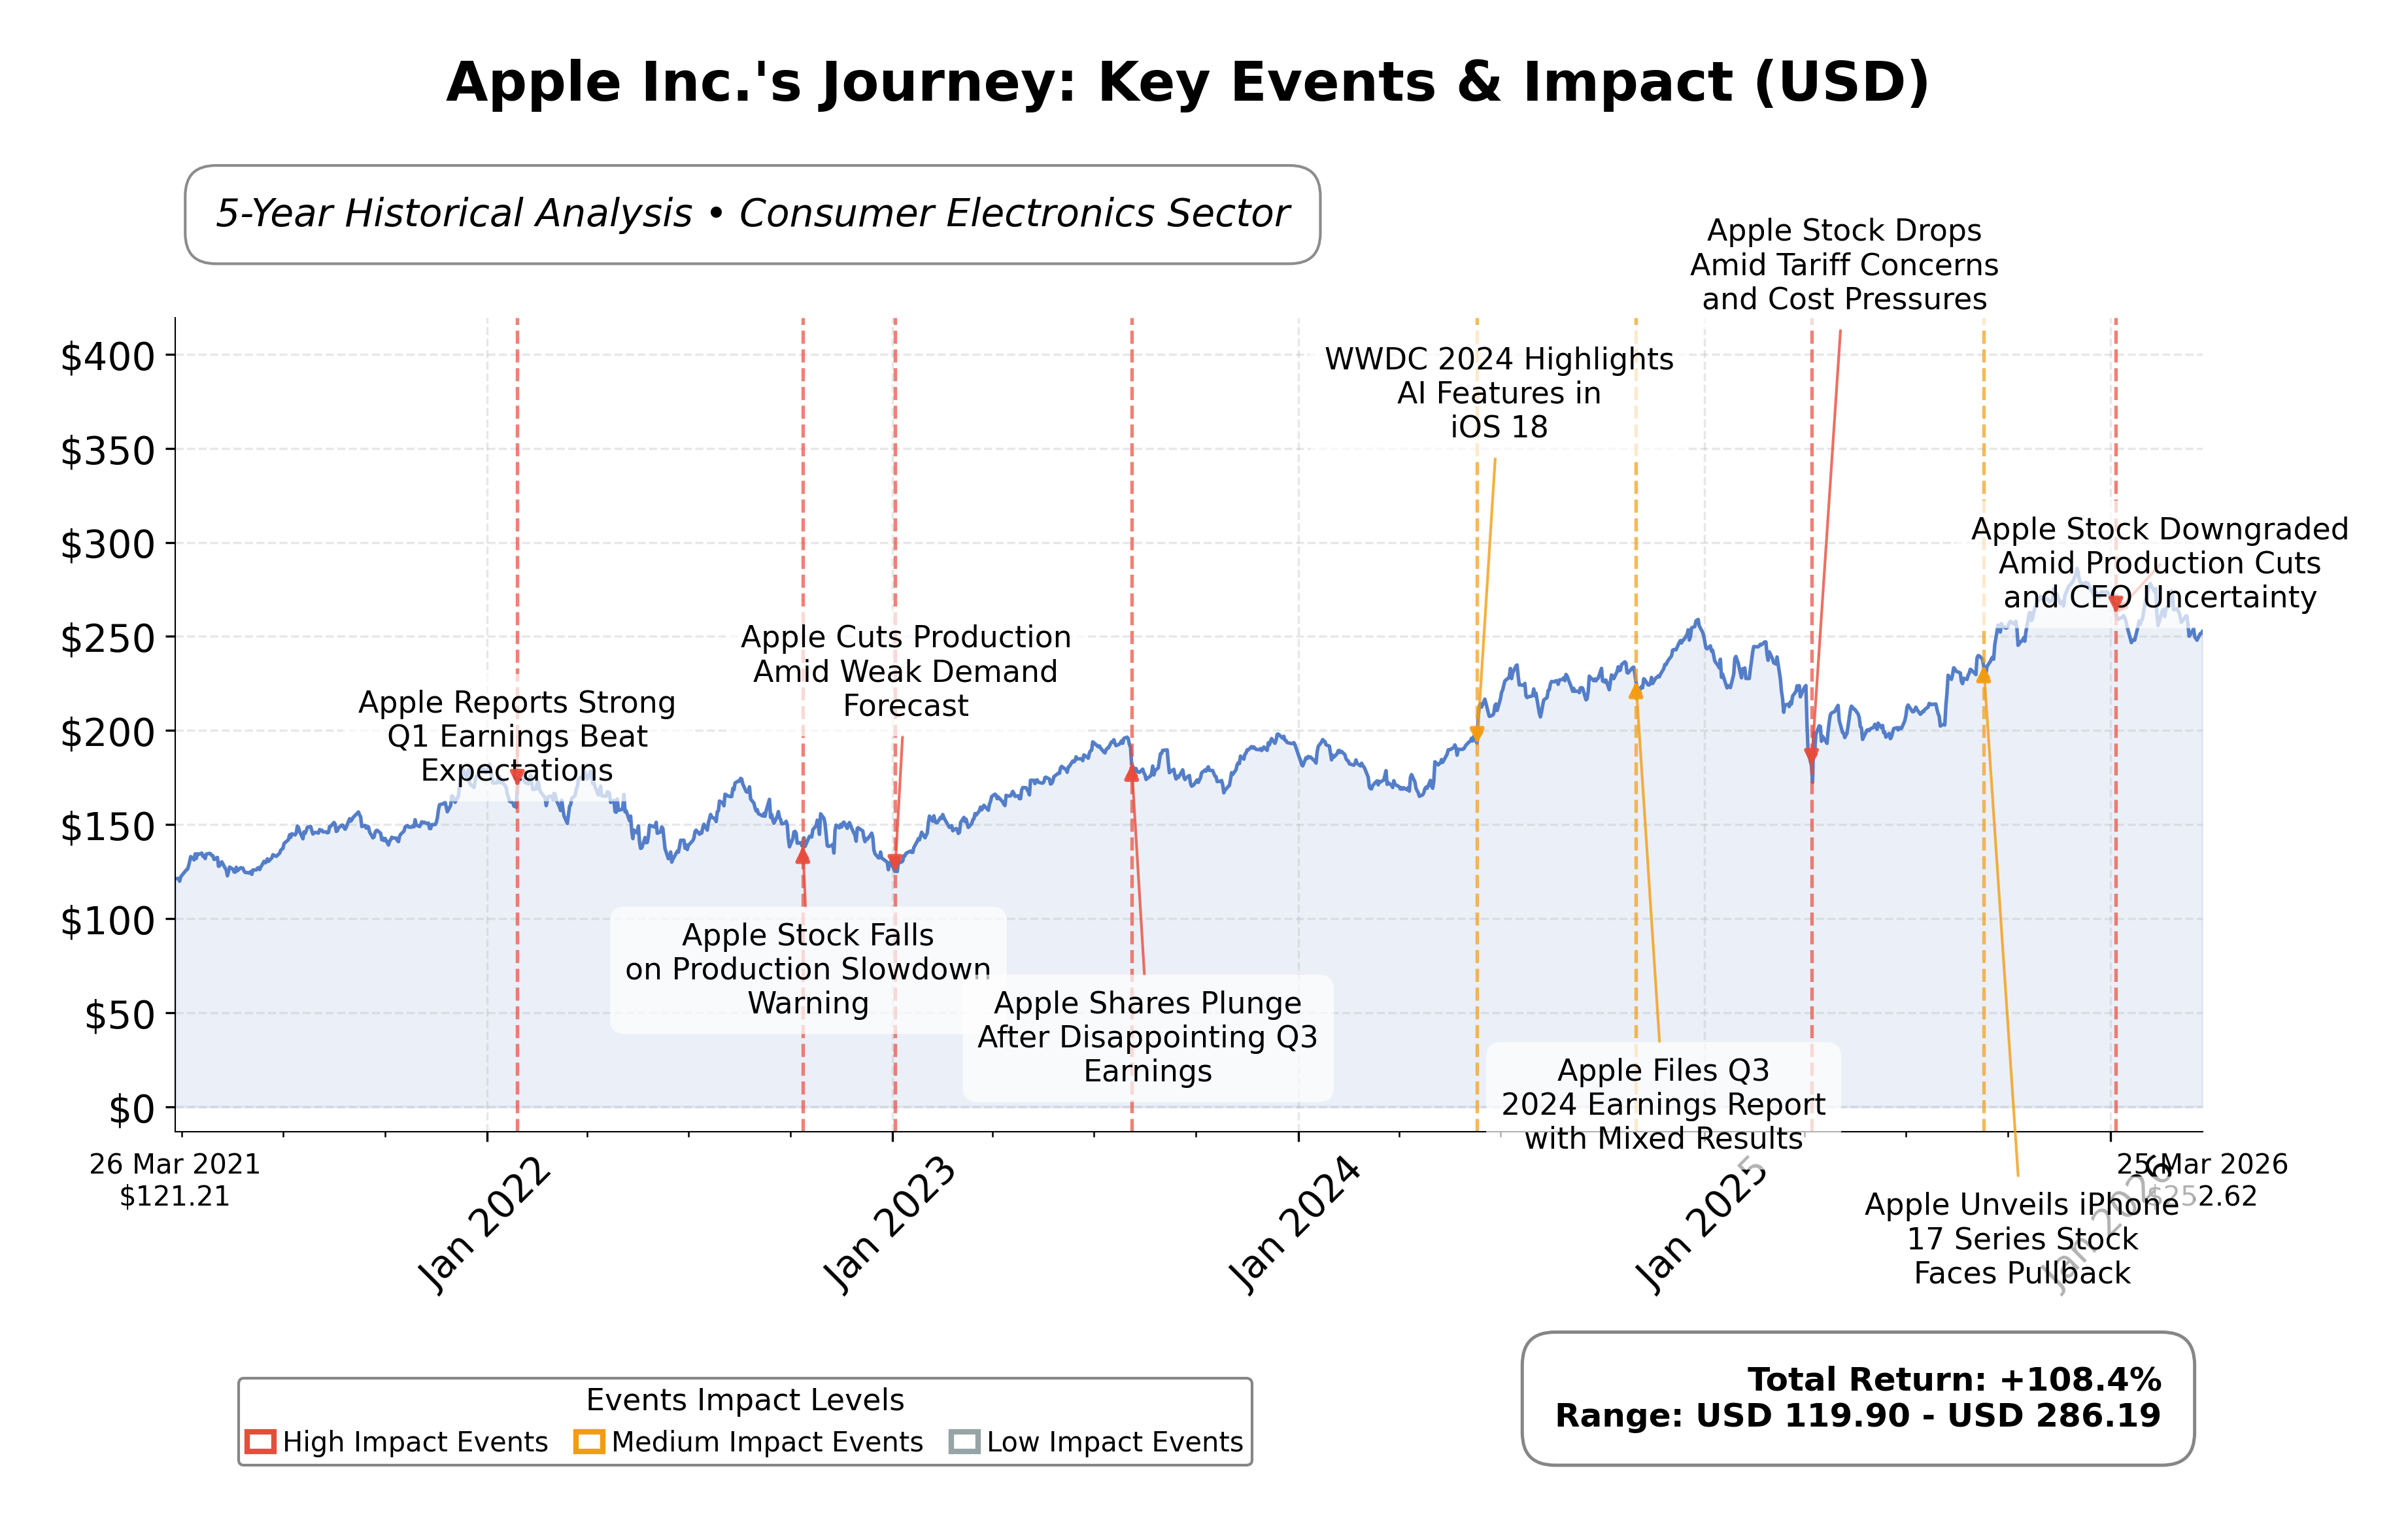
Stock Journey
Key Positives and Key Risks
Pros
- Market capitalization of $3.64 trillion underscores Apple's dominant industry position and scale.
- Strong quarterly revenue growth of 15.7% reflects robust demand and growth momentum.
- Operating cash flow of approximately $135.5 billion TTM supports financial flexibility and investment capacity.
Cons
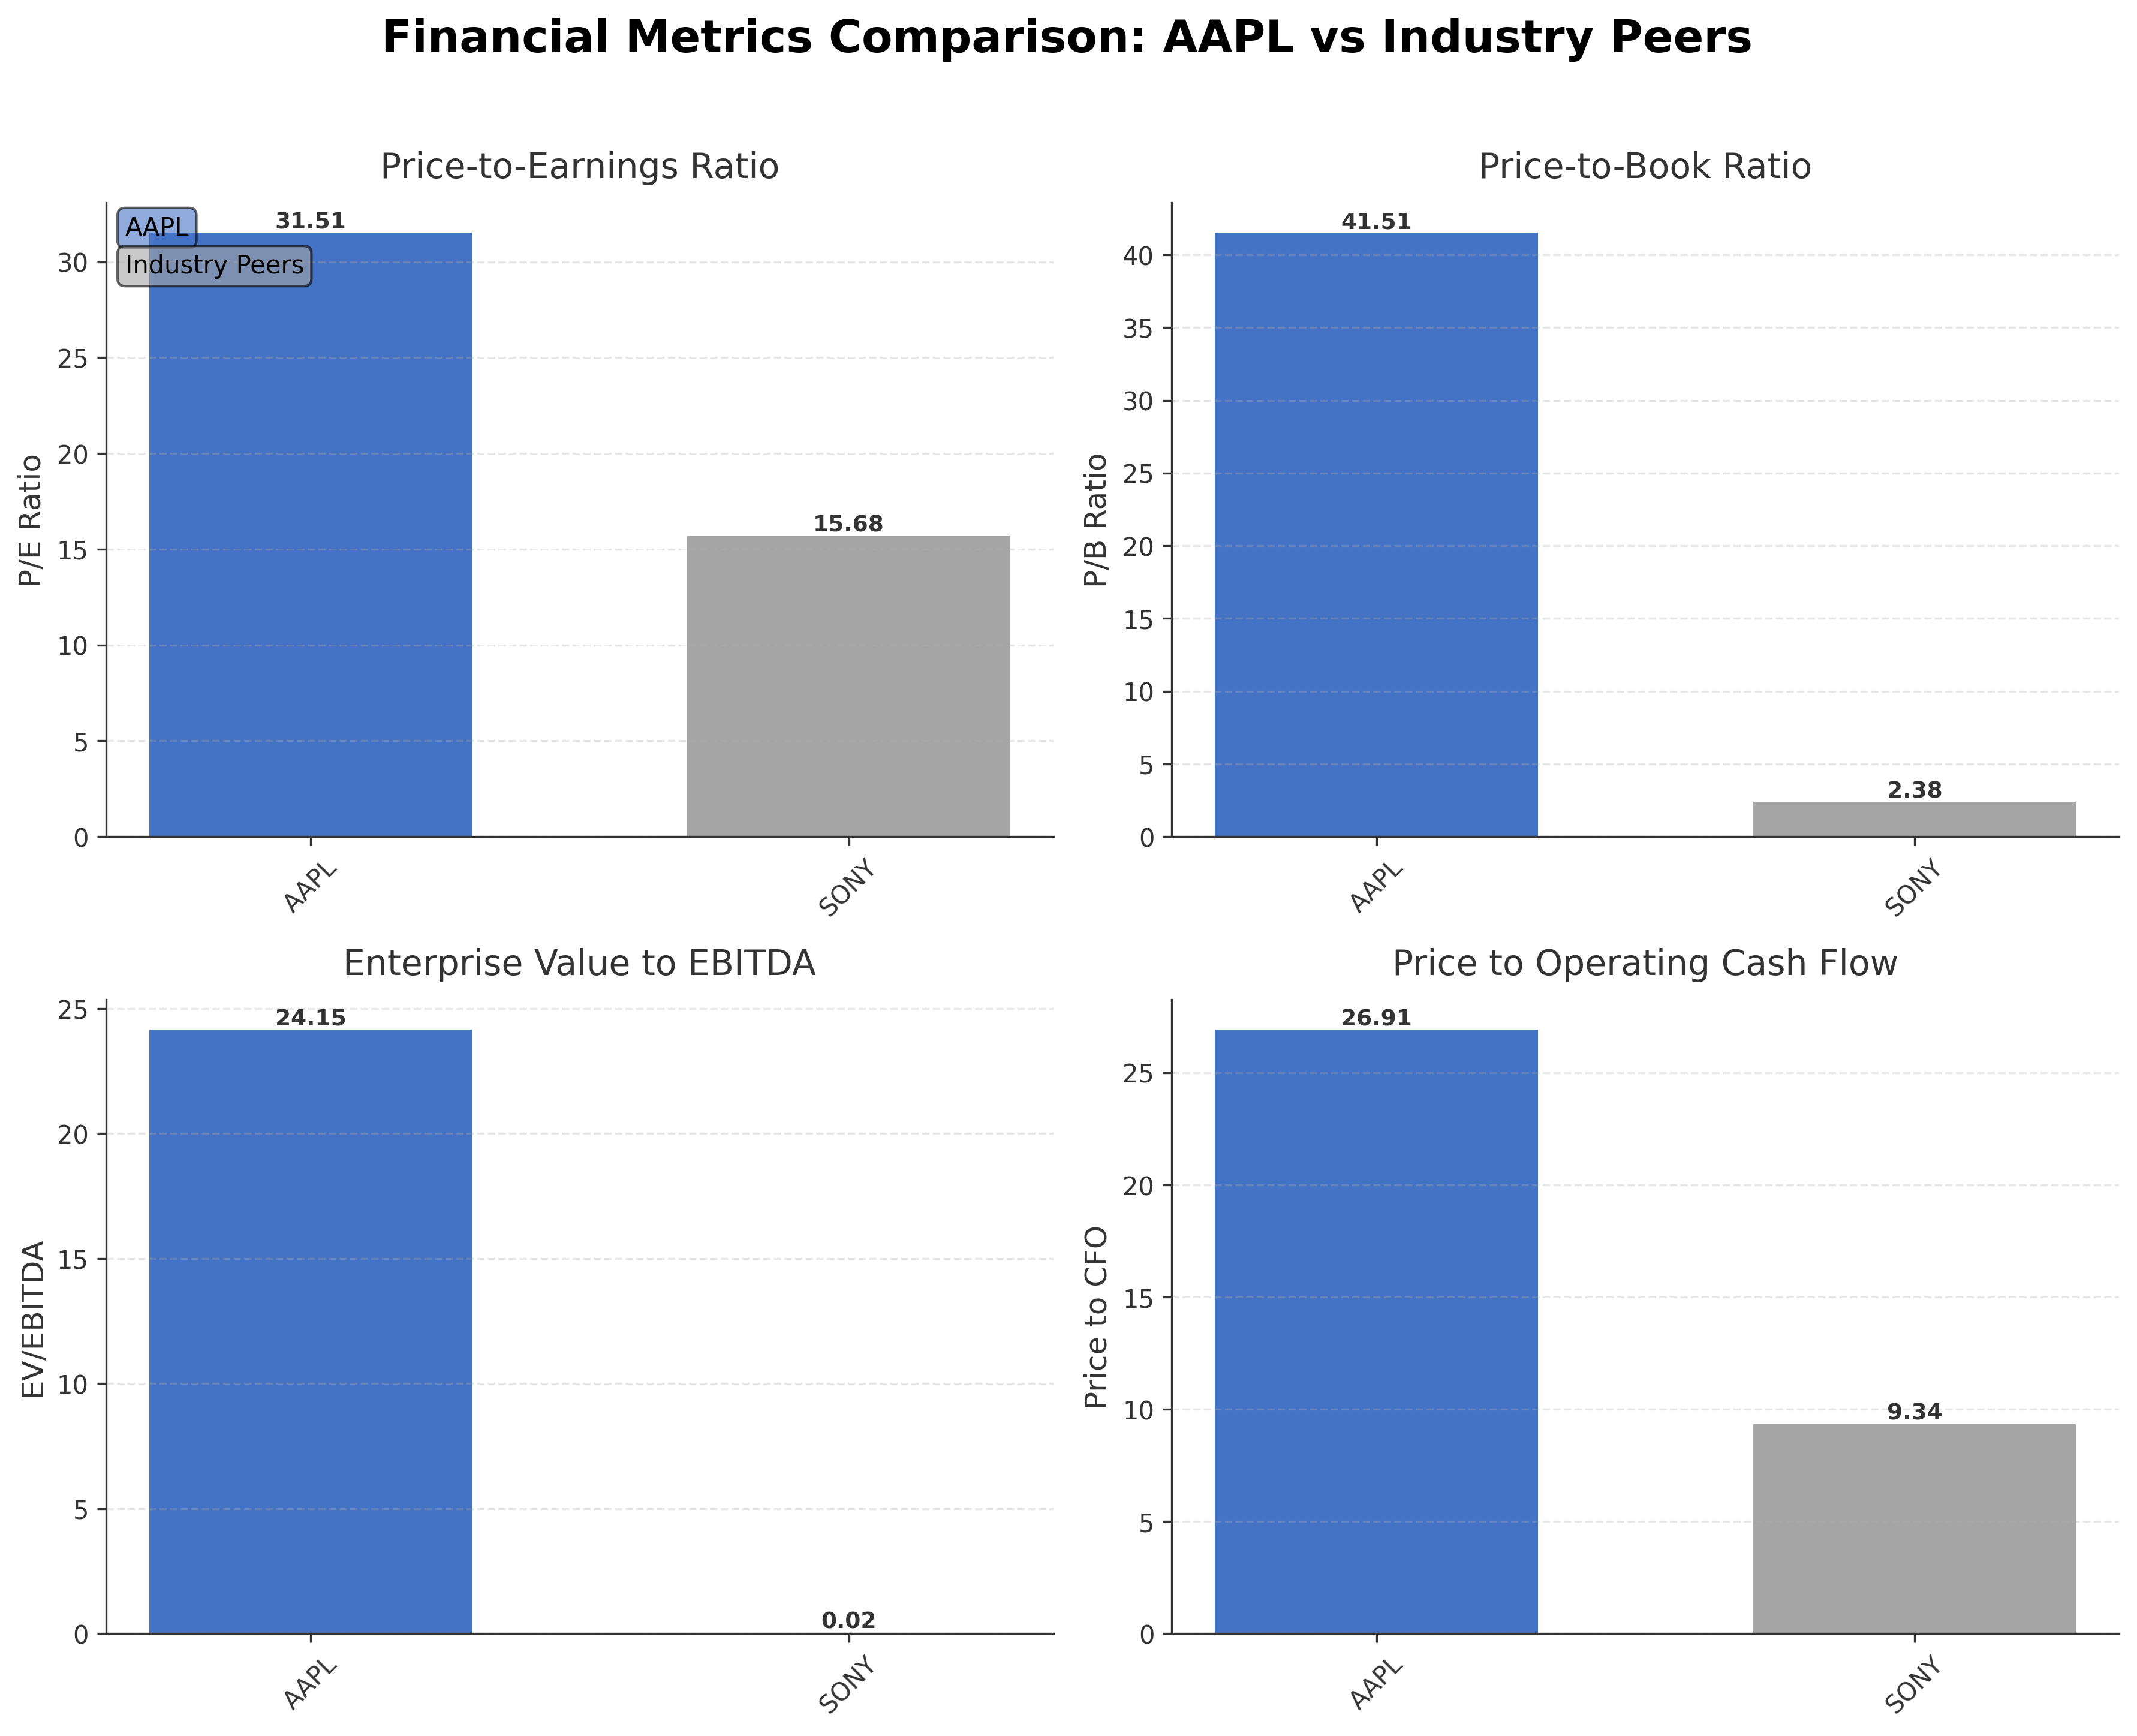
- High trailing P/E ratio of 31.5 and price-to-book ratio of 41.5 indicate elevated valuation levels.
- Current ratio below 1 (0.974) suggests tight short-term liquidity management.
- Return on equity at 1.52% is modest relative to valuation multiples, indicating potential efficiency concerns.
Disclosure: This information is for general awareness and does not constitute investment advice
Report Summary
Apple Inc. is a leading technology company specializing in designing, manufacturing, and marketing consumer electronics, software, and services. Operating primarily in the consumer electronics industry within the technology sector, Apple is globally recognized for its flagship product, the iPhone, which anchors a broad ecosystem including Mac computers, iPads, wearables, and various digital services. The company maintains a significant market presence through its retail stores, online platforms, and partnerships worldwide.
Financially, Apple exhibits robust metrics with a market capitalization exceeding $3.6 trillion and a trailing P/E ratio of approximately 31.5. The company reported trailing twelve months (TTM) revenue of about $435.6 billion, with a profit margin of 27.0% and operating margin of 35.4%. Its return on equity (ROE) stands at 1.52%, supported by strong operating cash flow and free cash flow figures. The stock trades at a forward P/E of 26.7 and has a dividend yield of 0.42%, reflecting a balanced approach to shareholder returns.
From a technical and strategic perspective, Appleâs stock price shows resilience with a 52-week range between $169.21 and $288.62, currently trading near $251.7. Institutional ownership is substantial at approximately 65.3%, with insider holdings below 2%. Recent strategic initiatives include expanding its services ecosystem and introducing advertising within Apple Maps, signaling diversification efforts. Notable risks include high valuation multiples relative to peers and exposure to competitive pressures in consumer electronics.
In peer comparison within the consumer electronics industry in the United States, Appleâs market capitalization and valuation multiples significantly exceed those of competitors such as Sony Group Corporation. While Appleâs P/E and price-to-book ratios are notably higher, reflecting premium market positioning, its return on equity and cash flow metrics underscore operational efficiency. This contrast highlights Appleâs dominant scale and investor confidence relative to regional peers.
Apple stands as a central figure navigating a highly competitive and rapidly evolving technology landscape. Recent achievements in revenue growth and ecosystem expansion are balanced against challenges such as valuation scrutiny and market saturation risks. The companyâs strategic moves in services and AI integration represent pivotal moments with potential to influence its future trajectory. Given the current financial and market data, a measured stance that monitors ongoing developments and valuation dynamics may be appropriate for those assessing the stockâs position.
Company and Industry Overview
Company Basics
Price Performance
Company Size
Shareholding Pattern
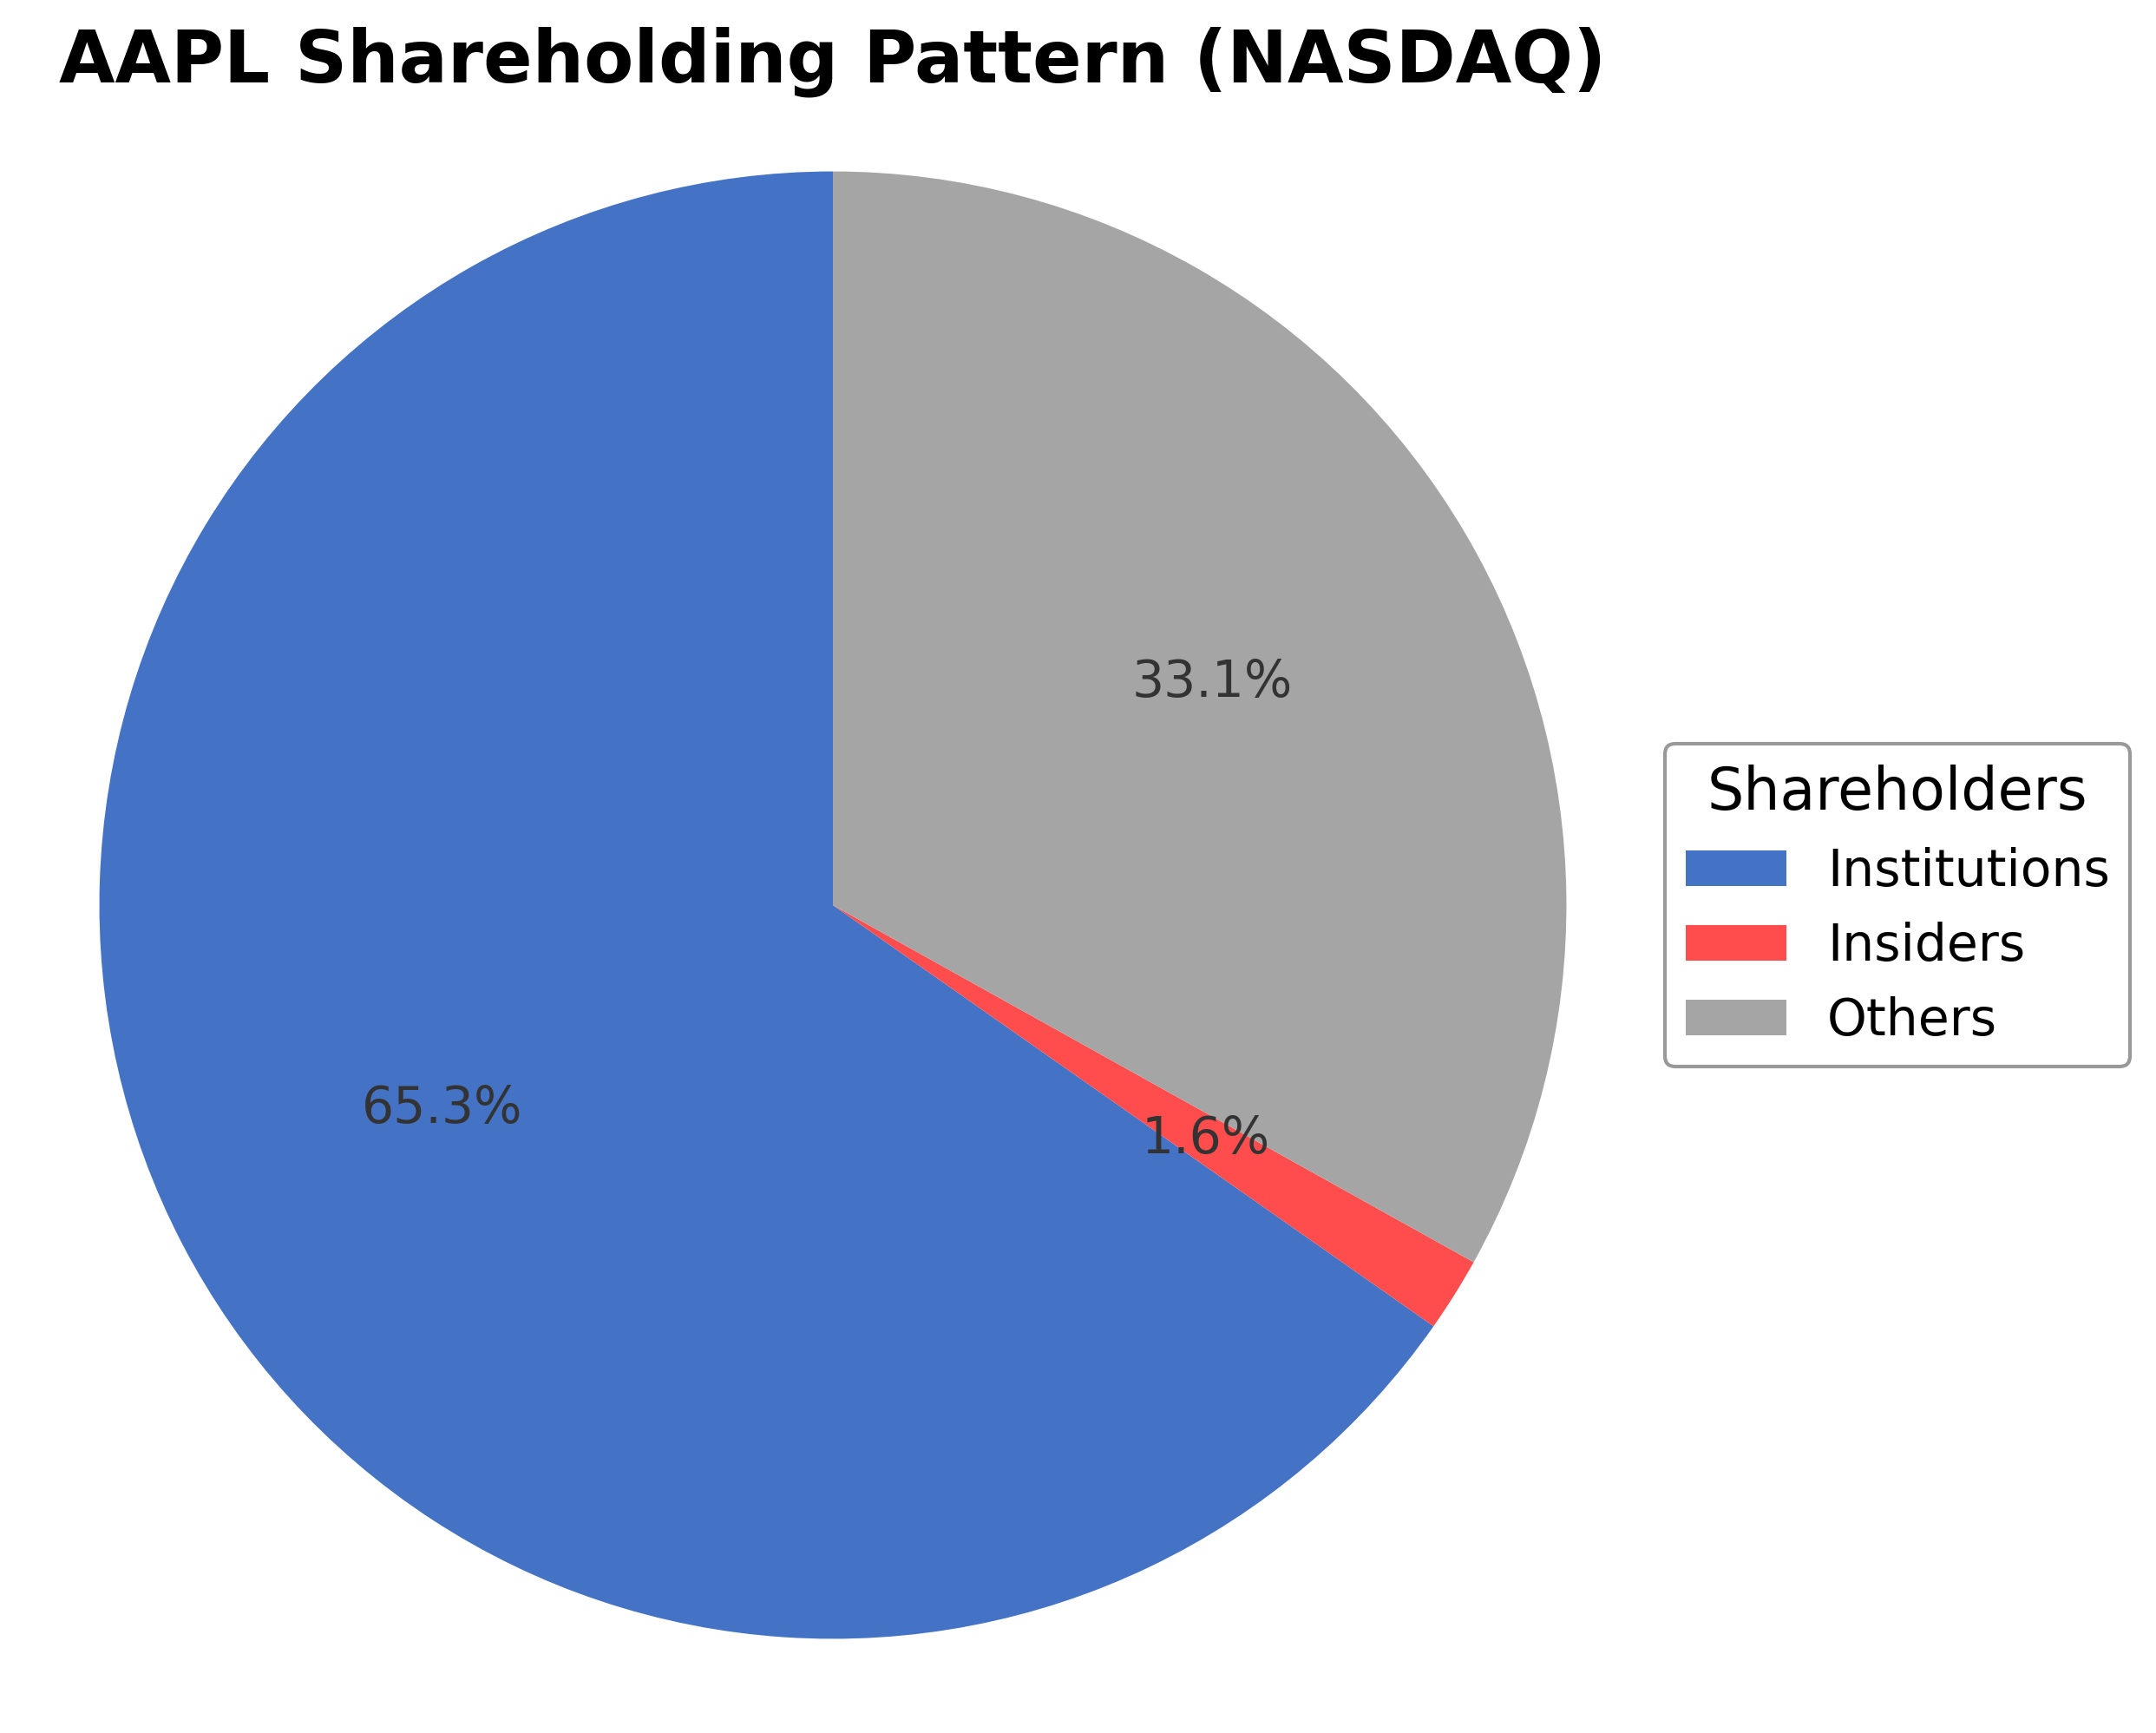
Apple Inc.'s ownership structure features approximately 1.64% held by insiders including executives and board members, 65.27% by institutional investors such as mutual funds and asset managers, and 34.71% by other shareholders including retail investors and employee stock plans. Over the past 12-24 months, institutional ownership has shown modest accumulation, with notable increases from funds like CWA Asset Management Group LLC and WESPAC Advisors SoCal LLC. This pattern suggests sustained confidence from large investors, supporting governance stability and strategic initiatives. The current ownership distribution reflects a mature company with broad institutional support, which may influence future corporate actions and market perception.
Sector and Industry Analysis
Apple Inc. (AAPL) operates primarily within the Technology sector, specifically in the Hardware industry, which encompasses consumer electronics, computing devices, and related software ecosystems. The global hardware market is substantial, driven by continuous innovation in smartphones, personal computing, wearable devices, and semiconductor components. Apple is a dominant player with a market capitalization exceeding $3.7 trillion as of 2026, reflecting its leadership in premium consumer electronics. The sector exhibits a high growth trajectory fueled by increasing digitalization, adoption of 5G, and integration of hardware with proprietary software and services, which Apple leverages through its tightly integrated ecosystem centered on the iPhone, Mac, iPad, and wearable devices.
Industry trends highlight a shift towards convergence of hardware and software, with companies expanding into services such as streaming, cloud, and augmented reality (AR). Apple’s strategic investment in proprietary chip design (e.g., M1 and subsequent silicon) and software development enhances product differentiation and performance. Consumer behavior increasingly favors seamless, interconnected devices with privacy and security as critical considerations, areas where Apple has positioned itself strongly. Emerging opportunities include AR/VR, health monitoring via wearables, and subscription-based service bundles, which complement hardware sales and drive recurring revenue streams.
The regulatory environment for the hardware industry is complex and evolving, with significant focus on data privacy, antitrust scrutiny, and international trade policies. Apple faces regulatory challenges related to App Store practices, data protection laws such as GDPR, and supply chain transparency requirements. Compliance with environmental regulations, including e-waste management and carbon footprint reduction, is increasingly important. Trade tensions and tariffs, particularly involving China and the US, impact manufacturing and supply chain strategies, necessitating diversification and risk management.
Competitive dynamics in the hardware sector are characterized by high capital intensity, rapid innovation cycles, and strong brand loyalty. Barriers to entry are substantial due to the need for advanced R&D, manufacturing scale, and ecosystem development. Apple’s competitive positioning benefits from its integrated hardware-software model, extensive global distribution network, and premium brand equity. The market structure is oligopolistic with a few dominant firms such as Samsung, Microsoft, and Google competing across overlapping segments. Strategic partnerships with suppliers like Foxconn and TSMC enable Apple to maintain supply chain efficiency and technological leadership. Overall, the industry demands continuous innovation, agility in regulatory adaptation, and effective ecosystem management to sustain competitive advantage.
Note: Analysis synthesized from industry research, market reports, and regulatory filings. Information is subject to change based on market conditions.
Illustrative Scenario Analysis
DCF Assumptions:
Method: Two-Stage EPS-Priority Model
Financials
Peer Analysis
| Company Name | Market Cap | P/E Ratio | P/B Ratio | EV/EBITDA | Price to CFO |
|---|---|---|---|---|---|
| Apple Inc. | $3.64T | 31.51 | 41.51 | 24.15 | 26.91 |
| Sony Group Corporation - Sponsored American Depositary Receipt | $120.12B | 15.68 | 2.38 | 0.02 | 9.34 |
Comparison Analysis: Apple Inc. significantly outpaces its regional peer Sony Group Corporation in market capitalization, reflecting its dominant industry position. Apple's P/E and price-to-book ratios are substantially higher, indicating a premium valuation consistent with its brand strength and growth prospects. The enterprise value to EBITDA and price to CFO metrics also suggest robust operational efficiency. However, Apple's return on equity, while positive, is modest compared to its valuation multiples. Sony's lower multiples and market cap reflect a more conservative valuation and smaller scale. Overall, Apple maintains a leadership role with premium valuation metrics relative to its consumer electronics peers in the United States.
Financial Metrics Comparison with Peers
Financial Statements
Comprehensive financial data including income, balance sheet, and cash flow metrics
Income Statement
| fiscal_date | 2025-09-30 | 2024-09-30 | 2023-09-30 | 2022-09-30 | 2021-09-30 |
|---|---|---|---|---|---|
| Sales | 416.16B | 391.04B | 383.29B | 394.33B | 365.82B |
| Cost Of Goods | 220.96B | 210.35B | 214.14B | 223.55B | 212.98B |
| Gross Profit | 195.20B | 180.68B | 169.15B | 170.78B | 152.84B |
| Operating Expense Research And Development | 34.55B | 31.37B | 29.91B | 26.25B | 21.91B |
| Operating Expense Selling General And Administrative | 27.60B | 26.10B | 24.93B | 25.09B | 21.97B |
| Operating Income | 133.05B | 123.22B | 114.30B | 119.44B | 108.95B |
| Other Income Expense | -321.00M | 269.00M | -565.00M | -334.00M | 60.00M |
| Pretax Income | 132.73B | 123.48B | 113.74B | 119.10B | 109.21B |
| Income Tax | 20.72B | 29.75B | 16.74B | 19.30B | 14.53B |
| Net Income | 112.01B | 93.74B | 97.00B | 99.80B | 94.68B |
| Eps Basic | 7.49 | 6.11 | 6.16 | 6.15 | 5.67 |
| Eps Diluted | 7.46 | 6.08 | 6.13 | 6.11 | 5.61 |
| Basic Shares Outstanding | 14.95B | 15.34B | 15.74B | 16.22B | 16.70B |
| Diluted Shares Outstanding | 14.95B | 15.34B | 15.74B | 16.22B | 16.70B |
| Ebit | 133.05B | 123.22B | 114.30B | 119.44B | 111.85B |
| Ebitda | 144.75B | 134.66B | 125.82B | 130.54B | 123.14B |
| Net Income Continuous Operations | 112.01B | 93.74B | 97.00B | 99.80B | 94.68B |
| Non Operating Interest Income | N/A | N/A | 3.75B | 2.83B | 2.84B |
| Non Operating Interest Expense | N/A | N/A | 3.93B | 2.93B | 2.65B |
Data provided by Twelve Data
Balance Sheet
| fiscal_date | 2025-09-30 | 2024-09-30 | 2023-09-30 | 2022-09-30 | 2021-09-30 |
|---|---|---|---|---|---|
| Cash And Cash Equivalents | 35.93B | 29.94B | 29.96B | 23.65B | 34.94B |
| Accounts Receivable | 39.78B | 33.41B | 29.51B | 28.18B | 26.28B |
| Total Assets | 359.24B | 364.98B | 352.58B | 352.75B | 351.00B |
| Total Liabilities | 285.51B | 308.03B | 290.44B | 302.08B | 287.91B |
| Long Term Debt | 78.33B | 85.75B | 95.28B | 109.71B | 119.38B |
| Shareholders Equity | 73.73B | 56.95B | 62.15B | 50.67B | 63.09B |
Data provided by Twelve Data
Cash Flow Statement
| fiscal_date | 2025-09-30 | 2024-09-30 | 2023-09-30 | 2022-09-30 | 2021-09-30 |
|---|---|---|---|---|---|
| Operating Activities Net Income | 112.01B | 93.74B | 97.00B | 99.80B | 94.68B |
| Operating Activities Depreciation | 11.70B | 11.45B | 11.52B | 11.10B | 11.28B |
| Operating Activities Stock Based Compensation | 12.86B | 11.69B | 10.83B | 9.04B | 7.91B |
| Operating Activities Other Non Cash Items | -89.00M | -2.27B | -2.23B | 1.01B | -4.92B |
| Operating Activities Accounts Receivable | -7.03B | -5.14B | -417.00M | -9.34B | -14.03B |
| Operating Activities Accounts Payable | 902.00M | 6.02B | -1.89B | 9.45B | 12.33B |
| Operating Activities Other Assets Liabilities | -18.87B | 2.77B | -4.27B | 1.57B | -1.53B |
| Operating Activities Operating Cash Flow | 111.48B | 118.25B | 110.54B | 123.52B | 100.94B |
| Investing Activities Capital Expenditures | -12.71B | -9.45B | -10.96B | -10.71B | -11.09B |
| Investing Activities Purchase Of Investments | -24.41B | -48.66B | -29.51B | -76.92B | -109.56B |
| Investing Activities Sale Of Investments | 53.80B | 62.35B | 45.51B | 67.36B | 106.48B |
| Investing Activities Other Investing Activity | -1.48B | -1.31B | -1.34B | -2.09B | -385.00M |
| Investing Activities Investing Cash Flow | 15.20B | 2.94B | 3.71B | -22.66B | -14.58B |
| Financing Activities Long Term Debt Issuance | 4.48B | 0.00 | 5.23B | 5.46B | 20.39B |
| Financing Activities Long Term Debt Payments | -10.93B | -9.96B | -11.15B | -9.54B | -8.75B |
| Financing Activities Short Term Debt Issuance | -2.03B | 3.96B | -3.98B | 3.96B | 1.02B |
| Financing Activities Common Stock Repurchase | -90.71B | -94.95B | -77.55B | -89.40B | -85.97B |
| Financing Activities Common Dividends | -15.42B | -15.23B | -15.03B | -14.84B | -14.47B |
| Financing Activities Other Financing Charges | -6.07B | -5.80B | -6.01B | -6.38B | -5.58B |
| Financing Activities Financing Cash Flow | -120.69B | -121.98B | -108.49B | -110.75B | -92.25B |
| End Cash Position | 35.93B | 29.94B | 30.74B | 24.98B | 35.93B |
| Income Tax Paid | 43.37B | 26.10B | 18.68B | 19.57B | 25.39B |
| Free Cash Flow | 98.77B | 108.81B | 99.58B | 111.44B | 92.95B |
| Interest Paid | N/A | N/A | 3.80B | 2.87B | 2.69B |
| Operating Activities Deferred Taxes | N/A | N/A | N/A | 895.00M | -4.77B |
| Investing Activities Net Acquisitions | N/A | N/A | N/A | -306.00M | -33.00M |
| Financing Activities Common Stock Issuance | N/A | N/A | N/A | N/A | 1.10B |
Data provided by Twelve Data
Technical Analysis
Key Insights
- The current trend direction shows Apple’s stock trading in a consolidation phase after a recent pullback from its 52-week high of $288.62.
- Key support levels are identified near $246.36 (200-day moving average) and $261.64 (50-day moving average), with resistance around the recent high of $288.62.
- The stock price is currently trading slightly below the 50-day moving average but above the 200-day moving average, indicating mixed short-term momentum with longer-term support.
- Momentum indicators show the RSI near neutral levels, MACD displaying a slight bearish crossover, and stochastic oscillators indicating potential oversold conditions.
- Multi-timeframe analysis reveals daily charts showing consolidation, weekly charts maintaining an overall uptrend, and monthly charts reflecting sustained bullish momentum over the longer term.
- Potential market scenarios include a rebound from support levels if momentum improves or further consolidation if resistance levels hold, with volatility expected around key moving averages.
Trending News
1. Headline: CWA Asset Management Group LLC Increases Stake in Apple Inc. $AAPL
Summary: CWA Asset Management Group LLC grew its stake in Apple Inc. (NASDAQ:AAPL - Free Report) by 2.5% in the 4th quarter, according to its most recent disclosure with the Securities & Exchange Commission. The firm owned 557,270 shares of the iPhone maker's stock after buying an additional 13,635 shar
Sentiment: positive
2. Headline: Apple Inc. $AAPL Shares Sold by Baldwin Wealth Partners LLC MA
Summary: Baldwin Wealth Partners LLC MA lessened its position in Apple Inc. (NASDAQ:AAPL - Free Report) by 2.8% in the fourth quarter, according to the company in its most recent 13F filing with the Securities and Exchange Commission (SEC). The firm owned 378,060 shares of the iPhone maker's stock after sel
Sentiment: positive
3. Headline: TAP, Inc. Launches TAP Invest Mobile App on the Apple App Store
Summary: SALT LAKE CITY, Utah, March 25, 2026 (GLOBE NEWSWIRE) -- TAP, Inc., a financial technology company focused on modernizing multi-asset investing through a...
Sentiment: neutral
4. Headline: WESPAC Advisors SoCal LLC Has $19.55 Million Stake in Apple Inc. $AAPL
Summary: WESPAC Advisors SoCal LLC increased its stake in Apple Inc. (NASDAQ:AAPL - Free Report) by 5.1% during the 4th quarter, according to the company in its most recent disclosure with the Securities and Exchange Commission. The fund owned 71,895 shares of the iPhone maker's stock after purchasing an ad
Sentiment: positive
5. Headline: Sagespring Wealth Partners LLC Acquires 13,287 Shares of Apple Inc. $AAPL
Summary: Sagespring Wealth Partners LLC raised its stake in Apple Inc. (NASDAQ:AAPL - Free Report) by 6.0% in the fourth quarter, according to its most recent Form 13F filing with the Securities and Exchange Commission. The fund owned 233,226 shares of the iPhone maker's stock after acquiring an additional
Sentiment: positive
6. Headline: Riversedge Advisors LLC Has $25.63 Million Stock Holdings in Apple Inc. $AAPL
Summary: Riversedge Advisors LLC grew its position in shares of Apple Inc. (NASDAQ:AAPL - Free Report) by 2.2% during the 4th quarter, according to its most recent 13F filing with the Securities and Exchange Commission (SEC). The firm owned 94,290 shares of the iPhone maker's stock after buying an additiona
Sentiment: positive
7. Headline: Everhart Financial Group Inc. Acquires 9,038 Shares of Apple Inc. $AAPL
Summary: Everhart Financial Group Inc. grew its holdings in shares of Apple Inc. (NASDAQ:AAPL - Free Report) by 7.9% during the 4th quarter, according to its most recent 13F filing with the Securities and Exchange Commission (SEC). The institutional investor owned 124,008 shares of the iPhone maker's stock
Sentiment: positive
8. Headline: Apple Maps Is Getting Ads. It's Apple's Riskiest Bet Yet
Summary: Inc. PremiumMoneyCoterie Turned a Dirty Product Into a Premium Brand, Then Scored a Major Sale · LeadMove Over, Unlimited PTO: The New Must-Have AI Perk Taking Over Silicon Valley · GrowShe Lost $75,000 on a Startup—Then Built Mrs. Meyer’s Into a Category-Defining Brand · MoneyIf These 3 Big IPOs Happen, No One Else May Have a Shot ... Apple...
Sentiment: neutral
9. Headline: You Should Download Apple’s Latest iOS Update Now: Fun New Emojis Are Just the Start
Summary: Inc. PremiumMoneyCoterie Turned a Dirty Product Into a Premium Brand, Then Scored a Major Sale · LeadMove Over, Unlimited PTO: The New Must-Have AI Perk Taking Over Silicon Valley · GrowShe Lost $75,000 on a Startup—Then Built Mrs. Meyer’s Into a Category-Defining Brand · MoneyIf These 3 Big IPOs Happen, No One Else May Have a Shot ... Apple...
Sentiment: neutral
10. Headline: Apple Stock Is Moving Higher: What's Happening? - Apple (NASDAQ:AAPL)
Summary: Apple Inc. shares are trading higher Tuesday. The company unveiled Apple Business, a platform for managing devices, customers and operations.
Sentiment: positive
Powered by Brave
Recent Updates
News Summary
Recent news highlights Apple's strategic moves including the introduction of advertising within Apple Maps, signaling a new revenue stream. The company is preparing for its annual Worldwide Developers Conference (WWDC) in June 2026, where it is expected to unveil new software updates including a standalone Siri app and AI enhancements. Market surveys indicate sustained strength in iPhone sales and potential for foldable iPhone models, reflecting ongoing product innovation. These developments underscore Apple's focus on expanding its services ecosystem and integrating AI capabilities, which may influence future growth and market positioning. The news cycle reflects a blend of product innovation, service expansion, and evolving monetization strategies within a competitive technology landscape.
News Sentiment
Sentiment across recent updates is predominantly neutral, with measured optimism around product launches and strategic initiatives. The introduction of ads in Apple Maps and AI-focused software updates are viewed as incremental steps rather than transformative changes, maintaining a balanced market outlook. Institutional buying activity reported in filings complements this sentiment, indicating cautious confidence. Overall, the sentiment suggests steady progress with attention to execution risks and competitive pressures.
Analytical Overview
Analysis Summary
Apple's valuation metrics, including a trailing P/E of 31.5 and forward P/E of 26.7, are elevated relative to the industry average P/E of 31.5, reflecting premium market positioning and growth expectations.
Revenue growth is strong at approximately 15.7% quarterly, supported by robust cash flow generation with operating cash flow exceeding $135 billion TTM and free cash flow above $106 billion TTM, indicating a solid growth trajectory.
Financial health is stable with a total debt to equity ratio of 102.63%, balanced by substantial cash reserves of over $66 billion, supporting liquidity and operational flexibility.
The consumer electronics sector faces challenges such as intense competition and supply chain risks, but opportunities arise from expanding services and AI integration.
Market positioning and competitive advantages include a dominant ecosystem, brand loyalty, and innovation leadership, which underpin resilience amid sector dynamics.
Investment Conclusion
Supporting Factors: Primary supporting factors include strong revenue growth, significant cash flow generation, and a robust services ecosystem.
Risk Factors: Main risk factors to monitor are high valuation multiples and competitive pressures in technology and consumer electronics markets.
SWOT Analysis
Strengths
- Apple maintains a dominant market position with a strong brand and loyal customer base.
- Robust financial performance with high revenue growth and strong cash flow generation.
- Extensive ecosystem of products and services driving recurring revenue streams.
- Significant institutional ownership supporting governance and strategic stability.
Weaknesses
- High valuation multiples may limit near-term upside potential.
- Dependence on iPhone sales exposes the company to product lifecycle risks.
- Current ratio below 1 indicates tight short-term liquidity management.
- Relatively modest return on equity compared to valuation metrics.
Opportunities
- Expansion of services such as advertising in Apple Maps and AI-driven applications.
- Growth potential from new product categories including foldable devices.
- Increasing penetration in emerging markets through diversified product offerings.
- Leverage of AI and software innovation to enhance user experience and monetization.
Threats
- Intense competition in consumer electronics and technology sectors.
- Supply chain disruptions and geopolitical risks impacting production.
- Regulatory scrutiny related to privacy, antitrust, and digital advertising.
- Market volatility affecting high-valuation technology stocks.
Company Description
Apple Inc. is a leading technology company renowned for designing, manufacturing, and marketing innovative hardware and software products for consumers and businesses worldwide. Its flagship product, the iPhone, accounts for the majority of sales, serving as the central hub of an expansive ecosystem that includes Mac computers, iPad tablets, Apple Watch wearables, and accessories like AirPods. Apple Inc. also offers a suite of services such as the App Store, Apple Music, iCloud, Apple TV+, and Apple Fitness+, providing digital content, cloud storage, and subscription-based platforms. Operating in the consumer electronics industry within the technology sector, the company employs approximately 166,000 people and maintains a broad global presence through online stores, retail outlets, and partnerships with carriers and resellers. With a substantial market capitalization reflecting its scale, Apple Inc. plays a pivotal role in shaping consumer technology trends, emphasizing seamless integration across devices and services to enhance user experience and productivity.