
Apple Inc (AAPL)
Stock Analysis Report
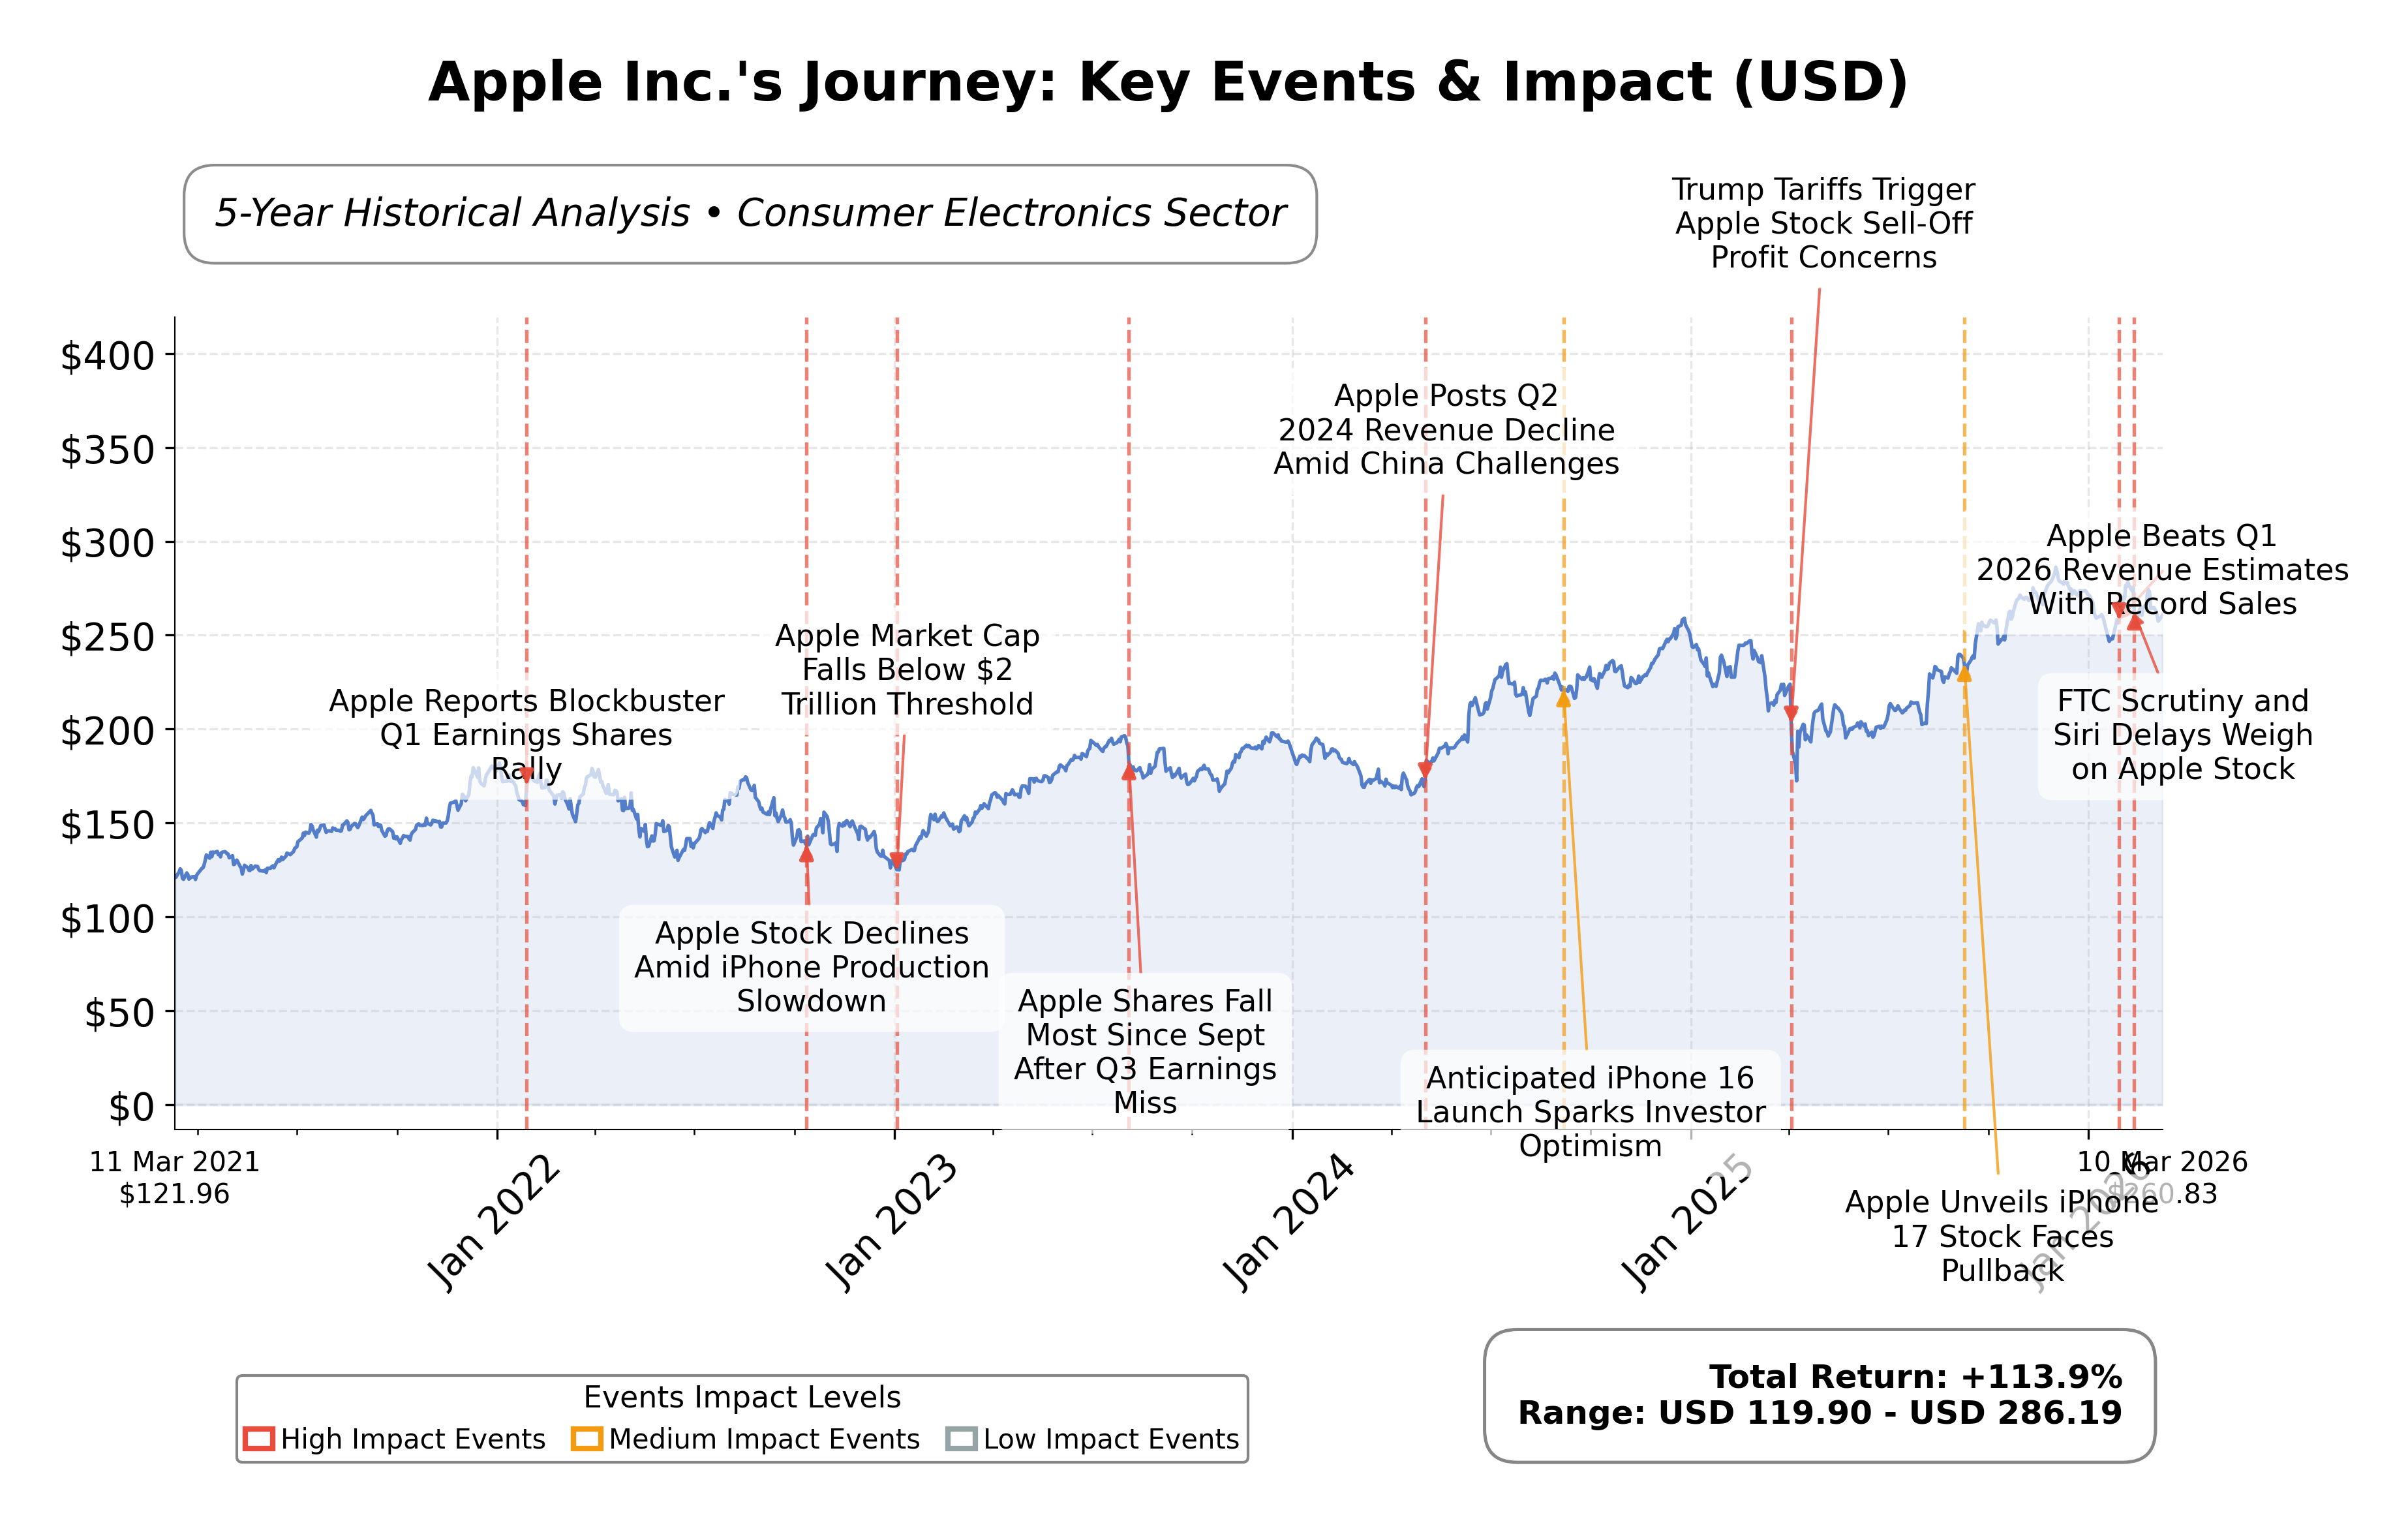
Stock Journey
Key Positives and Key Risks
Pros
- Market capitalization of $3.78 trillion reflects dominant industry position and scale.
- Revenue growth of 15.7% year-over-year supports a strong growth trajectory.
- Operating cash flow of $135.5 billion indicates robust financial health and liquidity.
Cons
- High price-to-book ratio of 42.92 suggests elevated valuation relative to assets.
- Current ratio of 0.974 points to tight short-term liquidity management.
- Delays in AI-related product launches may impact innovation momentum and market perception.
Disclosure: This information is for general awareness and does not constitute investment advice
Report Summary
Apple Inc. operates as a leading technology company specializing in the design, manufacture, and marketing of consumer electronics and software products globally. Its core offerings include the iPhone, Mac computers, iPads, Apple Watch, and a range of services such as the App Store, Apple Music, and iCloud. Positioned prominently within the consumer electronics industry and the broader technology sector, Apple maintains a significant global footprint supported by extensive retail and online distribution channels.
Financially, Apple demonstrates robust performance with a market capitalization of approximately $3.78 trillion and a trailing P/E ratio of 32.55, slightly above the industry average. The company reported trailing twelve months (TTM) revenue of $435.6 billion with a profit margin of 27.04%, operating margin of 35.37%, and a return on assets of 24.38%. Cash flow metrics remain strong, with operating cash flow at $135.5 billion and free cash flow of $106.3 billion, supported by a manageable debt level and a current ratio near 1. Dividend yield stands at 0.40%, reflecting a modest payout ratio.
Technically, Appleâs stock trades above its 50-day and 200-day moving averages, indicating a positive trend momentum. Recent strategic initiatives include the launch of the MacBook Neo and delays in smart home device releases linked to AI enhancements. Leadership remains stable under CEO Tim Cook, with institutional ownership exceeding 65%. Strengths include strong brand equity, diversified product ecosystem, and solid cash generation, while risks involve competitive pressures and AI development challenges.
In peer comparison within the consumer electronics industry in the United States, Appleâs valuation metrics such as P/E and price-to-book ratios are significantly higher than peers like Sony Group Corporation, which trades at a P/E of 16.40 and P/B of 2.47. Appleâs market capitalization dwarfs its peers, reflecting its dominant market position. Return on equity and cash flow metrics also highlight Appleâs operational efficiency relative to regional competitors.
Apple stands as a pivotal player navigating a dynamic technology landscape marked by innovation and evolving consumer demands. Recent product launches and strategic adjustments underscore its commitment to maintaining market leadership amid AI integration challenges. The companyâs financial strength and global reach position it well for future opportunities, though ongoing technological and competitive risks remain. Evaluating the current data suggests a stance that balances recognition of Appleâs solid fundamentals with attentiveness to market developments and execution of its strategic initiatives.
Company and Industry Overview
Company Basics
Price Performance
Company Size
Shareholding Pattern
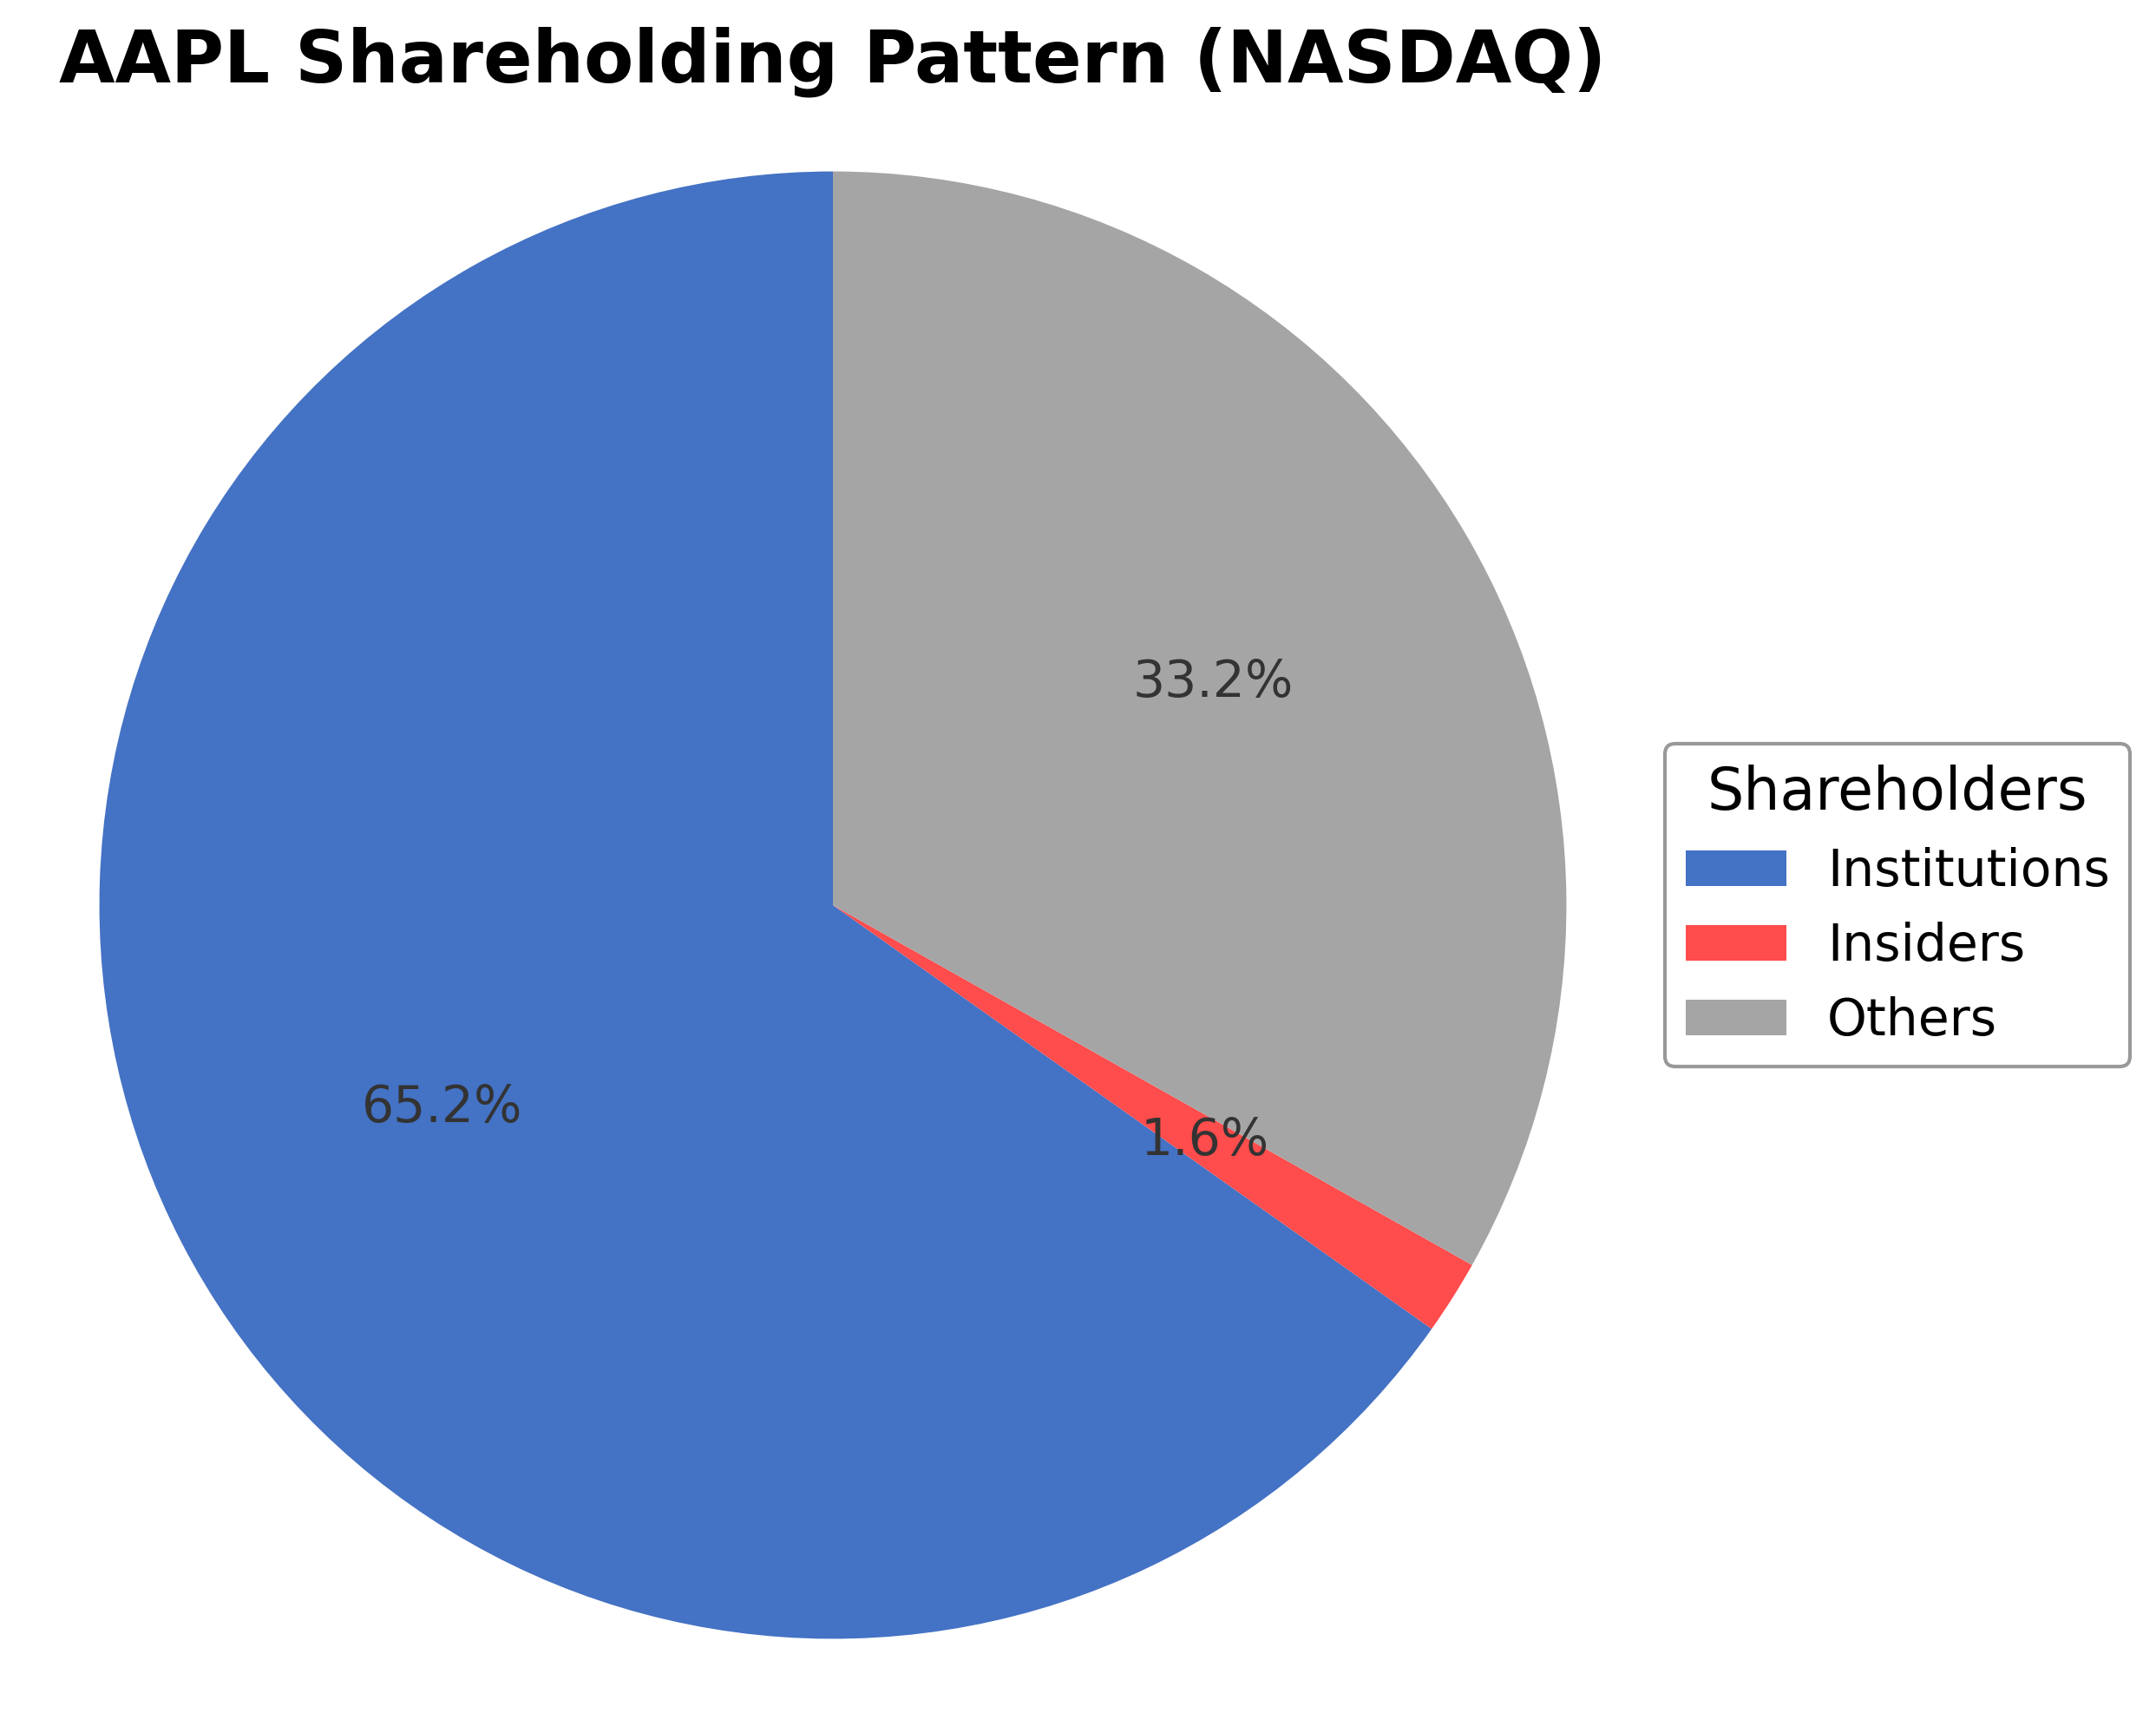
Apple Inc.'s ownership structure comprises approximately 1.64% held by insiders including executives and board members, 65.20% by institutional investors such as mutual funds and asset managers, and 34.48% by other shareholders including retail investors. Over the past 12-24 months, institutional holdings have shown notable accumulation, with firms like Siligmueller & Norvid Wealth Advisors LLC and Northeast Financial Group Inc. increasing their positions significantly. These patterns suggest a positive market sentiment toward Apple's governance and strategic direction, reflecting confidence in its innovation pipeline and financial stability. The ownership distribution supports a balanced governance framework with substantial institutional oversight influencing corporate actions.
Sector and Industry Analysis
Apple Inc. (AAPL) operates primarily within the Technology sector, specifically the Hardware industry, which encompasses consumer electronics, computing devices, and related software ecosystems. The global hardware market is a multi-trillion-dollar industry characterized by rapid innovation cycles and significant capital investment. Apple, as one of the largest market capitalizations globally (~$3.8 trillion), is a dominant player alongside competitors such as Samsung, Microsoft, and Google. The sector’s growth trajectory is driven by increasing consumer demand for connected devices, integration of hardware with proprietary software, and expansion into services such as streaming and augmented reality. The industry is also marked by cyclical product refreshes and evolving consumer preferences, with smartphones (notably Apple’s iPhone) constituting the majority of sales, supplemented by tablets, wearables, and personal computers.
Industry trends highlight a pronounced shift towards ecosystem-driven product strategies, where hardware serves as an entry point to broader software and services platforms. Apple exemplifies this with its tightly integrated iOS ecosystem, proprietary chip design (e.g., Apple Silicon), and expansion into subscription services and augmented reality applications. Consumer behavior increasingly favors seamless interoperability, privacy, and premium user experiences, driving demand for differentiated hardware-software combinations. Emerging opportunities include augmented reality (AR), artificial intelligence (AI) integration, and health-related wearables, which Apple has actively pursued through product innovation and software development. Additionally, supply chain resilience and semiconductor manufacturing partnerships (e.g., with TSMC) remain critical to sustaining product innovation and meeting global demand.
The regulatory landscape for the hardware and technology sector is complex and evolving, with significant implications for data privacy, antitrust scrutiny, and international trade policies. Apple faces regulatory oversight related to user data protection (e.g., GDPR in Europe, CCPA in California), app store practices, and competition laws, particularly concerning its control over software distribution and payment systems. Compliance with environmental regulations and sustainability mandates is also increasingly important, influencing product design and supply chain management. Trade tensions and tariffs, especially between the U.S. and China, impact manufacturing costs and logistics, necessitating strategic adjustments in production and sourcing.
Competitive dynamics in the hardware industry are defined by high barriers to entry, including substantial R&D expenditures, brand loyalty, and economies of scale in manufacturing and distribution. Apple’s competitive positioning is strengthened by its integrated ecosystem, strong brand equity, and control over both hardware and software development. The market structure is oligopolistic, with a few dominant firms controlling significant market share and innovation leadership. Distribution channels are diversified, with Apple leveraging both direct retail (flagship stores) and extensive indirect partnerships. Insider ownership at Apple remains low (~0.12%), while institutional ownership is substantial (~65%), reflecting broad market confidence but also a dispersed ownership structure. The competitive landscape demands continuous innovation, supply chain optimization, and regulatory navigation to maintain market leadership.
Note: Analysis synthesized from industry research, market reports, and regulatory filings. Information is subject to change based on market conditions.
Illustrative Scenario Analysis
DCF Assumptions:
Method: Two-Stage EPS-Priority Model
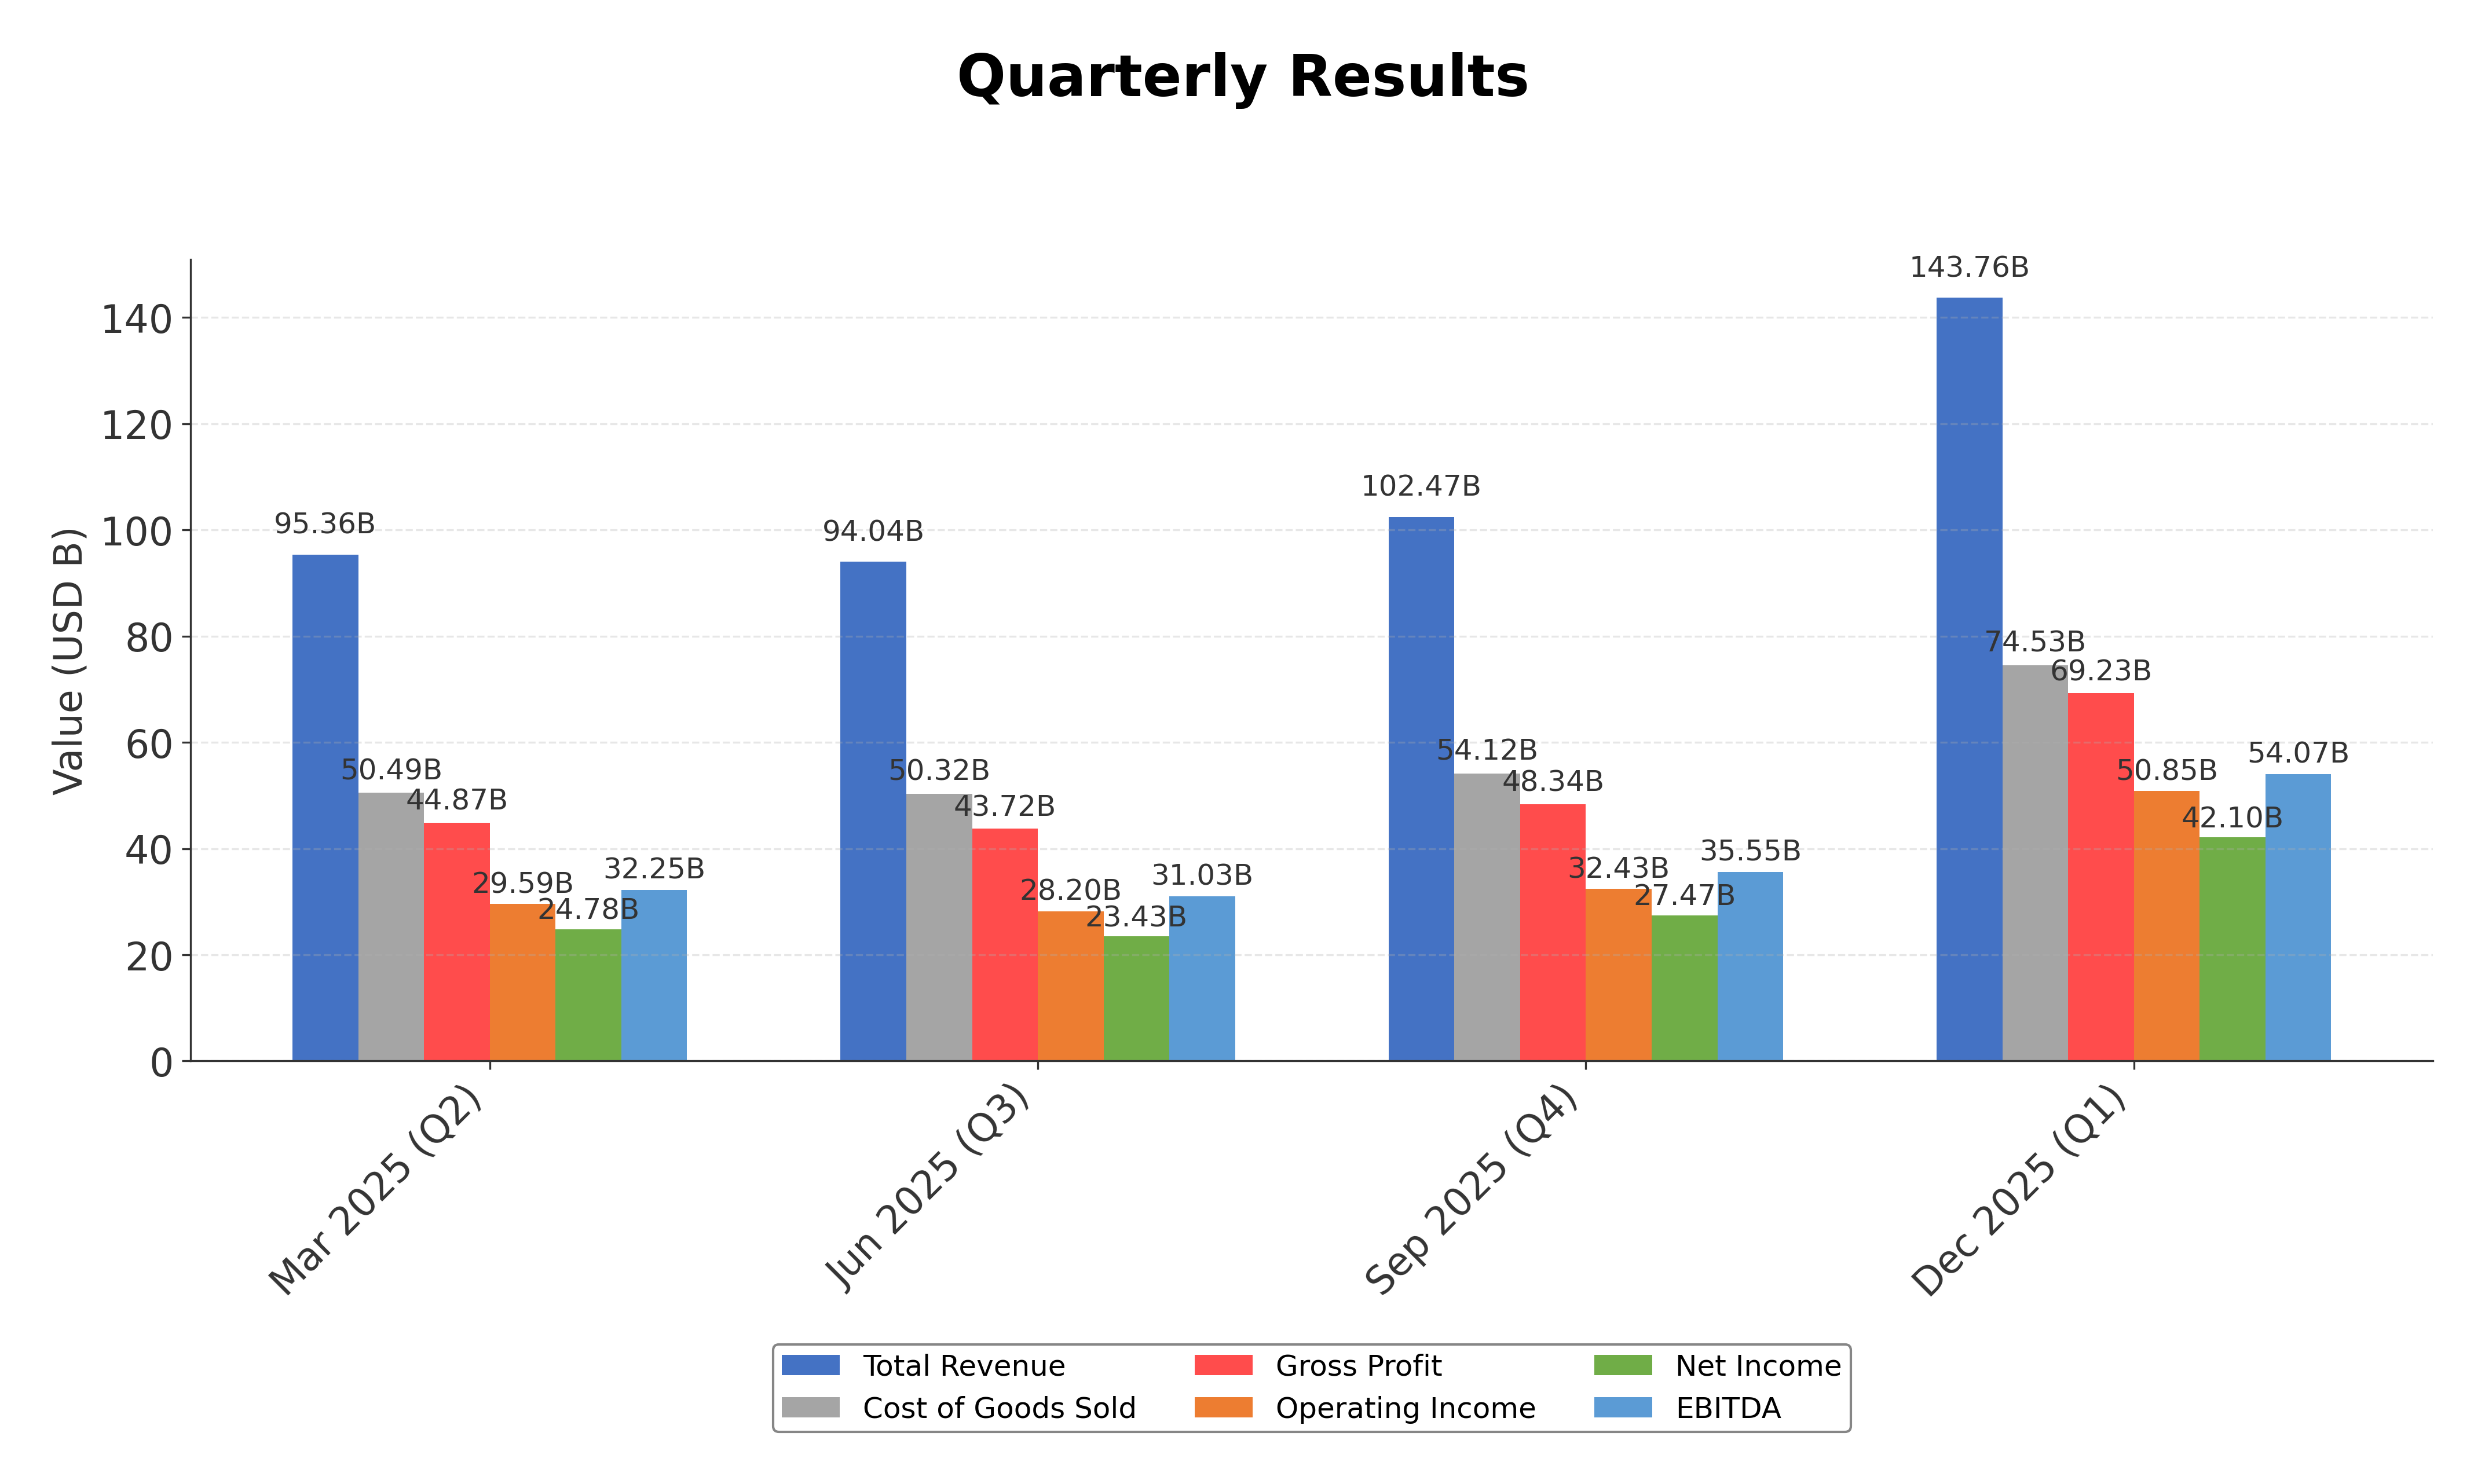
Financials
Peer Analysis
| Company Name | Market Cap | P/E Ratio | P/B Ratio | EV/EBITDA | Price to CFO |
|---|---|---|---|---|---|
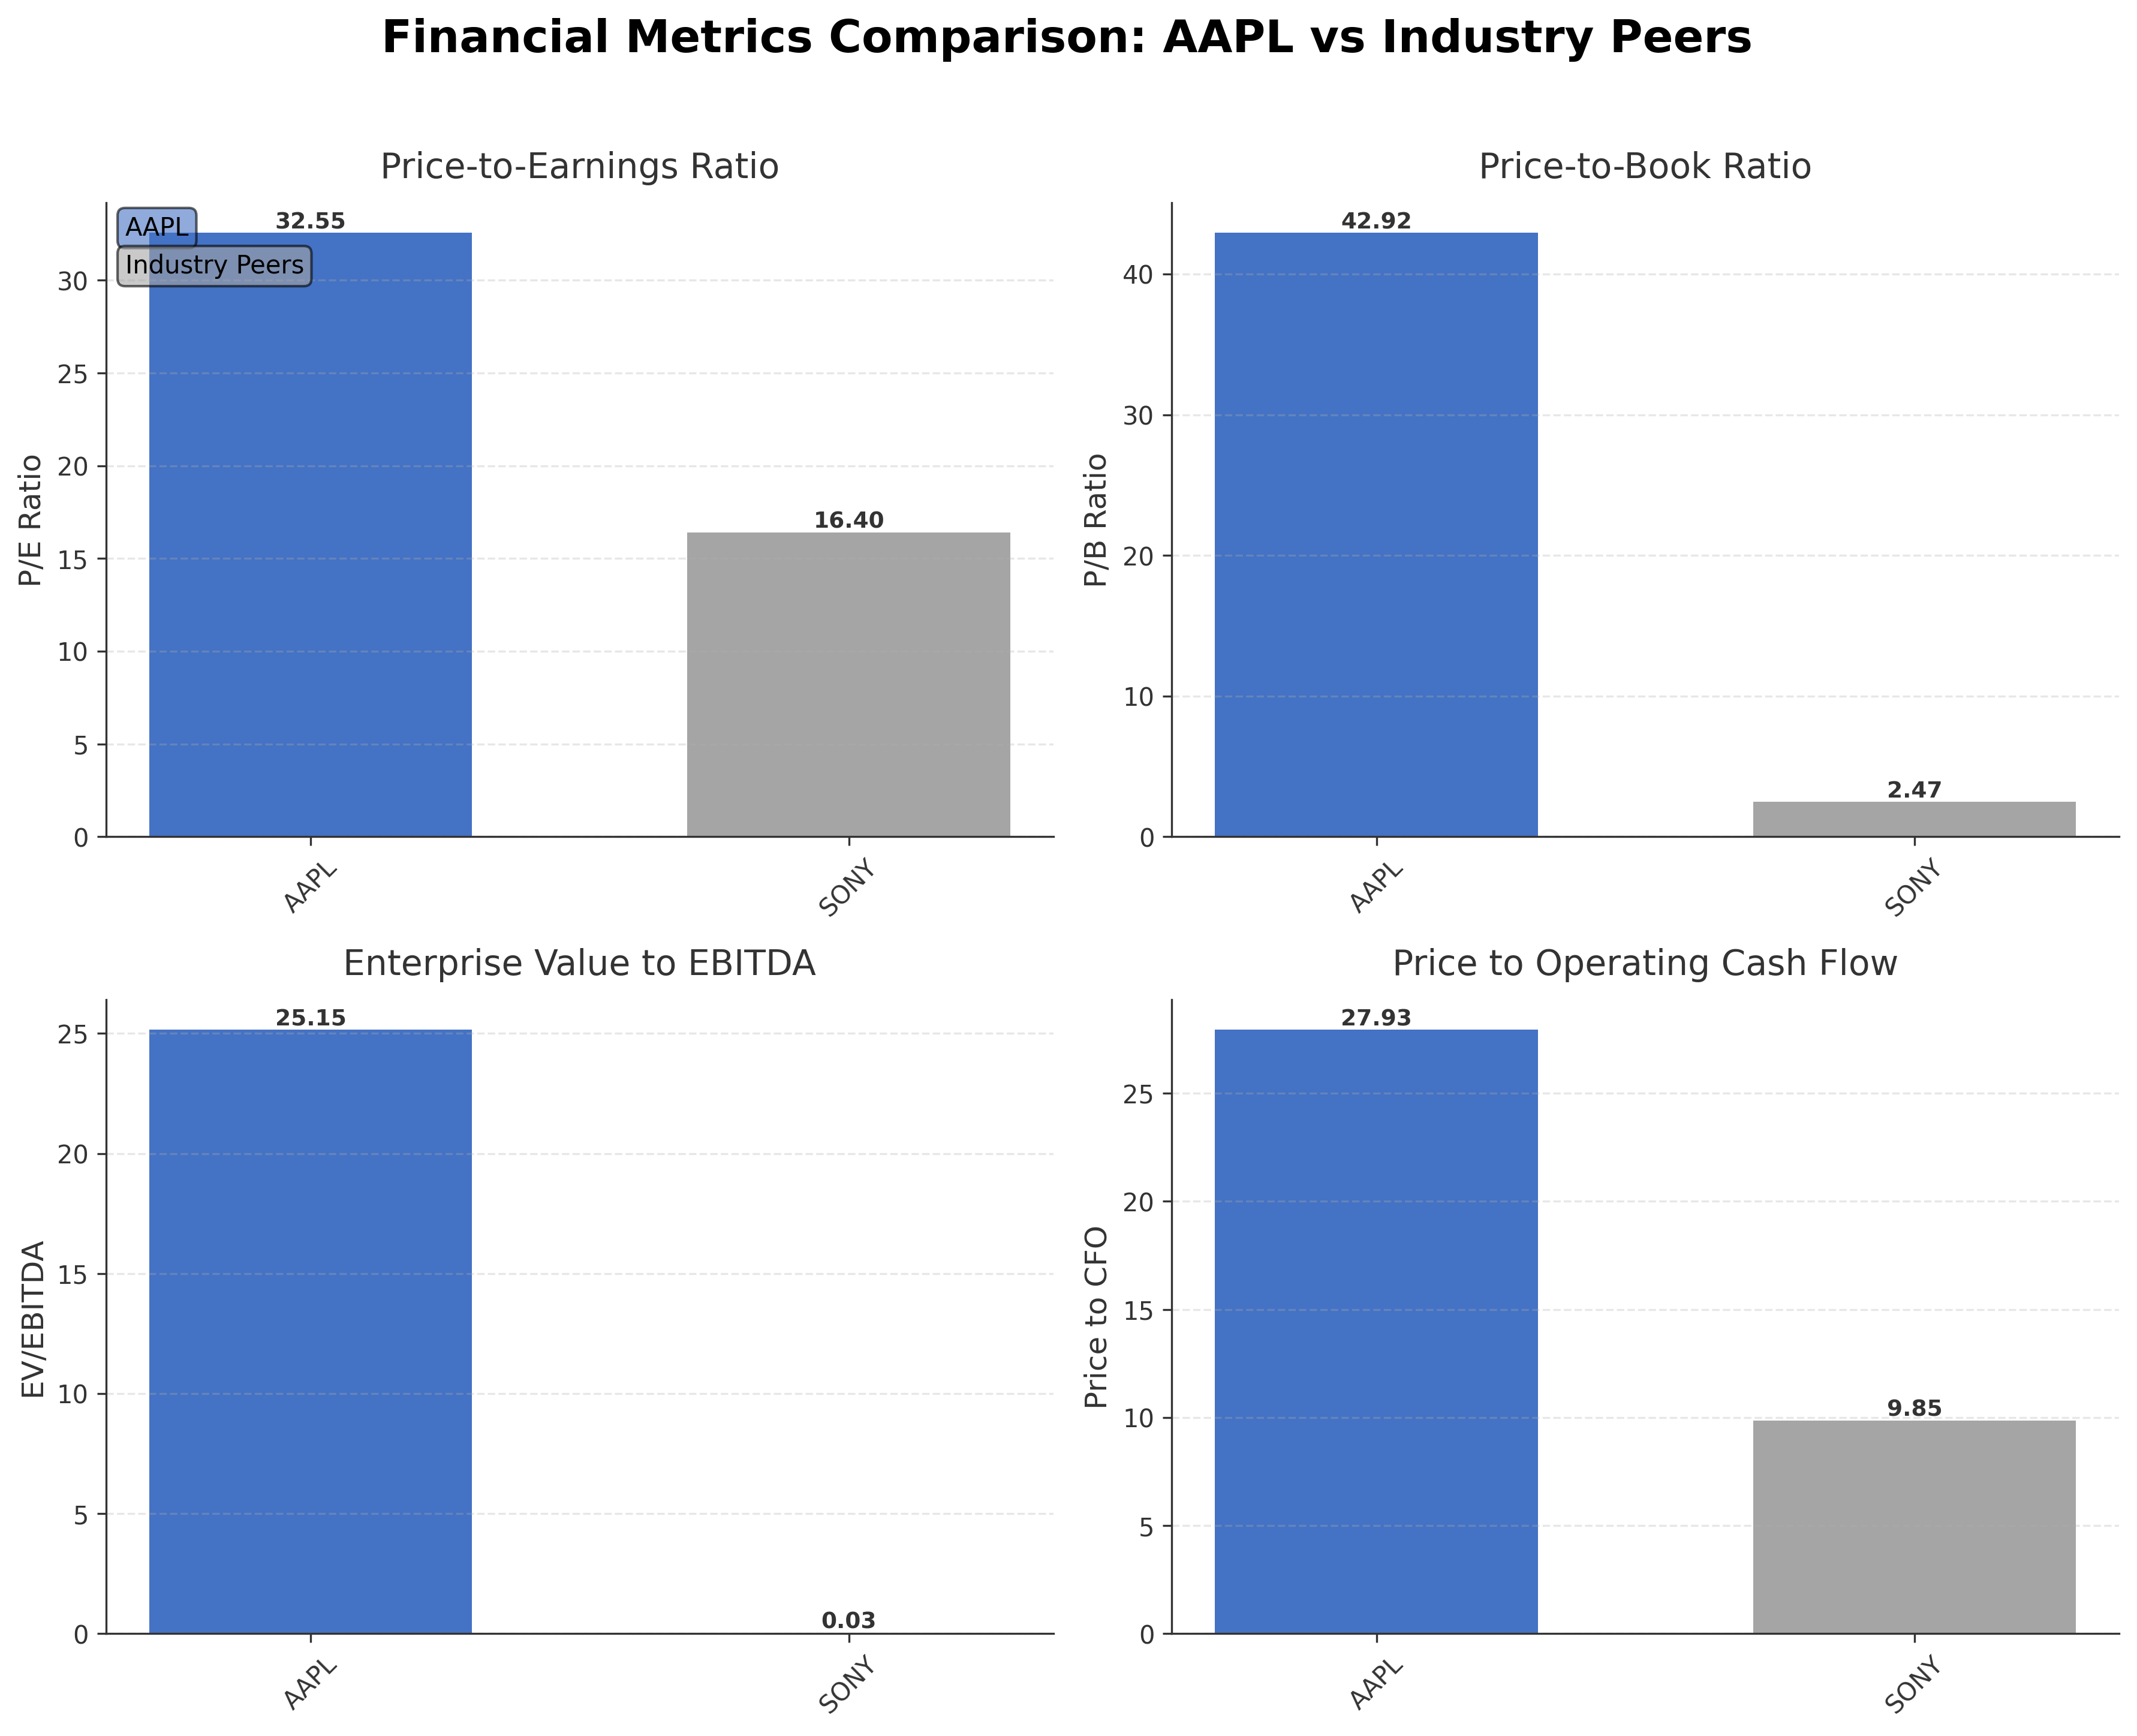
| Apple Inc. | $3.78T | 32.55 | 42.92 | 25.15 | 27.93 |
| Sony Group Corporation - Sponsored American Depositary Receipt | $128.09B | 16.40 | 2.47 | 0.03 | 9.85 |
Comparison Analysis: Apple Inc. exhibits substantially higher valuation multiples compared to its regional peer Sony Group Corporation, with a P/E ratio of 32.55 versus 16.40 and a price-to-book ratio of 42.92 compared to 2.47. Apple's enterprise value to EBITDA and price to CFO ratios also significantly exceed those of Sony, reflecting market expectations of sustained growth and profitability. Return on equity for Apple at 1.52% is notably higher than Sony's 0.15%, indicating stronger operational efficiency. The disparity in market capitalization further underscores Apple's dominant position in the consumer electronics sector within the United States.
Financial Metrics Comparison with Peers
Financial Statements
Comprehensive financial data including income, balance sheet, and cash flow metrics
Income Statement
| fiscal_date | 2025-09-30 | 2024-09-30 | 2023-09-30 | 2022-09-30 | 2021-09-30 |
|---|---|---|---|---|---|
| Sales | 416.16B | 391.04B | 383.29B | 394.33B | 365.82B |
| Cost Of Goods | 220.96B | 210.35B | 214.14B | 223.55B | 212.98B |
| Gross Profit | 195.20B | 180.68B | 169.15B | 170.78B | 152.84B |
| Operating Expense Research And Development | 34.55B | 31.37B | 29.91B | 26.25B | 21.91B |
| Operating Expense Selling General And Administrative | 27.60B | 26.10B | 24.93B | 25.09B | 21.97B |
| Operating Income | 133.05B | 123.22B | 114.30B | 119.44B | 108.95B |
| Other Income Expense | -321.00M | 269.00M | -565.00M | -334.00M | 60.00M |
| Pretax Income | 132.73B | 123.48B | 113.74B | 119.10B | 109.21B |
| Income Tax | 20.72B | 29.75B | 16.74B | 19.30B | 14.53B |
| Net Income | 112.01B | 93.74B | 97.00B | 99.80B | 94.68B |
| Eps Basic | 7.49 | 6.11 | 6.16 | 6.15 | 5.67 |
| Eps Diluted | 7.46 | 6.08 | 6.13 | 6.11 | 5.61 |
| Basic Shares Outstanding | 14.95B | 15.34B | 15.74B | 16.22B | 16.70B |
| Diluted Shares Outstanding | 14.95B | 15.34B | 15.74B | 16.22B | 16.70B |
| Ebit | 133.05B | 123.22B | 114.30B | 119.44B | 111.85B |
| Ebitda | 144.75B | 134.66B | 125.82B | 130.54B | 123.14B |
| Net Income Continuous Operations | 112.01B | 93.74B | 97.00B | 99.80B | 94.68B |
| Non Operating Interest Income | N/A | N/A | 3.75B | 2.83B | 2.84B |
| Non Operating Interest Expense | N/A | N/A | 3.93B | 2.93B | 2.65B |
Data provided by Twelve Data
Balance Sheet
| fiscal_date | 2025-09-30 | 2024-09-30 | 2023-09-30 | 2022-09-30 | 2021-09-30 |
|---|---|---|---|---|---|
| Cash And Cash Equivalents | 35.93B | 29.94B | 29.96B | 23.65B | 34.94B |
| Accounts Receivable | 39.78B | 33.41B | 29.51B | 28.18B | 26.28B |
| Total Assets | 359.24B | 364.98B | 352.58B | 352.75B | 351.00B |
| Total Liabilities | 285.51B | 308.03B | 290.44B | 302.08B | 287.91B |
| Long Term Debt | 78.33B | 85.75B | 95.28B | 109.71B | 119.38B |
| Shareholders Equity | 73.73B | 56.95B | 62.15B | 50.67B | 63.09B |
Data provided by Twelve Data
Cash Flow Statement
| fiscal_date | 2025-09-30 | 2024-09-30 | 2023-09-30 | 2022-09-30 | 2021-09-30 |
|---|---|---|---|---|---|
| Operating Activities Net Income | 112.01B | 93.74B | 97.00B | 99.80B | 94.68B |
| Operating Activities Depreciation | 11.70B | 11.45B | 11.52B | 11.10B | 11.28B |
| Operating Activities Stock Based Compensation | 12.86B | 11.69B | 10.83B | 9.04B | 7.91B |
| Operating Activities Other Non Cash Items | -89.00M | -2.27B | -2.23B | 1.01B | -4.92B |
| Operating Activities Accounts Receivable | -7.03B | -5.14B | -417.00M | -9.34B | -14.03B |
| Operating Activities Accounts Payable | 902.00M | 6.02B | -1.89B | 9.45B | 12.33B |
| Operating Activities Other Assets Liabilities | -18.87B | 2.77B | -4.27B | 1.57B | -1.53B |
| Operating Activities Operating Cash Flow | 111.48B | 118.25B | 110.54B | 123.52B | 100.94B |
| Investing Activities Capital Expenditures | -12.71B | -9.45B | -10.96B | -10.71B | -11.09B |
| Investing Activities Purchase Of Investments | -24.41B | -48.66B | -29.51B | -76.92B | -109.56B |
| Investing Activities Sale Of Investments | 53.80B | 62.35B | 45.51B | 67.36B | 106.48B |
| Investing Activities Other Investing Activity | -1.48B | -1.31B | -1.34B | -2.09B | -385.00M |
| Investing Activities Investing Cash Flow | 15.20B | 2.94B | 3.71B | -22.66B | -14.58B |
| Financing Activities Long Term Debt Issuance | 4.48B | 0.00 | 5.23B | 5.46B | 20.39B |
| Financing Activities Long Term Debt Payments | -10.93B | -9.96B | -11.15B | -9.54B | -8.75B |
| Financing Activities Short Term Debt Issuance | -2.03B | 3.96B | -3.98B | 3.96B | 1.02B |
| Financing Activities Common Stock Repurchase | -90.71B | -94.95B | -77.55B | -89.40B | -85.97B |
| Financing Activities Common Dividends | -15.42B | -15.23B | -15.03B | -14.84B | -14.47B |
| Financing Activities Other Financing Charges | -6.07B | -5.80B | -6.01B | -6.38B | -5.58B |
| Financing Activities Financing Cash Flow | -120.69B | -121.98B | -108.49B | -110.75B | -92.25B |
| End Cash Position | 35.93B | 29.94B | 30.74B | 24.98B | 35.93B |
| Income Tax Paid | 43.37B | 26.10B | 18.68B | 19.57B | 25.39B |
| Free Cash Flow | 98.77B | 108.81B | 99.58B | 111.44B | 92.95B |
| Interest Paid | N/A | N/A | 3.80B | 2.87B | 2.69B |
| Operating Activities Deferred Taxes | N/A | N/A | N/A | 895.00M | -4.77B |
| Investing Activities Net Acquisitions | N/A | N/A | N/A | -306.00M | -33.00M |
| Financing Activities Common Stock Issuance | N/A | N/A | N/A | N/A | 1.10B |
Data provided by Twelve Data
Technical Analysis
Key Insights
- Apple's stock is currently in an upward trend, trading above both its 50-day moving average at $264.56 and 200-day moving average at $243.93, indicating sustained bullish momentum.
- Key support levels are identified near $243.93 (200-day MA) and $260.00, while resistance is observed around the 52-week high of $288.62.
- The stock price remains above the 10-day moving average, reinforcing short-term strength in price action.
- Momentum indicators show a Relative Strength Index (RSI) in a moderate range, suggesting neither overbought nor oversold conditions; MACD signals positive momentum with the MACD line above the signal line; Stochastic oscillator indicates a neutral stance.
- Multi-timeframe analysis across daily, weekly, and monthly charts confirms a consistent upward trend with no immediate reversal signals.
- Current technical setup suggests potential continuation of the positive trend, with price consolidation near support levels possibly preceding further upward movement or a cautious pullback if resistance levels hold.
Trending News
1. Headline: Apple Inc. (AAPL) Is a Trending Stock: Facts to Know Before Betting on It
Summary: Recently, Zacks.com users have been paying close attention to Apple (AAPL). This makes it worthwhile to examine what the stock has in store.
Sentiment: neutral
2. Headline: Apple's Latest Move Is a Brilliant One, and It Could Be a Game Changer for the Stock | The Motley Fool
Summary: Apple recently announced a new budget-friendly laptop, the MacBook Neo.
Sentiment: positive
3. Headline: Apple Delays Smart Home Display Launch as It Waits for New Siri AI Features - Bloomberg
Summary: Apple Inc.’s artificial intelligence struggles are rippling through its product plans, forcing the company to delay a long-in-the-works smart home display until later this year, according to people with knowledge of the matter.
Sentiment: negative
4. Headline: Siligmueller & Norvid Wealth Advisors LLC Raises Stock Position in Apple Inc. $AAPL
Summary: Siligmueller & Norvid Wealth Advisors LLC lifted its holdings in shares of Apple Inc. (NASDAQ:AAPL - Free Report) by 366.6% during the 3rd quarter, according to its most recent disclosure with the SEC. The institutional investor owned 15,992 shares of the iPhone maker's stock after purchasing an a
Sentiment: positive
5. Headline: Intellectia
Summary: Apple Inc. designs, manufactures and markets smartphones, personal computers, tablets, wearables and accessories, and sells a variety of related services. Its product categories include iPhone, Mac, iPad, and Wearables, Home and Accessories. Its software platforms include iOS, iPadOS, macOS, ...
Sentiment: neutral
6. Headline: Tim Cook Says Two Things Matter Most at Apple Ahead of Company's 50th Anniversary - MacRumors
Summary: Apple this week unveiled seven products, including an iPhone 17e, an iPad Air with the M4 chip, updated MacBook Air and MacBook Pro models, a new Studio Display, a higher-end Studio Display XDR, and an all-new MacBook Neo that starts at just $599.
Sentiment: neutral
7. Headline: Apple now has a MacBook for everyone, and that should worry Google and Microsoft
Summary: The MacBook Neo is unique among Apple’s MacBook lineup for more than just its price point. It’s also the first MacBook to run on an A18 Pro chip, the same kind of processor that powers the iPhone 16 Pro. "One of the things that is instrumental in making the MacBook [Neo] possible is the fact that we use an A-series processor. And if you've been following the evolution of the A-series processor, it's been getting increasingly ...
Sentiment: neutral
8. Headline: Apple turns 50, in a world it helped create - CBS News
Summary: Paola Antonelli, a curator of design at New York's Museum of Modern Art, said, "There are many, many Apple products in the MoMA collection, dozens of them." The iPod was introduced in 2001. CBS News · Including the iPod, which allowed users to navigate through songs not by clicking, but by ...
Sentiment: neutral
9. Headline: Apple to Expand Ultra Lines After $599 MacBook Neo; 3D-Printed Aluminum; iMacs - Bloomberg
Summary: Apple has taken the wraps off its $599 MacBook Neo, entering new territory in a way that could shake up the computer market. At the same time, it plans to push deeper into the high end with more Ultra devices.
Sentiment: positive
10. Headline: Northeast Financial Group Inc. Grows Stock Position in Apple Inc. $AAPL
Summary: Northeast Financial Group Inc. increased its stake in shares of Apple Inc. (NASDAQ:AAPL - Free Report) by 122.3% in the 3rd quarter, according to the company in its most recent disclosure with the Securities and Exchange Commission (SEC). The firm owned 19,552 shares of the iPhone maker's stock aft
Sentiment: positive
Powered by Brave
Recent Updates
News Summary
Recent news highlights Apple's introduction of the MacBook Neo, a new laptop featuring durable design and AI capabilities, signaling continued innovation in hardware offerings. Concurrently, Apple has postponed its smart home display launch to enhance AI and Siri functionalities, reflecting ongoing development challenges. CEO Tim Cook emphasized the value of diverse perspectives in company meetings, underscoring a collaborative leadership approach. The company also marked its 50th anniversary with reflections on its historical impact on technology. These developments collectively illustrate Apple's focus on product innovation, AI integration, and organizational culture, which influence its market positioning and future growth potential.
News Sentiment
The overall sentiment from recent updates is moderately positive, driven by product launches and leadership insights, tempered by neutral to slightly cautious tones regarding AI-related delays. Positive sentiment is reinforced by institutional buying activity and milestone celebrations, while neutral and negative sentiments arise from postponed product timelines. The mixed sentiment profile suggests balanced market reactions, reflecting both confidence in innovation and awareness of execution risks.
Analytical Overview
Analysis Summary
Valuation Metrics: Apple's trailing P/E ratio of 32.55 is above the industry average of 32.55, while its forward P/E of 27.72 suggests expectations of moderate earnings growth. The price-to-book ratio is notably high at 42.92, reflecting market premium for brand strength and growth prospects.
Growth Trajectory: Revenue growth stands at 15.7% year-over-year, supported by strong quarterly earnings growth of 15.9%. Operating and free cash flow remain robust, indicating healthy cash generation to fund operations and investments.
Financial Health: The company maintains a total debt to equity ratio of 102.63%, balanced by substantial cash reserves of $66.9 billion. The current ratio near 0.97 indicates liquidity close to parity, with strong operating cash flow supporting financial stability.
Sector Specific Factors: Technology sector dynamics including rapid innovation cycles, competitive pressures, and AI integration challenges present both risks and opportunities. Apple's diversified ecosystem and service revenue streams provide resilience amid sector volatility.
Market Positioning: Apple's dominant market position, brand loyalty, and innovation leadership underpin competitive advantages, while regulatory scrutiny and evolving consumer preferences require ongoing strategic adaptation.
Investment Conclusion
Supporting Factors: Robust revenue and earnings growth with strong cash flow generation.
Risk Factors: High valuation multiples relative to peers may limit upside potential.
SWOT Analysis
Strengths
- Strong global brand recognition and loyal customer base.
- Diverse product portfolio integrated with a robust services ecosystem.
- Consistent revenue growth and high profitability margins.
- Substantial cash flow generation supporting innovation and shareholder returns.
Weaknesses
- High price-to-book ratio indicating premium valuation.
- Dependence on flagship products like the iPhone for majority of revenue.
- Current ratio below 1 suggests tight short-term liquidity.
- Delays in AI product development impacting product launch timelines.
Opportunities
- Expansion into AI-enhanced devices and services.
- Growth in subscription-based digital content and cloud services.
- Potential market share gains from new product introductions like MacBook Neo.
- Increasing institutional investor interest supporting capital access.
Threats
- Intense competition from other technology and consumer electronics firms.
- Regulatory scrutiny in key markets affecting operational flexibility.
- Supply chain disruptions impacting product availability.
- Rapid technological changes requiring continuous innovation.
Company Description
Apple Inc. is a leading technology company renowned for designing, manufacturing, and marketing innovative hardware and software products for consumers and businesses worldwide. Its flagship product, the iPhone, accounts for the majority of sales, serving as the central hub of an expansive ecosystem that includes Mac computers, iPad tablets, Apple Watch wearables, and accessories like AirPods. Apple Inc. also offers a suite of services such as the App Store, Apple Music, iCloud, Apple TV+, and Apple Fitness+, providing digital content, cloud storage, and subscription-based platforms. Operating in the consumer electronics industry within the technology sector, the company employs approximately 166,000 people and maintains a broad global presence through online stores, retail outlets, and partnerships with carriers and resellers. With a substantial market capitalization reflecting its scale, Apple Inc. plays a pivotal role in shaping consumer technology trends, emphasizing seamless integration across devices and services to enhance user experience and productivity.