
Apple Inc (AAPL)
Stock Analysis Report
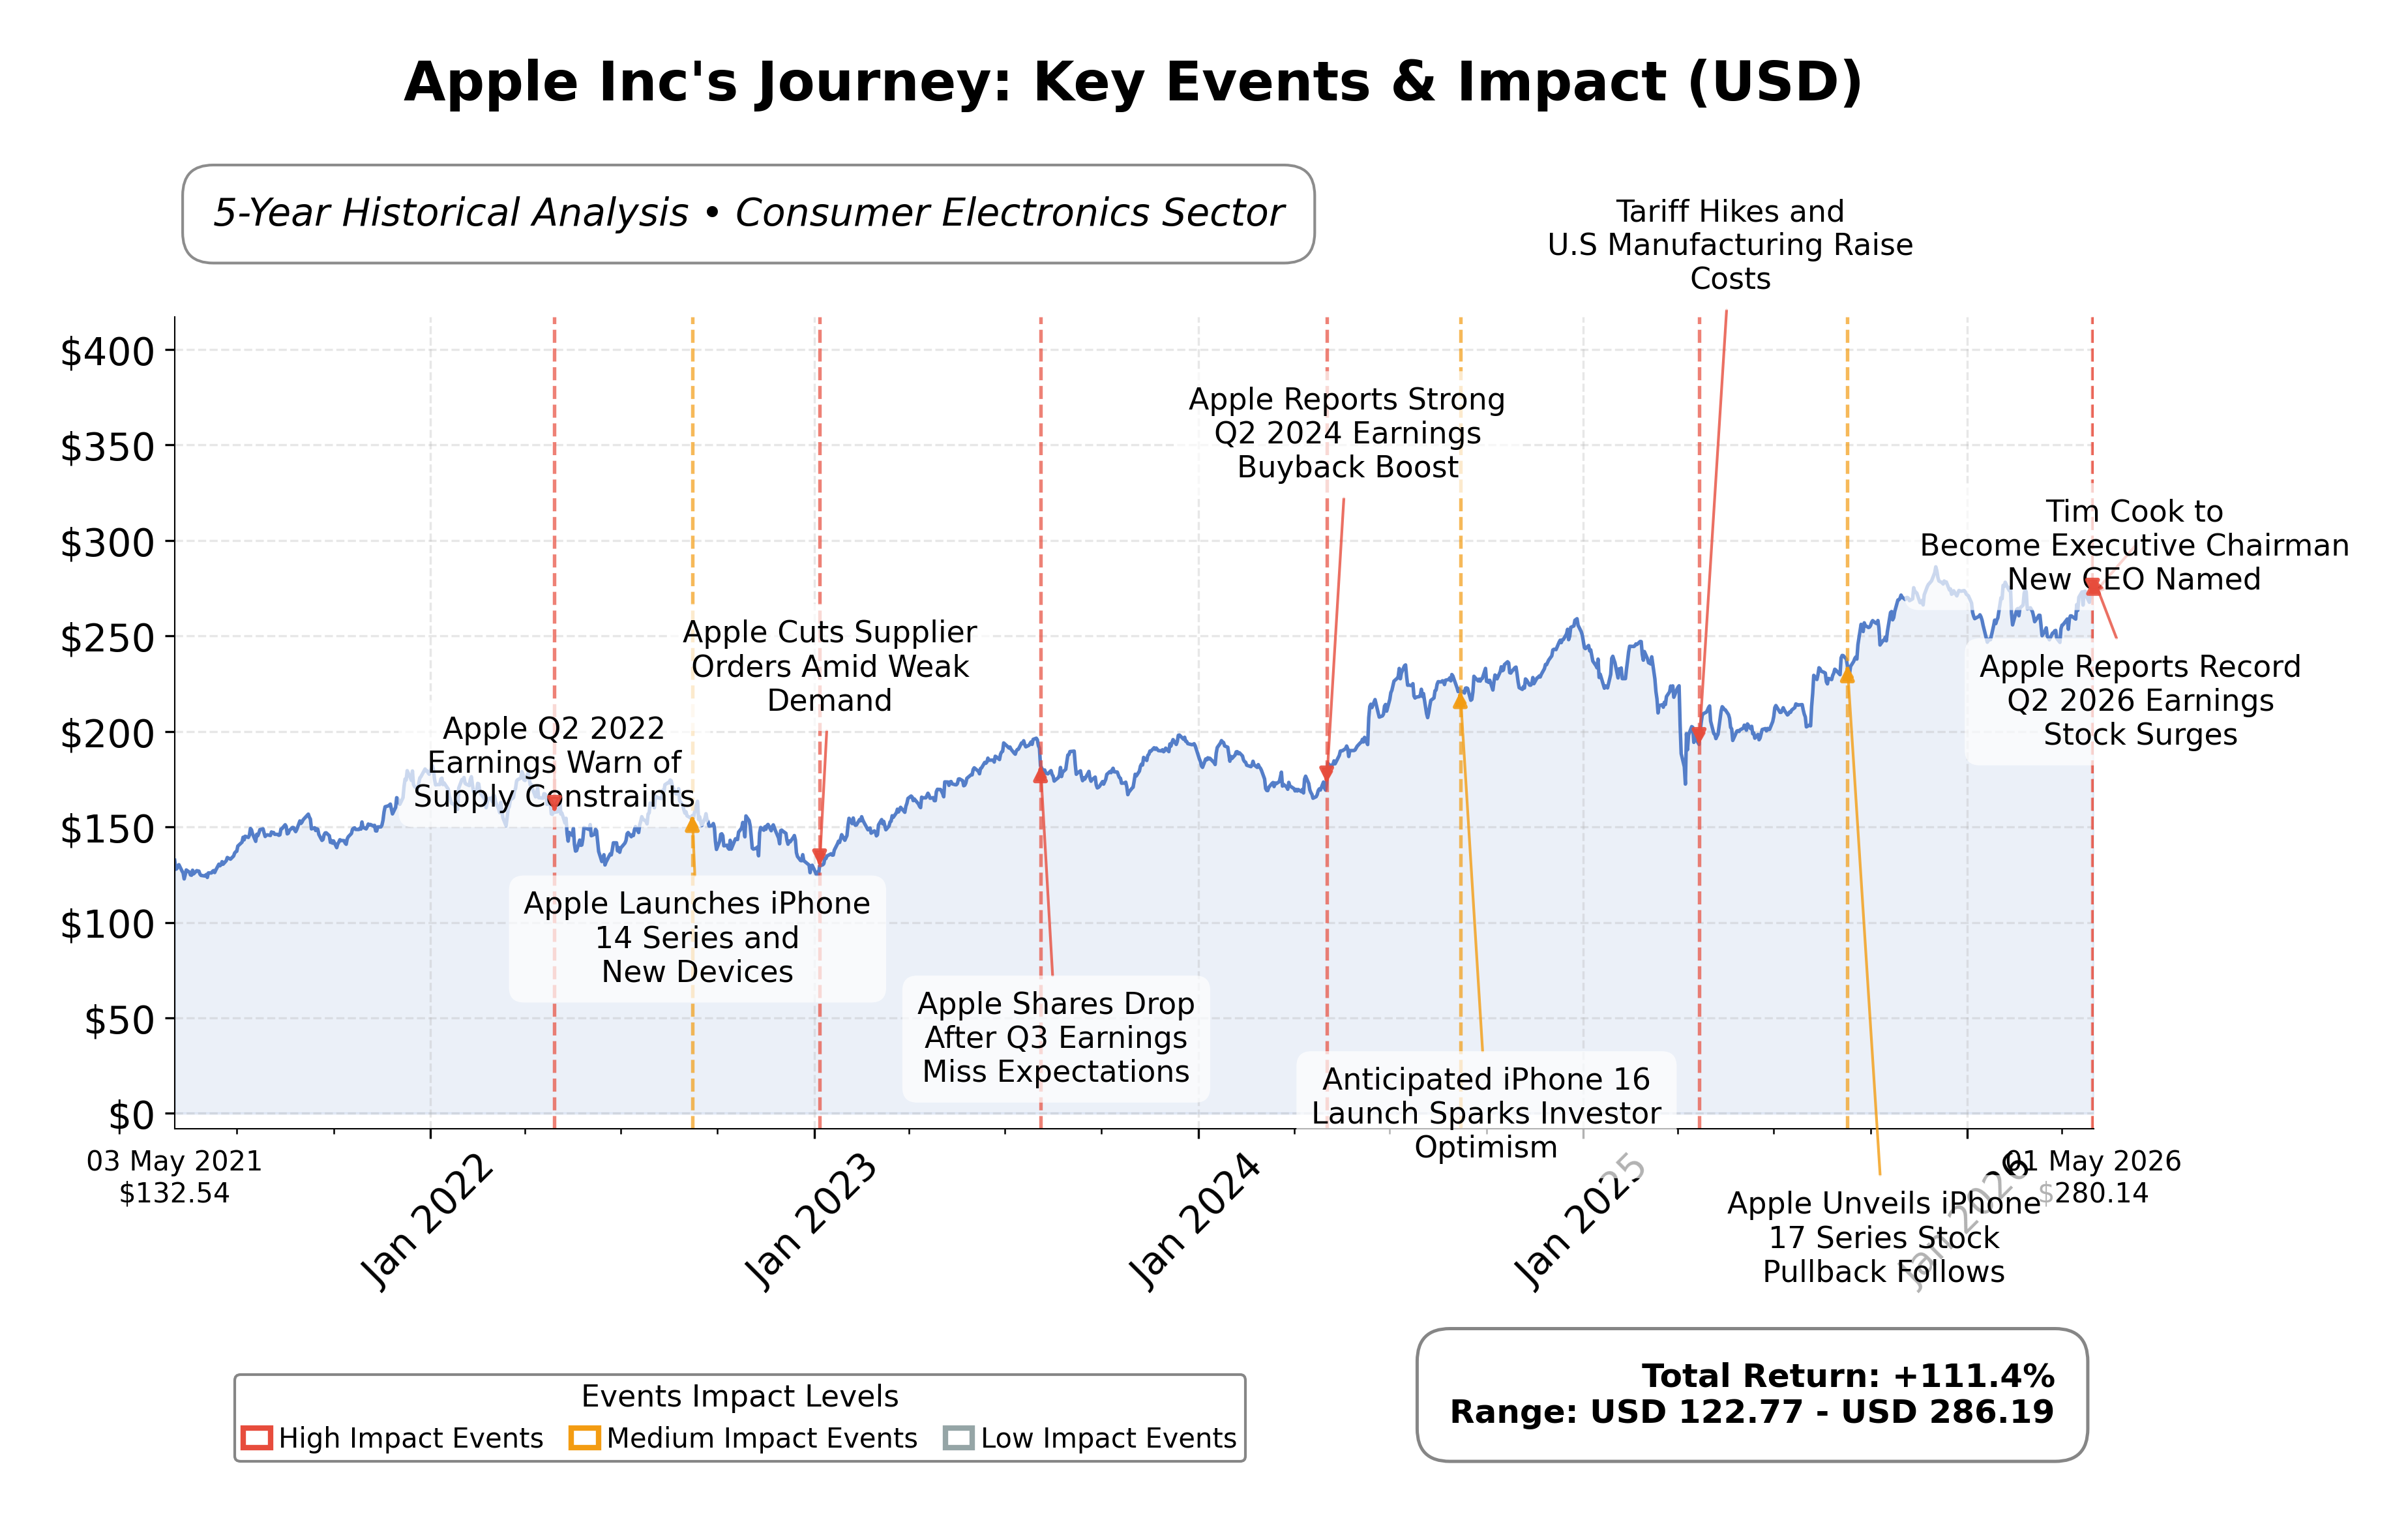
Stock Journey
Key Positives and Key Risks
Pros
- Strong profitability with a net profit margin of 27.15% and return on equity of 141.47%, indicating efficient capital use.
- Robust cash flow generation with operating cash flow of $140.2 billion and free cash flow of $100.5 billion supporting financial flexibility.
- Solid growth trajectory evidenced by 16.6% quarterly revenue growth and 19.4% earnings growth year-over-year.
Cons
- High valuation multiples including a P/E ratio of 33.92 and price-to-book ratio of 46.71, reflecting premium pricing risk.
- Margin pressure risks due to rising memory prices and potential supply chain disruptions.
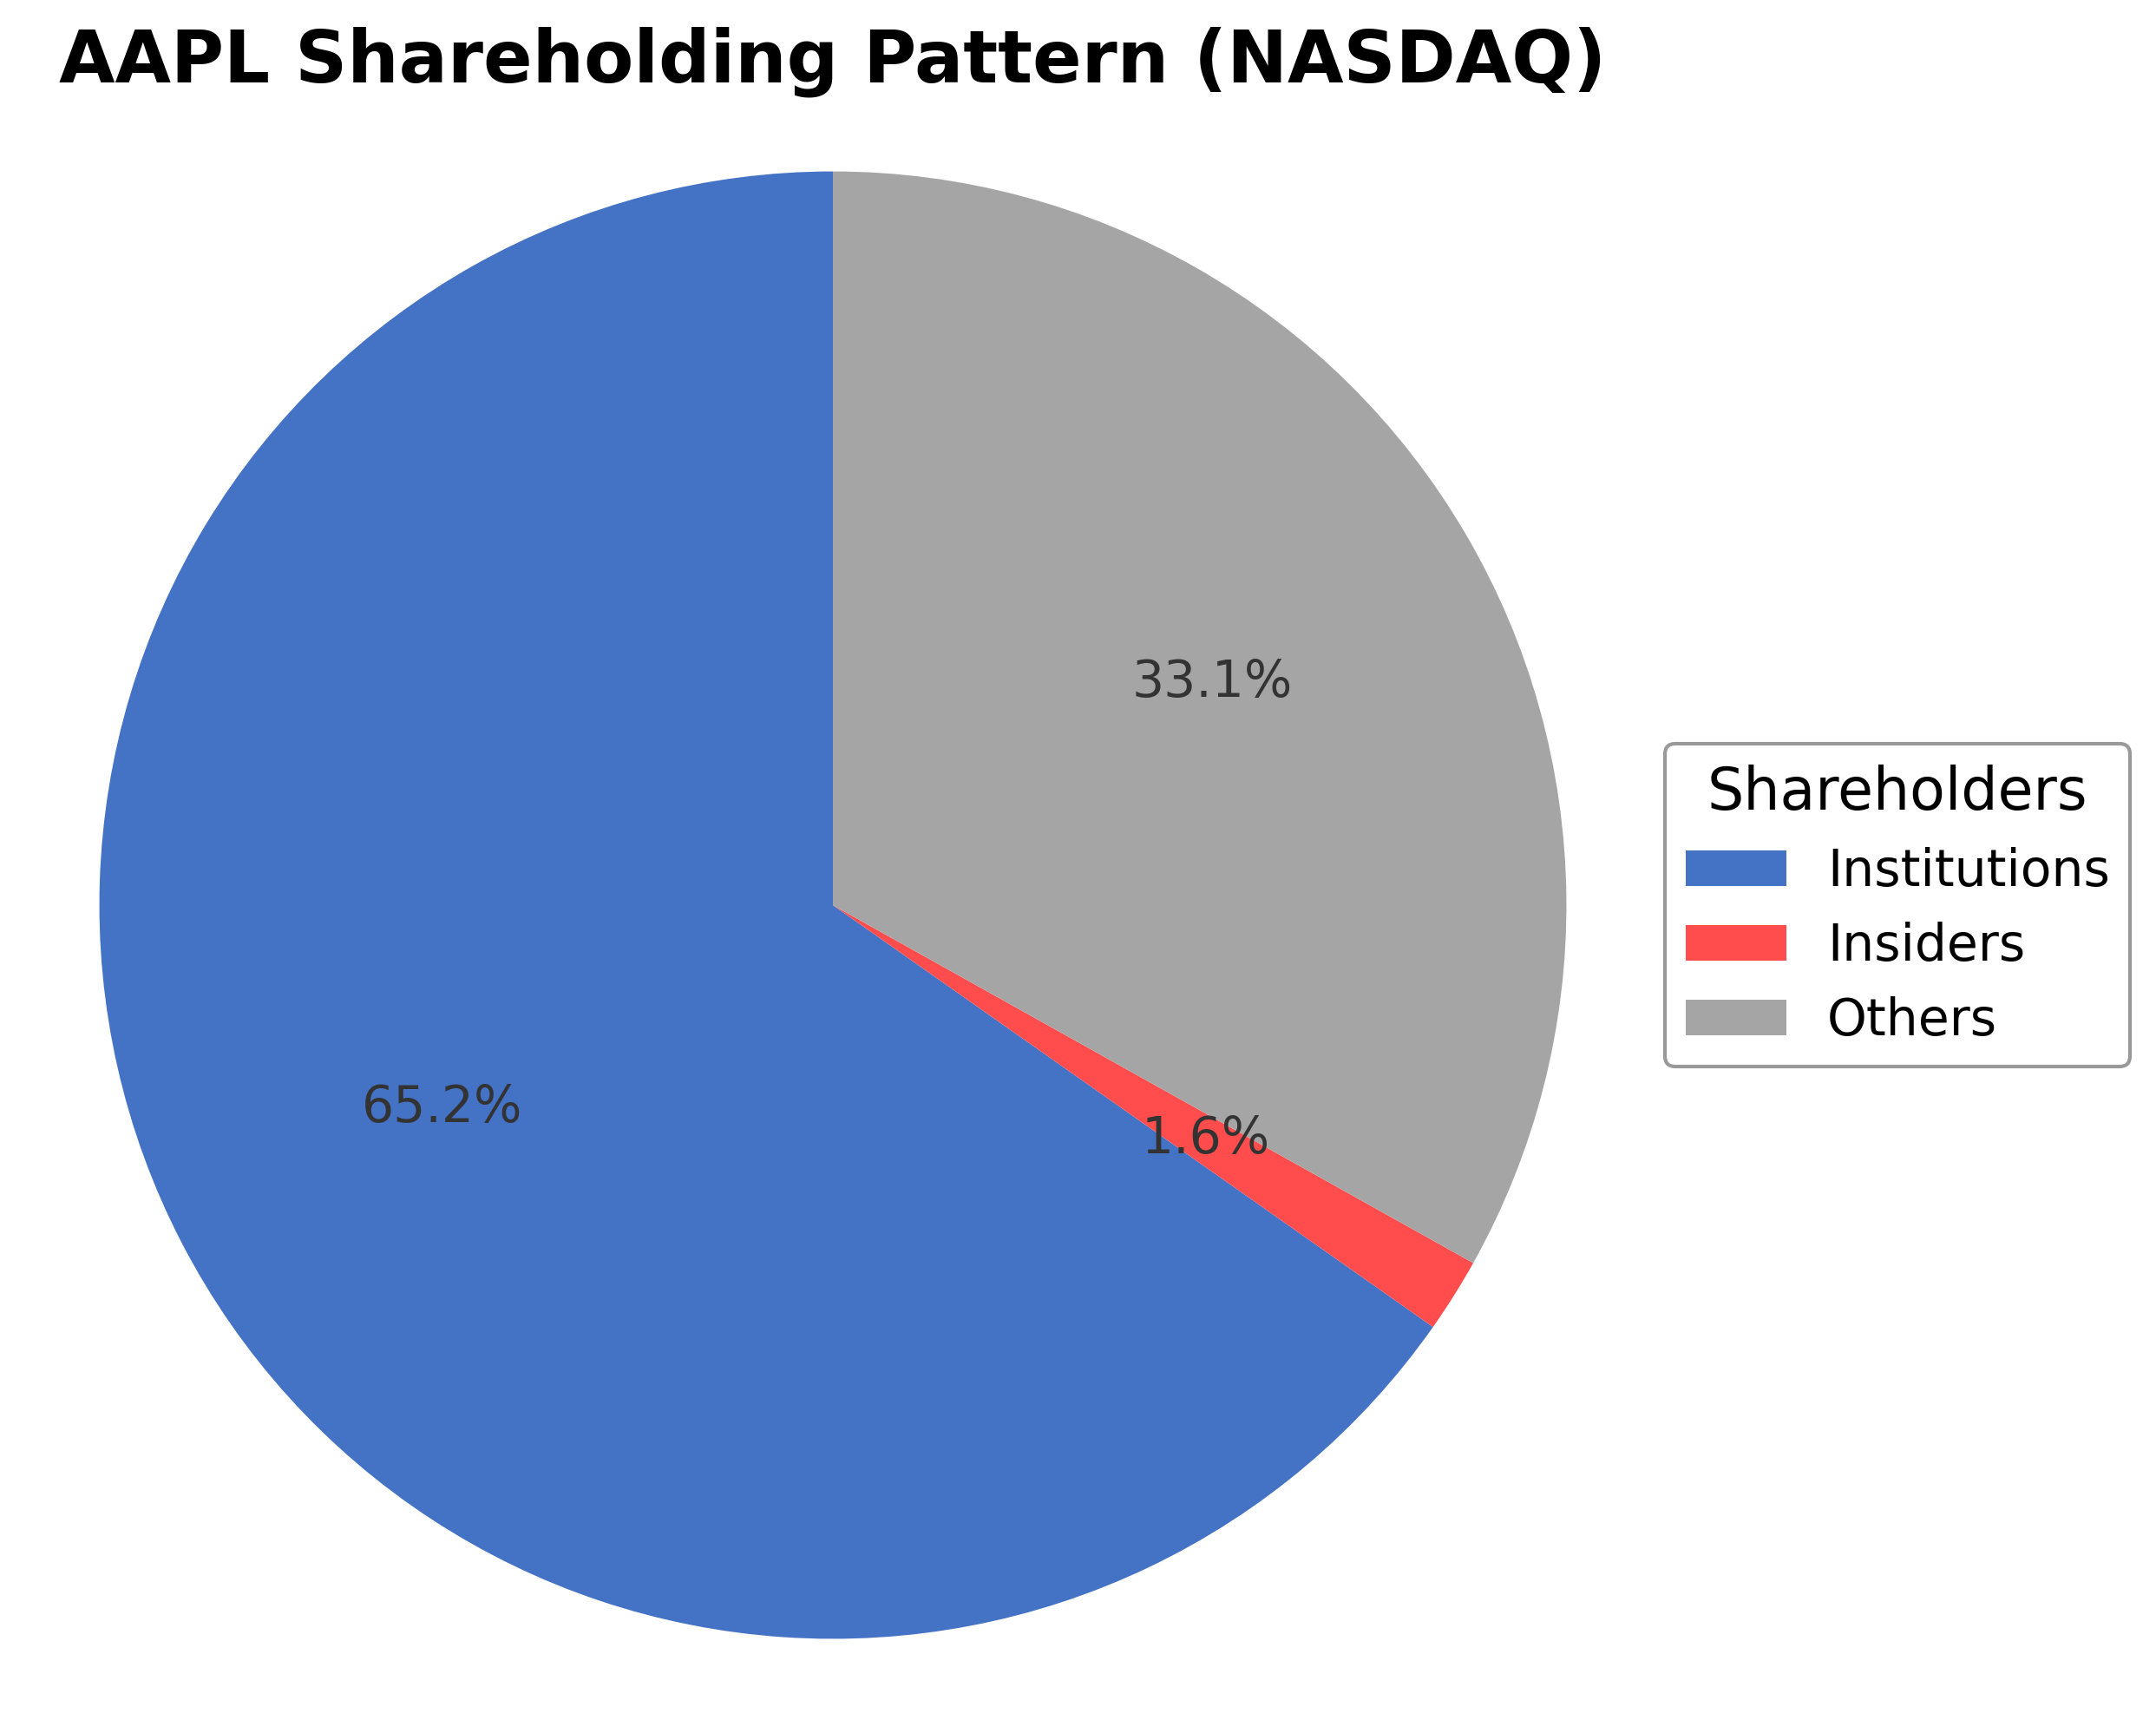
- Relatively low insider ownership at 1.64%, which may limit direct alignment of management with shareholders.
Disclosure: This information is for general awareness and does not constitute investment advice
Report Summary
Apple Inc. is a leading technology company listed on NASDAQ under the symbol AAPL, operating within the consumer electronics industry and technology sector. The company designs, manufactures, and markets a broad range of innovative hardware and software products, including the flagship iPhone, Mac computers, iPad tablets, Apple Watch, and accessories such as AirPods. Apple also provides digital services like the App Store, Apple Music, iCloud, and Apple TV+, serving a global customer base through online and physical retail channels. Its market positioning is strong, supported by a vast ecosystem that integrates hardware and services seamlessly.
Financially, Apple reported trailing twelve months (TTM) revenue of approximately $451.4 billion with a profit margin of 27.15%, operating margin of 32.28%, and net income of $122.6 billion. The company exhibits robust efficiency metrics with a return on equity (ROE) of 141.47% and return on assets (ROA) of 26.23%. Operating cash flow stands at $140.2 billion TTM, and free cash flow is $100.5 billion, reflecting strong cash generation capabilities. These figures indicate Apple’s sustained profitability and operational efficiency in a competitive market.
Valuation metrics show a trailing P/E ratio of 33.92, forward P/E of 29.39, and an EV/EBITDA multiple of 25.79, suggesting the stock trades at a premium relative to earnings and cash flow. The price-to-book ratio is notably high at 46.71, reflecting significant market expectations for growth and intangible assets. Apple’s market capitalization is approximately $4.11 trillion, with the stock price currently at $280.15, near its 52-week high of $288.62 and well above the 52-week low of $193.25, indicating strong market confidence.
Apple’s key strengths include its dominant market position, strong cash flow generation, and a low debt-to-equity ratio of 79.55%, which supports financial flexibility. Institutional ownership is substantial at 65.25%, reflecting confidence from major investors. Risks include potential margin pressure from rising memory prices and global supply chain challenges. Recent strategic actions include a $100 billion stock repurchase authorization and leadership transition with John Ternus named as the next CEO, continuing the company’s tradition of secrecy and innovation.
Technically, Apple’s stock is trading above its 50-day and 200-day moving averages, supported by positive momentum indicators and strong earnings guidance projecting 14-17% revenue growth in the next quarter. Market sentiment is mixed with some volatility expected around earnings events. Overall, the data suggests a stable trajectory with conditions favoring cautious accumulation and monitoring of upcoming developments.
Company and Industry Overview
Company Basics
Price Performance
Company Size
Shareholding Pattern
Sector and Industry Analysis
The global apple market is projected to grow by approximately USD 15.94 billion between 2024 and 2029, with a compound annual growth rate (CAGR) of 3.4%. This growth is supported by increasing consumer demand driven by health benefits and the introduction of new apple varieties. The market comprises around 25 key vendors, including Auvil Fruit Co. Inc., Batlow Fruit Co. Pty Ltd, and Stemilt Growers LLC, which collectively shape the competitive landscape.
Current industry trends highlight the rising popularity of urban farming and the expansion of retail sectors, including private-label brands, which are significant growth drivers. Competitive dynamics are influenced by factors such as price sensitivity, product differentiation, and distribution channels split between offline and online sales. Barriers to entry remain moderate due to established vendor presence and the need for efficient supply chains and quality control.
Regulatory frameworks impacting the apple market focus on food safety standards, import-export controls, and agricultural practices, which vary across regions like APAC, Europe, and North America. Compliance with these regulations affects operational costs and market access for vendors. The outlook suggests that evolving regulations will continue to influence market strategies and vendor positioning through 2029.
Note: Analysis synthesized from industry research, market reports, and regulatory filings. Information is subject to change based on market conditions.
Financial Ratios Dashboard
Illustrative Scenario Analysis
DCF Assumptions:
Method: Two-Stage EPS-Priority Model
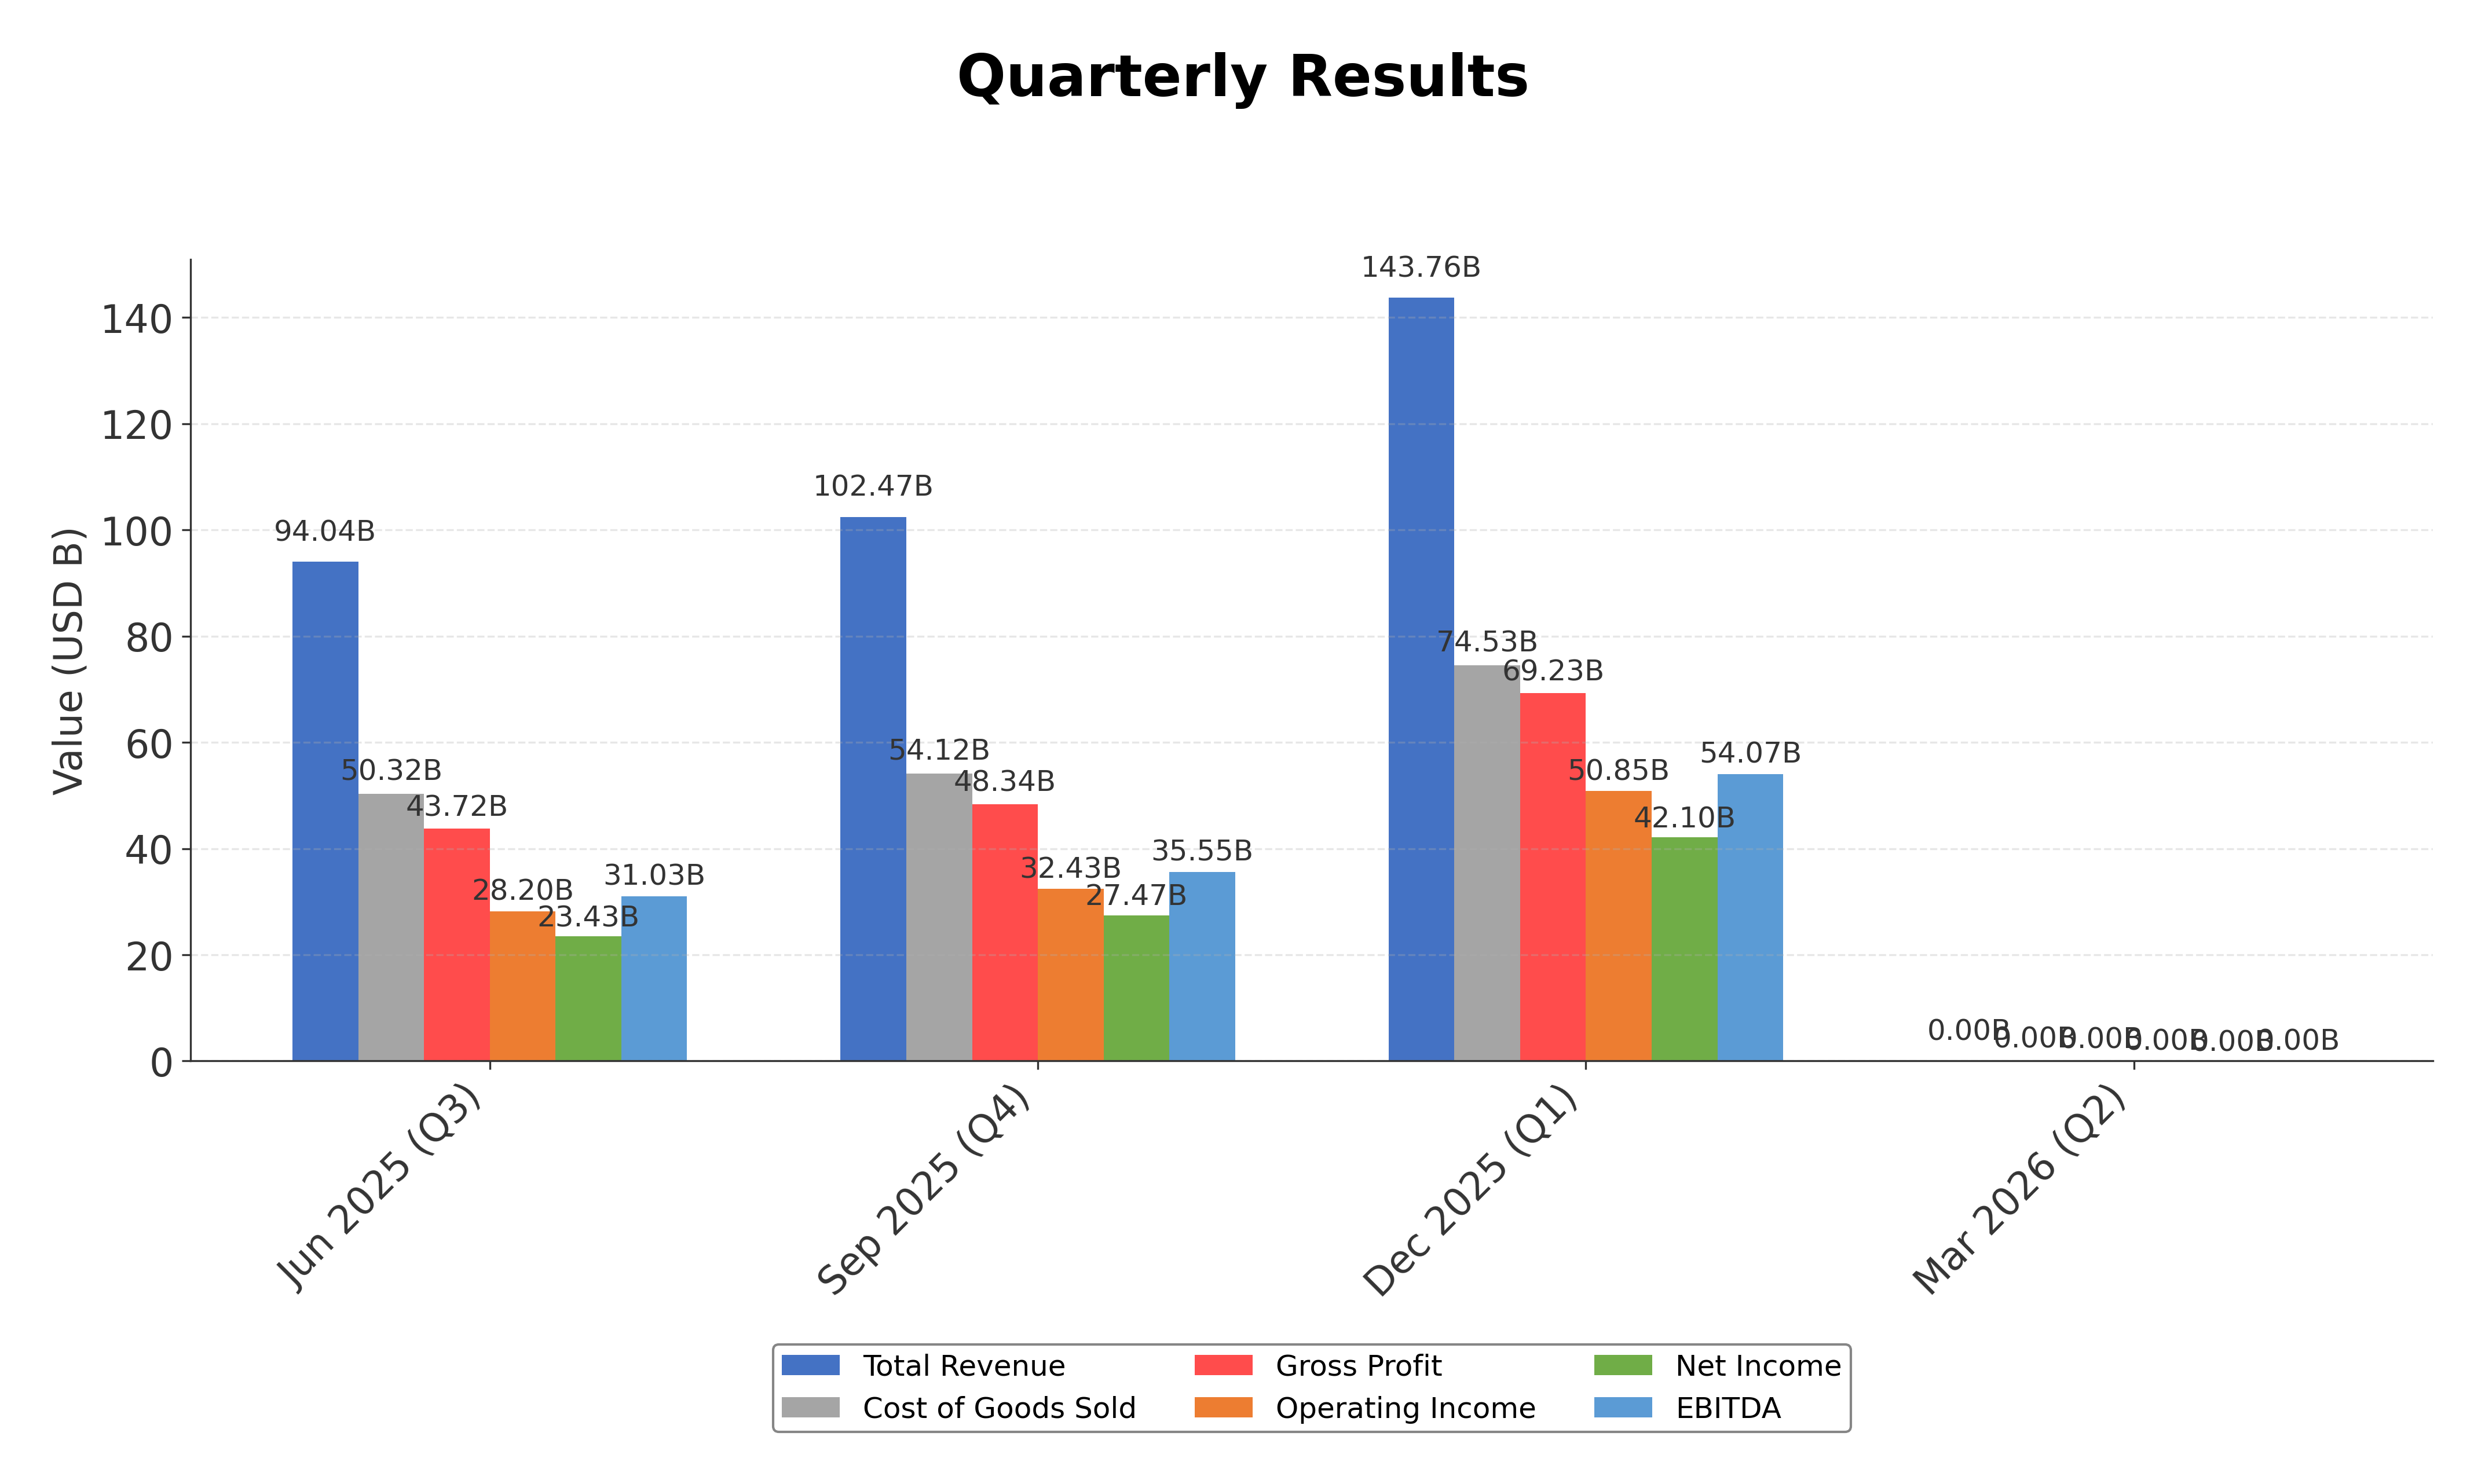
Financials
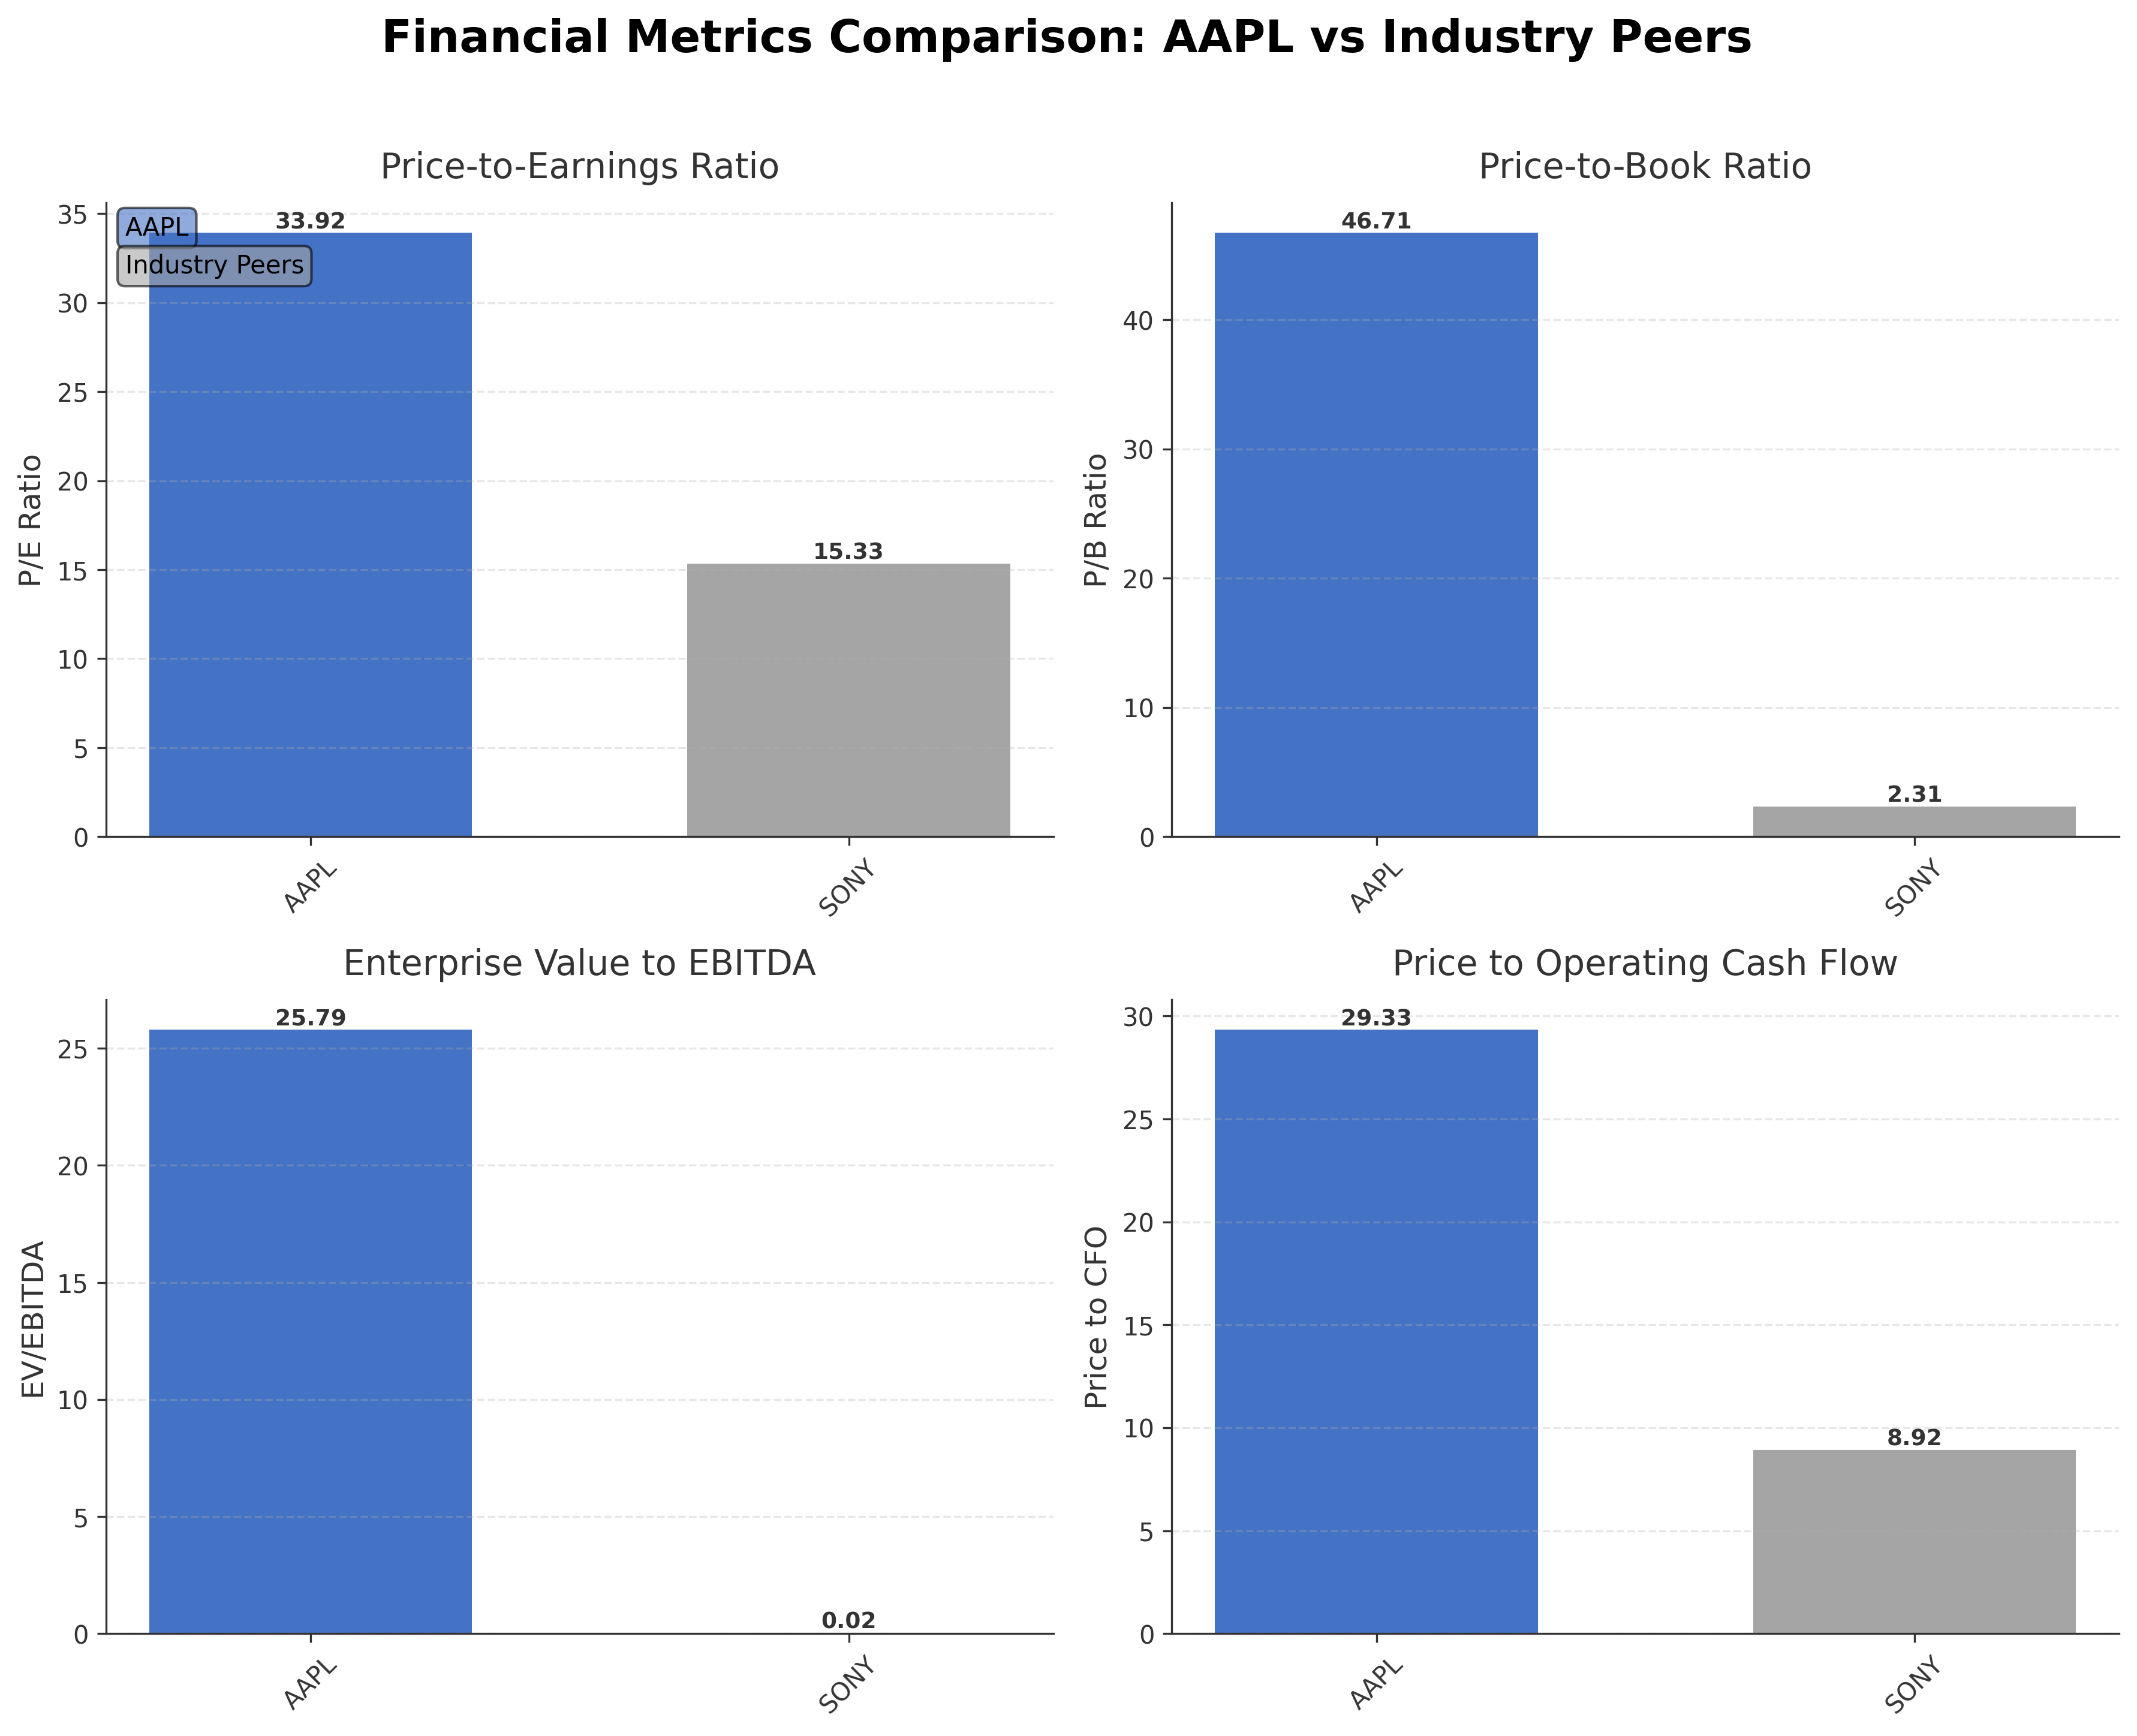
Peer Analysis
| Company Name | Market Cap | P/E Ratio | P/B Ratio | EV/EBITDA | Price to CFO |
|---|---|---|---|---|---|
| Apple Inc | $4.11T | 33.92 | 46.71 | 25.79 | 29.33 |
| Sony Group Corporation - Sponsored American Depositary Receipt | $116.85B | 15.33 | 2.31 | 0.02 | 8.92 |
Comparison Analysis: Apple Inc. significantly outpaces its peer Sony Group Corporation in market capitalization, trading at $4.11 trillion versus Sony's $116.85 billion, reflecting its dominant industry position. Apple's valuation multiples, including a P/E ratio of 33.92 and P/B ratio of 46.71, are substantially higher than Sony's 15.33 and 2.31 respectively, indicating a premium valuation driven by stronger profitability and growth expectations. Apple’s return on equity of 141.47% far exceeds Sony’s 0.15%, underscoring superior operational efficiency and shareholder value creation. The EV/EBITDA and price-to-CFO ratios also highlight Apple’s robust cash flow generation relative to its enterprise value. Overall, Apple stands as a clear industry leader with superior financial metrics compared to regional peers.
Financial Metrics Comparison with Peers
Financial Statements
Comprehensive financial data including income, balance sheet, and cash flow metrics
Income Statement
| fiscal_date | 2025-09-30 | 2024-09-30 | 2023-09-30 | 2022-09-30 | 2021-09-30 |
|---|---|---|---|---|---|
| Sales | 416.16B | 391.04B | 383.29B | 394.33B | 365.82B |
| Cost Of Goods | 220.96B | 210.35B | 214.14B | 223.55B | 212.98B |
| Gross Profit | 195.20B | 180.68B | 169.15B | 170.78B | 152.84B |
| Operating Expense Research And Development | 34.55B | 31.37B | 29.91B | 26.25B | 21.91B |
| Operating Expense Selling General And Administrative | 27.60B | 26.10B | 24.93B | 25.09B | 21.97B |
| Operating Income | 133.05B | 123.22B | 114.30B | 119.44B | 108.95B |
| Other Income Expense | -321.00M | 269.00M | -565.00M | -334.00M | 60.00M |
| Pretax Income | 132.73B | 123.48B | 113.74B | 119.10B | 109.21B |
| Income Tax | 20.72B | 29.75B | 16.74B | 19.30B | 14.53B |
| Net Income | 112.01B | 93.74B | 97.00B | 99.80B | 94.68B |
| Eps Basic | 7.49 | 6.11 | 6.16 | 6.15 | 5.67 |
| Eps Diluted | 7.46 | 6.08 | 6.13 | 6.11 | 5.61 |
| Basic Shares Outstanding | 14.95B | 15.34B | 15.74B | 16.22B | 16.70B |
| Diluted Shares Outstanding | 14.95B | 15.34B | 15.74B | 16.22B | 16.70B |
| Ebit | 133.05B | 123.22B | 114.30B | 119.44B | 111.85B |
| Ebitda | 144.75B | 134.66B | 125.82B | 130.54B | 123.14B |
| Net Income Continuous Operations | 112.01B | 93.74B | 97.00B | 99.80B | 94.68B |
| Non Operating Interest Income | N/A | N/A | 3.75B | 2.83B | 2.84B |
| Non Operating Interest Expense | N/A | N/A | 3.93B | 2.93B | 2.65B |
Source: Financial statements and regulatory filings
Balance Sheet
| fiscal_date | 2025-09-30 | 2024-09-30 | 2023-09-30 | 2022-09-30 | 2021-09-30 |
|---|---|---|---|---|---|
| Cash And Cash Equivalents | 35.93B | 29.94B | 29.96B | 23.65B | 34.94B |
| Accounts Receivable | 39.78B | 33.41B | 29.51B | 28.18B | 26.28B |
| Total Assets | 359.24B | 364.98B | 352.58B | 352.75B | 351.00B |
| Total Liabilities | 285.51B | 308.03B | 290.44B | 302.08B | 287.91B |
| Long Term Debt | 78.33B | 85.75B | 95.28B | 109.71B | 119.38B |
| Shareholders Equity | 73.73B | 56.95B | 62.15B | 50.67B | 63.09B |
Source: Financial statements and regulatory filings
Cash Flow Statement
| fiscal_date | 2025-09-30 | 2024-09-30 | 2023-09-30 | 2022-09-30 | 2021-09-30 |
|---|---|---|---|---|---|
| Operating Activities Net Income | 112.01B | 93.74B | 97.00B | 99.80B | 94.68B |
| Operating Activities Depreciation | 11.70B | 11.45B | 11.52B | 11.10B | 11.28B |
| Operating Activities Stock Based Compensation | 12.86B | 11.69B | 10.83B | 9.04B | 7.91B |
| Operating Activities Other Non Cash Items | -89.00M | -2.27B | -2.23B | 1.01B | -4.92B |
| Operating Activities Accounts Receivable | -7.03B | -5.14B | -417.00M | -9.34B | -14.03B |
| Operating Activities Accounts Payable | 902.00M | 6.02B | -1.89B | 9.45B | 12.33B |
| Operating Activities Other Assets Liabilities | -18.87B | 2.77B | -4.27B | 1.57B | -1.53B |
| Operating Activities Operating Cash Flow | 111.48B | 118.25B | 110.54B | 123.52B | 100.94B |
| Investing Activities Capital Expenditures | -12.71B | -9.45B | -10.96B | -10.71B | -11.09B |
| Investing Activities Purchase Of Investments | -24.41B | -48.66B | -29.51B | -76.92B | -109.56B |
| Investing Activities Sale Of Investments | 53.80B | 62.35B | 45.51B | 67.36B | 106.48B |
| Investing Activities Other Investing Activity | -1.48B | -1.31B | -1.34B | -2.09B | -385.00M |
| Investing Activities Investing Cash Flow | 15.20B | 2.94B | 3.71B | -22.66B | -14.58B |
| Financing Activities Long Term Debt Issuance | 4.48B | 0.00 | 5.23B | 5.46B | 20.39B |
| Financing Activities Long Term Debt Payments | -10.93B | -9.96B | -11.15B | -9.54B | -8.75B |
| Financing Activities Short Term Debt Issuance | -2.03B | 3.96B | -3.98B | 3.96B | 1.02B |
| Financing Activities Common Stock Repurchase | -90.71B | -94.95B | -77.55B | -89.40B | -85.97B |
| Financing Activities Common Dividends | -15.42B | -15.23B | -15.03B | -14.84B | -14.47B |
| Financing Activities Other Financing Charges | -6.07B | -5.80B | -6.01B | -6.38B | -5.58B |
| Financing Activities Financing Cash Flow | -120.69B | -121.98B | -108.49B | -110.75B | -92.25B |
| End Cash Position | 35.93B | 29.94B | 30.74B | 24.98B | 35.93B |
| Income Tax Paid | 43.37B | 26.10B | 18.68B | 19.57B | 25.39B |
| Free Cash Flow | 98.77B | 108.81B | 99.58B | 111.44B | 92.95B |
| Interest Paid | N/A | N/A | 3.80B | 2.87B | 2.69B |
| Operating Activities Deferred Taxes | N/A | N/A | N/A | 895.00M | -4.77B |
| Investing Activities Net Acquisitions | N/A | N/A | N/A | -306.00M | -33.00M |
| Financing Activities Common Stock Issuance | N/A | N/A | N/A | N/A | 1.10B |
Source: Financial statements and regulatory filings
Technical Analysis
Key Insights
- The current trend direction for Apple’s stock is upward, with price action showing higher highs and higher lows, indicating bullish momentum.
- Key support levels are identified near $260 and $255, corresponding to the 50-day and 200-day moving averages, while resistance is near the 52-week high at $288.62.
- The stock is trading above its 10-day, 50-day ($261.22), and 200-day ($255.18) moving averages, suggesting a strong positive trend across short and long-term horizons.
- Momentum indicators show the RSI in a neutral to slightly overbought range, MACD is positive with a bullish crossover, and Stochastic oscillators indicate sustained buying pressure.
- Multi-timeframe analysis reveals consistent strength on daily, weekly, and monthly charts, confirming the prevailing upward trend and reducing the likelihood of near-term reversals.
- Potential market scenarios include continuation of the rally if support levels hold, with possible volatility around earnings announcements as implied volatility suggests a 3.5% price swing.
Trending News
1. Headline: Wall Street analysts update Apple's stock price after record earnings
Summary: Apply now to join Finbold as a crypto/finance news writer! ... PANDA ICPanda DAO $0.00 39.39% NVDA Nvidia Corp $198.42 0.67% GOOGL Alphabet Inc. Class A Common Stock $385.76 0.07%
Sentiment: neutral
2. Headline: Warren Buffett Shouts Out Tim Cook in Surprise Speech at Berkshire Bash - Business Insider
Summary: Business Insider's Theron Mohamed ... famous stockpicker spoke. Buffett drew chuckles from the crowd when he joked that Berkshire had turned over management of the money to Apple to make itself "look good," and that was its "preferred way of operating." He then underscored that Apple has turned that $35 billion, including dividends ...
Sentiment: neutral
3. Headline: US Stock Market | Inside the Rally: What’s fueling Apple Inc. stock surge - Apple Earnings | The Economic Times
Summary: Apple’s latest earnings have sparked strong market interest. A combination of better-than-expected results, optimism around artificial intelligence, and resilient iPhone demand has pushed the stock higher. (Source: MarketWatch) Apple Earnings
Sentiment: positive
4. Headline: Stocks making the biggest moves midday: Atlassian, Apple, Roblox, Reddit, Twilio & more
Summary: Here are the stocks making headlines in midday trading.
Sentiment: neutral
5. Headline: Apple shares new AirPods findings from Hearing Study - 9to5Mac
Summary: The Apple Hearing Study, run in collaboration with the University of Michigan, is out with new findings this week that...
Sentiment: neutral
Recent Updates
News Summary
As of 2026-05-01. Apple reported strong quarterly earnings with revenue of $111.2 billion and EPS of $2.01, surpassing analyst expectations. The company provided revenue guidance for the June quarter of 14% to 17% growth, driven by robust demand for iPhone and Mac products. Apple’s board authorized an additional $100 billion in stock repurchases and declared a cash dividend, underscoring confidence in financial health and shareholder returns. The company also highlighted strong sales in Greater China and growth in its Services segment. Additionally, Apple shared findings from its Hearing Study, emphasizing health-related product innovation. Leadership continuity was confirmed with CEO John Ternus committing to the company’s tradition of secrecy and innovation.
News Sentiment
The overall sentiment from recent updates is positive, supported by earnings beats, strong revenue guidance, and significant share repurchase authorization. Positive market reactions to robust iPhone and Mac demand, as well as growth in Services and Greater China sales, further reinforce confidence. Neutral tones arise from leadership transition announcements and analyst updates, reflecting stability without major surprises. No significant negative news was reported, although memory price pressures remain a potential margin risk. The balanced yet optimistic sentiment suggests a favorable outlook grounded in operational strength and strategic clarity.
Source List
- https://www.cnbc.com/2026/04/30/apple-aapl-q2-2026-earnings-report.html
Analytical Overview
Analysis Summary
Apple’s valuation metrics, including a trailing P/E of 33.92 and forward P/E of 29.39, are elevated relative to industry averages but reflect strong growth expectations and premium brand positioning. The PEG ratio of 1.51 suggests moderate growth-adjusted valuation. Revenue growth of 16.6% year-over-year and positive quarterly earnings growth of 19.4% indicate a robust growth trajectory supported by strong product demand and expanding services. Cash flow trends are solid, with operating cash flow of $140.2 billion and free cash flow of $100.5 billion, underpinning financial health and shareholder returns. The company maintains a manageable debt-to-equity ratio of 79.55%, supporting balance sheet strength. Sector-specific opportunities include AI-driven product innovation and expanding services, while challenges include memory price inflation and supply chain constraints. Market positioning and competitive advantages in ecosystem integration and brand loyalty remain key strengths.
Overall Business and Market Assessment
Supporting Factors: Apple’s strong revenue and earnings growth, robust cash flow generation, and significant stock repurchase authorization signaling confidence
Risk Factors: margin pressures from rising component costs and potential macroeconomic headwinds impacting consumer spending
SWOT Analysis
Strengths
- Market leadership with a dominant ecosystem of hardware and services.
- Strong profitability with high return on equity and robust cash flow.
- Significant institutional ownership supporting governance and stability.
- Robust global brand recognition and customer loyalty.
Weaknesses
- High price-to-book ratio indicating premium valuation risk.
- Exposure to rising memory prices that could pressure margins.
- Relatively low insider ownership may limit direct executive share alignment.
- Dependence on flagship products like the iPhone for majority of revenue.
Opportunities
- Expansion of AI-driven product features and services.
- Growing demand in emerging markets such as Greater China.
- Increasing subscription-based services enhancing recurring revenue.
- Potential for new product innovations under new leadership.
Threats
- Global supply chain disruptions impacting product availability.
- Intense competition in consumer electronics and services sectors.
- Regulatory scrutiny and geopolitical tensions affecting operations.
- Volatility in component costs, especially memory prices.
Company Description
Apple Inc. is a leading technology company renowned for designing, manufacturing, and marketing innovative hardware and software products for consumers and businesses worldwide. Its flagship product, the iPhone, accounts for the majority of sales, serving as the central hub of an expansive ecosystem that includes Mac computers, iPad tablets, Apple Watch wearables, and accessories like AirPods. Apple Inc. also offers a suite of services such as the App Store, Apple Music, iCloud, Apple TV+, and Apple Fitness+, providing digital content, cloud storage, and subscription-based platforms. Operating in the consumer electronics industry within the technology sector, the company employs approximately 166,000 people and maintains a broad global presence through online stores, retail outlets, and partnerships with carriers and resellers. With a substantial market capitalization reflecting its scale, Apple Inc. plays a pivotal role in shaping consumer technology trends, emphasizing seamless integration across devices and services to enhance user experience and productivity.