
Apple Inc (AAPL)
Stock Analysis Report
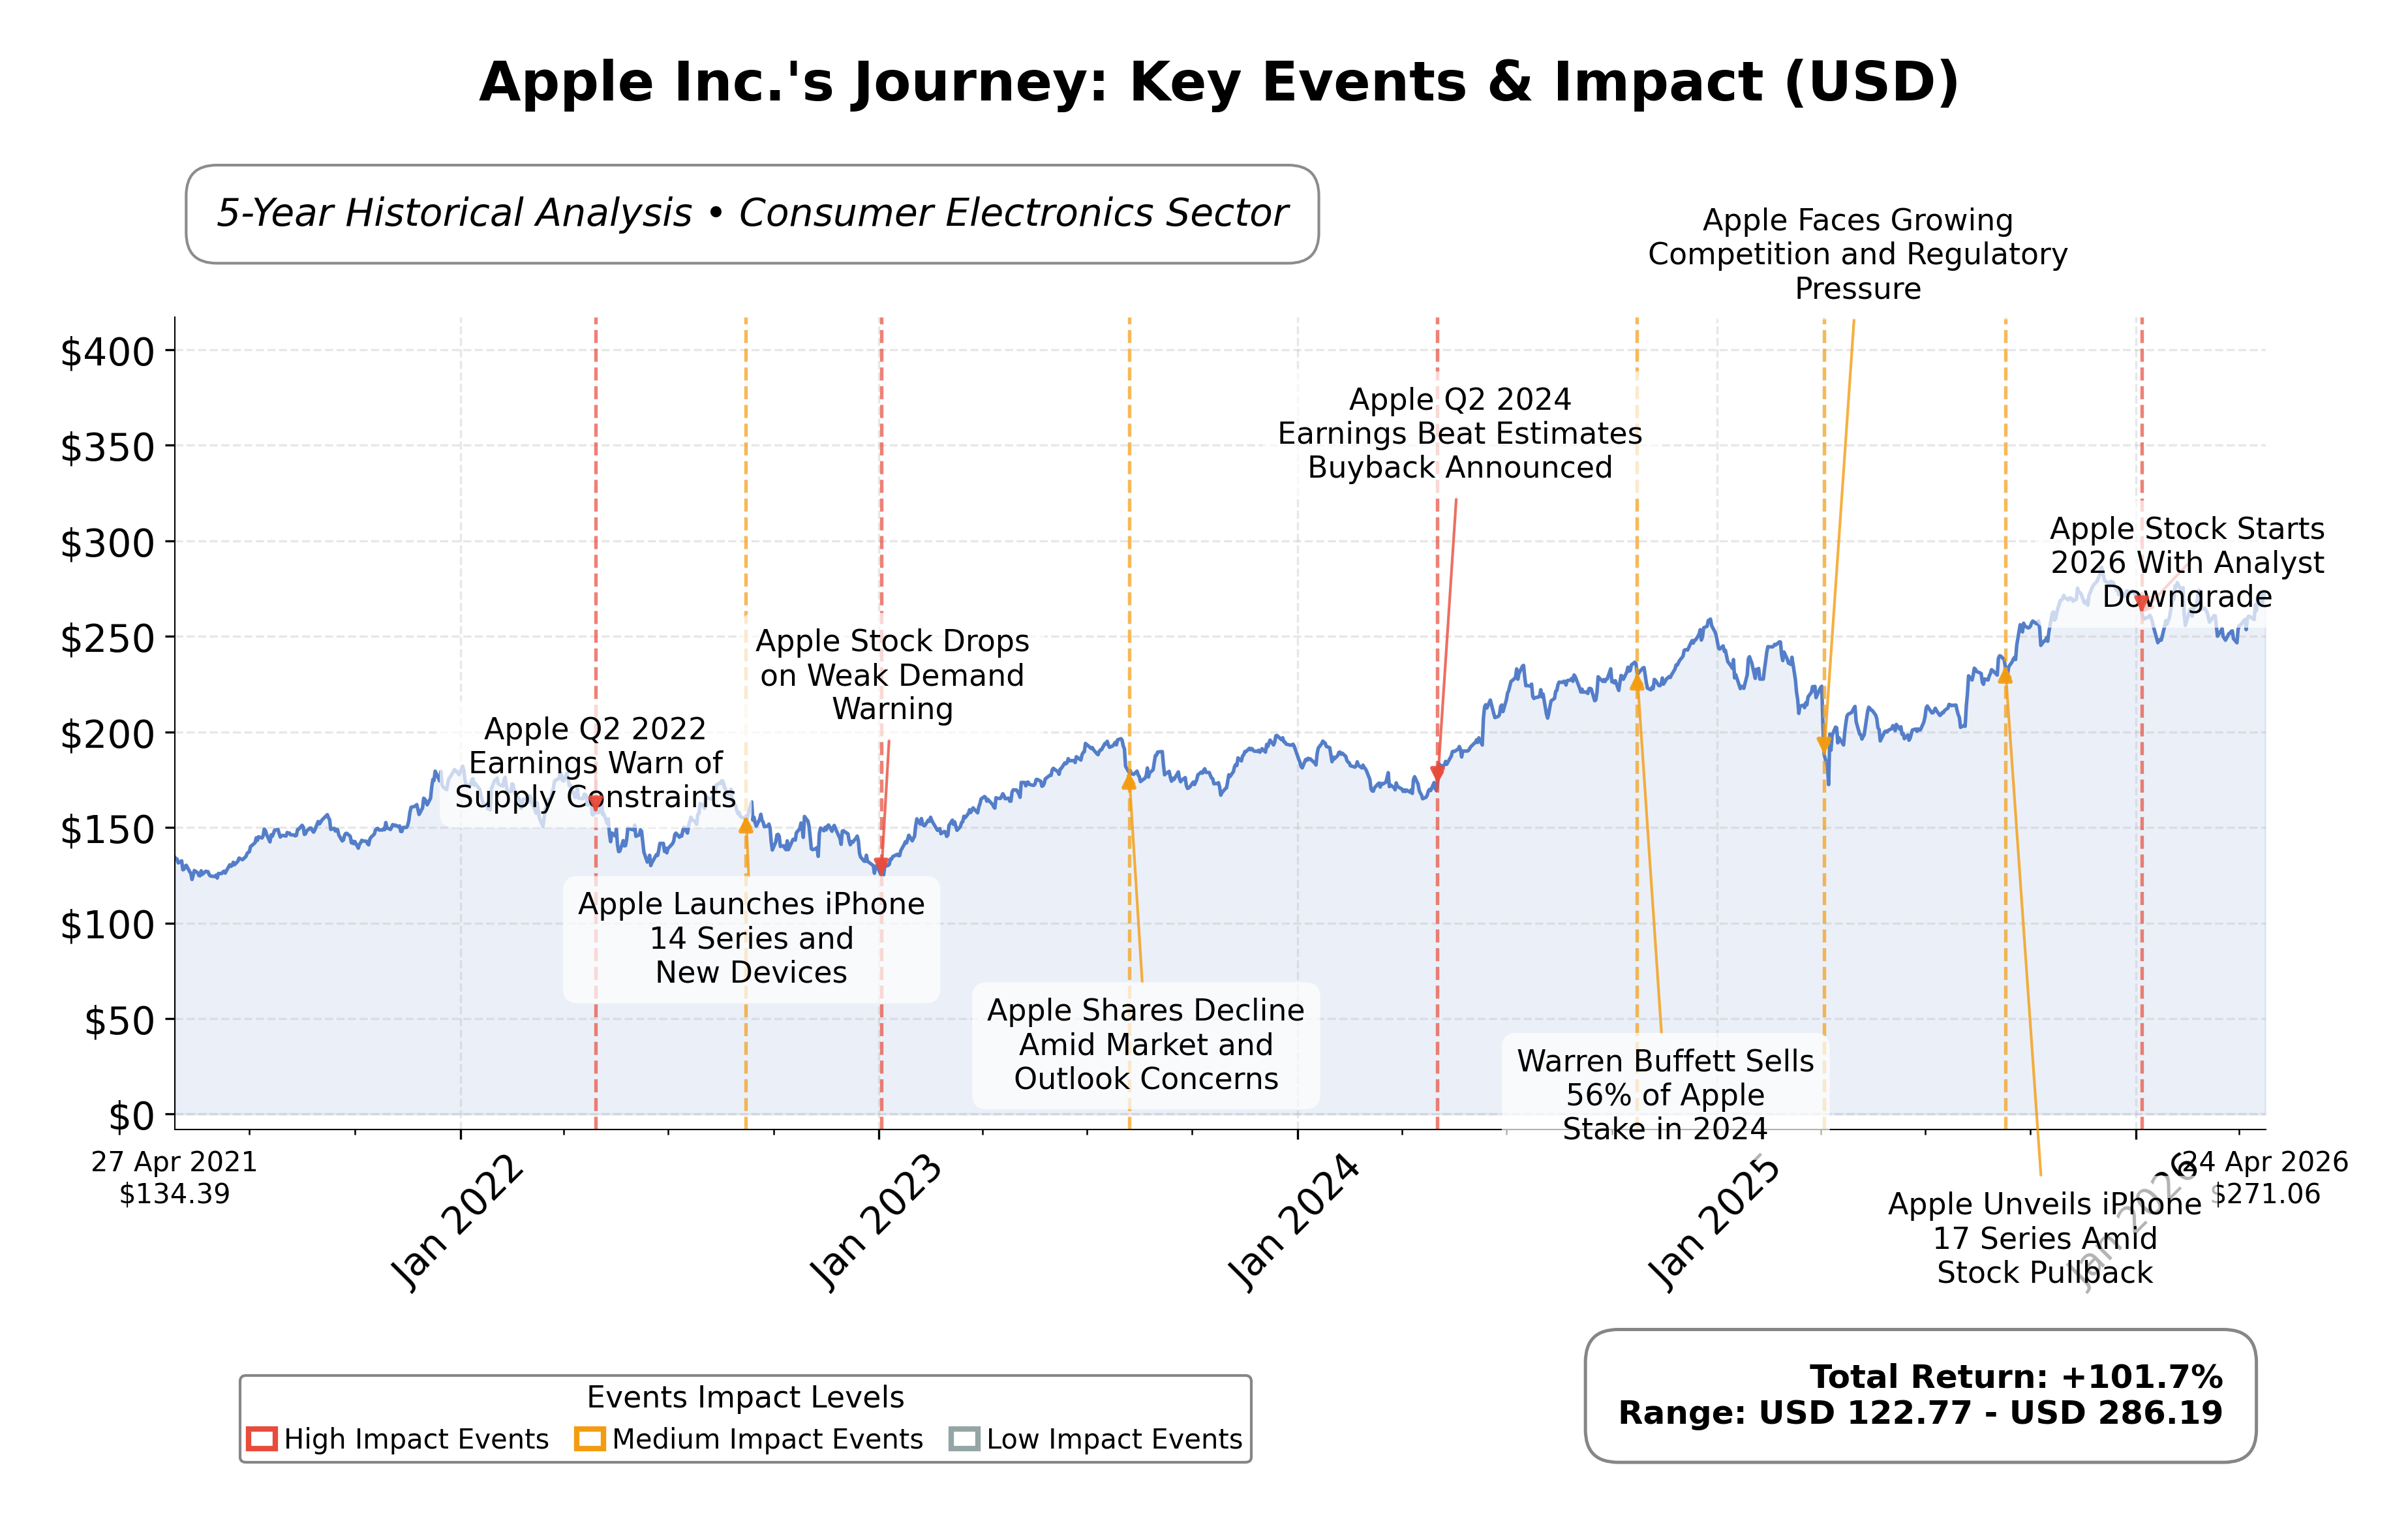
Stock Journey
Key Positives and Key Risks
Pros
- Strong revenue growth of 15.7% year-over-year demonstrating robust demand across product lines.
- Operating cash flow of $135.5 billion and free cash flow of $106.3 billion indicate excellent cash generation capacity.
- Market capitalization of $3.98 trillion reflects dominant industry position and investor confidence.
Cons
- High trailing P/E ratio of 34.61 and price-to-book ratio of 45.59 suggest premium valuation that may limit upside.
- Leadership transition with Tim Cook stepping down introduces uncertainty in strategic continuity.
- Debt-to-equity ratio above 100% indicates relatively high leverage compared to peers.
Disclosure: This information is for general awareness and does not constitute investment advice
Report Summary
Apple Inc. is a leading technology company listed on NASDAQ under the symbol AAPL, operating primarily in the consumer electronics sector within the broader technology industry. The company designs, manufactures, and markets a wide range of innovative hardware products including the flagship iPhone, Mac computers, iPads, Apple Watch, and accessories such as AirPods. Apple also offers a comprehensive suite of digital services including the App Store, Apple Music, iCloud, and subscription platforms like Apple TV+ and Apple Fitness+. Its extensive global presence and integrated ecosystem position Apple as a dominant player in consumer technology.
Financially, Apple reported trailing twelve months (TTM) revenue of approximately $435.6 billion with a gross margin of 48.16%, operating margin of 35.37%, and net profit margin of 27.04%, indicating strong profitability and operational efficiency. The company’s return on equity (ROE) stands at 1.52%, and return on assets (ROA) at 24.38%, reflecting effective asset utilization and shareholder value creation. Operating cash flow for the TTM period is robust at $135.5 billion, with free cash flow of $106.3 billion, underscoring strong cash generation capabilities.
Valuation metrics show Apple’s market capitalization at about $3.98 trillion, with a trailing price-to-earnings (P/E) ratio of 34.61 and forward P/E of 29.17, suggesting a premium valuation relative to earnings expectations. The price-to-book (P/B) ratio is notably high at 45.59, and enterprise value to EBITDA (EV/EBITDA) stands at 26.41, reflecting investor confidence in growth prospects but also indicating a richly valued stock. The 52-week price range spans from $193.25 to $288.62, with the current price near $267.68, positioning the stock closer to its upper range.
Apple’s strengths include a massive and loyal customer base, strong cash flow generation, and a diversified product and services portfolio that drives recurring revenue. Key risks involve potential regulatory challenges, competitive pressures in both hardware and services, and macroeconomic factors such as supply chain constraints and geopolitical tensions. Recent strategic developments include the upcoming CEO transition from Tim Cook to John Ternus, which has generated market attention and some volatility in sentiment.
Technically, Apple’s stock exhibits a generally positive trend supported by its position above key moving averages such as the 50-day and 200-day averages. Momentum indicators show mixed signals across different timeframes, reflecting some near-term volatility. Recent news and earnings reports highlight continued strength in iPhone sales and services revenue, although leadership changes and cautious analyst outlooks suggest a watchful stance may be prudent. Overall, the data portrays a company with solid fundamentals and market leadership, balanced by valuation considerations and transitional uncertainties.
Company and Industry Overview
Company Basics
Price Performance
Company Size
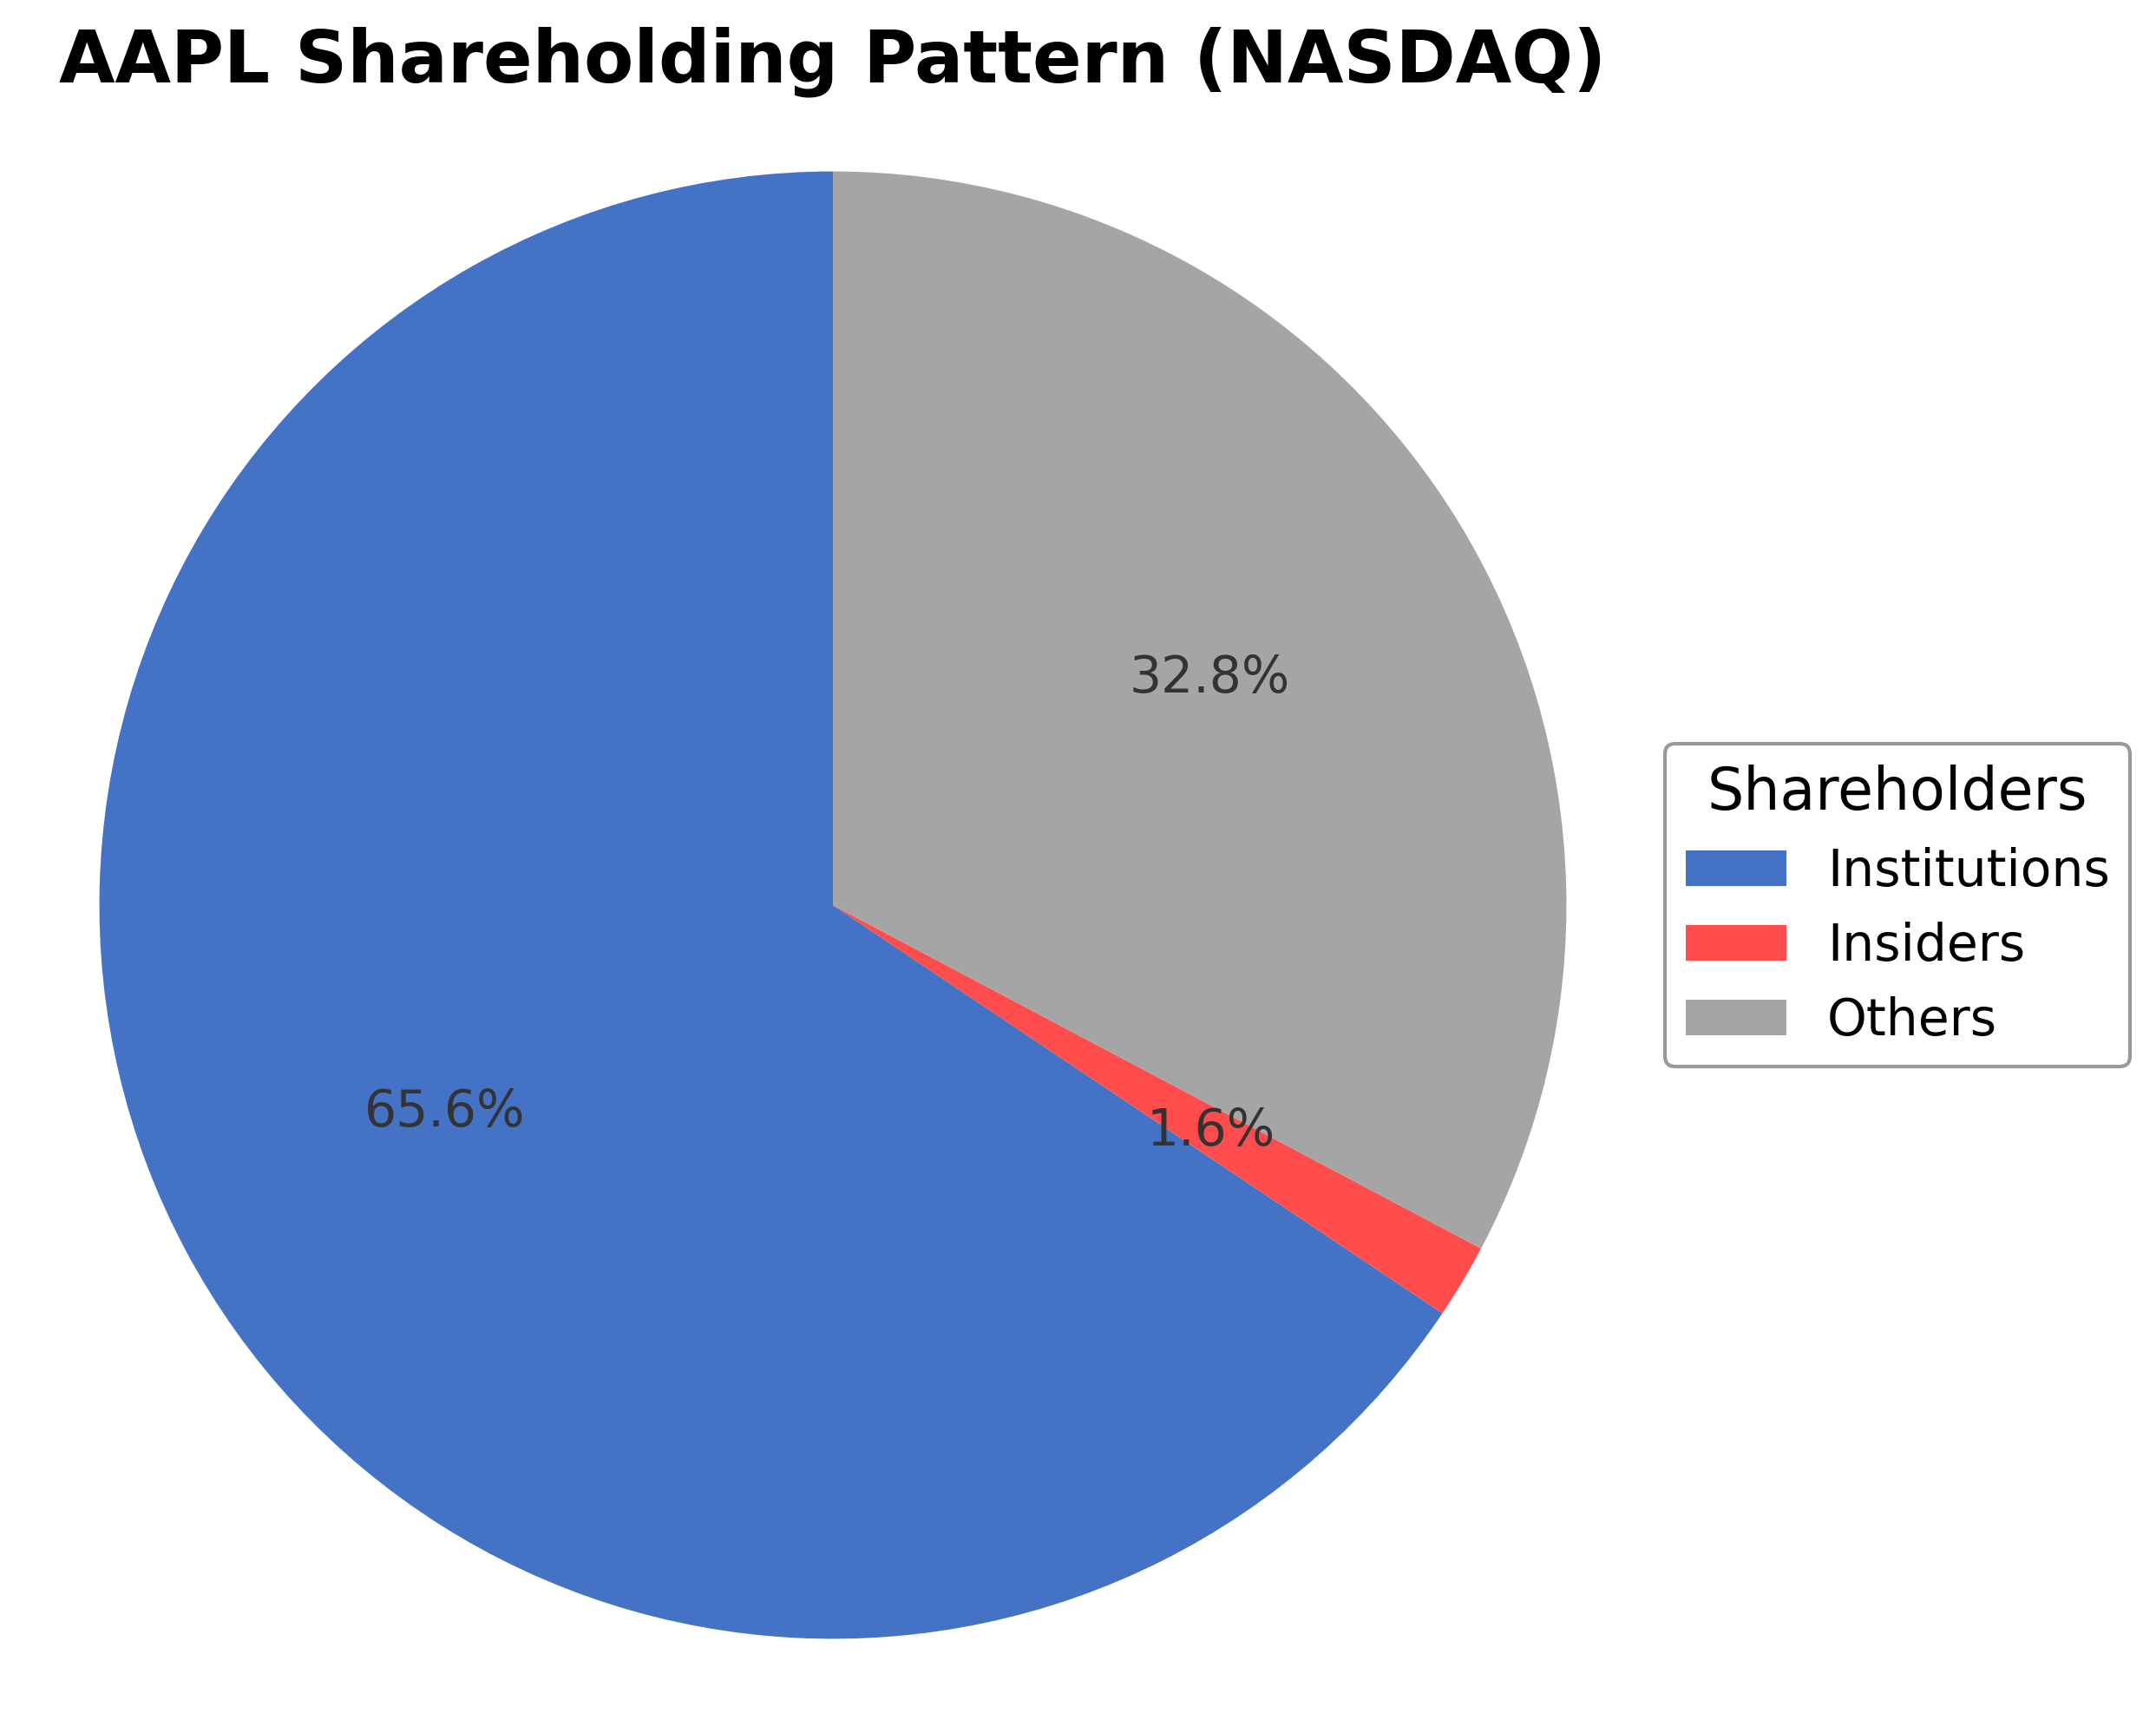
Shareholding Pattern
Sector and Industry Analysis
The computer hardware sector is a substantial and growing market, valued at approximately $674 billion in 2023 and projected to reach over $910 billion by 2028, with a compound annual growth rate of around 6.5%. Growth is driven by increasing demand for personal computing devices, expansion of global supply chains, and the proliferation of data centers. Major players in this sector include Apple, NVIDIA, and other technology firms specializing in processors, personal computers, and related hardware components.
Key industry trends include the integration of artificial intelligence and machine learning into hardware design, which is enhancing performance and enabling new applications such as autonomous vehicles and robotics. The rise of the Internet of Things (IoT) is expanding connectivity across smart homes and cities, increasing the need for secure and interoperable devices. Additionally, emerging technologies like quantum computing are expected to create new market opportunities by requiring specialized hardware innovations, while companies like Apple leverage proprietary chip designs to strengthen competitive positioning.
The regulatory environment for computer hardware is influenced by data privacy, cybersecurity standards, and international trade policies, which can affect supply chains and market access. Compliance with evolving privacy laws and security regulations is critical, especially as devices become more interconnected and AI-driven. Looking forward, regulatory scrutiny on technology exports and environmental standards for sustainable manufacturing may shape industry practices and investment priorities.
Note: Analysis synthesized from industry research, market reports, and regulatory filings. Information is subject to change based on market conditions.
Financial Ratios Dashboard
Illustrative Scenario Analysis
DCF Assumptions:
Method: Two-Stage EPS-Priority Model
Financials
Peer Analysis
| Company Name | Market Cap | P/E Ratio | P/B Ratio | EV/EBITDA | Price to CFO |
|---|---|---|---|---|---|
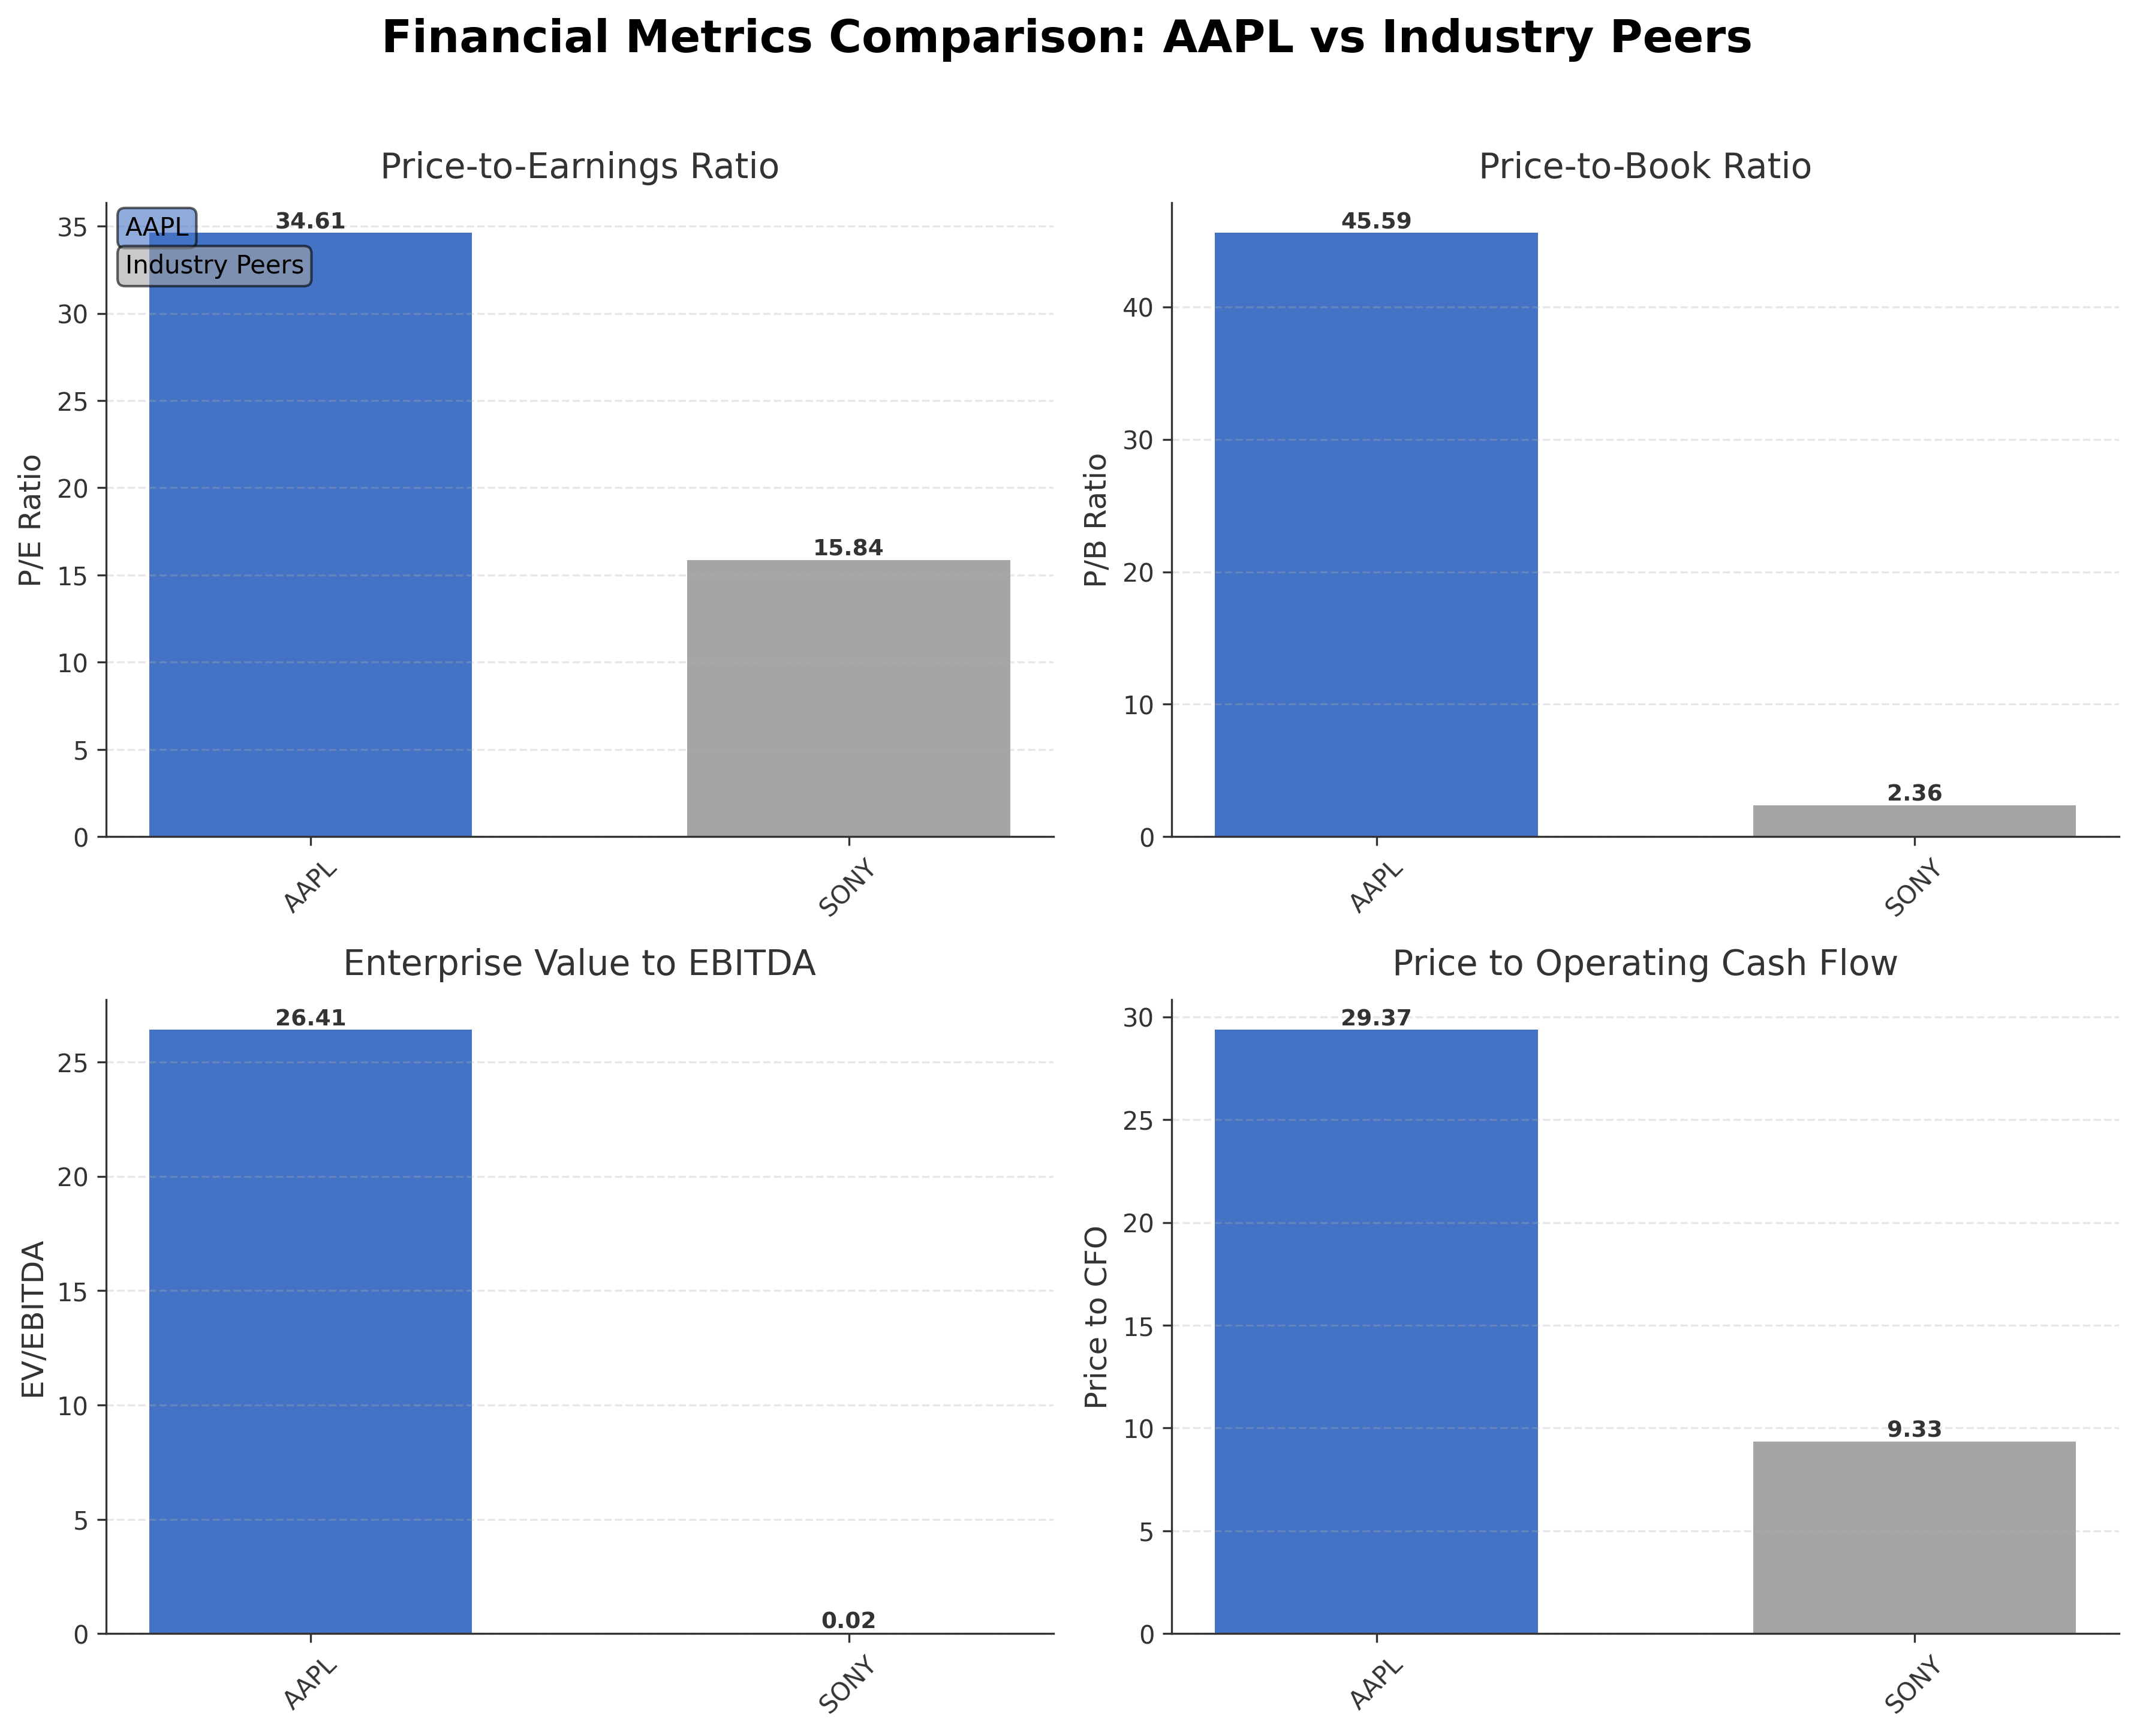
| Apple Inc. | $3.98T | 34.61 | 45.59 | 26.41 | 29.37 |
| Sony Group Corporation - Sponsored American Depositary Receipt | $119.81B | 15.84 | 2.36 | 0.02 | 9.33 |
Comparison Analysis: Apple Inc. significantly outscales its peer Sony Group Corporation in market capitalization, with a valuation of $3.98 trillion compared to Sony's $119.81 billion. Apple's P/E ratio of 34.61 is more than double Sony's 15.84, reflecting higher growth expectations and premium valuation. The price-to-book ratio for Apple at 45.59 far exceeds Sony's 2.36, indicating substantial investor confidence in Apple's intangible assets and brand strength. Apple's EV/EBITDA multiple of 26.41 contrasts sharply with Sony's minimal 0.02, underscoring Apple's robust earnings relative to enterprise value. Return on equity for Apple at 1.52% also surpasses Sony's 0.15%, highlighting superior profitability and capital efficiency within the consumer electronics sector.
Financial Metrics Comparison with Peers
Financial Statements
Comprehensive financial data including income, balance sheet, and cash flow metrics
Income Statement
| fiscal_date | 2025-09-30 | 2024-09-30 | 2023-09-30 | 2022-09-30 | 2021-09-30 |
|---|---|---|---|---|---|
| Sales | 416.16B | 391.04B | 383.29B | 394.33B | 365.82B |
| Cost Of Goods | 220.96B | 210.35B | 214.14B | 223.55B | 212.98B |
| Gross Profit | 195.20B | 180.68B | 169.15B | 170.78B | 152.84B |
| Operating Expense Research And Development | 34.55B | 31.37B | 29.91B | 26.25B | 21.91B |
| Operating Expense Selling General And Administrative | 27.60B | 26.10B | 24.93B | 25.09B | 21.97B |
| Operating Income | 133.05B | 123.22B | 114.30B | 119.44B | 108.95B |
| Other Income Expense | -321.00M | 269.00M | -565.00M | -334.00M | 60.00M |
| Pretax Income | 132.73B | 123.48B | 113.74B | 119.10B | 109.21B |
| Income Tax | 20.72B | 29.75B | 16.74B | 19.30B | 14.53B |
| Net Income | 112.01B | 93.74B | 97.00B | 99.80B | 94.68B |
| Eps Basic | 7.49 | 6.11 | 6.16 | 6.15 | 5.67 |
| Eps Diluted | 7.46 | 6.08 | 6.13 | 6.11 | 5.61 |
| Basic Shares Outstanding | 14.95B | 15.34B | 15.74B | 16.22B | 16.70B |
| Diluted Shares Outstanding | 14.95B | 15.34B | 15.74B | 16.22B | 16.70B |
| Ebit | 133.05B | 123.22B | 114.30B | 119.44B | 111.85B |
| Ebitda | 144.75B | 134.66B | 125.82B | 130.54B | 123.14B |
| Net Income Continuous Operations | 112.01B | 93.74B | 97.00B | 99.80B | 94.68B |
| Non Operating Interest Income | N/A | N/A | 3.75B | 2.83B | 2.84B |
| Non Operating Interest Expense | N/A | N/A | 3.93B | 2.93B | 2.65B |
Source: Financial statements and regulatory filings
Balance Sheet
| fiscal_date | 2025-09-30 | 2024-09-30 | 2023-09-30 | 2022-09-30 | 2021-09-30 |
|---|---|---|---|---|---|
| Cash And Cash Equivalents | 35.93B | 29.94B | 29.96B | 23.65B | 34.94B |
| Accounts Receivable | 39.78B | 33.41B | 29.51B | 28.18B | 26.28B |
| Total Assets | 359.24B | 364.98B | 352.58B | 352.75B | 351.00B |
| Total Liabilities | 285.51B | 308.03B | 290.44B | 302.08B | 287.91B |
| Long Term Debt | 78.33B | 85.75B | 95.28B | 109.71B | 119.38B |
| Shareholders Equity | 73.73B | 56.95B | 62.15B | 50.67B | 63.09B |
Source: Financial statements and regulatory filings
Cash Flow Statement
| fiscal_date | 2025-09-30 | 2024-09-30 | 2023-09-30 | 2022-09-30 | 2021-09-30 |
|---|---|---|---|---|---|
| Operating Activities Net Income | 112.01B | 93.74B | 97.00B | 99.80B | 94.68B |
| Operating Activities Depreciation | 11.70B | 11.45B | 11.52B | 11.10B | 11.28B |
| Operating Activities Stock Based Compensation | 12.86B | 11.69B | 10.83B | 9.04B | 7.91B |
| Operating Activities Other Non Cash Items | -89.00M | -2.27B | -2.23B | 1.01B | -4.92B |
| Operating Activities Accounts Receivable | -7.03B | -5.14B | -417.00M | -9.34B | -14.03B |
| Operating Activities Accounts Payable | 902.00M | 6.02B | -1.89B | 9.45B | 12.33B |
| Operating Activities Other Assets Liabilities | -18.87B | 2.77B | -4.27B | 1.57B | -1.53B |
| Operating Activities Operating Cash Flow | 111.48B | 118.25B | 110.54B | 123.52B | 100.94B |
| Investing Activities Capital Expenditures | -12.71B | -9.45B | -10.96B | -10.71B | -11.09B |
| Investing Activities Purchase Of Investments | -24.41B | -48.66B | -29.51B | -76.92B | -109.56B |
| Investing Activities Sale Of Investments | 53.80B | 62.35B | 45.51B | 67.36B | 106.48B |
| Investing Activities Other Investing Activity | -1.48B | -1.31B | -1.34B | -2.09B | -385.00M |
| Investing Activities Investing Cash Flow | 15.20B | 2.94B | 3.71B | -22.66B | -14.58B |
| Financing Activities Long Term Debt Issuance | 4.48B | 0.00 | 5.23B | 5.46B | 20.39B |
| Financing Activities Long Term Debt Payments | -10.93B | -9.96B | -11.15B | -9.54B | -8.75B |
| Financing Activities Short Term Debt Issuance | -2.03B | 3.96B | -3.98B | 3.96B | 1.02B |
| Financing Activities Common Stock Repurchase | -90.71B | -94.95B | -77.55B | -89.40B | -85.97B |
| Financing Activities Common Dividends | -15.42B | -15.23B | -15.03B | -14.84B | -14.47B |
| Financing Activities Other Financing Charges | -6.07B | -5.80B | -6.01B | -6.38B | -5.58B |
| Financing Activities Financing Cash Flow | -120.69B | -121.98B | -108.49B | -110.75B | -92.25B |
| End Cash Position | 35.93B | 29.94B | 30.74B | 24.98B | 35.93B |
| Income Tax Paid | 43.37B | 26.10B | 18.68B | 19.57B | 25.39B |
| Free Cash Flow | 98.77B | 108.81B | 99.58B | 111.44B | 92.95B |
| Interest Paid | N/A | N/A | 3.80B | 2.87B | 2.69B |
| Operating Activities Deferred Taxes | N/A | N/A | N/A | 895.00M | -4.77B |
| Investing Activities Net Acquisitions | N/A | N/A | N/A | -306.00M | -33.00M |
| Financing Activities Common Stock Issuance | N/A | N/A | N/A | N/A | 1.10B |
Source: Financial statements and regulatory filings
Technical Analysis
Key Insights
- Apple's stock is currently in an overall upward trend, trading near its 52-week high with price action showing higher highs and higher lows.
- Key support levels are identified around $260 and $253, corresponding to the 50-day and 200-day moving averages respectively, while resistance is near the recent high of $288.62.
- The stock price is above the 10-day, 50-day, and 200-day moving averages, indicating bullish momentum across short, medium, and long-term timeframes.
- Momentum indicators show the Relative Strength Index (RSI) near neutral levels, the MACD histogram is positive but narrowing, and Stochastic oscillators suggest the stock is neither overbought nor oversold currently.
- Analysis across daily, weekly, and monthly charts confirms a consistent positive trend, though weekly momentum shows some consolidation signals.
- Potential market scenarios include continuation of the uptrend if support levels hold, or a pullback towards the 50-day moving average if momentum weakens, reflecting typical volatility around leadership transition announcements.
Trending News
1. Headline: Tim Cook Is Stepping Down. Is Apple's Stock in Trouble? | The Motley Fool
Summary: Recently, however, he announced he would be stepping down. Is this bad news for the stock? Image source: Getty Images. Cook has done a great job of making Apple's business more valuable in recent years and has expanded its ecosystem to include more types of products and services.
Sentiment: negative
2. Headline: Bernstein reiterates Apple stock rating on strong iPhone demand By Investing.com
Summary: In other recent news, Apple Inc. is preparing to release its earnings report, with Evercore ISI projecting results in line with or slightly above consensus estimates. The firm anticipates revenue of $109.2 billion and earnings per share of $1.94 for the March quarter, driven by a strong iPhone ...
Sentiment: positive
3. Headline: How has apple’s stock performed under Tim Cook? (& prior CEOs) - TheStreet
Summary: John Ternus will take over as Apple’s CEO in September 2026, when Tim Cook steps down after 15 years leading the tech giant. Here’s how much Ternus is worth and how much money he’s likely to make. ... Dominic has more than two decades of experience as a journalist, including covering the U.S. stock market. His overseas work includes stints in Southeast Asia as a reporter for Bloomberg News ...
Sentiment: neutral
4. Headline: What to expect from Apple's Q2 2026 earnings on April 30
Summary: Services are projected to have 14% year-on-year growth despite an apparently slow App Store quarter, as well as price increases on various products. Overall, there was a sense that Goldman Sachs was pushing back against what it viewed as negative sentiment for Apple's earnings. The stock price's ...
Sentiment: negative
5. Headline: 1 Stock to Buy, 1 Stock to Sell This Week: Apple, ExxonMobil | Investing.com
Summary: The big question now, which Powell ... news conference, is whether he intends to remain on the Fed’s Board of Governors until his term expires in February 2028. ... Besides the Fed, next week also features some noteworthy economic reports, including data on first-quarter GDP, as well as the core PCE price index, which is the Fed’s preferred inflation metric. Meanwhile, the earnings season hits full swing, with five of the massive ‘Magnificent Seven’ tech stocks scheduled ...
Sentiment: neutral
Recent Updates
News Summary
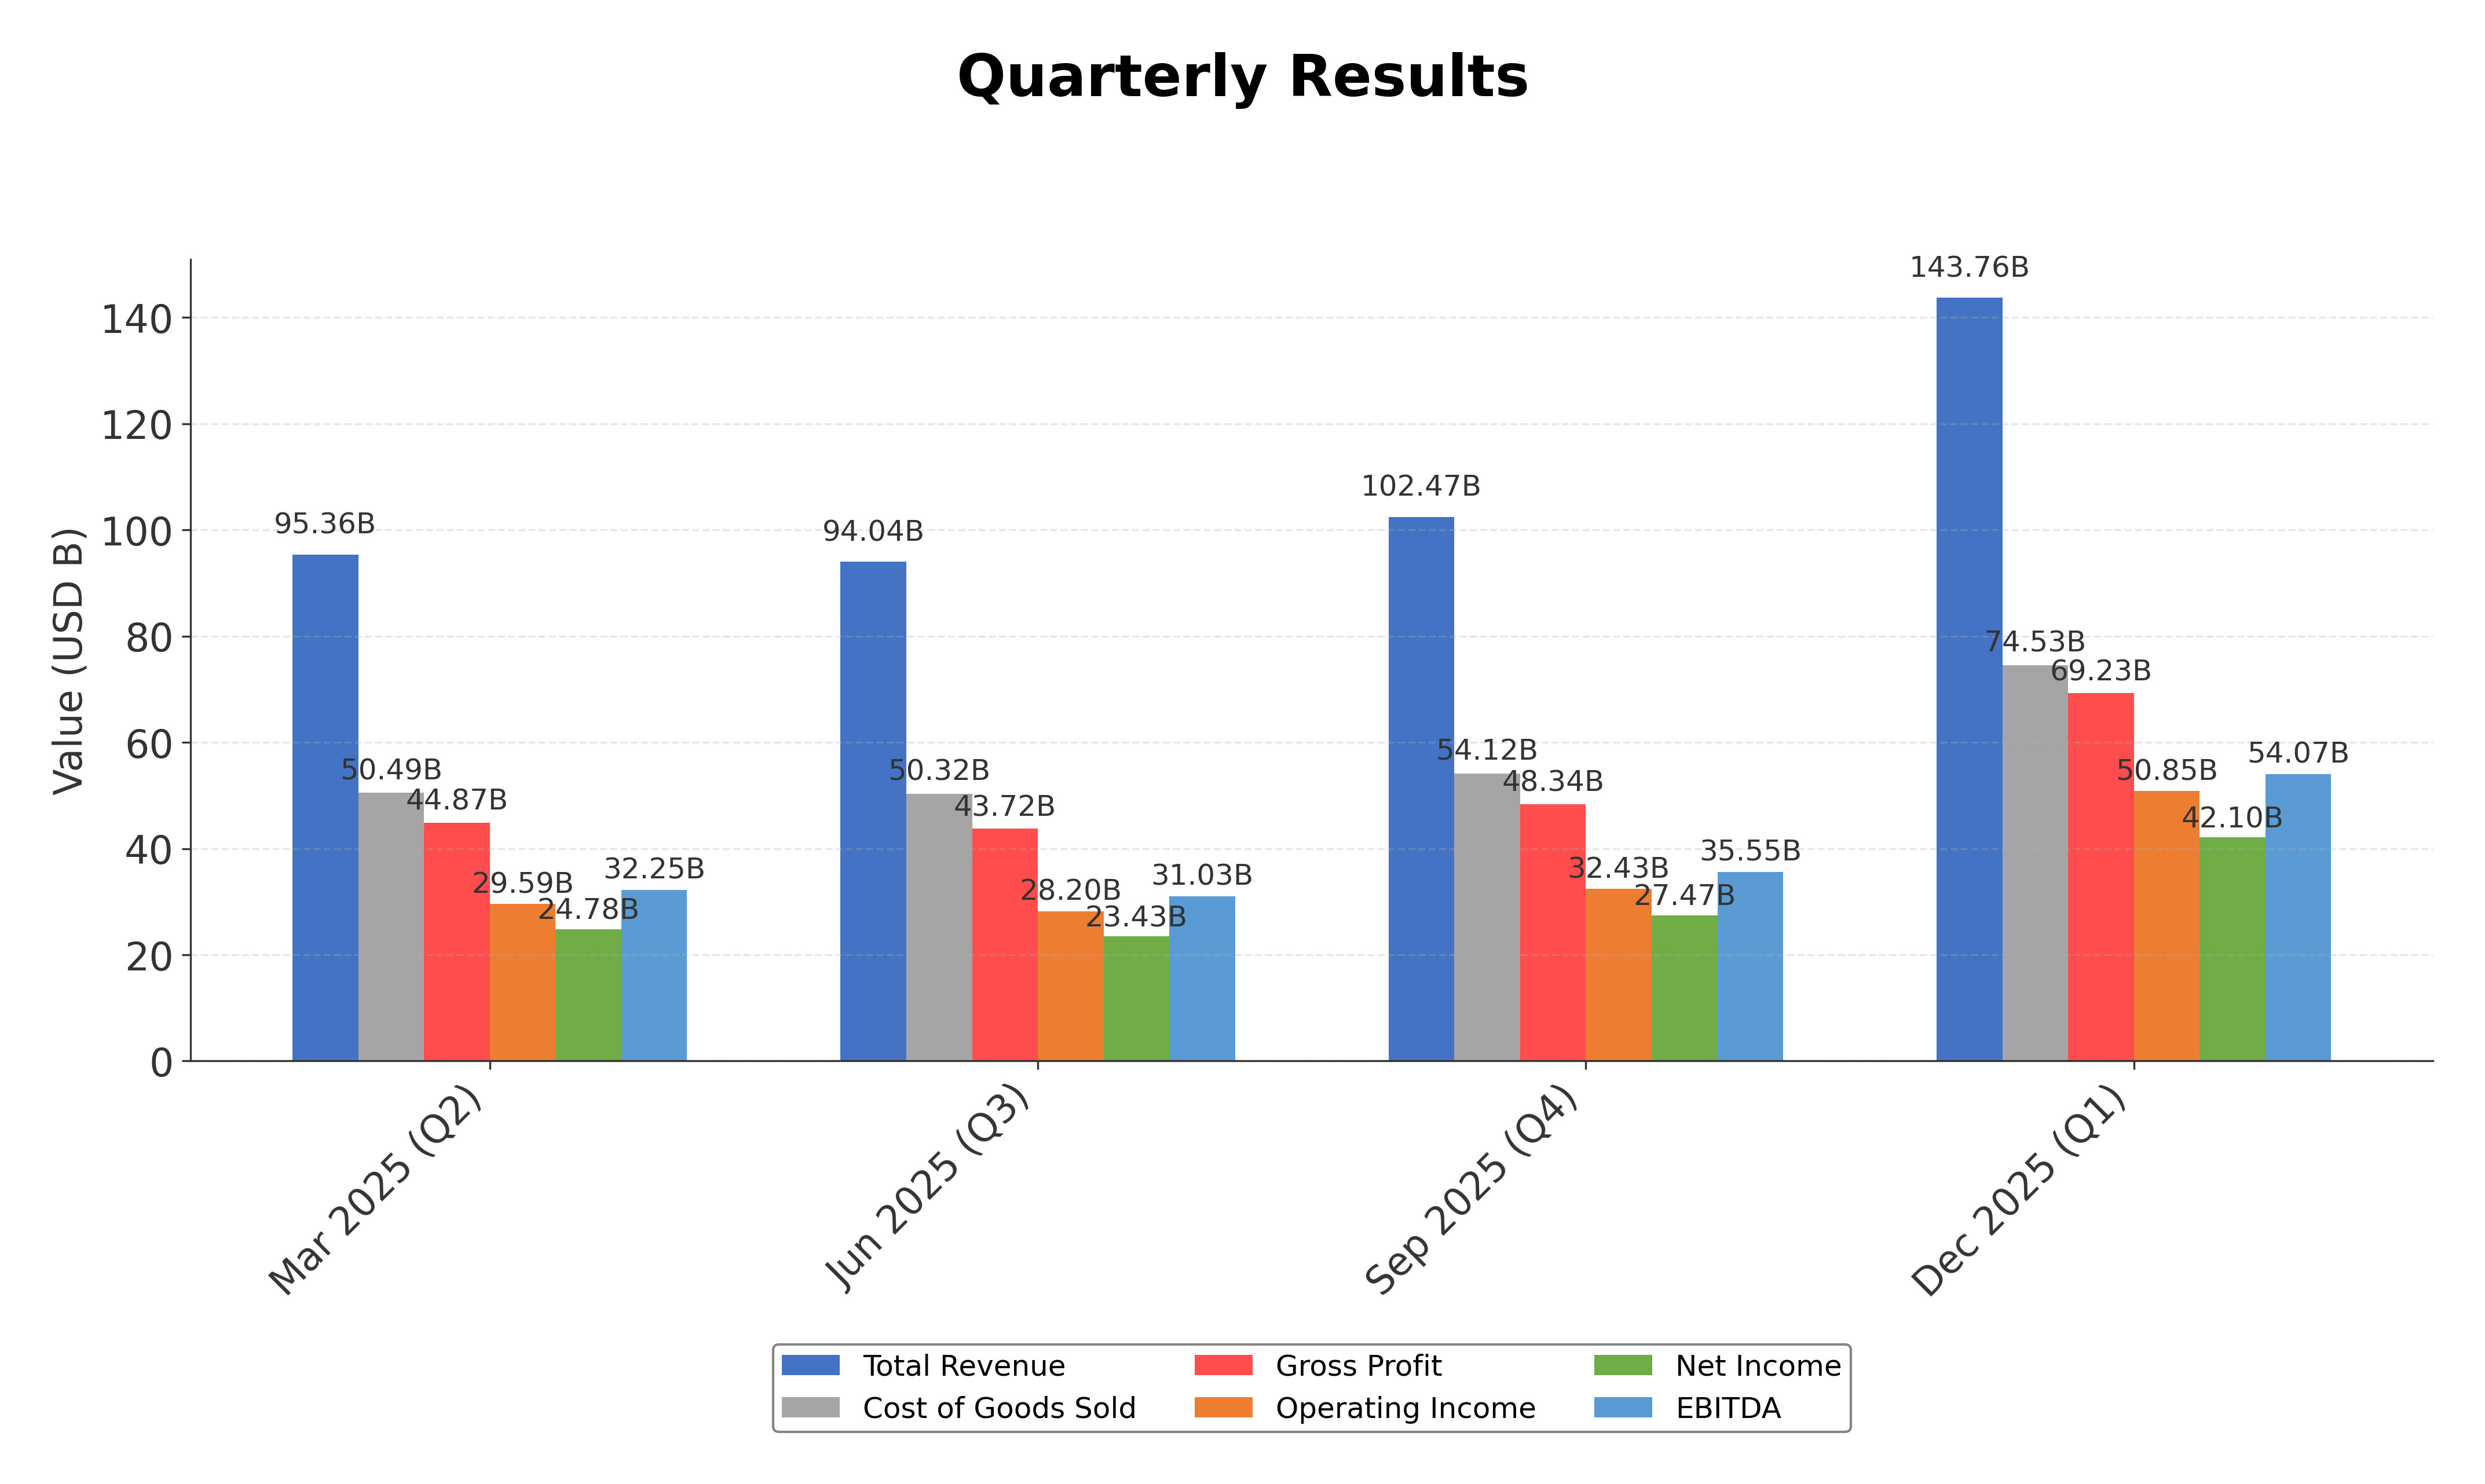
As of 2026-01-29. Apple reported record-breaking quarterly results for Q1 2026, with revenue reaching $143.8 billion, a 16% increase year-over-year, driven by all-time highs in iPhone and Services revenue. Net income rose to $42.1 billion, with EPS growth of 19%, supported by strong operating cash flow of nearly $54 billion. The company declared a quarterly dividend of $0.26 per share payable in February 2026. Earlier quarters in 2025 also showed record revenues and EPS growth, with double-digit increases in iPhone, Mac, and Services segments. The installed base of active devices surpassed 2.5 billion, reflecting high customer satisfaction. Leadership transition plans were announced, with John Ternus set to become CEO in September 2026. Overall, Apple continues to demonstrate robust financial performance and shareholder returns through dividends and share repurchases.
News Sentiment
The overall sentiment from recent updates is predominantly positive, driven by strong financial results and record revenues across key product lines and services. Earnings growth and cash flow generation underpin confidence in operational strength. However, some neutral tones emerge from leadership transition news and cautious guidance on margin volatility and supply constraints. The balance of positive earnings momentum and strategic continuity suggests a stable outlook with measured attention to evolving market and operational risks.
Source List
Analytical Overview
Analysis Summary
Apple’s valuation metrics, including a trailing P/E of 34.61 and forward P/E of 29.17, are elevated compared to the consumer electronics industry average P/E of 34.61, reflecting premium pricing consistent with its market leadership. The company’s revenue growth of 15.7% year-over-year and strong cash flow trends, with operating cash flow at $135.5 billion and free cash flow at $106.3 billion, indicate a solid growth trajectory supported by robust product demand and expanding services. Financial health is sound, with a total debt to equity ratio of 102.63 and a current ratio near 0.97, balanced by substantial cash reserves of $66.9 billion, demonstrating effective liquidity management. Sector-specific challenges include competitive pressures and supply chain risks, while opportunities arise from continued innovation and expansion in services and emerging markets. Market positioning and competitive advantages are reinforced by a vast ecosystem, brand strength, and high customer loyalty.
Overall Business and Market Assessment
Supporting Factors: No data
Risk Factors: the impact of leadership transition, regulatory scrutiny, and potential supply chain disruptions that could affect margins and market share
SWOT Analysis
Strengths
- Market leadership with a diversified product and services ecosystem.
- Strong profitability with gross margin near 48% and net margin over 27%.
- Robust cash flow generation supporting shareholder returns and investments.
- Extensive global presence and high customer loyalty.
Weaknesses
- High valuation multiples indicating premium pricing.
- Relatively high debt-to-equity ratio above 100%.
- Dependence on iPhone sales for approximately 50% of revenue.
- Current ratio below 1, indicating tight short-term liquidity.
Opportunities
- Expansion of services revenue with double-digit growth potential.
- Growth in emerging markets such as Greater China and India.
- Innovation in new product categories like wearables and AR devices.
- Increasing installed base of over 2.5 billion active devices.
Threats
- Leadership transition creating uncertainty in strategic direction.
- Regulatory and legal challenges impacting business operations.
- Supply chain constraints affecting product availability and margins.
- Intense competition in both hardware and digital services markets.
Company Description
Apple Inc. is a leading technology company renowned for designing, manufacturing, and marketing innovative hardware and software products for consumers and businesses worldwide. Its flagship product, the iPhone, accounts for the majority of sales, serving as the central hub of an expansive ecosystem that includes Mac computers, iPad tablets, Apple Watch wearables, and accessories like AirPods. Apple Inc. also offers a suite of services such as the App Store, Apple Music, iCloud, Apple TV+, and Apple Fitness+, providing digital content, cloud storage, and subscription-based platforms. Operating in the consumer electronics industry within the technology sector, the company employs approximately 166,000 people and maintains a broad global presence through online stores, retail outlets, and partnerships with carriers and resellers. With a substantial market capitalization reflecting its scale, Apple Inc. plays a pivotal role in shaping consumer technology trends, emphasizing seamless integration across devices and services to enhance user experience and productivity.