
Apple Inc (AAPL)
Stock Analysis Report
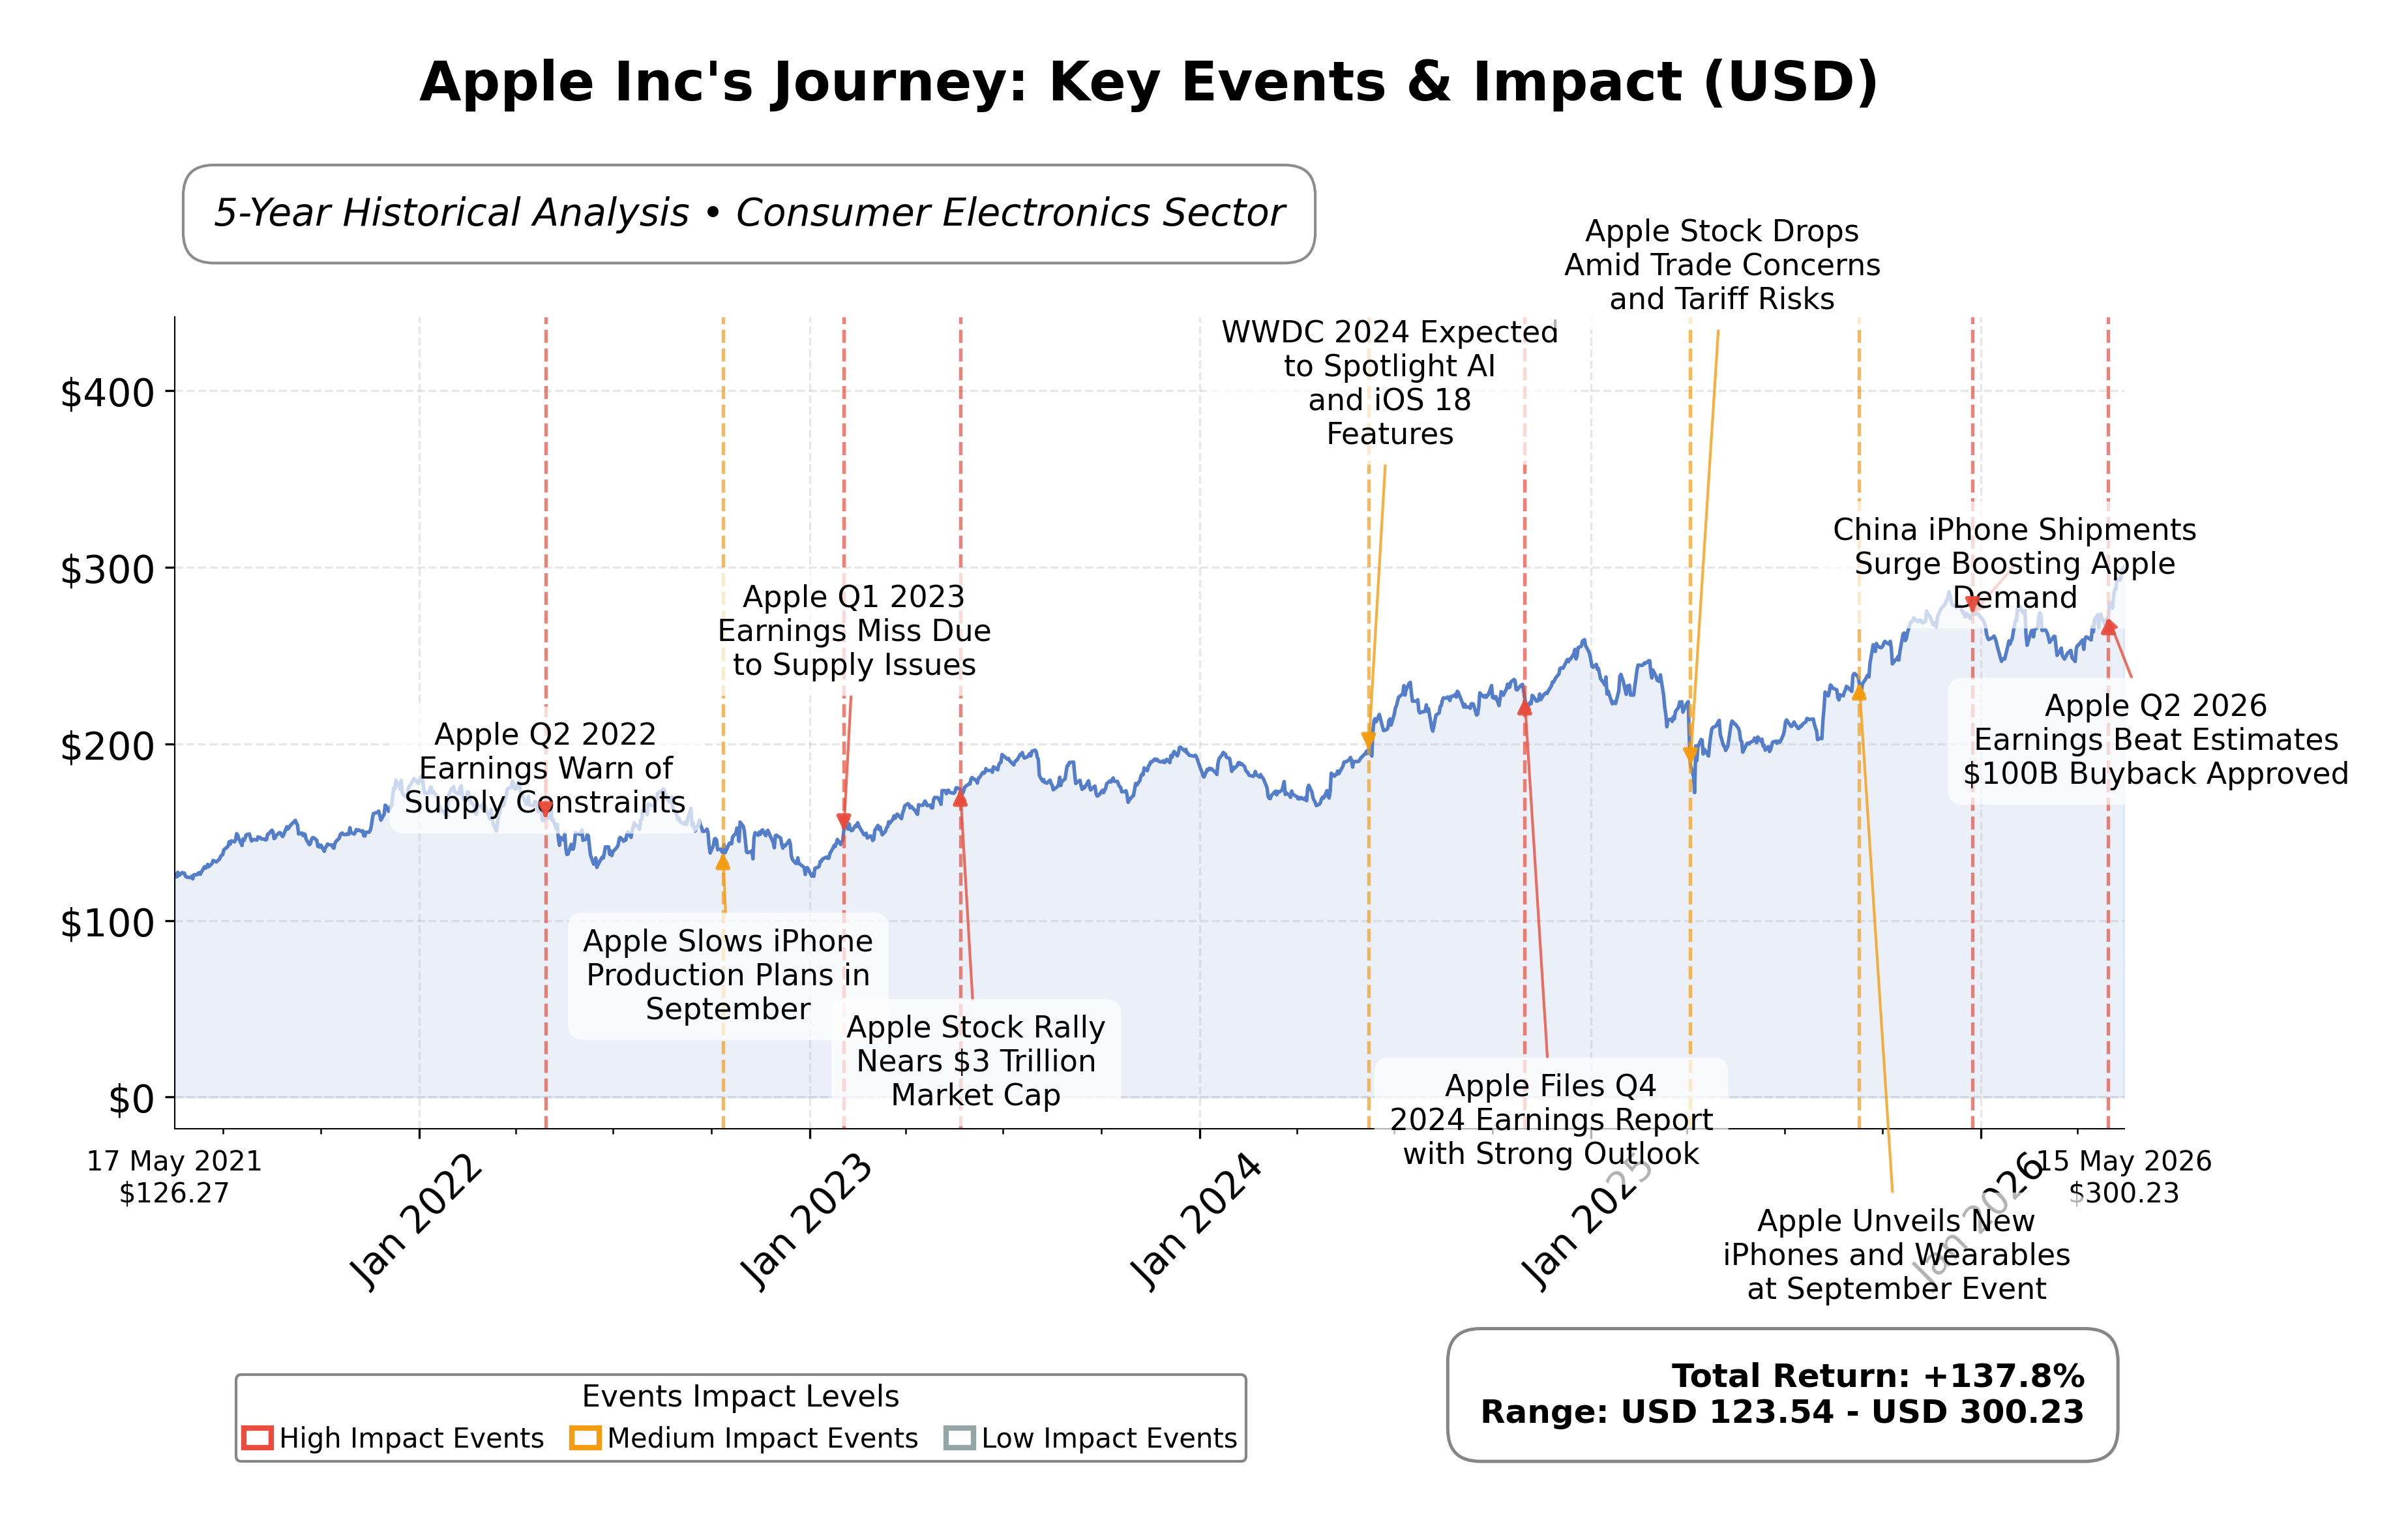
Stock Journey
Key Positives and Key Risks
Pros
- Revenue growth of 16.6% year-over-year demonstrates strong top-line expansion.
- Operating cash flow of $140.2 billion and free cash flow of $101.1 billion indicate robust cash generation.
- Market capitalization of $4.31 trillion reflects dominant market position and investor confidence.
Cons
- High trailing P/E ratio of 35.47 and P/B ratio of 40.40 suggest premium valuation levels.
- Debt-to-equity ratio of 79.5% indicates significant leverage relative to equity.
- RSI at 73.27 signals overbought technical conditions, increasing risk of short-term pullbacks.
Disclosure: This information is for general awareness and does not constitute investment advice
Report Summary
Apple Inc. operates as a leading technology company primarily engaged in designing, manufacturing, and marketing consumer electronics and software products. Its flagship product, the iPhone, drives the majority of sales, complemented by other hardware such as Mac computers, iPads, Apple Watch, and accessories like AirPods. The company also offers a broad range of digital services including the App Store, Apple Music, iCloud, and subscription platforms. Listed on NASDAQ under the technology sector, Apple holds a dominant market position with a global footprint and a diversified product ecosystem.
Financially, Apple reported trailing twelve-month revenue of approximately $451.4 billion, with a gross margin near 49.3%, operating margin of 32.3%, and net profit margin at 27.2%. The company’s return on equity (ROE) stands at 141.47%, and return on assets (ROA) at 26.23%, reflecting strong profitability and efficient asset utilization. Operating cash flow reached $140.2 billion, with free cash flow of $101.1 billion, underscoring robust cash generation capabilities. Quarterly revenue growth was 16.6%, and earnings per share grew 19.4% year-over-year, indicating sustained growth momentum.
Apple’s valuation metrics show a trailing price-to-earnings (P/E) ratio of 35.47 and a forward P/E of 30.68, with a price-to-book (P/B) ratio of 40.40 and an enterprise value to EBITDA (EV/EBITDA) of 27.03. The market capitalization is approximately $4.31 trillion, positioning Apple as one of the largest publicly traded companies globally. The stock currently trades at $300.22, near its 52-week high of $294.76, reflecting strong market confidence and premium valuation relative to fundamentals.
Key strengths include Apple’s substantial cash reserves of $68.5 billion, manageable debt levels with a debt-to-equity ratio of 79.5%, and leadership in innovation and brand loyalty. Risks involve competitive pressures in consumer electronics, regulatory scrutiny, and supply chain challenges amid rising component costs. Recent strategic actions include new product launches such as the iPhone 17e, M4-powered iPad Air, and MacBook Neo, alongside a $100 billion share repurchase authorization and a 4% dividend increase.
Technically, Apple’s stock exhibits a strong upward trend, trading well above its 10-day, 50-day, and 200-day moving averages, with momentum indicators signaling overbought conditions. Recent news highlights ongoing product innovation and strategic leadership transition. Overall, the data suggests a market environment where accumulation interest may persist, tempered by potential volatility due to stretched momentum.
Company and Industry Overview
Company Basics
Price Performance
Company Size
Shareholding Pattern
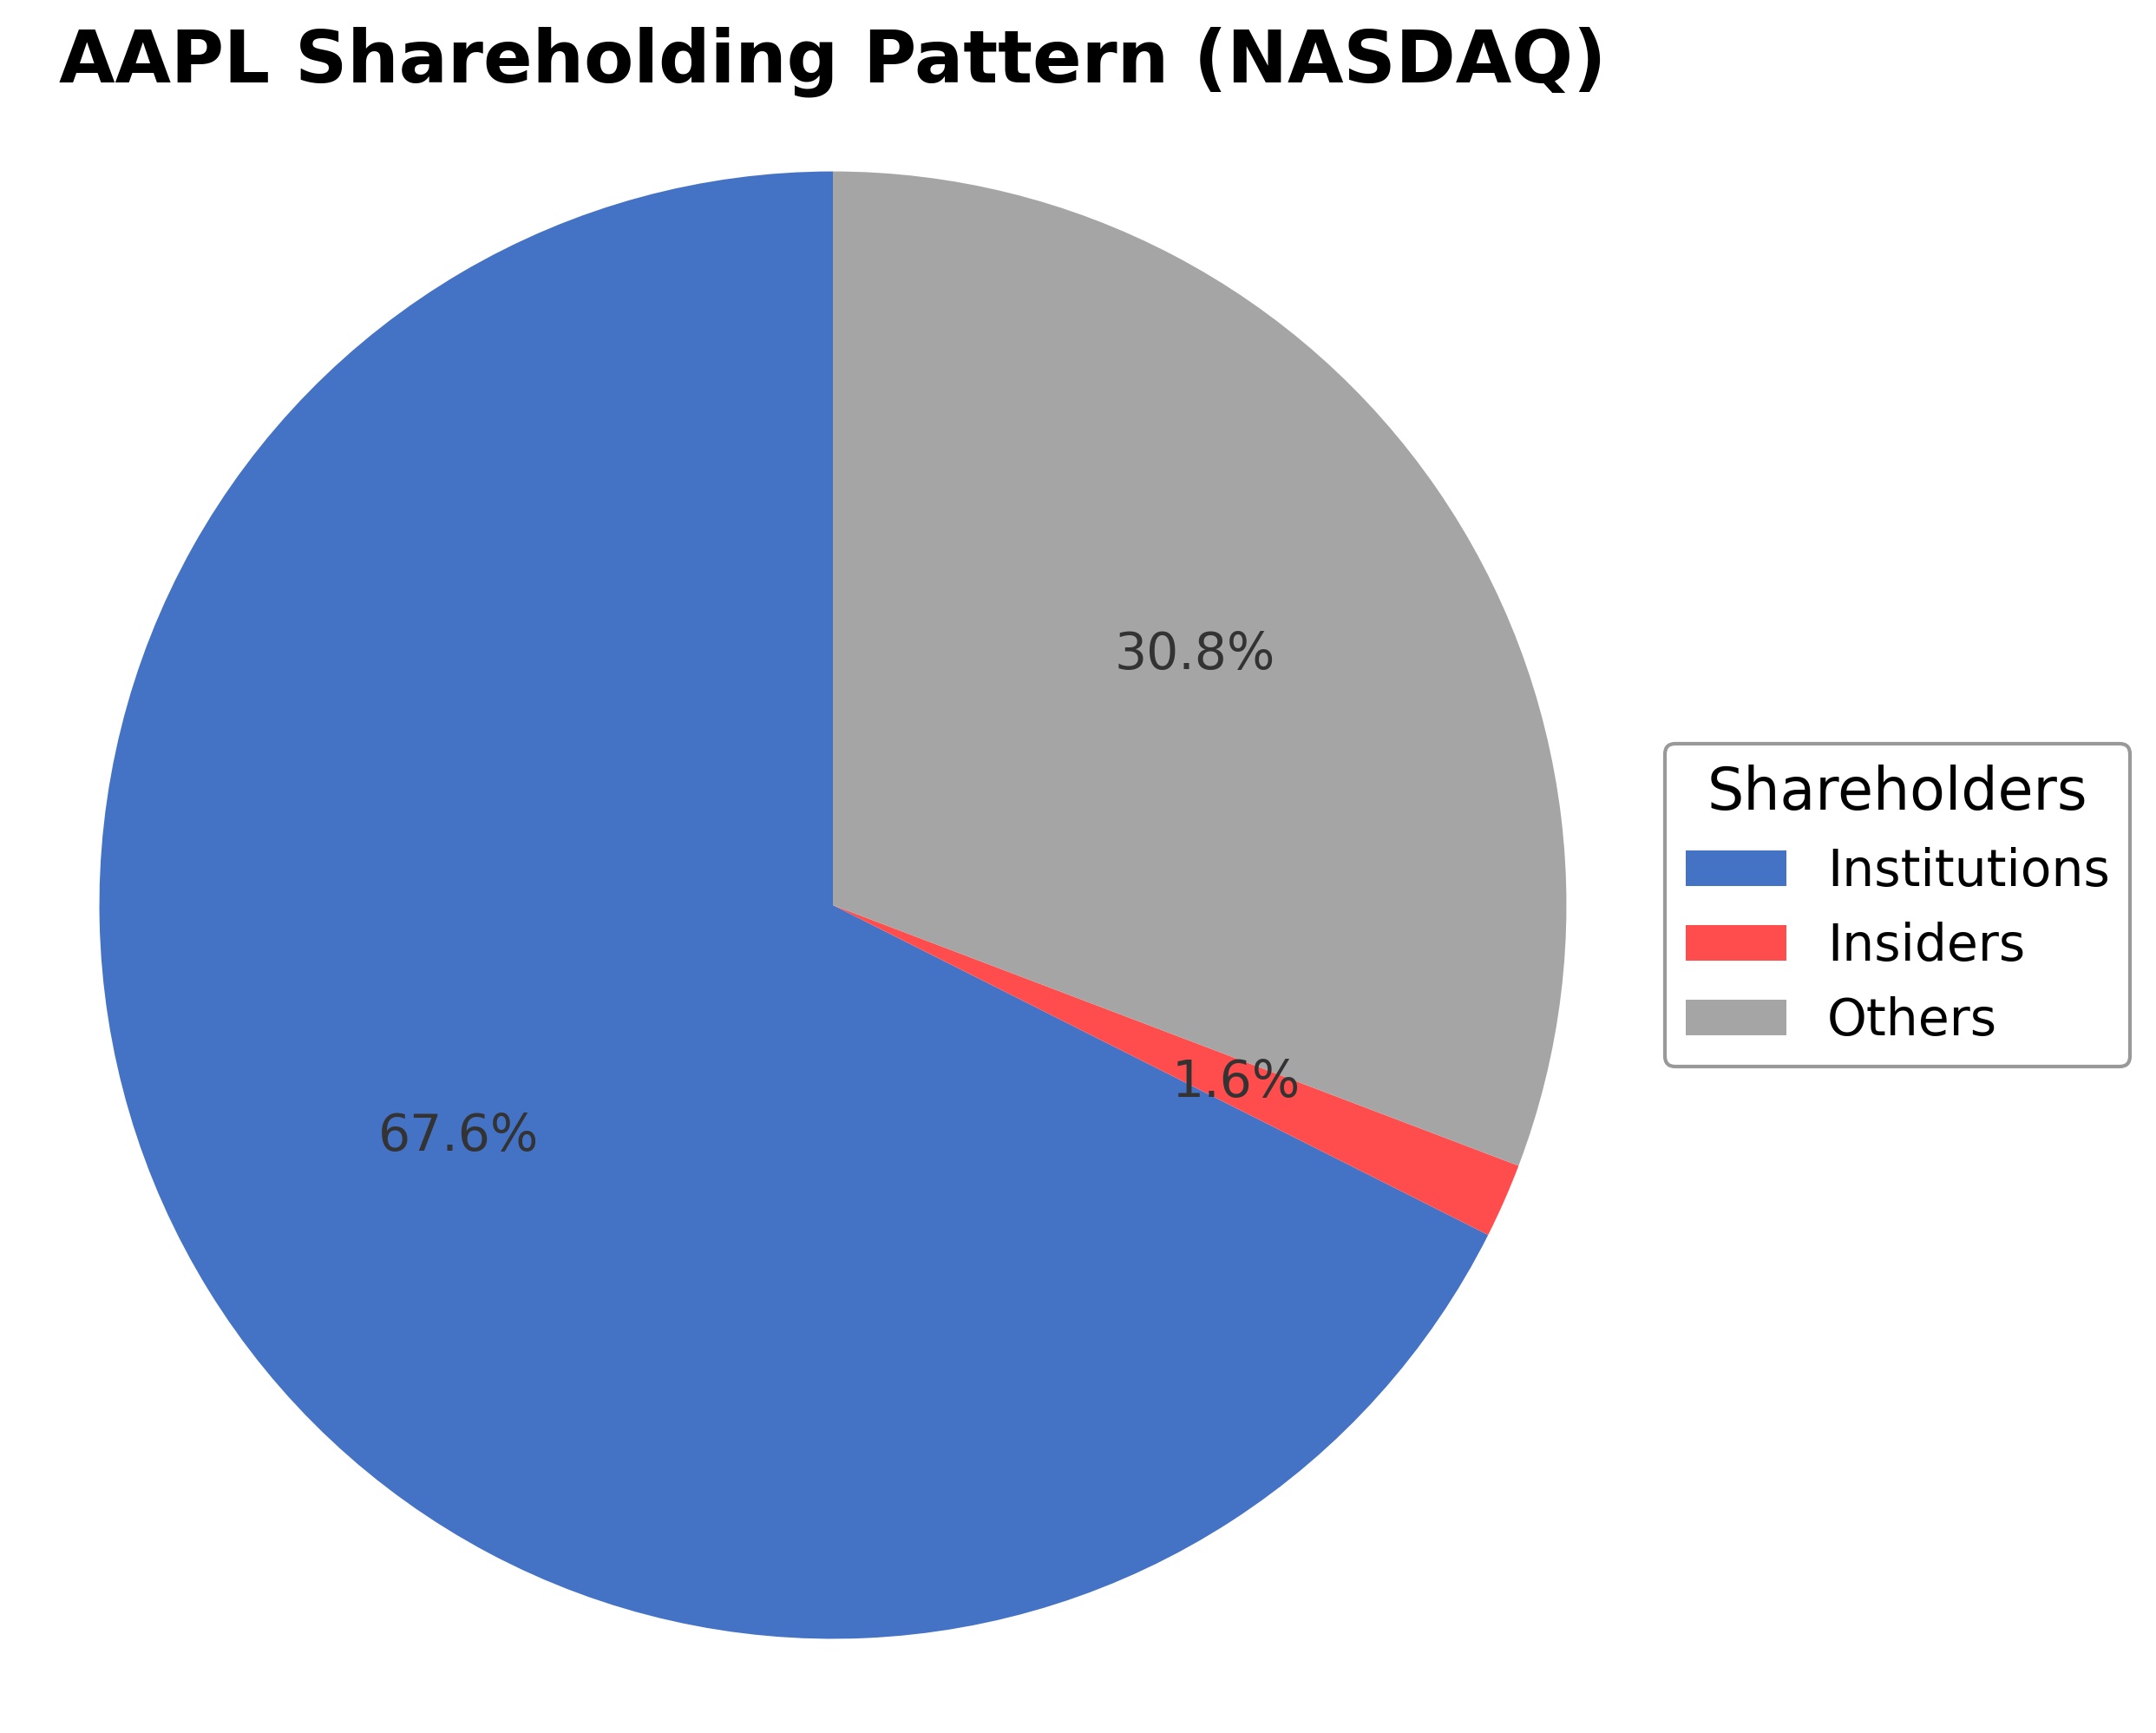
Apple Inc.'s ownership structure comprises approximately 1.64% insiders, including executives and board members, 67.58% institutional investors such as mutual funds and pension funds, and 32.42% held by public and other shareholders. Over the past 12-24 months, institutional ownership has remained stable with notable accumulation by major funds, reflecting sustained confidence in Apple's growth prospects. The significant institutional presence supports strong governance and strategic direction, while broad public ownership ensures liquidity. This ownership pattern indicates a balanced market sentiment with institutional backing reinforcing Apple's leadership in the consumer electronics industry.
Sector and Industry Analysis
The global apple market is a significant segment within the broader agricultural sector, characterized by steady growth driven by rising health awareness and increasing disposable incomes. Market size projections indicate continued expansion through 2034, supported by diverse applications ranging from fresh consumption to processed products like juices and sauces. Key players include multinational agribusinesses alongside numerous local producers, with Asia and Europe serving as major consumption and production hubs.
Emerging trends in the apple industry include a strong consumer shift toward organic and locally sourced produce, alongside technological advancements in cultivation and storage that improve yield and shelf life. Competitive dynamics are intensifying as international firms expand operations, challenging smaller producers to innovate and diversify. Barriers such as climate variability, stringent food safety standards, and fluctuating trade tariffs shape market entry and ongoing competition.
The regulatory environment is increasingly focused on food safety, quality standards, and sustainability, with stricter policies influencing production and trade practices. Regional trade agreements and evolving tariffs impact pricing and distribution channels, while environmental regulations encourage adoption of resilient farming techniques. These regulatory factors collectively shape market strategies and are critical to forecasting future industry performance.
Note: Analysis synthesized from industry research, market reports, and regulatory filings. Information is subject to change based on market conditions.
Financial Ratios Dashboard
Illustrative Scenario Analysis
DCF Assumptions:
Method: Two-Stage EPS-Priority Model
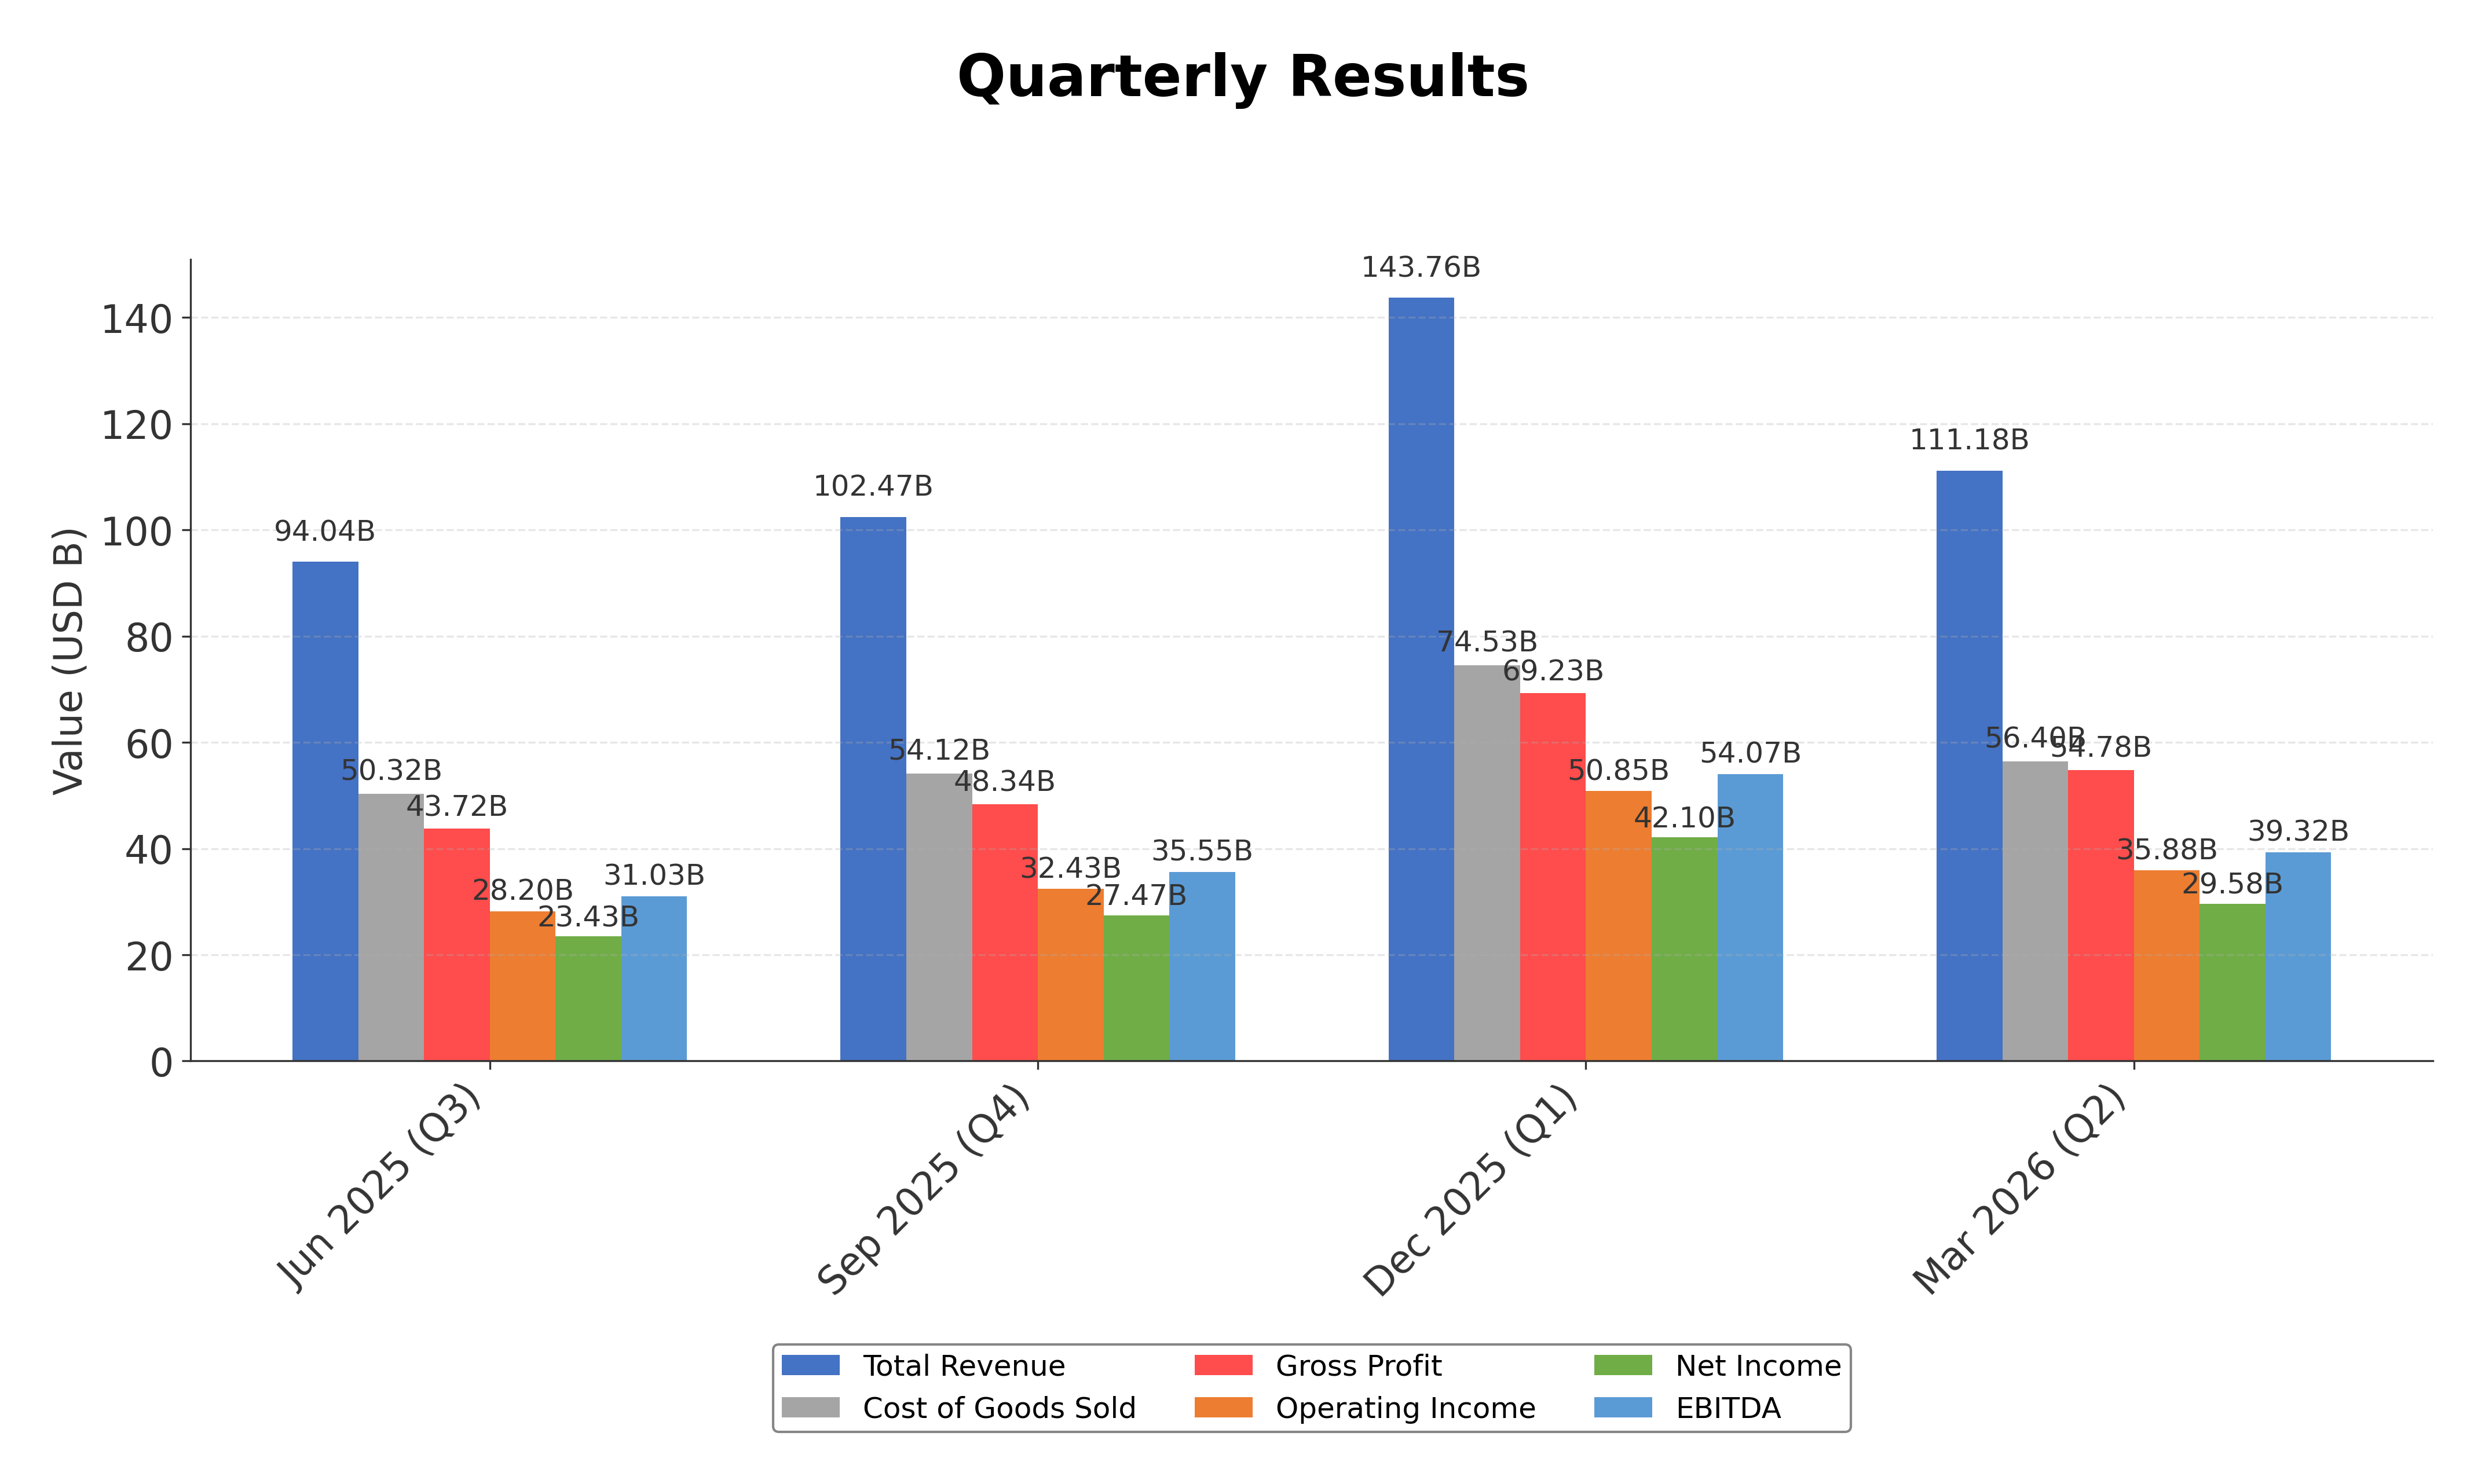
Financials
Peer Analysis
| Company Name | Market Cap | P/E Ratio | P/B Ratio | EV/EBITDA | Price to CFO |
|---|---|---|---|---|---|
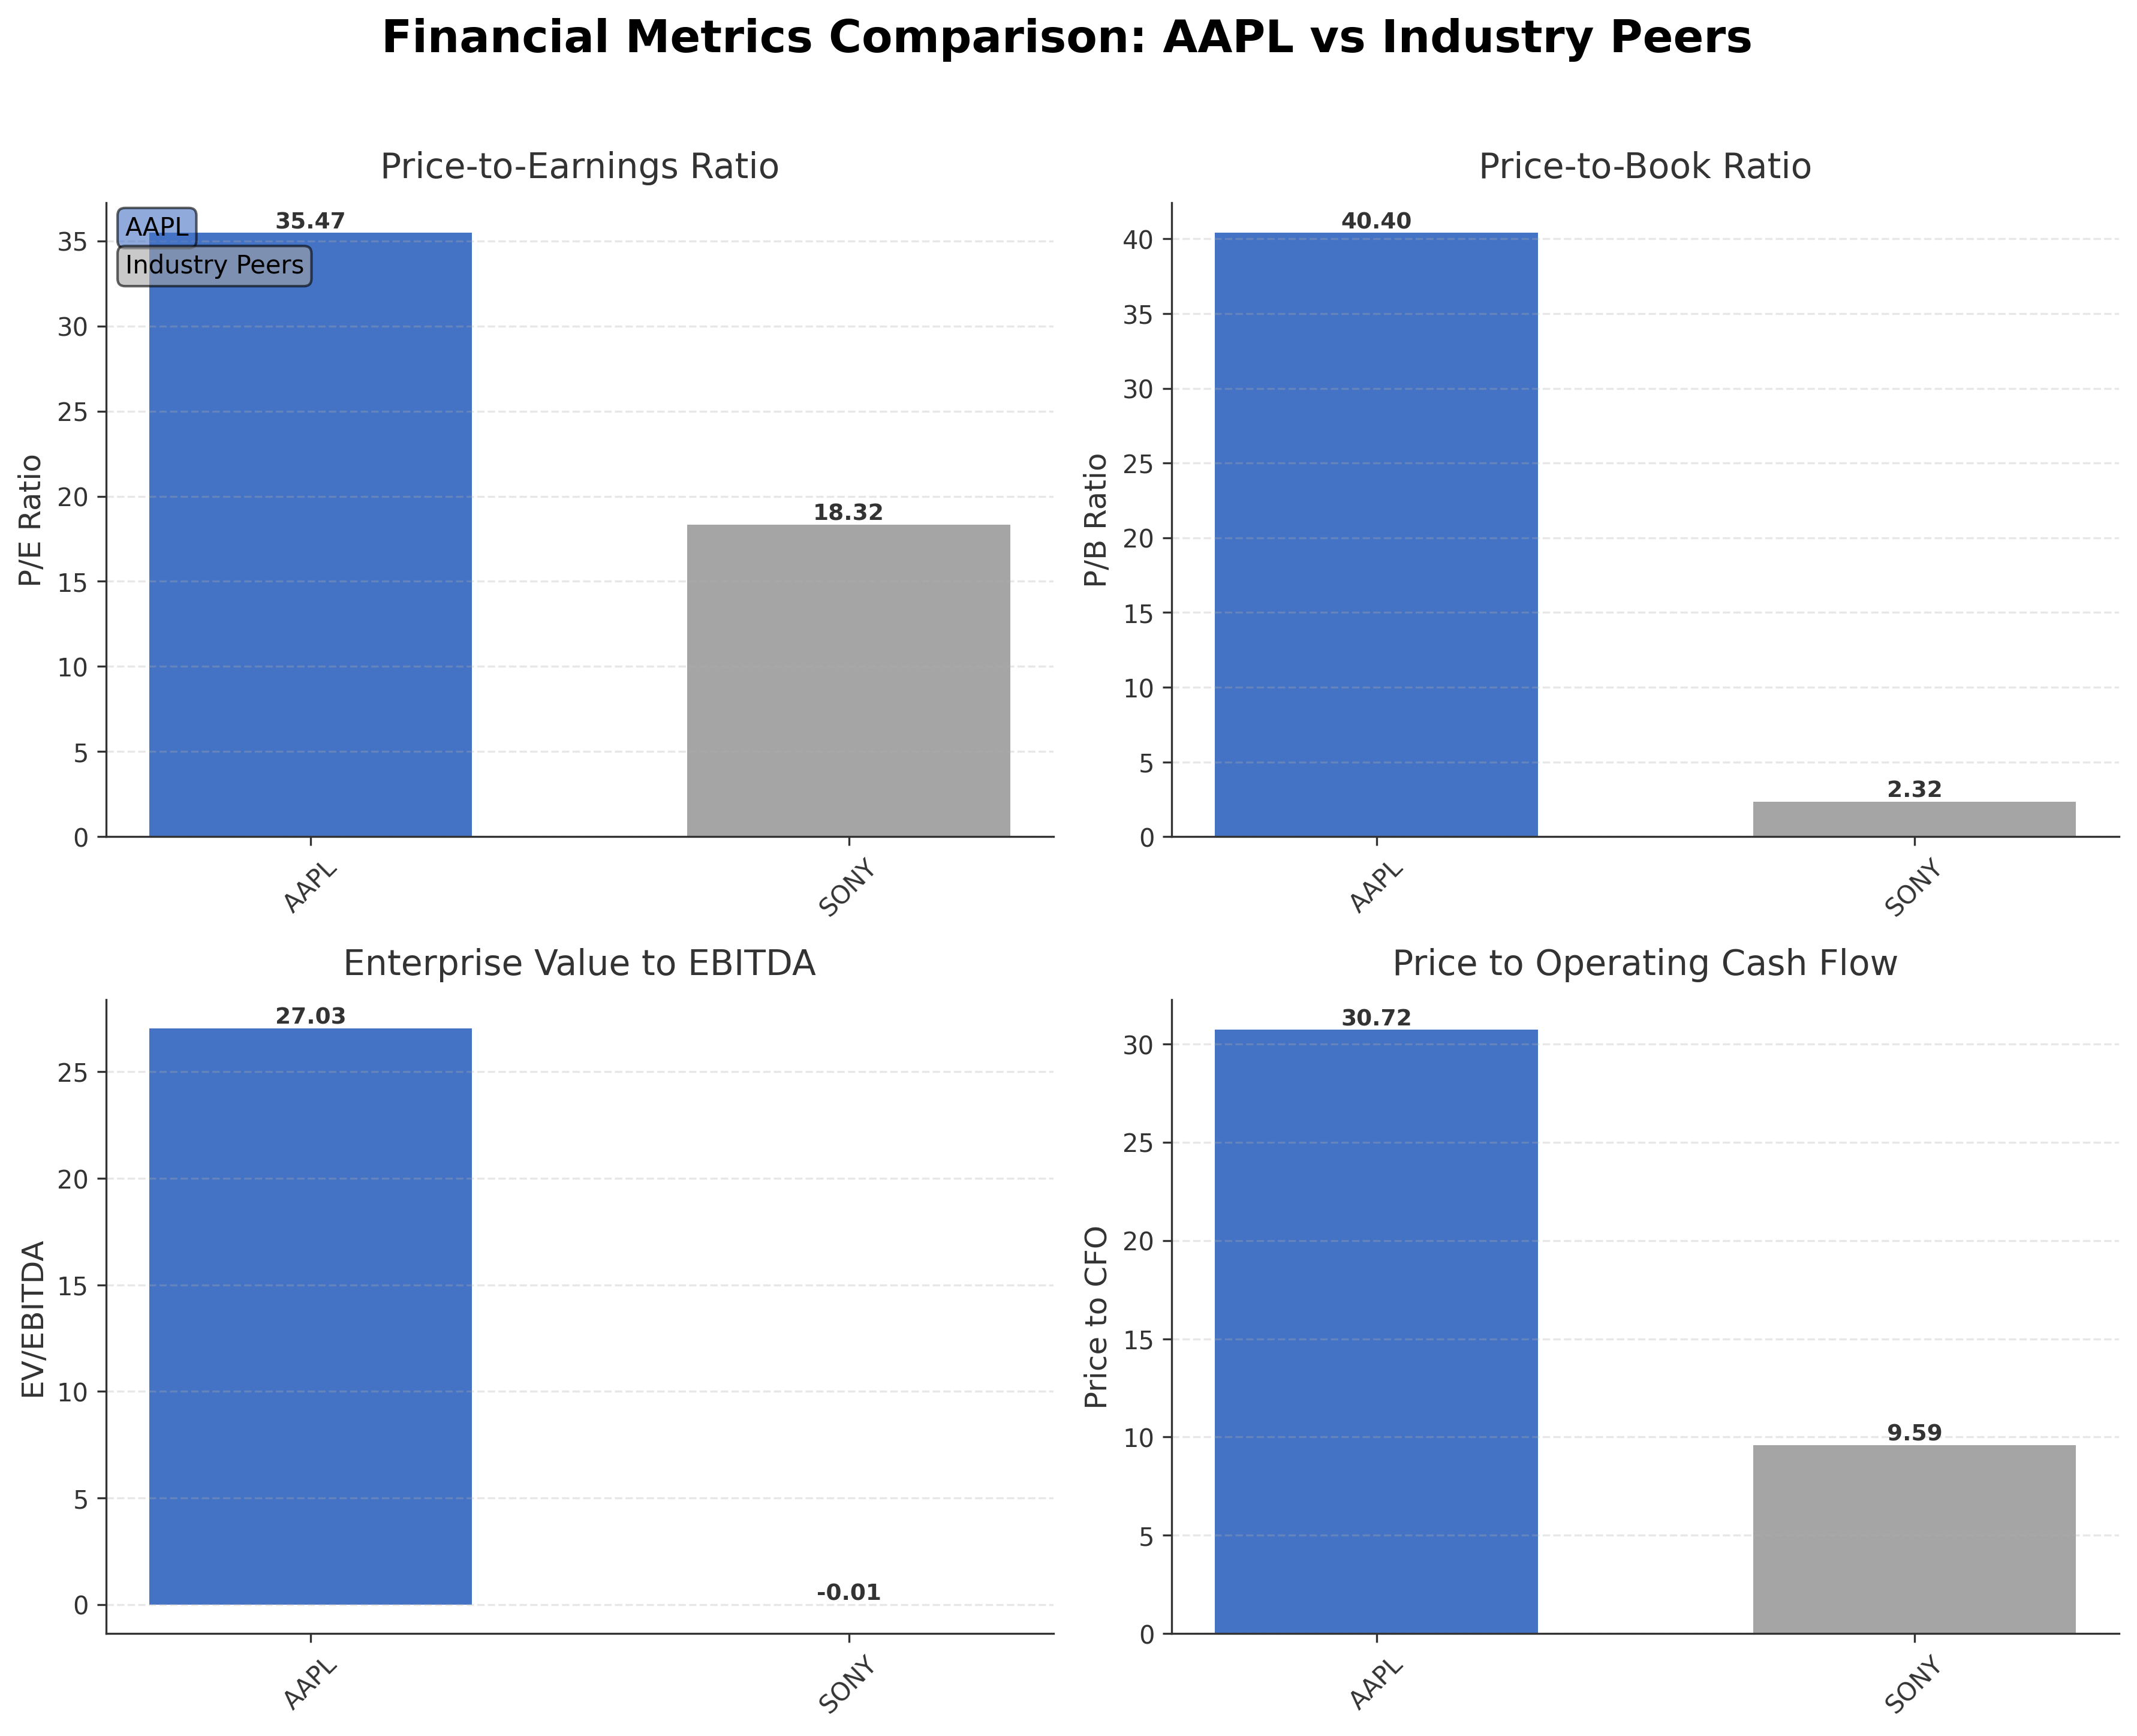
| Apple Inc. | $4.31T | 35.47 | 40.40 | 27.03 | 30.72 |
| Sony Group Corporation - Sponsored American Depositary Receipt | $119.04B | 18.32 | 2.32 | -0.01 | 9.59 |
Comparison Analysis: Apple Inc. significantly outscales its peer Sony Group Corporation in market capitalization, with $4.31 trillion compared to Sony's $119.04 billion. Apple exhibits a higher P/E ratio of 35.47 versus Sony's 18.32, reflecting a premium valuation consistent with its market leadership and growth expectations. The P/B ratio for Apple is notably elevated at 40.40 compared to Sony's 2.32, indicating strong investor confidence in Apple's intangible assets and brand value. Apple's EV/EBITDA of 27.03 contrasts with Sony's negative figure, underscoring superior operational profitability. Return on equity for Apple at 1.41% surpasses Sony's 0.12%, highlighting more efficient capital utilization. Overall, Apple demonstrates robust financial metrics and market dominance relative to its regional industry peer.
Financial Metrics Comparison with Peers
Financial Statements
Comprehensive financial data including income, balance sheet, and cash flow metrics
Income Statement
| fiscal_date | 2025-09-30 | 2024-09-30 | 2023-09-30 | 2022-09-30 | 2021-09-30 |
|---|---|---|---|---|---|
| Sales | 416.16B | 391.04B | 383.29B | 394.33B | 365.82B |
| Cost Of Goods | 220.96B | 210.35B | 214.14B | 223.55B | 212.98B |
| Gross Profit | 195.20B | 180.68B | 169.15B | 170.78B | 152.84B |
| Operating Expense Research And Development | 34.55B | 31.37B | 29.91B | 26.25B | 21.91B |
| Operating Expense Selling General And Administrative | 27.60B | 26.10B | 24.93B | 25.09B | 21.97B |
| Operating Income | 133.05B | 123.22B | 114.30B | 119.44B | 108.95B |
| Other Income Expense | -321.00M | 269.00M | -565.00M | -334.00M | 60.00M |
| Pretax Income | 132.73B | 123.48B | 113.74B | 119.10B | 109.21B |
| Income Tax | 20.72B | 29.75B | 16.74B | 19.30B | 14.53B |
| Net Income | 112.01B | 93.74B | 97.00B | 99.80B | 94.68B |
| Eps Basic | 7.49 | 6.11 | 6.16 | 6.15 | 5.67 |
| Eps Diluted | 7.46 | 6.08 | 6.13 | 6.11 | 5.61 |
| Basic Shares Outstanding | 14.95B | 15.34B | 15.74B | 16.22B | 16.70B |
| Diluted Shares Outstanding | 14.95B | 15.34B | 15.74B | 16.22B | 16.70B |
| Ebit | 133.05B | 123.22B | 114.30B | 119.44B | 111.85B |
| Ebitda | 144.75B | 134.66B | 125.82B | 130.54B | 123.14B |
| Net Income Continuous Operations | 112.01B | 93.74B | 97.00B | 99.80B | 94.68B |
| Non Operating Interest Income | N/A | N/A | 3.75B | 2.83B | 2.84B |
| Non Operating Interest Expense | N/A | N/A | 3.93B | 2.93B | 2.65B |
Source: Financial statements and regulatory filings
Balance Sheet
| fiscal_date | 2025-09-30 | 2024-09-30 | 2023-09-30 | 2022-09-30 | 2021-09-30 |
|---|---|---|---|---|---|
| Cash And Cash Equivalents | 35.93B | 29.94B | 29.96B | 23.65B | 34.94B |
| Accounts Receivable | 39.78B | 33.41B | 29.51B | 28.18B | 26.28B |
| Total Assets | 359.24B | 364.98B | 352.58B | 352.75B | 351.00B |
| Total Liabilities | 285.51B | 308.03B | 290.44B | 302.08B | 287.91B |
| Long Term Debt | 78.33B | 85.75B | 95.28B | 109.71B | 119.38B |
| Shareholders Equity | 73.73B | 56.95B | 62.15B | 50.67B | 63.09B |
Source: Financial statements and regulatory filings
Cash Flow Statement
| fiscal_date | 2025-09-30 | 2024-09-30 | 2023-09-30 | 2022-09-30 | 2021-09-30 |
|---|---|---|---|---|---|
| Operating Activities Net Income | 112.01B | 93.74B | 97.00B | 99.80B | 94.68B |
| Operating Activities Depreciation | 11.70B | 11.45B | 11.52B | 11.10B | 11.28B |
| Operating Activities Stock Based Compensation | 12.86B | 11.69B | 10.83B | 9.04B | 7.91B |
| Operating Activities Other Non Cash Items | -89.00M | -2.27B | -2.23B | 1.01B | -4.92B |
| Operating Activities Accounts Receivable | -7.03B | -5.14B | -417.00M | -9.34B | -14.03B |
| Operating Activities Accounts Payable | 902.00M | 6.02B | -1.89B | 9.45B | 12.33B |
| Operating Activities Other Assets Liabilities | -18.87B | 2.77B | -4.27B | 1.57B | -1.53B |
| Operating Activities Operating Cash Flow | 111.48B | 118.25B | 110.54B | 123.52B | 100.94B |
| Investing Activities Capital Expenditures | -12.71B | -9.45B | -10.96B | -10.71B | -11.09B |
| Investing Activities Purchase Of Investments | -24.41B | -48.66B | -29.51B | -76.92B | -109.56B |
| Investing Activities Sale Of Investments | 53.80B | 62.35B | 45.51B | 67.36B | 106.48B |
| Investing Activities Other Investing Activity | -1.48B | -1.31B | -1.34B | -2.09B | -385.00M |
| Investing Activities Investing Cash Flow | 15.20B | 2.94B | 3.71B | -22.66B | -14.58B |
| Financing Activities Long Term Debt Issuance | 4.48B | 0.00 | 5.23B | 5.46B | 20.39B |
| Financing Activities Long Term Debt Payments | -10.93B | -9.96B | -11.15B | -9.54B | -8.75B |
| Financing Activities Short Term Debt Issuance | -2.03B | 3.96B | -3.98B | 3.96B | 1.02B |
| Financing Activities Common Stock Repurchase | -90.71B | -94.95B | -77.55B | -89.40B | -85.97B |
| Financing Activities Common Dividends | -15.42B | -15.23B | -15.03B | -14.84B | -14.47B |
| Financing Activities Other Financing Charges | -6.07B | -5.80B | -6.01B | -6.38B | -5.58B |
| Financing Activities Financing Cash Flow | -120.69B | -121.98B | -108.49B | -110.75B | -92.25B |
| End Cash Position | 35.93B | 29.94B | 30.74B | 24.98B | 35.93B |
| Income Tax Paid | 43.37B | 26.10B | 18.68B | 19.57B | 25.39B |
| Free Cash Flow | 98.77B | 108.81B | 99.58B | 111.44B | 92.95B |
| Interest Paid | N/A | N/A | 3.80B | 2.87B | 2.69B |
| Operating Activities Deferred Taxes | N/A | N/A | N/A | 895.00M | -4.77B |
| Investing Activities Net Acquisitions | N/A | N/A | N/A | -306.00M | -33.00M |
| Financing Activities Common Stock Issuance | N/A | N/A | N/A | N/A | 1.10B |
Source: Financial statements and regulatory filings
Technical Analysis
Key Insights
- Apple's current trend is strongly bullish with price action showing consistent higher highs and higher lows, indicating sustained upward momentum.
- Key support levels are identified near $260 and $255, with resistance around the recent high of $295 to $300, where the stock is currently testing breakout territory.
- The stock trades above major moving averages: approximately 8.7% above the 10-day SMA, 13.9% above the 50-day SMA, and 16.7% above the 200-day SMA, confirming a strong uptrend.
- Momentum indicators show RSI at 73.27, signaling overbought conditions; MACD remains positive but with potential for convergence; Stochastic oscillator also indicates elevated momentum.
- Multi-timeframe analysis reveals bullish trends on daily, weekly, and monthly charts, with the 50-day SMA above the 200-day SMA (golden cross) supporting longer-term strength.
- Current technical setup suggests potential for continued gains if momentum sustains, but elevated RSI warns of possible short-term pullbacks or consolidation phases.
Trending News
1. Headline: Viking Global Investors Lp Reports Share Stake Of 3.6 Million Shares In Apple - SEC Filing — TradingView News
Summary: Search · Get started · Viking Global Investors Lp Reports Share Stake Of 3.6 Million Shares In Apple - SEC Filing · RefinitivLess than 1 min read · AAPLMETATSLA · Login or create a forever free account to read this news · Let's go · Compare charts · Analyze on Supercharts · Latest news
Sentiment: neutral
2. Headline: Intel Stock (NASDAQ:INTC) Plunges as Apple Deal Looks Focused on Legacy Chips - TipRanks.com
Summary: Chip stock Intel ($INTC) was on top of the world recently as word emerged that Apple ($AAPL) was looking to team up with Intel to produce chips. New reports suggest...
Sentiment: positive
3. Headline: Rep. John McGuire Purchases Shares of Apple Inc. (NASDAQ:AAPL)
Summary: Representative John McGuire (Republican-Virginia) recently bought shares of Apple Inc. (NASDAQ:AAPL). In a filing disclosed on May 13th, the Representative disclosed that they had bought between $1,001 and $15,000 in Apple stock on April 15th. The trade occurred in the Representative's "MERRILL LYNC
Sentiment: neutral
4. Headline: Cerebras IPO Stock Pop; Apple-OpenAI Drama — The Information
Summary: This was quite the day. OpenAI is jumping up and down about its unhappiness with Apple (it’s doubtful Tim Cook is shaking in his boots). Big telecom threw down the gauntlet to Elon Musk and Amazon (not that they should worry). We get to both news items lower down.
Sentiment: negative
5. Headline: Apple stock keeps surging to new highs — it’s more than just the iPhone
Summary: Apple stock continues to hit new record highs, extending this year’s impressive rebound. Evercore ISI sees the momentum continuing for some time, and it’s about more than just iPhone sales. Analyst Amit Daryanani raised his price target for Apple to $365 from $330 on Thursday, implying roughly 22% upside from today. ... Daryanani’s increased ...
Sentiment: positive
Recent Updates
News Summary
As of 2026-05-15. Apple reported strong financial results for Q2 2026, achieving record revenue of $111.2 billion and EPS of $2.01, driven by exceptional demand for the iPhone 17 lineup and all-time high Services revenue. The company announced a 4% dividend increase and authorized a $100 billion share repurchase program, reflecting robust capital return strategies. Product innovation continues with new launches including the iPhone 17e, M4-powered iPad Air, and MacBook Neo. Additionally, Apple is planning a major iPhone software update featuring a redesigned Camera app and enhanced Siri capabilities, aiming to improve user experience. Leadership transition plans were disclosed, with Tim Cook set to become Executive Chairman and John Ternus to assume the CEO role, signaling strategic continuity.
News Sentiment
The overall sentiment from recent updates is predominantly positive, driven by strong financial performance and record-setting revenue and earnings growth. Investor confidence is bolstered by Apple's continued innovation in hardware and software, alongside proactive capital allocation through dividends and share buybacks. Neutral tones arise from routine investor relations communications and institutional share disclosures. Some caution is noted in market reactions to chip sourcing partnerships, but these do not materially detract from the positive momentum. The combination of robust earnings, strategic product enhancements, and leadership succession plans supports a constructive outlook.
Source List
- https://www.apple.com/newsroom/2026/04/apple-reports-second-quarter-results/
- https://finance.yahoo.com/news/apple-stock-gaining-today-whats-181729752.html
- https://quartr.com/companies/apple-inc_4742
- https://www.cnbc.com/2026/04/30/apple-aapl-q2-2026-earnings-report.html
- https://www.apple.com/newsroom/2026/01/apple-reports-first-quarter-results/
Analytical Overview
Analysis Summary
Apple’s valuation metrics, including a trailing P/E of 35.47 and forward P/E of 30.68, are elevated relative to the consumer electronics industry average P/E of 35.47, reflecting a premium consistent with its market leadership and growth prospects. The company’s revenue growth of 16.6% year-over-year and strong operating cash flow of $140.2 billion demonstrate a solid growth trajectory supported by expanding product and services segments. Financial health is robust, with a manageable debt-to-equity ratio of 79.5% and substantial free cash flow of $101.1 billion, enabling ongoing capital returns and investments. Sector-specific challenges include supply chain constraints and rising component costs, while opportunities lie in AI integration and expanding services. Market positioning and competitive advantages such as brand loyalty, innovation, and ecosystem integration underpin Apple’s resilience.
Overall Business and Market Assessment
Supporting Factors: Apple’s record revenue and earnings growth, strong cash flow generation, and strategic product launches enhancing its ecosystem
Risk Factors: No data
SWOT Analysis
Strengths
- Market leadership with a diversified product and services ecosystem.
- Strong profitability with high gross and operating margins.
- Robust cash flow generation supporting capital returns and investments.
- Global brand recognition and customer loyalty.
Weaknesses
- High valuation multiples may limit near-term upside.
- Dependence on iPhone sales for a significant portion of revenue.
- Relatively high debt-to-equity ratio compared to peers.
- Exposure to supply chain and component cost pressures.
Opportunities
- Expansion of services and subscription-based revenue streams.
- Integration of artificial intelligence into products and software.
- Growth in emerging markets and new product categories.
- Strategic partnerships and acquisitions enhancing technology capabilities.
Threats
- Intense competition in consumer electronics and technology sectors.
- Regulatory and antitrust scrutiny in multiple jurisdictions.
- Global economic uncertainties impacting consumer spending.
- Potential supply chain disruptions and rising input costs.
Company Description
Apple Inc. is a leading technology company renowned for designing, manufacturing, and marketing innovative hardware and software products for consumers and businesses worldwide. Its flagship product, the iPhone, accounts for the majority of sales, serving as the central hub of an expansive ecosystem that includes Mac computers, iPad tablets, Apple Watch wearables, and accessories like AirPods. Apple Inc. also offers a suite of services such as the App Store, Apple Music, iCloud, Apple TV+, and Apple Fitness+, providing digital content, cloud storage, and subscription-based platforms. Operating in the consumer electronics industry within the technology sector, the company employs approximately 166,000 people and maintains a broad global presence through online stores, retail outlets, and partnerships with carriers and resellers. With a substantial market capitalization reflecting its scale, Apple Inc. plays a pivotal role in shaping consumer technology trends, emphasizing seamless integration across devices and services to enhance user experience and productivity.