
Apple Inc (AAPL)
Stock Analysis Report
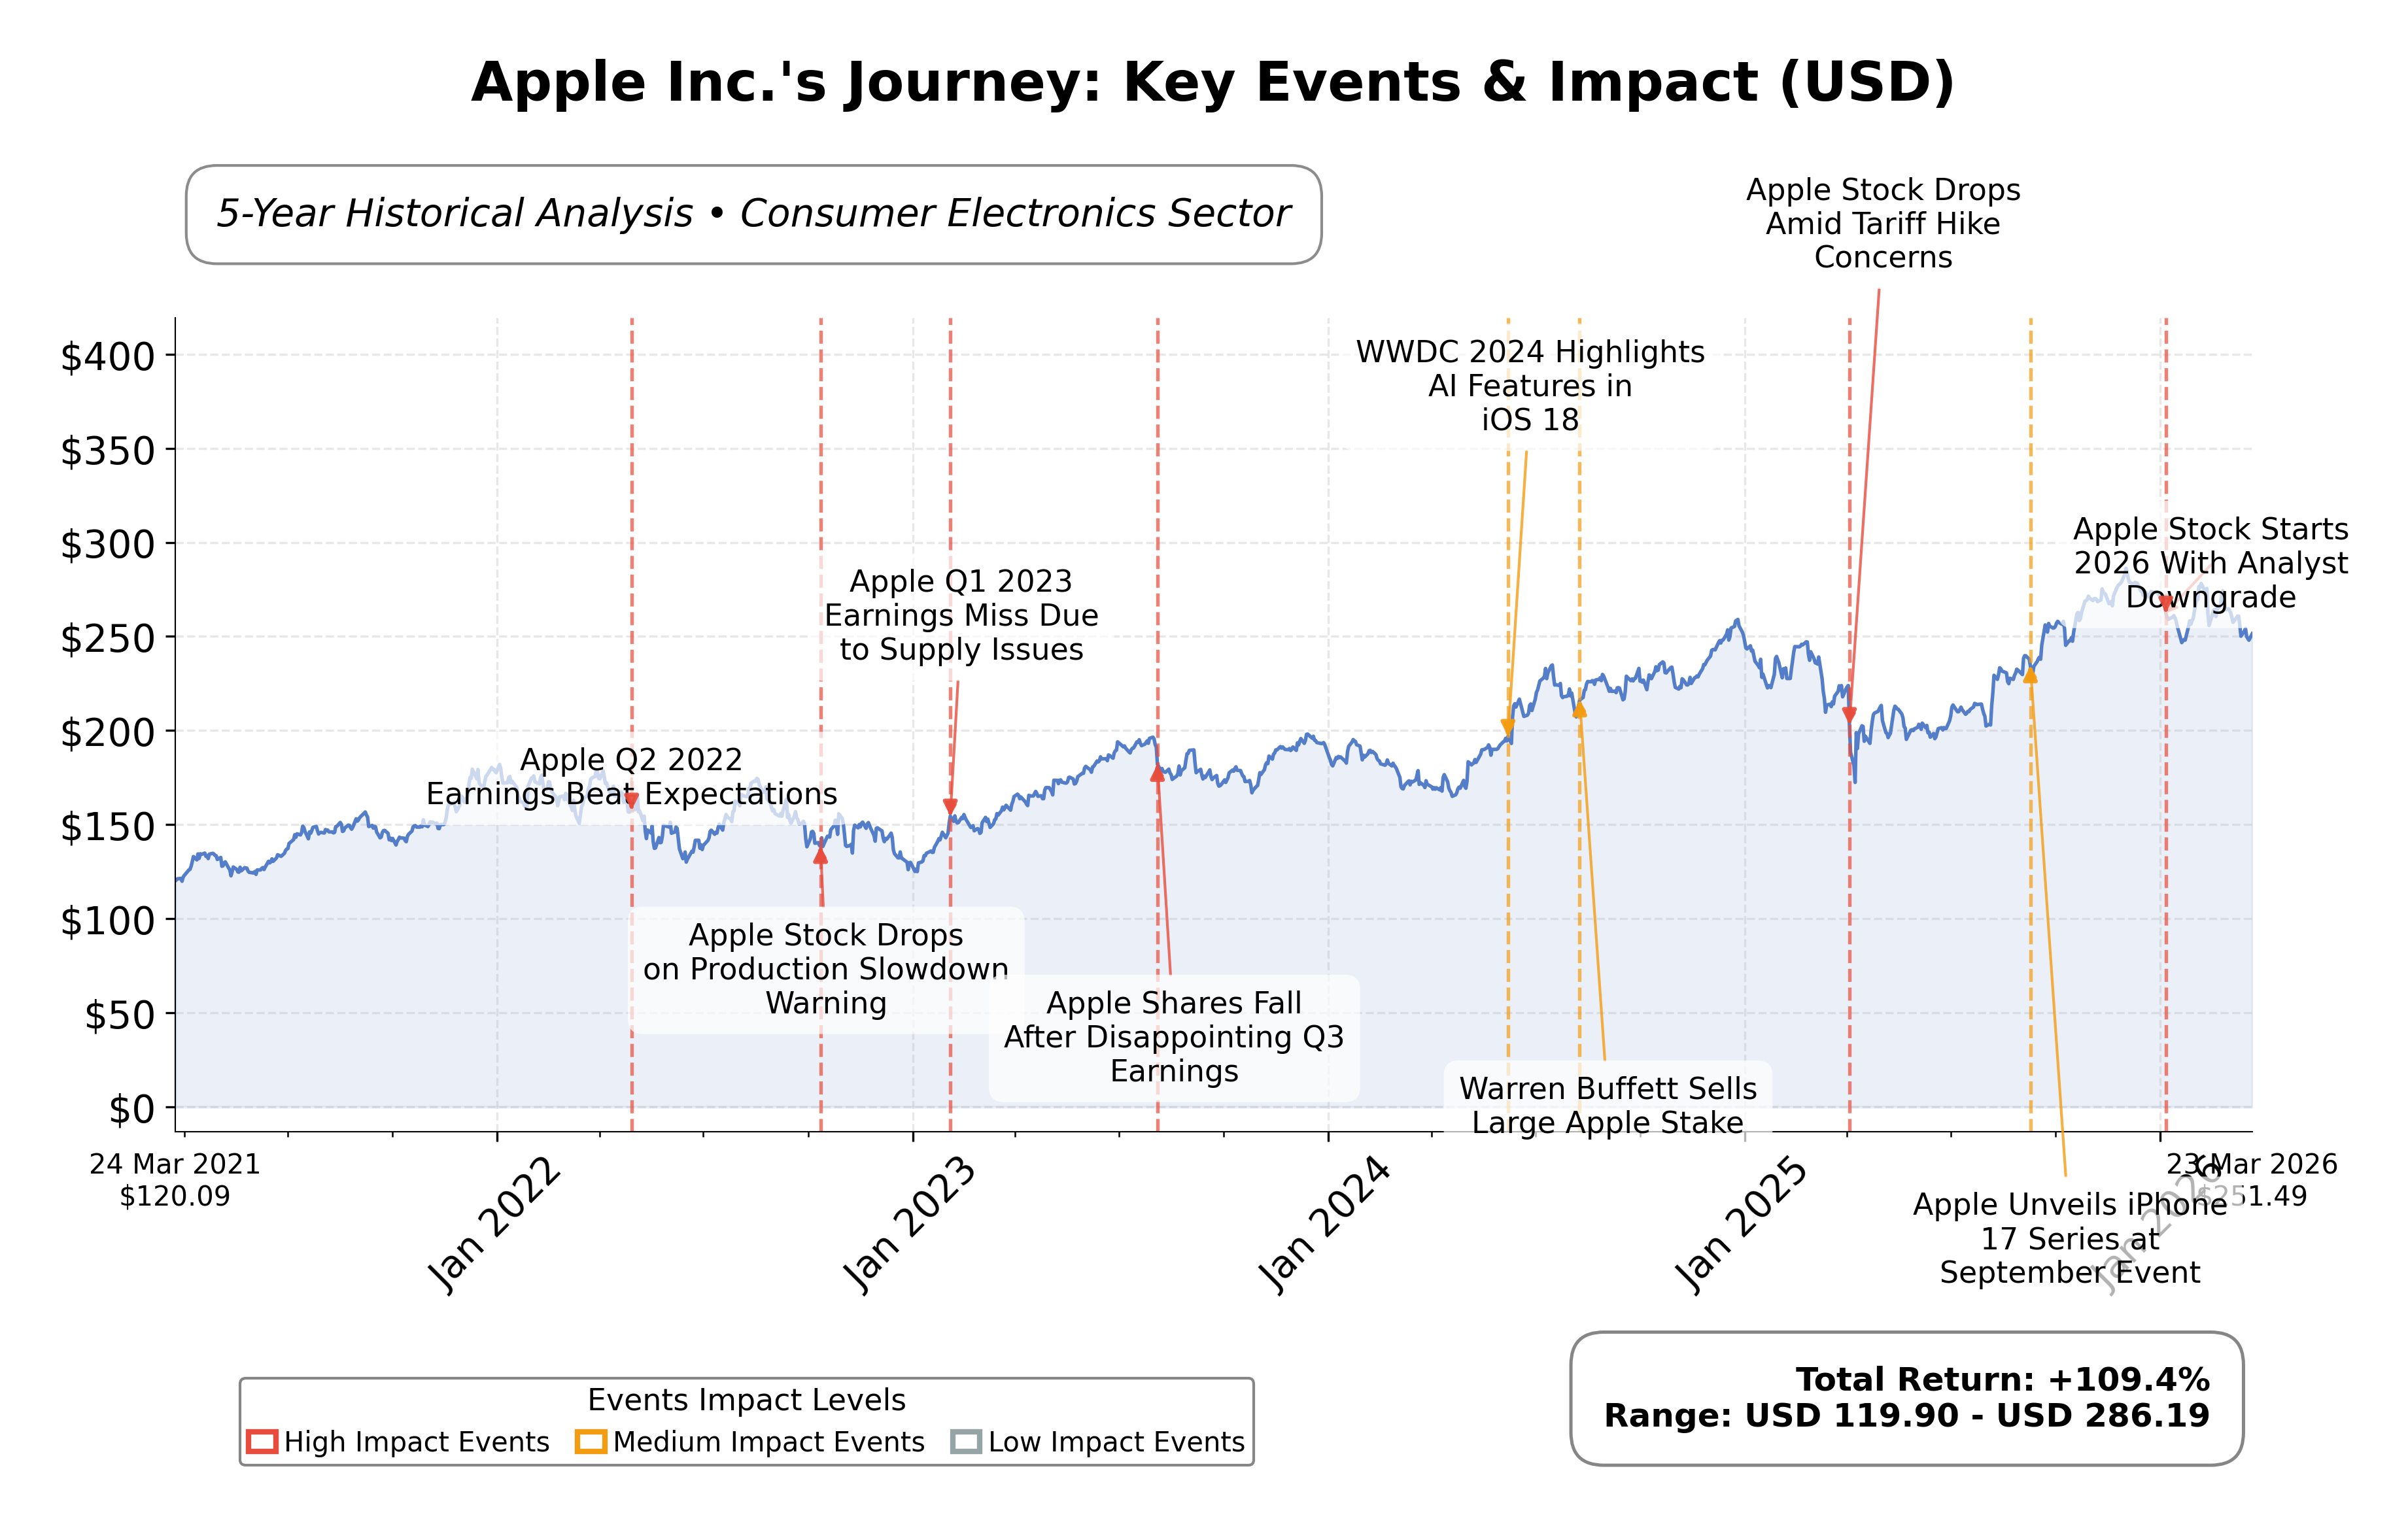
Stock Journey
Key Positives and Key Risks
Pros
- Market capitalization of $3.64 trillion underscores Apple's dominant scale and market leadership.
- Quarterly revenue growth of 15.7% and earnings growth of 15.9% indicate strong growth momentum.
- Operating cash flow of $135.5 billion and free cash flow of $106.3 billion demonstrate robust cash generation supporting financial flexibility.
Cons
- Price-to-book ratio of 41.51 reflects a high valuation that may limit upside potential.
- Current ratio of 0.974 suggests tight short-term liquidity, which could pose operational challenges.
- Institutional selling activity noted with some funds reducing positions, indicating mixed market sentiment.
Disclosure: This information is for general awareness and does not constitute investment advice
Report Summary
Apple Inc. operates as a leading technology company specializing in the design, manufacturing, and marketing of consumer electronics, software, and services. Its core product lineup includes the iPhone, Mac computers, iPad tablets, Apple Watch, and accessories such as AirPods, complemented by digital services like the App Store, Apple Music, iCloud, and Apple TV+. Positioned within the consumer electronics industry and technology sector, Apple maintains a significant global footprint with a robust ecosystem integrating hardware and software.
Financially, Apple demonstrates substantial scale with a market capitalization exceeding $3.64 trillion and trailing P/E ratio of 31.51, slightly above the industry average. The company reported trailing twelve months (TTM) revenue of approximately $435.6 billion and net income of $117.8 billion, reflecting solid profitability with a profit margin of 27.0%. Key valuation metrics include a forward P/E of 26.71 and a price-to-book ratio of 41.51, indicating premium market valuation. Operating cash flow and free cash flow remain strong at $135.5 billion and $106.3 billion respectively, supporting financial flexibility.
From a technical and strategic perspective, Appleâs stock trades above its 50-day and 200-day moving averages, with a beta of 1.12 indicating moderate volatility relative to the market. Recent institutional shareholding changes show mixed activity, with some funds reducing positions while others increased stakes significantly. The company continues to innovate with new product launches and services, including advancements in AI and ecosystem integration. Notable risks include high valuation multiples and competitive pressures in the consumer electronics space.
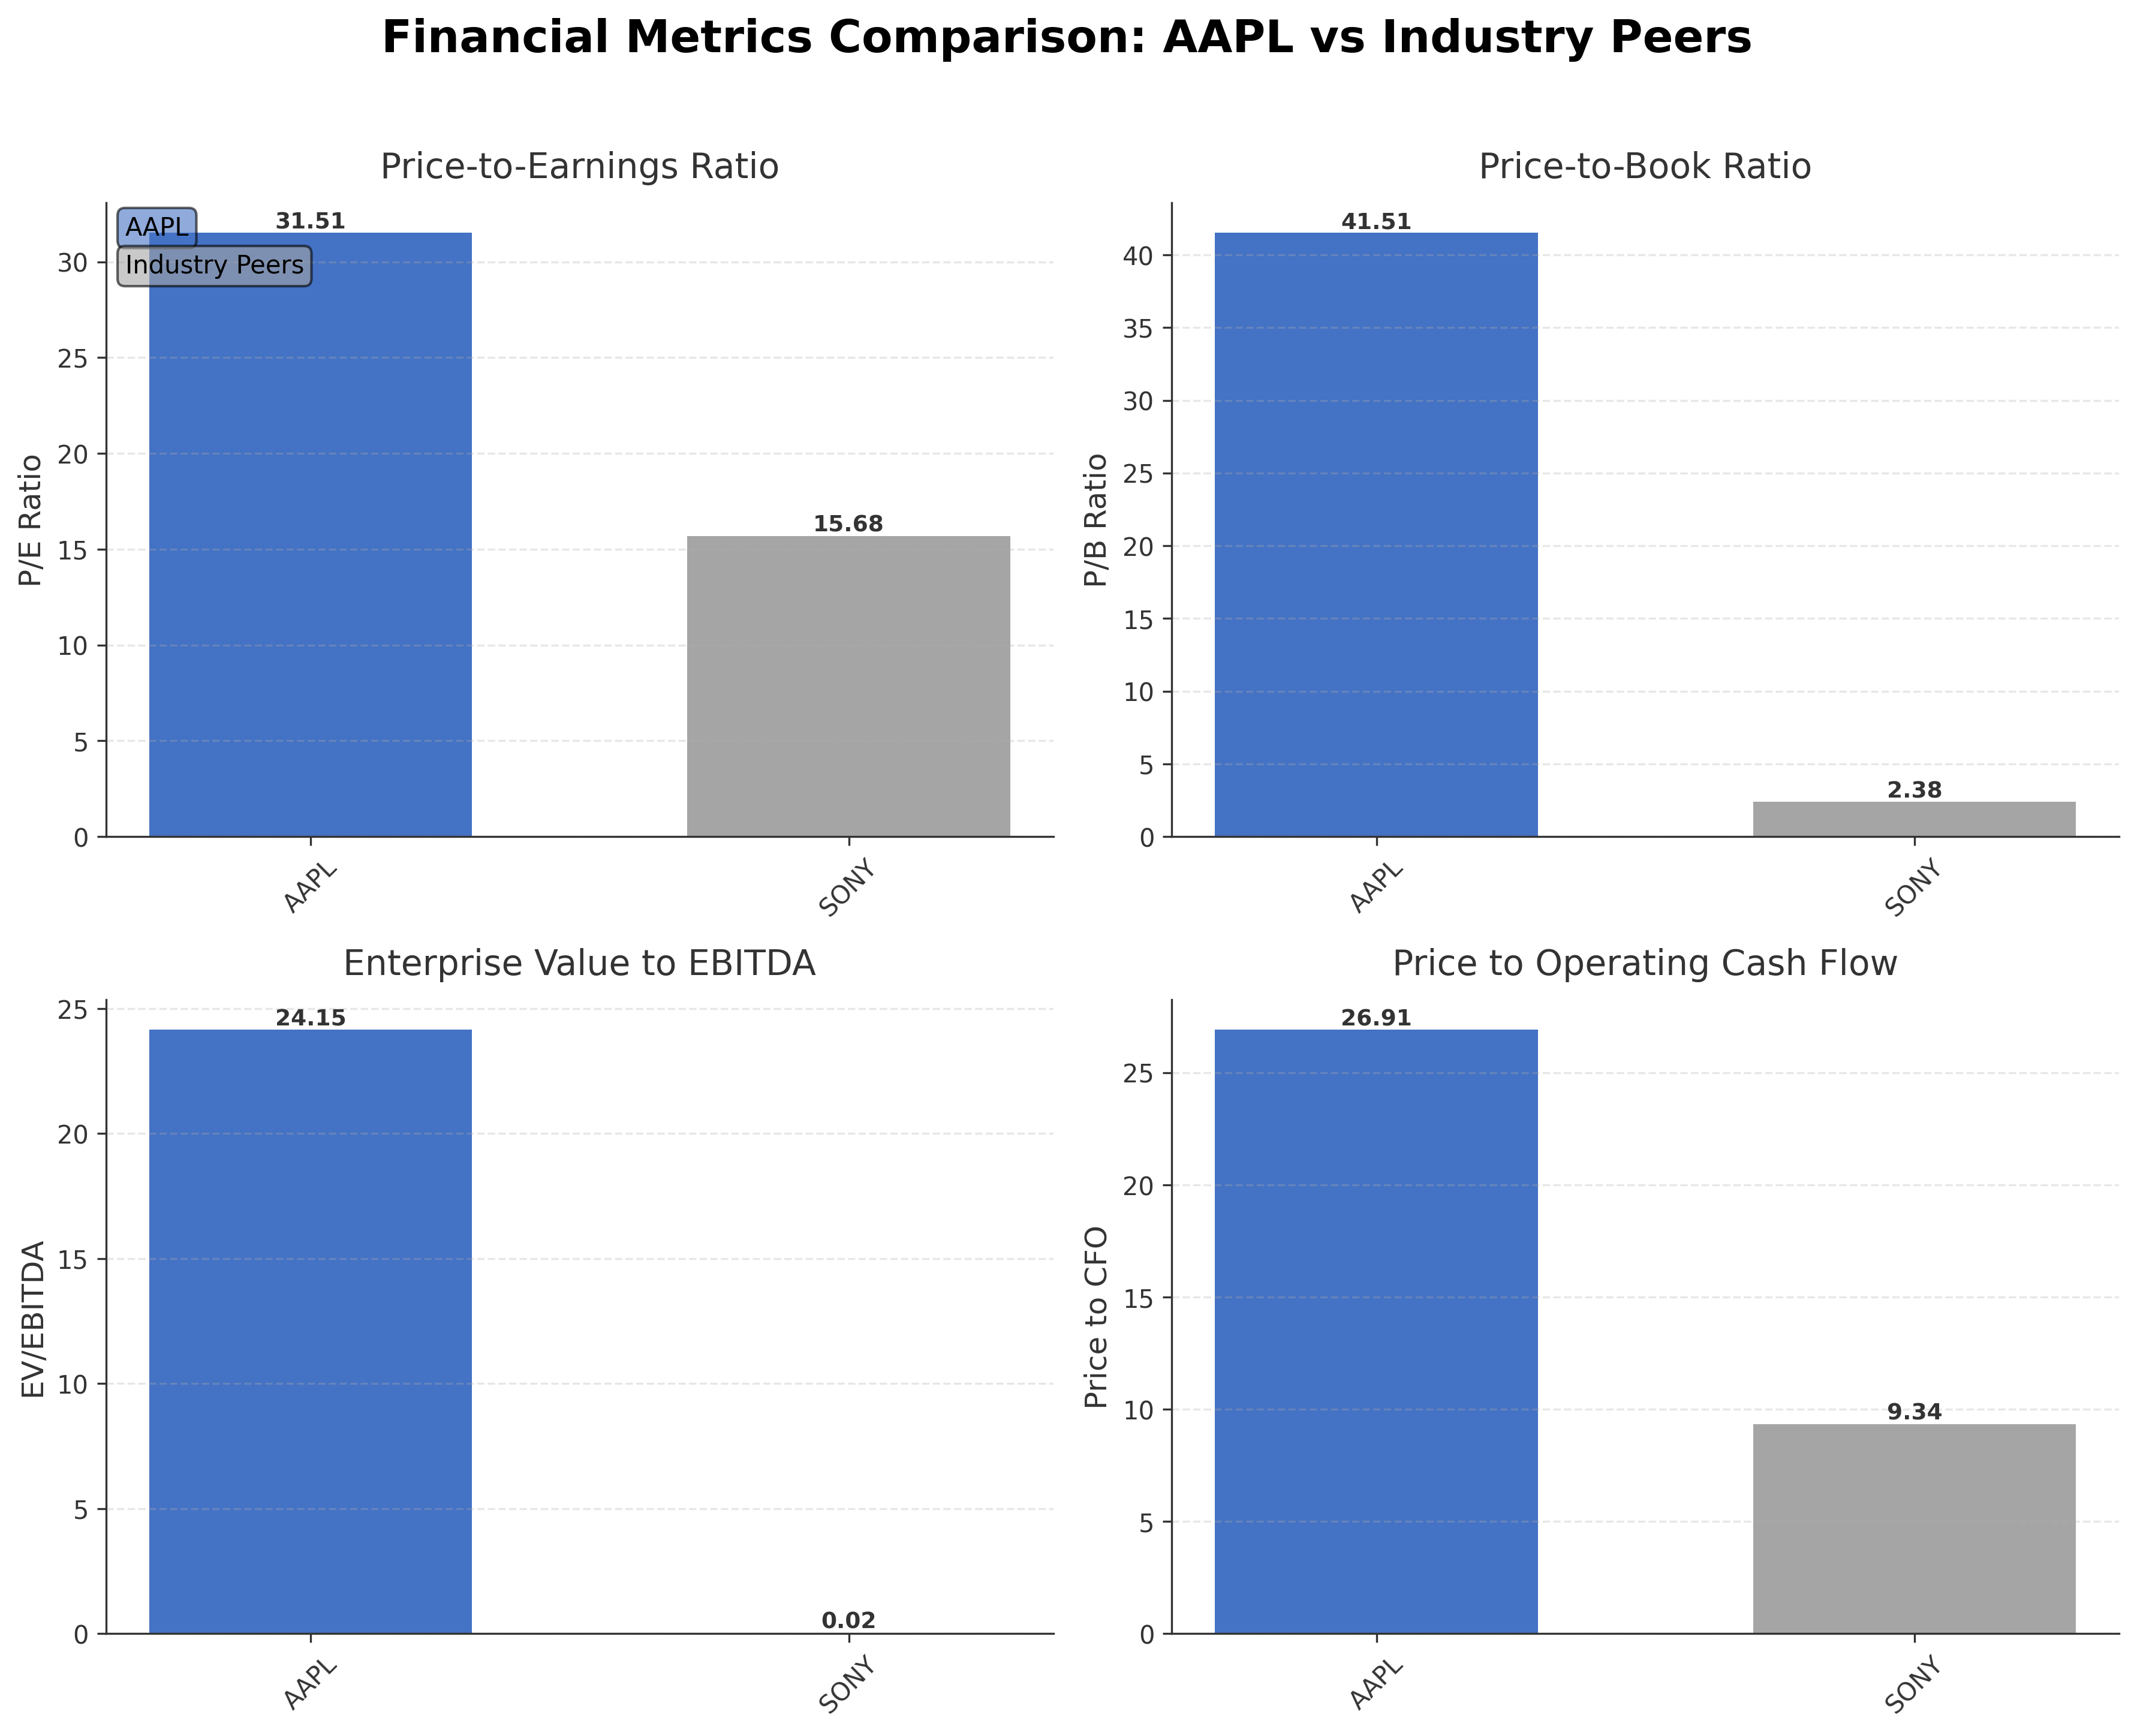
In peer comparison within the consumer electronics industry and U.S. market, Appleâs market capitalization vastly exceeds that of peers such as Sony Group Corporation, which has a market cap of approximately $120 billion. Appleâs P/E ratio of 31.51 is higher than Sonyâs 15.68, reflecting market expectations of stronger growth or premium positioning. Appleâs return on equity (ROE) at 1.52% is also higher than Sonyâs 0.15%, though both figures suggest differing capital efficiency dynamics. Appleâs valuation multiples such as EV/EBITDA and price to CFO are elevated relative to its peers, underscoring its dominant market position.
Apple stands as a central figure in the evolving technology landscape, balancing innovation-driven growth with the challenges of sustaining premium valuation and navigating competitive and regulatory environments. Recent achievements include robust revenue growth and strategic initiatives in AI and services expansion, while ongoing challenges involve managing market expectations and geopolitical factors. The companyâs trajectory presents pivotal moments where execution on innovation and market expansion will influence future positioning. Given the comprehensive data, a neutral and watchful stance may be appropriate for those assessing the stock, considering both the strengths and elevated valuation metrics.
Company and Industry Overview
Company Basics
Price Performance
Company Size
Shareholding Pattern
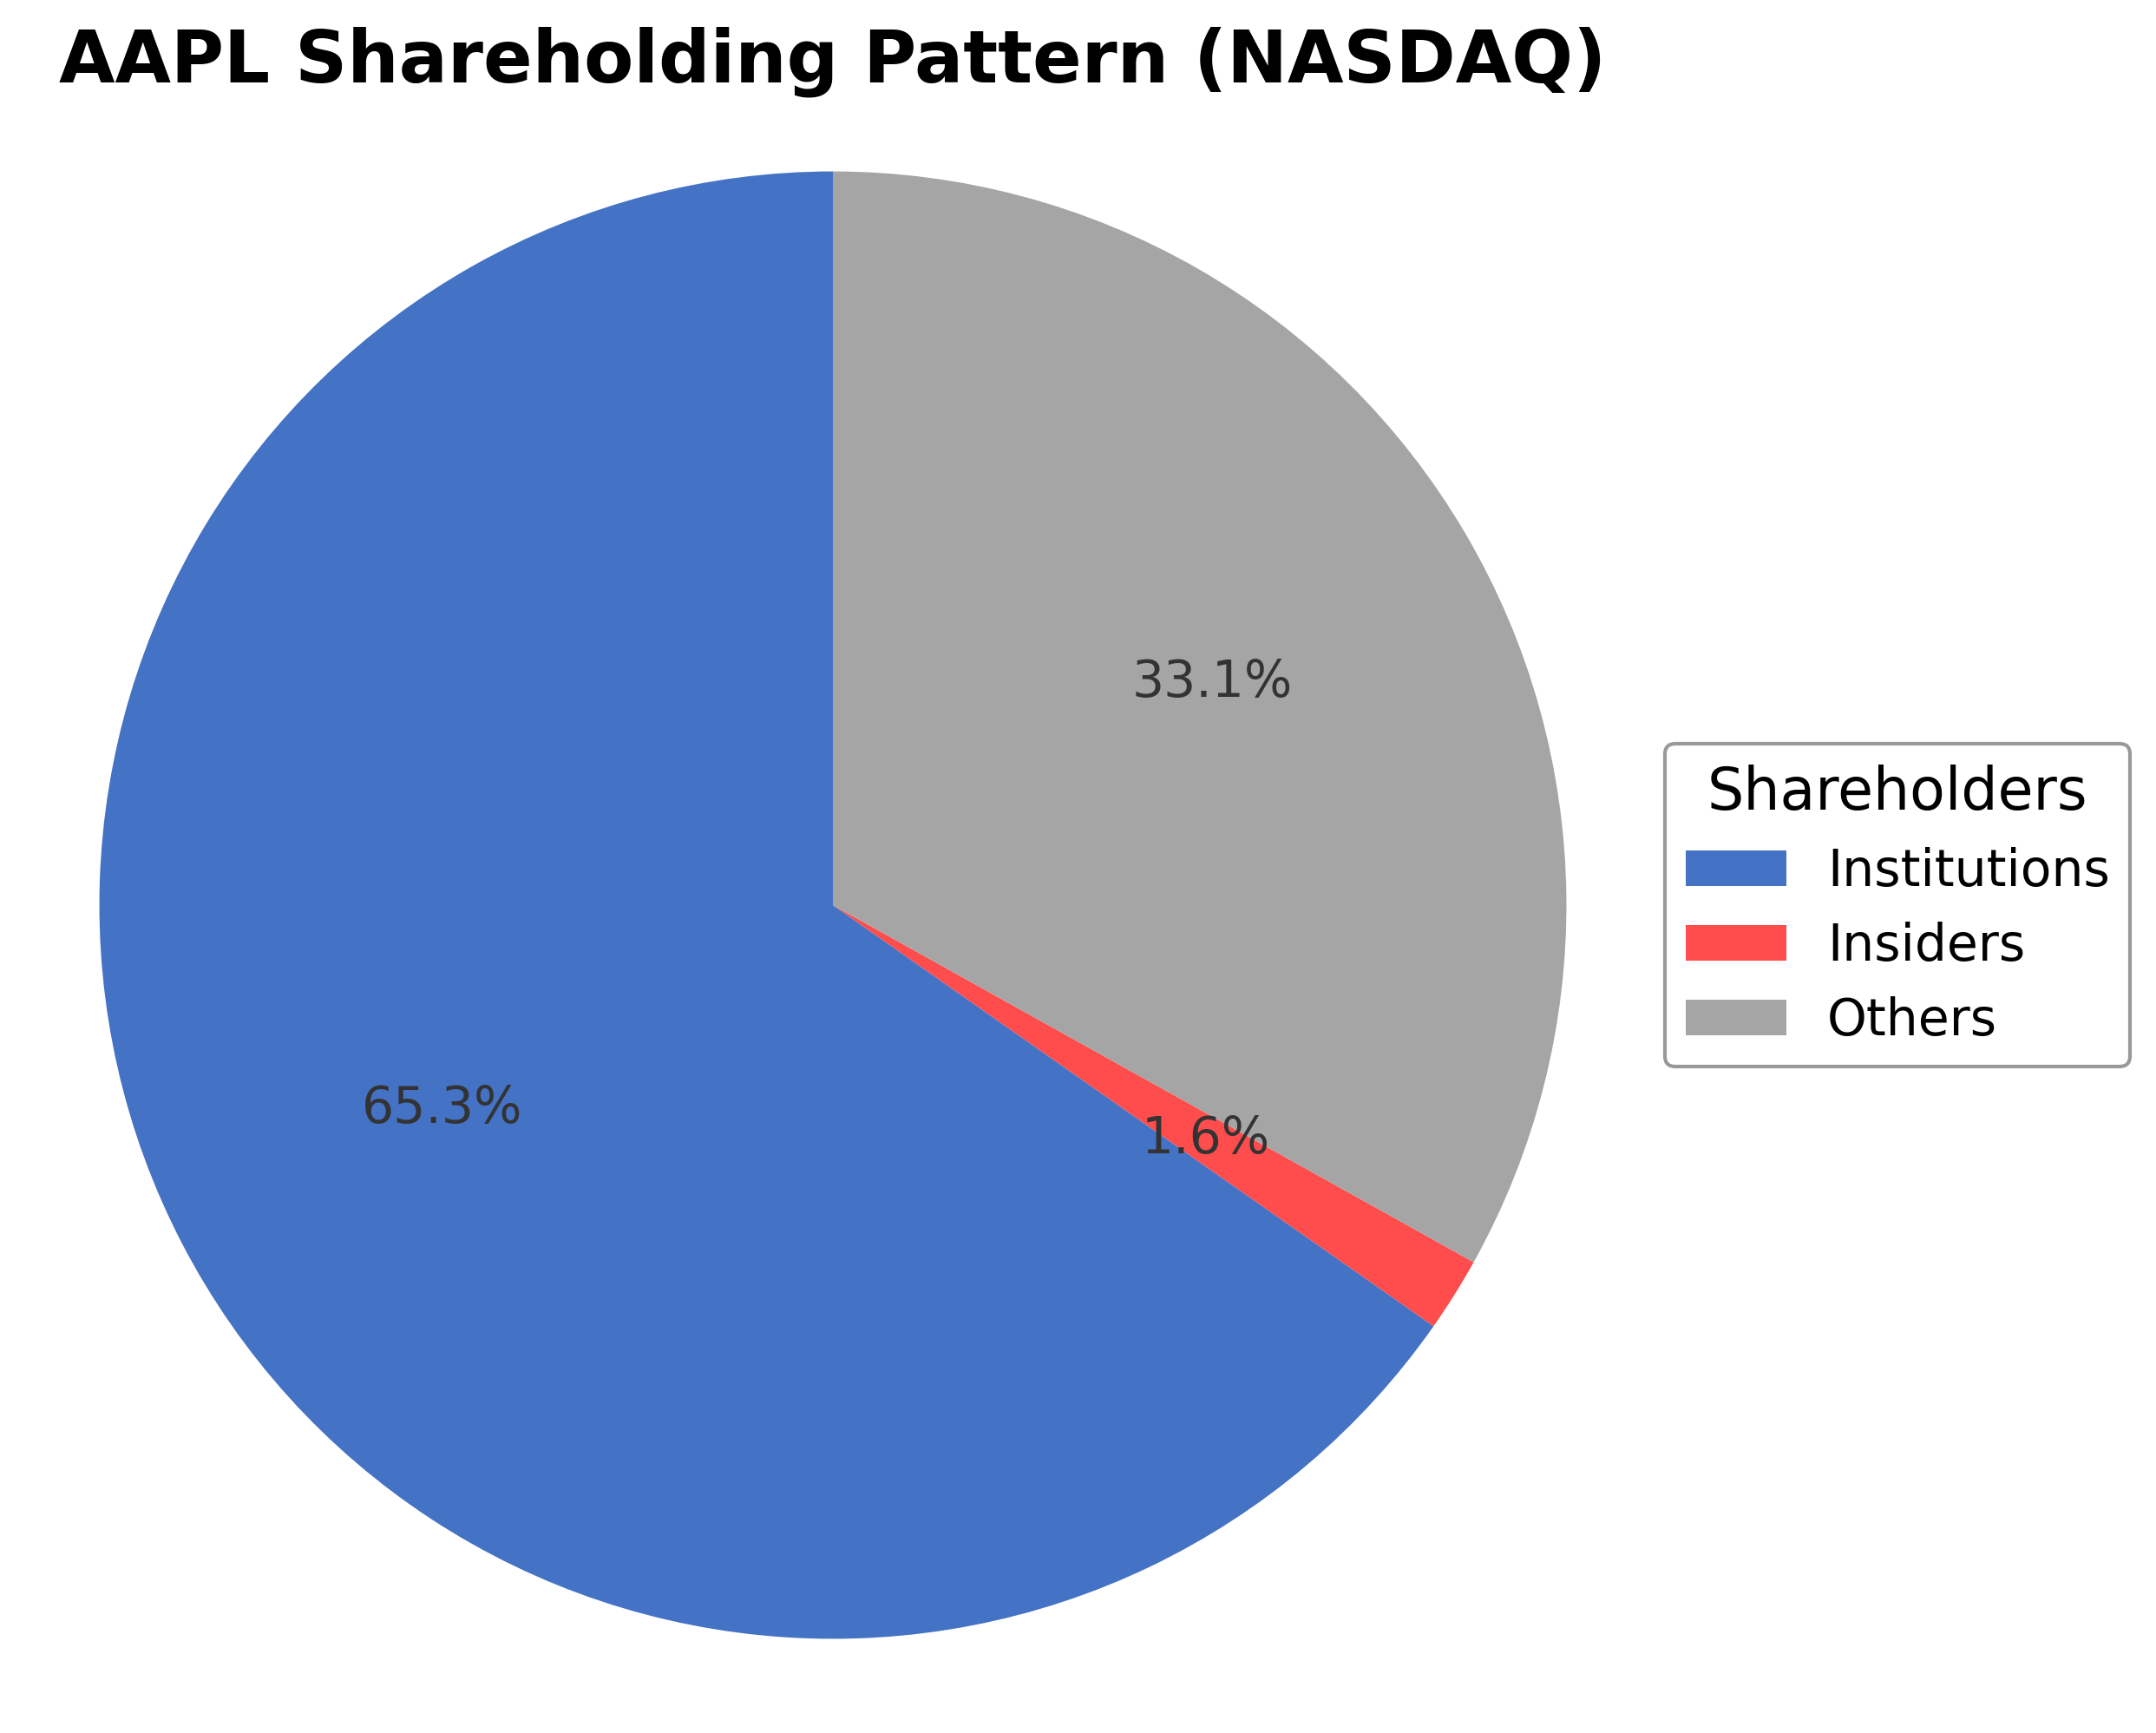
Apple Inc.'s ownership structure comprises approximately 1.64% insiders, 65.27% institutional investors, and 33.21% other shareholders including retail investors and employee stock plans. Over the past 12-24 months, institutional ownership has shown mixed activity with some funds reducing stakes while others have significantly increased holdings, such as AFG Fiduciary Services Limited Partnership's notable acquisition. This pattern suggests a dynamic institutional sentiment reflecting both confidence and caution. The substantial institutional presence supports governance stability and strategic direction, while the diverse shareholder base underpins broad market engagement. The current ownership structure positions Apple to leverage institutional support for future corporate actions while balancing market expectations.
Sector and Industry Analysis
Apple Inc. (AAPL) operates primarily within the Technology sector, specifically in the Hardware industry, which encompasses consumer electronics, computing devices, and related software ecosystems. The global technology hardware market is substantial, valued in the trillions of USD, driven by continuous innovation in smartphones, personal computing, wearables, and semiconductor components. Apple is a dominant player, with its iPhone product line accounting for the majority of its revenue, complemented by Mac computers, iPads, Apple Watch, and an expanding services ecosystem including software, streaming, and subscription bundles. The sector’s growth trajectory remains robust, fueled by increasing digitalization, rising consumer demand for connected devices, and the integration of hardware with proprietary software and services.
Industry trends reveal a significant shift toward ecosystem-centric product strategies, where hardware serves as a gateway to software and services, enhancing customer lock-in and recurring revenue streams. Apple exemplifies this with its tightly integrated iOS platform and proprietary silicon chips designed in-house, leveraging partnerships with key manufacturers like TSMC and Foxconn for production. Emerging opportunities include augmented reality (AR), artificial intelligence (AI)-enabled devices, and health-related wearables, all of which Apple is actively developing. Consumer behavior increasingly favors premium, high-quality devices with seamless interoperability, driving demand for innovation in design, performance, and privacy features.
The regulatory environment for the technology hardware industry is complex and evolving, encompassing data privacy laws (e.g., GDPR, CCPA), antitrust scrutiny, and export controls on semiconductor technologies. Compliance with environmental regulations related to electronic waste and carbon emissions is also critical. Apple faces ongoing regulatory challenges globally, including investigations into App Store practices and supply chain labor standards. Policy shifts affecting trade tariffs, intellectual property rights, and cybersecurity standards can materially impact operational costs and market access, necessitating proactive risk management and adaptive compliance frameworks.
Competitive dynamics in the hardware industry are characterized by high capital intensity, significant R&D investment, and strong network effects from software ecosystems. Barriers to entry are substantial due to the need for advanced manufacturing capabilities, brand equity, and extensive distribution networks. Apple’s competitive positioning is fortified by its brand loyalty, vertical integration of hardware and software, and a large installed base generating recurring service revenues. The market structure is oligopolistic, with a few major players such as Samsung, Microsoft, and Google competing across overlapping product categories. Innovation pace, supply chain efficiency, and ecosystem expansion remain critical factors determining market leadership and profitability within this sector.
Note: Analysis synthesized from industry research, market reports, and regulatory filings. Information is subject to change based on market conditions.
Illustrative Scenario Analysis
DCF Assumptions:
Method: Two-Stage EPS-Priority Model
Financials
Peer Analysis
| Company Name | Market Cap | P/E Ratio | P/B Ratio | EV/EBITDA | Price to CFO |
|---|---|---|---|---|---|
| Apple Inc. | $3.64T | 31.51 | 41.51 | 24.15 | 26.91 |
| Sony Group Corporation - Sponsored American Depositary Receipt | $120.12B | 15.68 | 2.38 | 0.02 | 9.34 |
Comparison Analysis: Apple Inc. significantly outscales its regional peer Sony Group Corporation in market capitalization, reflecting its dominant market position. Apple's valuation multiples such as P/E ratio (31.51) and price-to-book ratio (41.51) are substantially higher than Sony's (15.68 and 2.38 respectively), indicating market expectations of stronger growth or premium brand value. Return on equity for Apple (1.52%) also exceeds Sony's 0.15%, suggesting relatively higher capital efficiency. However, Apple's elevated EV/EBITDA and price to CFO ratios highlight a premium valuation that contrasts with more conservative multiples seen in peers.
Financial Metrics Comparison with Peers
Financial Statements
Comprehensive financial data including income, balance sheet, and cash flow metrics
Income Statement
| fiscal_date | 2025-09-30 | 2024-09-30 | 2023-09-30 | 2022-09-30 | 2021-09-30 |
|---|---|---|---|---|---|
| Sales | 416.16B | 391.04B | 383.29B | 394.33B | 365.82B |
| Cost Of Goods | 220.96B | 210.35B | 214.14B | 223.55B | 212.98B |
| Gross Profit | 195.20B | 180.68B | 169.15B | 170.78B | 152.84B |
| Operating Expense Research And Development | 34.55B | 31.37B | 29.91B | 26.25B | 21.91B |
| Operating Expense Selling General And Administrative | 27.60B | 26.10B | 24.93B | 25.09B | 21.97B |
| Operating Income | 133.05B | 123.22B | 114.30B | 119.44B | 108.95B |
| Other Income Expense | -321.00M | 269.00M | -565.00M | -334.00M | 60.00M |
| Pretax Income | 132.73B | 123.48B | 113.74B | 119.10B | 109.21B |
| Income Tax | 20.72B | 29.75B | 16.74B | 19.30B | 14.53B |
| Net Income | 112.01B | 93.74B | 97.00B | 99.80B | 94.68B |
| Eps Basic | 7.49 | 6.11 | 6.16 | 6.15 | 5.67 |
| Eps Diluted | 7.46 | 6.08 | 6.13 | 6.11 | 5.61 |
| Basic Shares Outstanding | 14.95B | 15.34B | 15.74B | 16.22B | 16.70B |
| Diluted Shares Outstanding | 14.95B | 15.34B | 15.74B | 16.22B | 16.70B |
| Ebit | 133.05B | 123.22B | 114.30B | 119.44B | 111.85B |
| Ebitda | 144.75B | 134.66B | 125.82B | 130.54B | 123.14B |
| Net Income Continuous Operations | 112.01B | 93.74B | 97.00B | 99.80B | 94.68B |
| Non Operating Interest Income | N/A | N/A | 3.75B | 2.83B | 2.84B |
| Non Operating Interest Expense | N/A | N/A | 3.93B | 2.93B | 2.65B |
Data provided by Twelve Data
Balance Sheet
| fiscal_date | 2025-09-30 | 2024-09-30 | 2023-09-30 | 2022-09-30 | 2021-09-30 |
|---|---|---|---|---|---|
| Cash And Cash Equivalents | 35.93B | 29.94B | 29.96B | 23.65B | 34.94B |
| Accounts Receivable | 39.78B | 33.41B | 29.51B | 28.18B | 26.28B |
| Total Assets | 359.24B | 364.98B | 352.58B | 352.75B | 351.00B |
| Total Liabilities | 285.51B | 308.03B | 290.44B | 302.08B | 287.91B |
| Long Term Debt | 78.33B | 85.75B | 95.28B | 109.71B | 119.38B |
| Shareholders Equity | 73.73B | 56.95B | 62.15B | 50.67B | 63.09B |
Data provided by Twelve Data
Cash Flow Statement
| fiscal_date | 2025-09-30 | 2024-09-30 | 2023-09-30 | 2022-09-30 | 2021-09-30 |
|---|---|---|---|---|---|
| Operating Activities Net Income | 112.01B | 93.74B | 97.00B | 99.80B | 94.68B |
| Operating Activities Depreciation | 11.70B | 11.45B | 11.52B | 11.10B | 11.28B |
| Operating Activities Stock Based Compensation | 12.86B | 11.69B | 10.83B | 9.04B | 7.91B |
| Operating Activities Other Non Cash Items | -89.00M | -2.27B | -2.23B | 1.01B | -4.92B |
| Operating Activities Accounts Receivable | -7.03B | -5.14B | -417.00M | -9.34B | -14.03B |
| Operating Activities Accounts Payable | 902.00M | 6.02B | -1.89B | 9.45B | 12.33B |
| Operating Activities Other Assets Liabilities | -18.87B | 2.77B | -4.27B | 1.57B | -1.53B |
| Operating Activities Operating Cash Flow | 111.48B | 118.25B | 110.54B | 123.52B | 100.94B |
| Investing Activities Capital Expenditures | -12.71B | -9.45B | -10.96B | -10.71B | -11.09B |
| Investing Activities Purchase Of Investments | -24.41B | -48.66B | -29.51B | -76.92B | -109.56B |
| Investing Activities Sale Of Investments | 53.80B | 62.35B | 45.51B | 67.36B | 106.48B |
| Investing Activities Other Investing Activity | -1.48B | -1.31B | -1.34B | -2.09B | -385.00M |
| Investing Activities Investing Cash Flow | 15.20B | 2.94B | 3.71B | -22.66B | -14.58B |
| Financing Activities Long Term Debt Issuance | 4.48B | 0.00 | 5.23B | 5.46B | 20.39B |
| Financing Activities Long Term Debt Payments | -10.93B | -9.96B | -11.15B | -9.54B | -8.75B |
| Financing Activities Short Term Debt Issuance | -2.03B | 3.96B | -3.98B | 3.96B | 1.02B |
| Financing Activities Common Stock Repurchase | -90.71B | -94.95B | -77.55B | -89.40B | -85.97B |
| Financing Activities Common Dividends | -15.42B | -15.23B | -15.03B | -14.84B | -14.47B |
| Financing Activities Other Financing Charges | -6.07B | -5.80B | -6.01B | -6.38B | -5.58B |
| Financing Activities Financing Cash Flow | -120.69B | -121.98B | -108.49B | -110.75B | -92.25B |
| End Cash Position | 35.93B | 29.94B | 30.74B | 24.98B | 35.93B |
| Income Tax Paid | 43.37B | 26.10B | 18.68B | 19.57B | 25.39B |
| Free Cash Flow | 98.77B | 108.81B | 99.58B | 111.44B | 92.95B |
| Interest Paid | N/A | N/A | 3.80B | 2.87B | 2.69B |
| Operating Activities Deferred Taxes | N/A | N/A | N/A | 895.00M | -4.77B |
| Investing Activities Net Acquisitions | N/A | N/A | N/A | -306.00M | -33.00M |
| Financing Activities Common Stock Issuance | N/A | N/A | N/A | N/A | 1.10B |
Data provided by Twelve Data
Technical Analysis
Key Insights
- Apple's current trend is upward with price action maintaining above both the 50-day ($261.64) and 200-day ($246.36) moving averages, indicating sustained bullish momentum.
- Key support levels are identified near $246.36 (200-day MA) and $169.21 (52-week low), while resistance is observed around the 52-week high of $288.62.
- The stock price is positioned above the 10-day, 50-day, and 200-day moving averages, reflecting short- to long-term strength in price trends.
- Momentum indicators show moderate strength with RSI near neutral levels, MACD indicating positive crossover signals, and stochastic oscillators suggesting potential continuation of upward momentum.
- Multi-timeframe analysis across daily, weekly, and monthly charts confirms consistent upward trends with no significant reversal signals.
- Current technical setup suggests scenarios favoring continuation of the uptrend, though proximity to resistance levels warrants monitoring for potential consolidation or pullback.
Trending News
1. Headline: Apple Inc. $AAPL Shares Sold by Clark Financial Services Group Inc. BD
Summary: Clark Financial Services Group Inc. BD lowered its position in Apple Inc. (NASDAQ:AAPL - Free Report) by 7.7% during the fourth quarter, according to its most recent Form 13F filing with the Securities and Exchange Commission (SEC). The institutional investor owned 29,959 shares of the iPhone mak
Sentiment: negative
2. Headline: Apple Inc. $AAPL Shares Sold by Chemistry Wealth Management LLC
Summary: Chemistry Wealth Management LLC trimmed its stake in shares of Apple Inc. (NASDAQ:AAPL - Free Report) by 5.7% during the 4th quarter, according to the company in its most recent Form 13F filing with the Securities & Exchange Commission. The institutional investor owned 92,146 shares of the iPh
Sentiment: negative
3. Headline: AFG Fiduciary Services Limited Partnership Acquires 4,636,438 Shares of Apple Inc. $AAPL
Summary: AFG Fiduciary Services Limited Partnership boosted its holdings in Apple Inc. (NASDAQ:AAPL - Free Report) by 79,636.5% in the fourth quarter, according to its most recent Form 13F filing with the SEC. The fund owned 4,642,260 shares of the iPhone maker's stock after purchasing an additional 4,636,4
Sentiment: positive
4. Headline: Commons Capital LLC Boosts Apple Inc. Stake by 10.3% - Cupertino Today
Summary: Commons Capital LLC, an investment management firm, increased its stake in Apple Inc. (NASDAQ:AAPL) by 10.3% in the fourth quarter of 2025, according to a recent SEC filing. The firm now owns 34,208 shares of the iPhone maker's stock, valued at approximately $9.3 million.
Sentiment: positive
5. Headline: With the MacBook Neo, Apple Made the Perfect AI Computer
Summary: Inc. PremiumMoneyCoterie Turned a Dirty Product Into a Premium Brand, Then Scored a Major Sale · LeadMove Over, Unlimited PTO: The New Must-Have AI Perk Taking Over Silicon Valley · GrowShe Lost $75,000 on a Startup—Then Built Mrs. Meyer’s Into a Category-Defining Brand · MoneyIf These 3 Big IPOs Happen, No One Else May Have a Shot ... Apple...
Sentiment: positive
6. Headline: Apple Inc. $AAPL Shares Sold by Neville Rodie & Shaw Inc.
Summary: Neville Rodie & Shaw Inc. decreased its position in shares of Apple Inc. (NASDAQ:AAPL - Free Report) by 1.6% during the 4th quarter, according to its most recent filing with the Securities and Exchange Commission (SEC). The fund owned 453,983 shares of the iPhone maker's stock after selling 7,197 s
Sentiment: negative
7. Headline: 8,222 Shares in Apple Inc. $AAPL Acquired by Holos Integrated Wealth LLC
Summary: Holos Integrated Wealth LLC bought a new position in shares of Apple Inc. (NASDAQ:AAPL - Free Report) in the fourth quarter, according to the company in its most recent disclosure with the Securities & Exchange Commission. The institutional investor bought 8,222 shares of the iPhone maker's st
Sentiment: neutral
8. Headline: Apple Inc. $AAPL Shares Purchased by GoalVest Advisory LLC
Summary: GoalVest Advisory LLC boosted its holdings in shares of Apple Inc. (NASDAQ:AAPL - Free Report) by 24.1% during the 4th quarter, according to its most recent 13F filing with the SEC. The fund owned 13,486 shares of the iPhone maker's stock after purchasing an additional 2,618 shares during the perio
Sentiment: positive
9. Headline: Apple Stock Is Doing Something It Hasn't Done Since 2022. Should You Buy or Run? | The Motley Fool
Summary: Apple ended the quarter with $45.3 billion in cash and cash equivalents, up from $30.3 billion a year ago. The company reported $54 billion in operating cash flow, and returned nearly $32 billion to shareholders through dividends and stock repurchases. It issued guidance for the second quarter for revenue to continue to grow at a rate of 13% to 16%. The company is continuing to roll out new products, including ...
Sentiment: positive
10. Headline: Halide co-founder is suing former partner Sebastiaan de With for taking source code to Apple
Summary: Sebastiaan de With was allegedly fired for financial misconduct before joining Apple. ... Halide running on an iPhone. Photo: Allison Johnson / The Verge ... See All by Terrence O'Brien is the Verge’s weekend editor. He has over 18 years of experience, including 10 years as managing editor ...
Sentiment: neutral
Powered by Brave
Recent Updates
News Summary
Recent news highlights a mixed but generally constructive environment for Apple Inc. Key themes include cautious institutional share sales alongside significant stake increases by other funds, reflecting varied market sentiment. Strategic developments focus on AI integration, exemplified by the upcoming Worldwide Developers Conference and the launch of AI-enhanced products like the MacBook Neo. Regulatory and geopolitical considerations are evident in CEO Tim Cook's remarks on China partnerships amid external pressures. Advertising introduction in Apple Maps and sector weight ratings underscore evolving revenue streams and market positioning. Overall, these developments suggest ongoing innovation and adaptation within a complex global context.
News Sentiment
Sentiment analysis reveals a balance between positive developments such as institutional accumulation and product innovation, and negative signals from some institutional selling. Neutral sentiments dominate regulatory and geopolitical news, indicating stable but watchful market perception. Positive news on AI and strategic partnerships may support confidence, while cautious positioning by some investors reflects awareness of valuation and competitive risks.
Analytical Overview
Analysis Summary
Valuation Metrics: Apple's trailing P/E ratio of 31.51 and forward P/E of 26.71 exceed the consumer electronics industry average, indicating a premium valuation supported by strong brand and growth expectations.
Growth Trajectory: The company exhibits a robust growth trajectory with quarterly revenue growth of 15.7% and quarterly earnings growth of 15.9%, supported by strong operating and free cash flow generation.
Financial Health: Apple maintains a solid financial position with total cash of approximately $66.9 billion against total debt of $90.5 billion, and a current ratio near 0.97, reflecting balanced liquidity and leverage management.
Sector Challenges Opportunities: The consumer electronics sector faces rapid technological change and competitive pressures, while opportunities arise from AI integration, services expansion, and emerging markets.
Market Positioning: Apple's strong market positioning is reinforced by its integrated ecosystem, brand loyalty, and innovation pipeline, which provide competitive advantages in a dynamic technology landscape.
Investment Conclusion
Supporting Factors: Robust revenue and earnings growth supported by diversified product and services portfolio.
Risk Factors: High valuation multiples may limit upside potential relative to market expectations.
SWOT Analysis
Strengths
- Market leadership with a strong global brand and loyal customer base.
- Diversified product portfolio integrating hardware, software, and services.
- Robust financial position with significant cash reserves and strong cash flow.
- Continuous innovation driving new product development and ecosystem expansion.
Weaknesses
- High valuation metrics may constrain market expectations and investor sentiment.
- Dependence on flagship products like the iPhone for a large portion of revenue.
- Current ratio below 1 indicates tight short-term liquidity management.
- Relatively low return on equity compared to historical levels.
Opportunities
- Expansion in AI and machine learning technologies across product lines.
- Growth potential in services segment including subscriptions and digital content.
- Emerging markets offering new customer acquisition avenues.
- Strategic partnerships and acquisitions to enhance technological capabilities.
Threats
- Intense competition in consumer electronics and technology sectors.
- Geopolitical tensions affecting supply chains and market access.
- Regulatory scrutiny in key markets including data privacy and antitrust concerns.
- Rapid technological changes requiring sustained innovation investment.
Company Description
Apple Inc. is a leading technology company renowned for designing, manufacturing, and marketing innovative hardware and software products for consumers and businesses worldwide. Its flagship product, the iPhone, accounts for the majority of sales, serving as the central hub of an expansive ecosystem that includes Mac computers, iPad tablets, Apple Watch wearables, and accessories like AirPods. Apple Inc. also offers a suite of services such as the App Store, Apple Music, iCloud, Apple TV+, and Apple Fitness+, providing digital content, cloud storage, and subscription-based platforms. Operating in the consumer electronics industry within the technology sector, the company employs approximately 166,000 people and maintains a broad global presence through online stores, retail outlets, and partnerships with carriers and resellers. With a substantial market capitalization reflecting its scale, Apple Inc. plays a pivotal role in shaping consumer technology trends, emphasizing seamless integration across devices and services to enhance user experience and productivity.