
Apple Inc (AAPL)
Stock Analysis Report
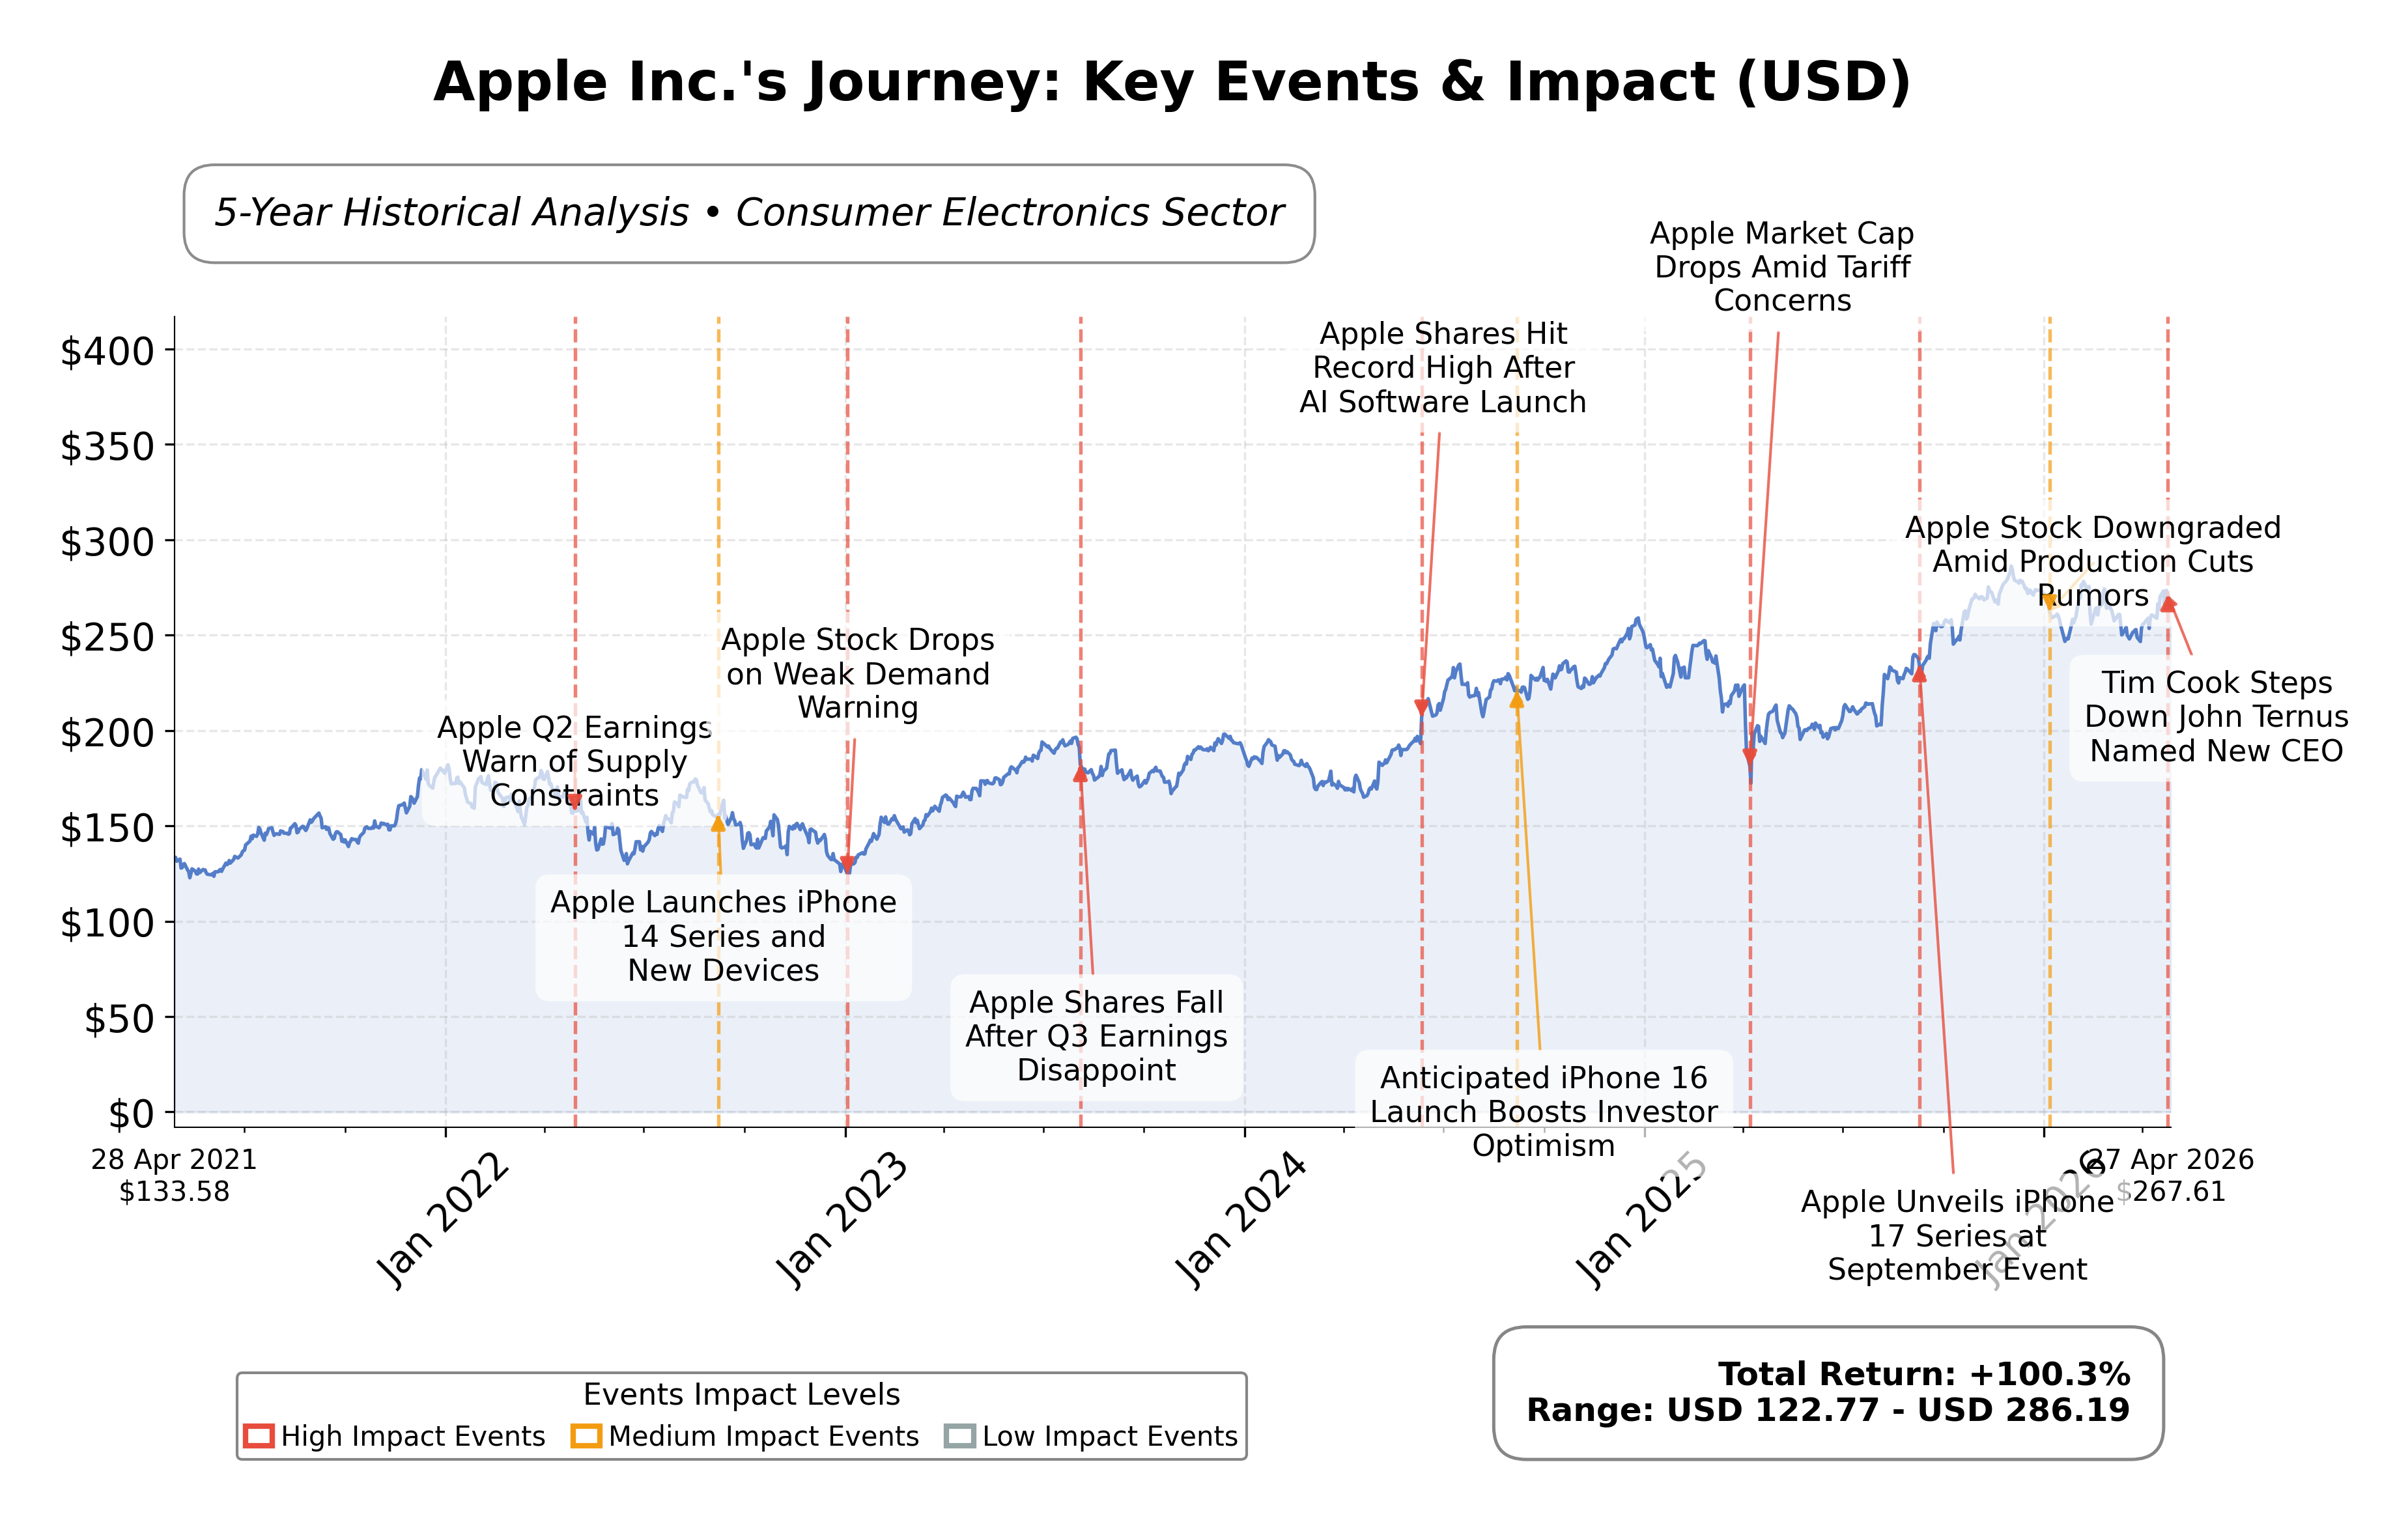
Stock Journey
Key Positives and Key Risks
Pros
- Revenue growth of 15.7% year-over-year demonstrates strong top-line expansion.
- Operating cash flow of $135.5 billion indicates robust cash generation capacity.
- Market capitalization of approximately $3.98 trillion reflects significant scale and market leadership.
Cons
- High price-to-book ratio of 45.59 suggests the stock trades at a substantial premium.
- Current ratio of 0.974 indicates tight liquidity and potential short-term financial constraints.
- Insider selling of $421,850 by the CFO raises valuation and sentiment concerns.
Disclosure: This information is for general awareness and does not constitute investment advice
Report Summary
Apple Inc. is a leading technology company listed on the NASDAQ exchange under the symbol AAPL, operating within the technology sector, specifically in the consumer electronics industry. The company designs, manufactures, and markets a broad range of innovative hardware products including the iPhone, Mac computers, iPad tablets, Apple Watch, and accessories such as AirPods. Apple also offers a suite of digital services like the App Store, Apple Music, iCloud, and Apple TV+, which complement its hardware ecosystem. With a global presence and a workforce of approximately 166,000 employees, Apple maintains a strong market position through seamless integration of its devices and services.
Financially, Apple reported trailing twelve-month revenue of approximately $435.6 billion with a gross margin of 48.16%, operating margin of 35.37%, and net profit margin of 27.04%, indicating robust profitability. The company’s return on equity (ROE) stands at 1.52%, and return on assets (ROA) at 24.38%, reflecting efficient use of equity and assets to generate earnings. Operating cash flow for the trailing twelve months was $135.5 billion, with free cash flow at $106.3 billion, underscoring strong cash generation capabilities. Quarterly revenue growth was 15.7%, and earnings per share (EPS) diluted stood at $7.90, with quarterly earnings growth year-over-year at 15.9%.
Apple’s valuation metrics show a trailing price-to-earnings (P/E) ratio of 34.61 and a forward P/E of 29.17, with a price-to-book (P/B) ratio of 45.59 and an enterprise value to EBITDA (EV/EBITDA) of 26.41. The company’s market capitalization is approximately $3.98 trillion, positioning it among the largest global technology firms. The stock’s 52-week trading range is $193.25 to $288.62, with the current price at $270.30, indicating it trades near the upper end of its annual range, reflecting strong market confidence.
Apple’s strengths include its substantial cash reserves of $66.9 billion, manageable total debt of $90.5 billion, and a current ratio near parity at 0.974, which suggests solid liquidity. The company benefits from market leadership in consumer electronics and a diversified revenue base across products and services. Key risks involve competitive pressures from emerging AI technologies, regulatory scrutiny, and supply chain challenges. Recent strategic developments include leadership transition announcements and continued product innovation, while institutional ownership remains significant at 65.6%, indicating strong institutional confidence.
Technically, Apple’s stock is positioned above its 50-day and 200-day moving averages, suggesting an overall upward trend. Momentum indicators such as RSI and MACD reflect moderate strength without overextension. Multi-timeframe analysis shows consistent performance across daily, weekly, and monthly charts. Market scenarios indicate potential consolidation near current price levels with support around $260 and resistance near $288. Recent news highlights mixed sentiment, balancing positive earnings outlooks against leadership changes and competitive threats, suggesting a cautious but attentive stance toward the stock’s near-term movements.
Company and Industry Overview
Company Basics
Price Performance
Company Size
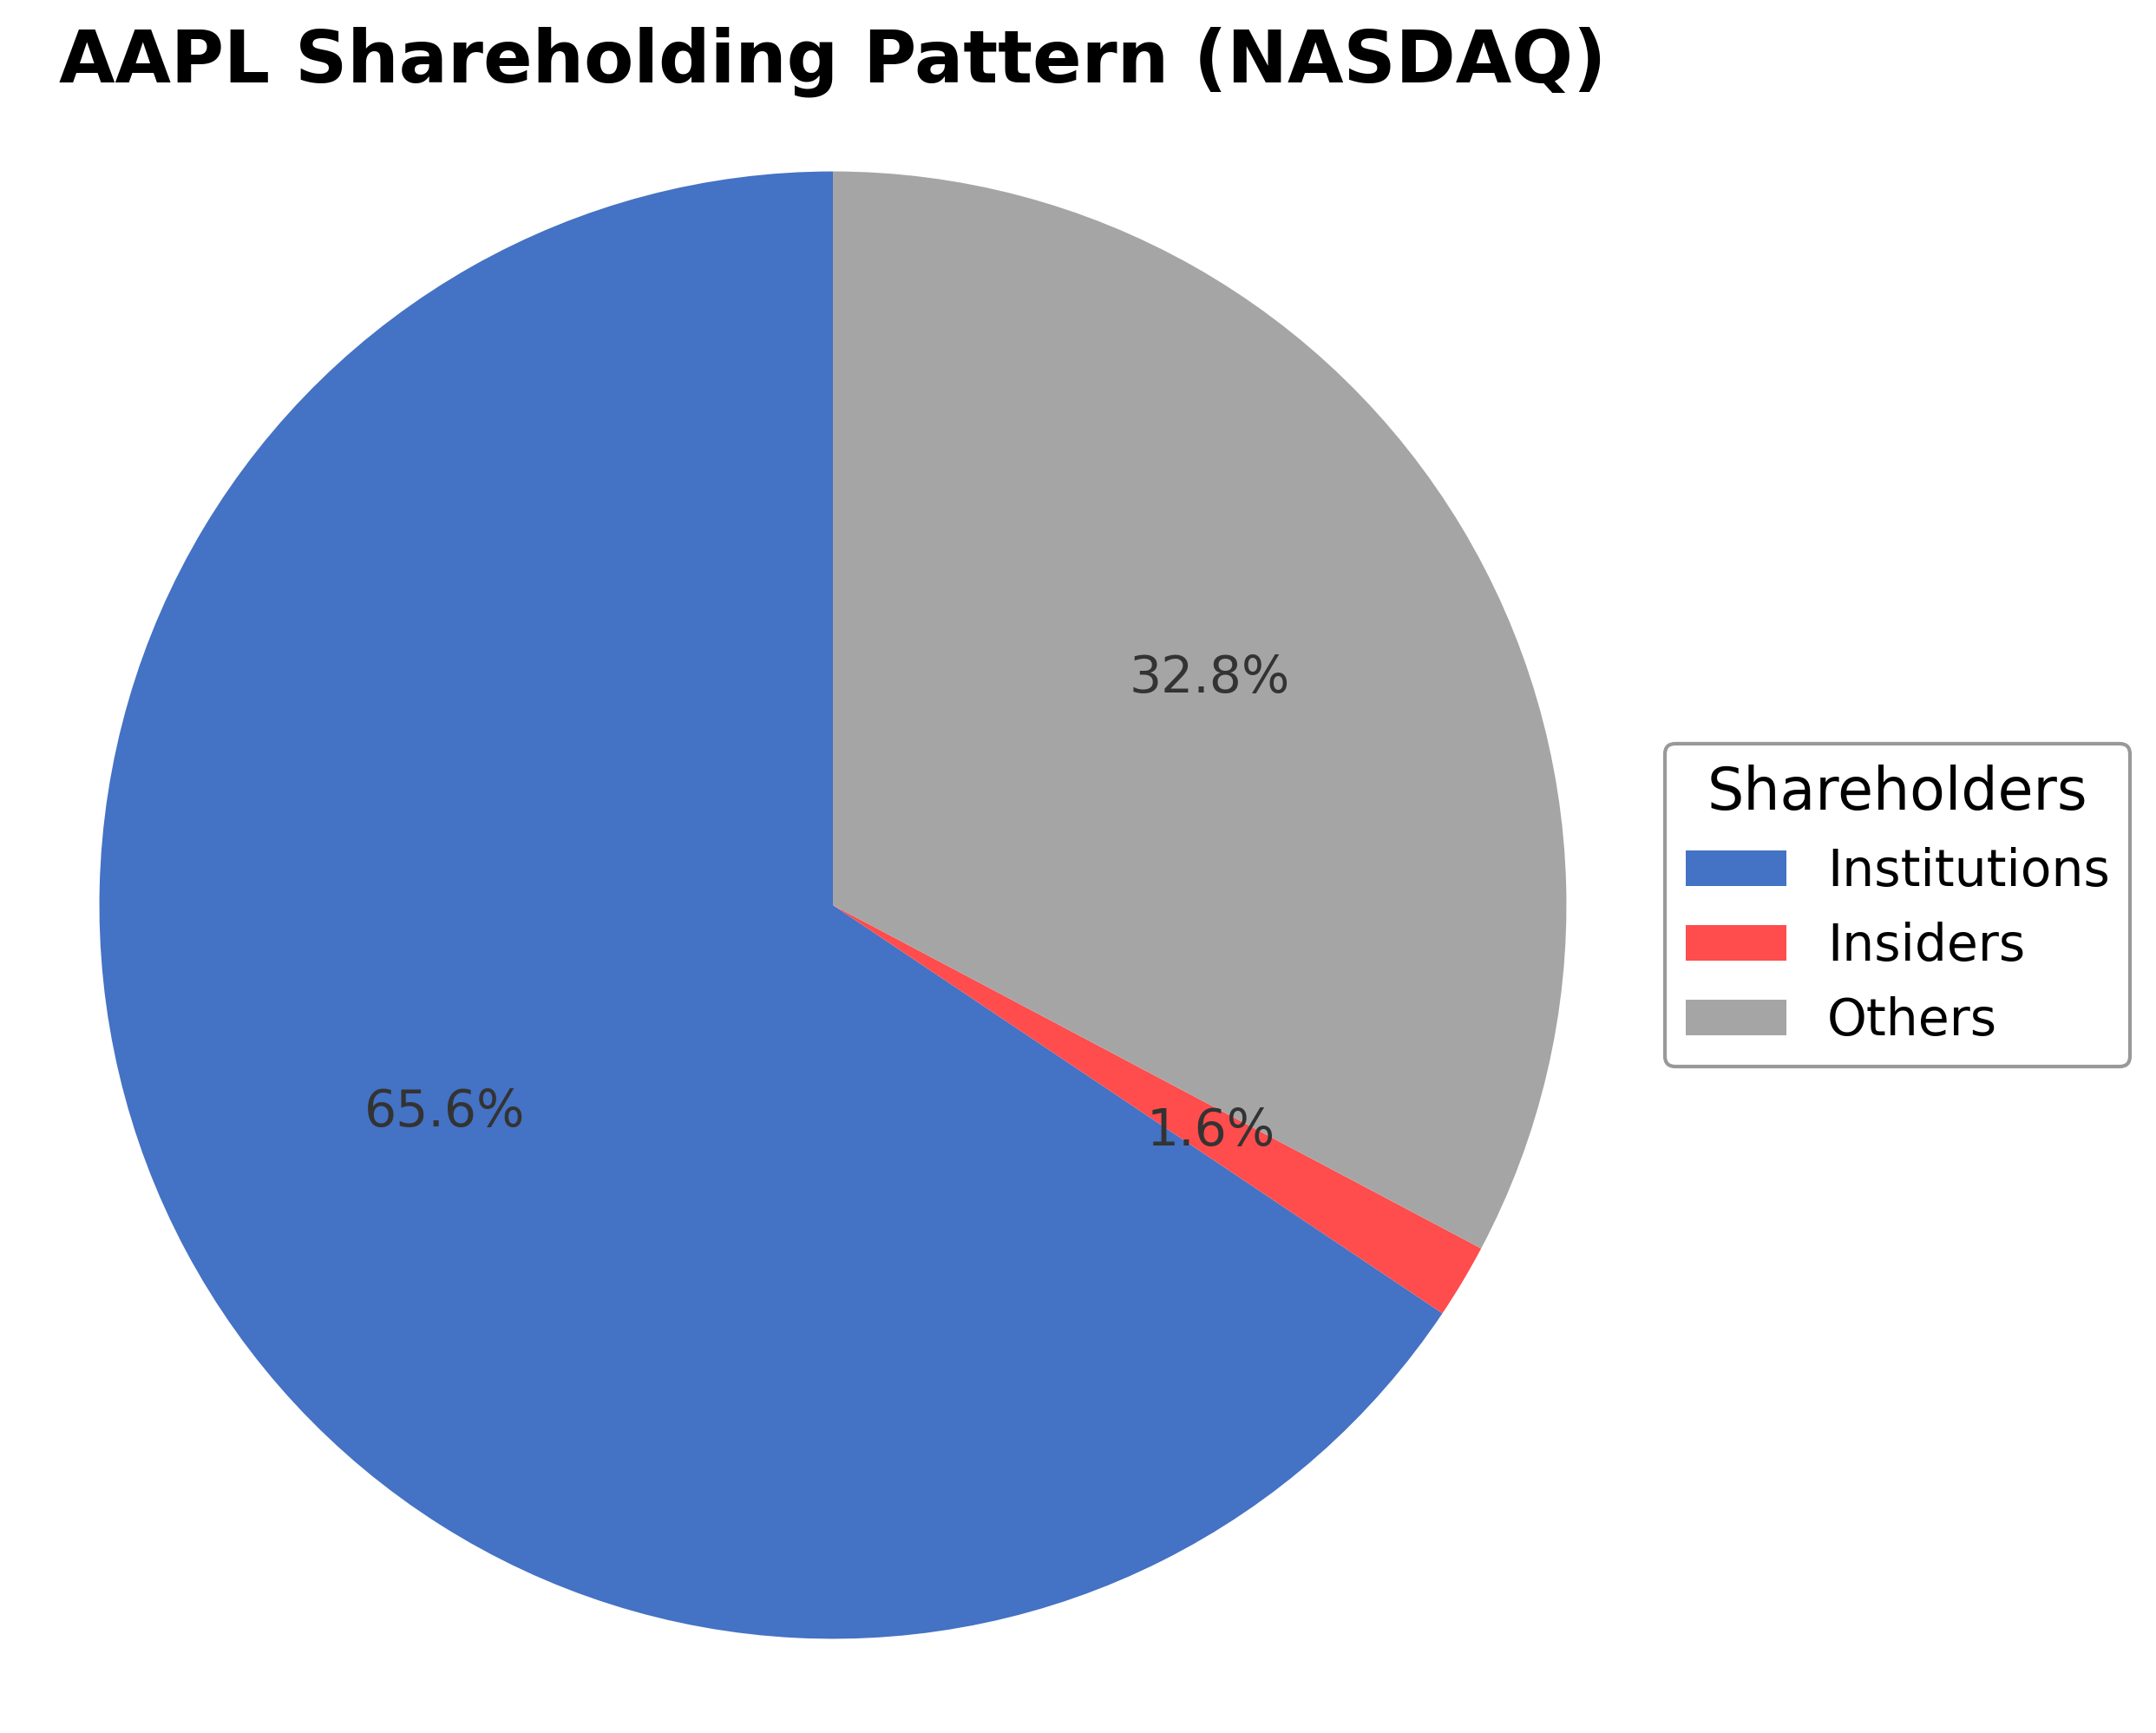
Shareholding Pattern
Sector and Industry Analysis
The consumer electronics and computer hardware sector is a large and rapidly growing market, valued at approximately $674 billion in 2023 and projected to reach over $914 billion by 2028, reflecting a compound annual growth rate of around 6.5%. Growth is driven by expanding personal computing demand, internet infrastructure development, and increasing data center investments globally. Major players include Apple, NVIDIA, and other technology firms that dominate hardware design, manufacturing, and integrated software ecosystems.
Key industry trends include the integration of artificial intelligence and machine learning into hardware design, enabling advanced applications such as autonomous vehicles and robotics. The rise of the Internet of Things (IoT) further fuels demand for interconnected devices with enhanced security and interoperability. Competitive dynamics favor companies like Apple that control both hardware and software, creating high barriers to entry through proprietary silicon and ecosystem lock-in, while emerging technologies like quantum computing promise to reshape hardware capabilities and market opportunities.
Regulatory scrutiny is intensifying, particularly around digital marketplaces and app store commissions, exemplified by global antitrust discussions targeting Apple's "Apple Tax" on digital sales. Privacy regulations also influence product development, with firms emphasizing on-device data processing to comply with data protection laws. Looking ahead, regulatory frameworks will likely continue to shape competitive practices and innovation incentives within the sector, balancing market power concerns with the need to foster technological advancement.
Note: Analysis synthesized from industry research, market reports, and regulatory filings. Information is subject to change based on market conditions.
Financial Ratios Dashboard
Illustrative Scenario Analysis
DCF Assumptions:
Method: Two-Stage EPS-Priority Model
Financials
Peer Analysis
| Company Name | Market Cap | P/E Ratio | P/B Ratio | EV/EBITDA | Price to CFO |
|---|---|---|---|---|---|
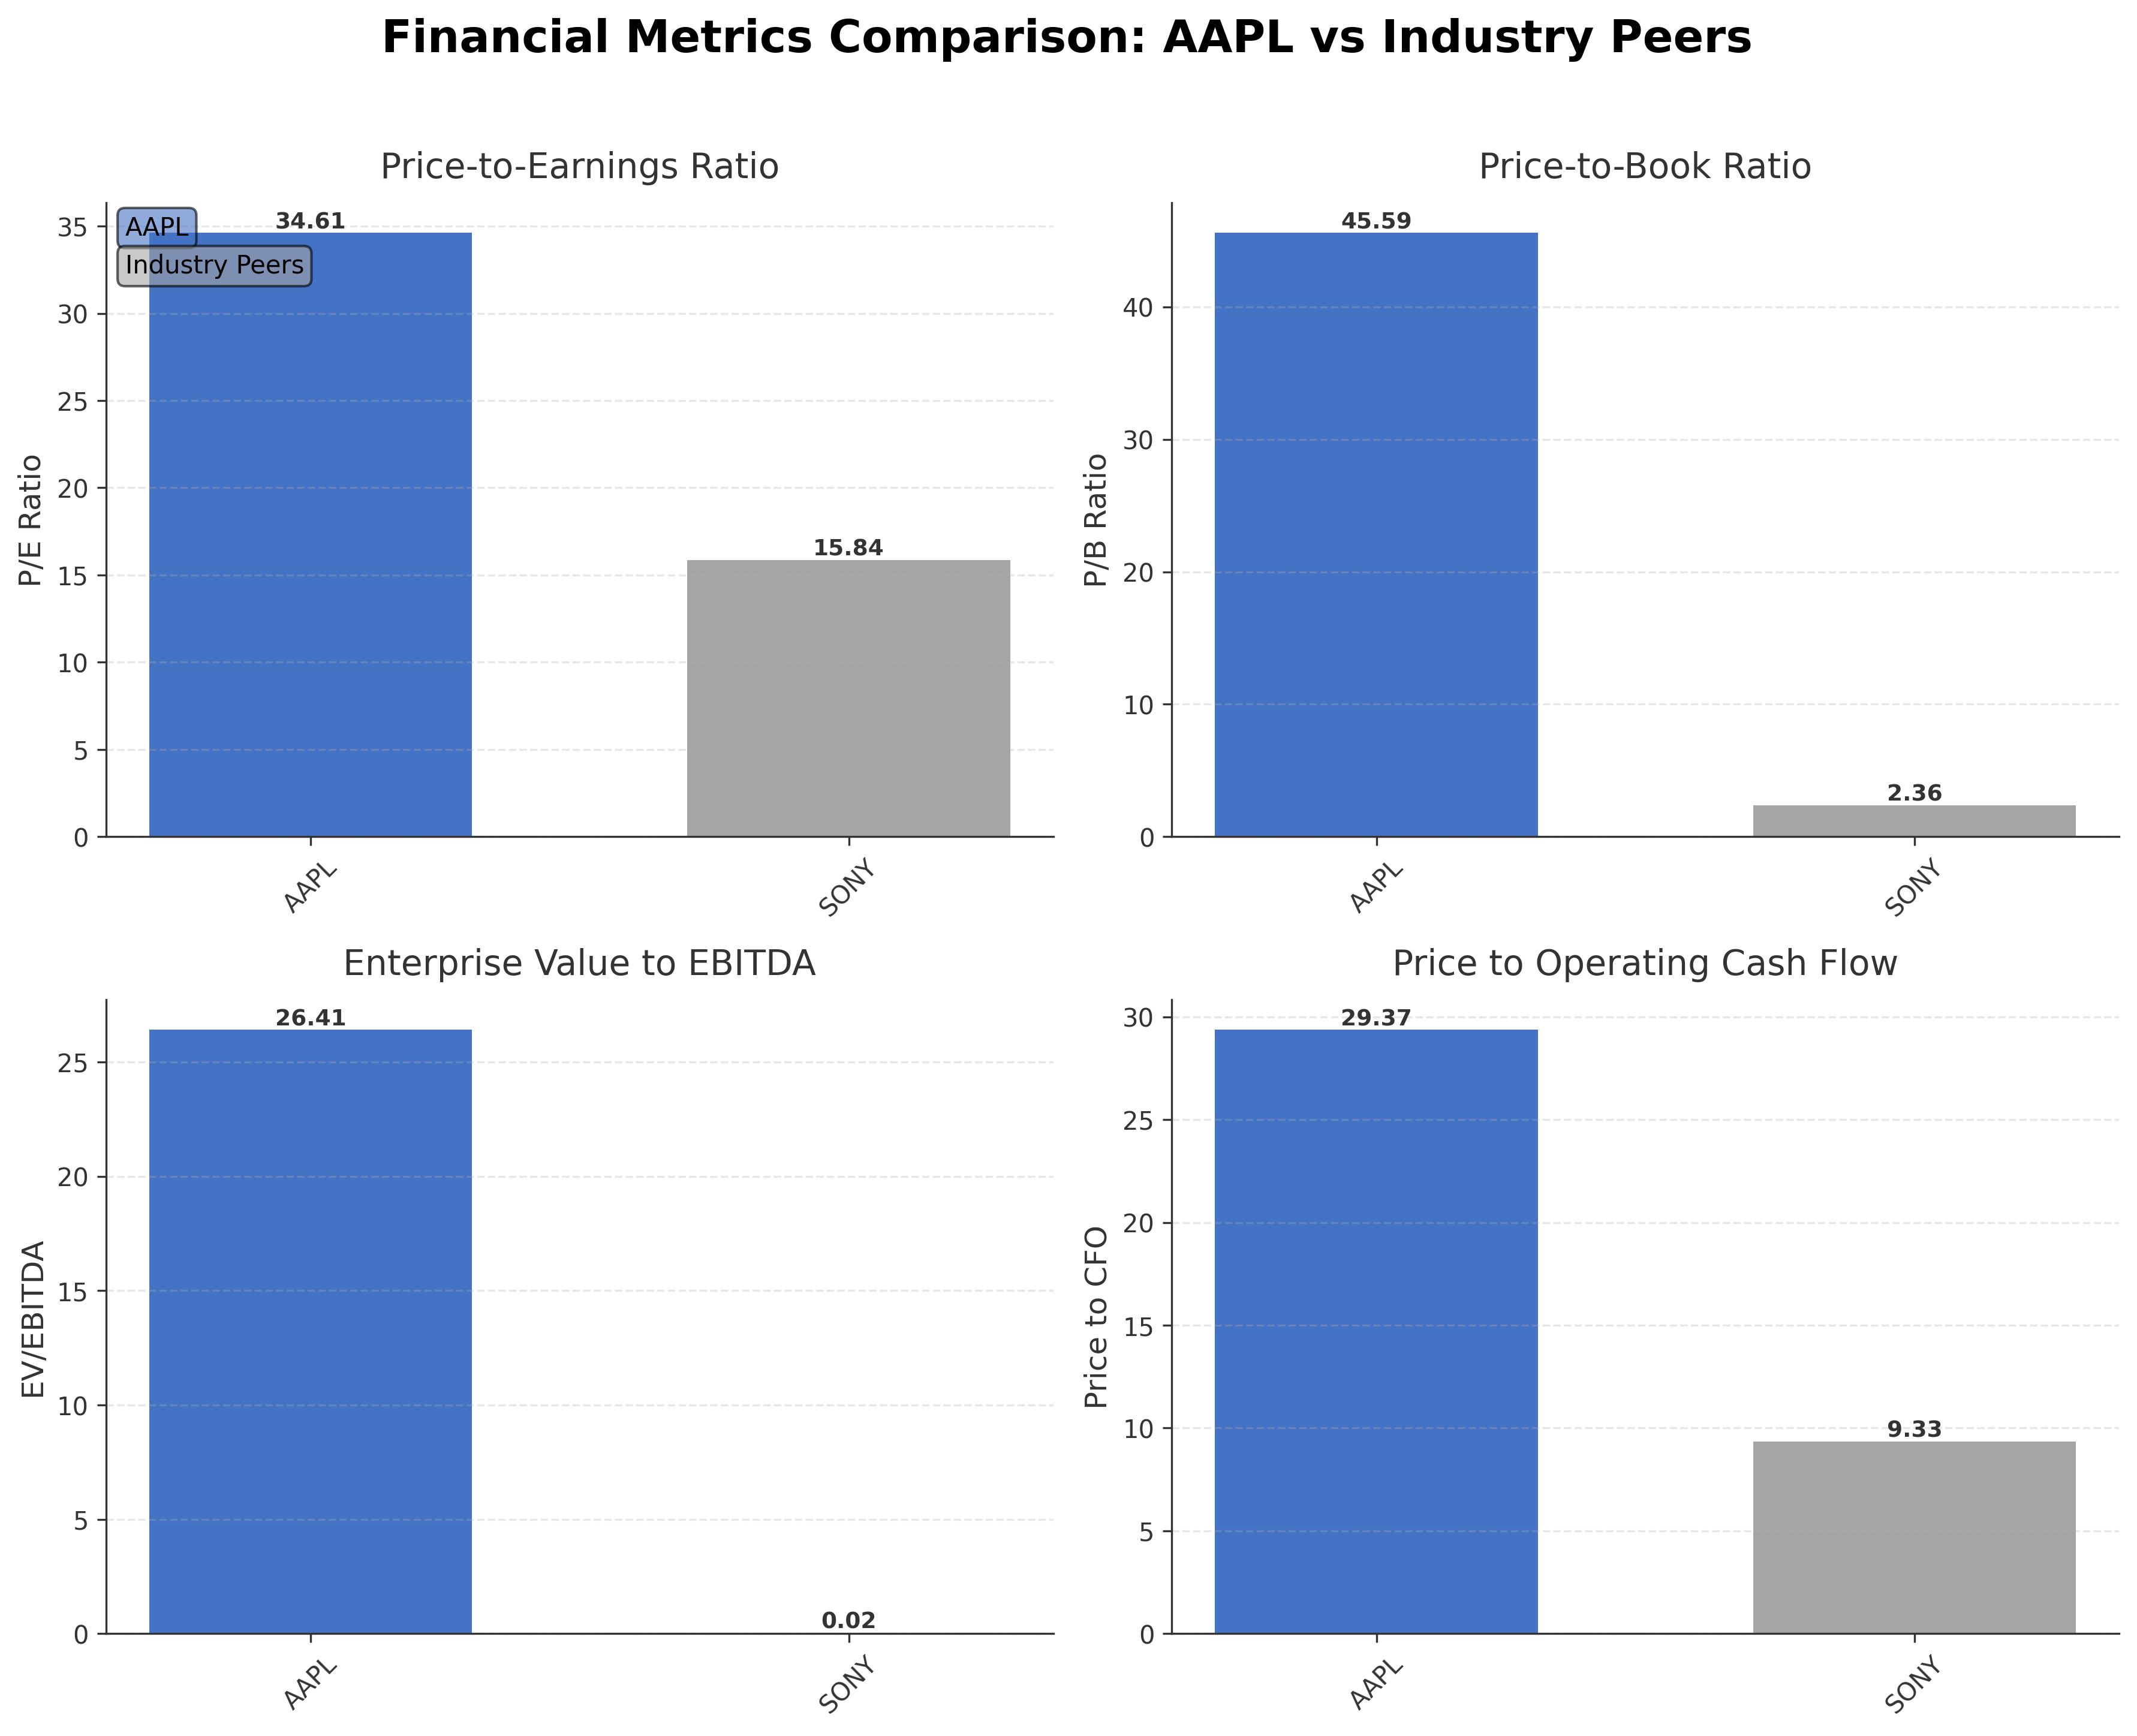
| Apple Inc. | $3.98T | 34.61 | 45.59 | 26.41 | 29.37 |
| Sony Group Corporation - Sponsored American Depositary Receipt | $119.81B | 15.84 | 2.36 | 0.02 | 9.33 |
Comparison Analysis: Apple Inc. significantly outscales its peer Sony Group Corporation in market capitalization, with a valuation near $4 trillion compared to Sony's $120 billion. Apple’s P/E ratio of 34.61 is more than double Sony’s 15.84, reflecting higher growth expectations or premium valuation. The price-to-book ratio for Apple at 45.59 far exceeds Sony’s 2.36, indicating a substantial premium on Apple’s equity. EV/EBITDA and price-to-CFO metrics also show Apple’s relatively higher valuation multiples. Return on equity for Apple at 1.52% surpasses Sony’s 0.15%, suggesting more efficient equity utilization. Overall, Apple commands a dominant position with premium valuation metrics and superior profitability relative to its regional industry peer.
Financial Metrics Comparison with Peers
Financial Statements
Comprehensive financial data including income, balance sheet, and cash flow metrics
Income Statement
| fiscal_date | 2025-09-30 | 2024-09-30 | 2023-09-30 | 2022-09-30 | 2021-09-30 |
|---|---|---|---|---|---|
| Sales | 416.16B | 391.04B | 383.29B | 394.33B | 365.82B |
| Cost Of Goods | 220.96B | 210.35B | 214.14B | 223.55B | 212.98B |
| Gross Profit | 195.20B | 180.68B | 169.15B | 170.78B | 152.84B |
| Operating Expense Research And Development | 34.55B | 31.37B | 29.91B | 26.25B | 21.91B |
| Operating Expense Selling General And Administrative | 27.60B | 26.10B | 24.93B | 25.09B | 21.97B |
| Operating Income | 133.05B | 123.22B | 114.30B | 119.44B | 108.95B |
| Other Income Expense | -321.00M | 269.00M | -565.00M | -334.00M | 60.00M |
| Pretax Income | 132.73B | 123.48B | 113.74B | 119.10B | 109.21B |
| Income Tax | 20.72B | 29.75B | 16.74B | 19.30B | 14.53B |
| Net Income | 112.01B | 93.74B | 97.00B | 99.80B | 94.68B |
| Eps Basic | 7.49 | 6.11 | 6.16 | 6.15 | 5.67 |
| Eps Diluted | 7.46 | 6.08 | 6.13 | 6.11 | 5.61 |
| Basic Shares Outstanding | 14.95B | 15.34B | 15.74B | 16.22B | 16.70B |
| Diluted Shares Outstanding | 14.95B | 15.34B | 15.74B | 16.22B | 16.70B |
| Ebit | 133.05B | 123.22B | 114.30B | 119.44B | 111.85B |
| Ebitda | 144.75B | 134.66B | 125.82B | 130.54B | 123.14B |
| Net Income Continuous Operations | 112.01B | 93.74B | 97.00B | 99.80B | 94.68B |
| Non Operating Interest Income | N/A | N/A | 3.75B | 2.83B | 2.84B |
| Non Operating Interest Expense | N/A | N/A | 3.93B | 2.93B | 2.65B |
Source: Financial statements and regulatory filings
Balance Sheet
| fiscal_date | 2025-09-30 | 2024-09-30 | 2023-09-30 | 2022-09-30 | 2021-09-30 |
|---|---|---|---|---|---|
| Cash And Cash Equivalents | 35.93B | 29.94B | 29.96B | 23.65B | 34.94B |
| Accounts Receivable | 39.78B | 33.41B | 29.51B | 28.18B | 26.28B |
| Total Assets | 359.24B | 364.98B | 352.58B | 352.75B | 351.00B |
| Total Liabilities | 285.51B | 308.03B | 290.44B | 302.08B | 287.91B |
| Long Term Debt | 78.33B | 85.75B | 95.28B | 109.71B | 119.38B |
| Shareholders Equity | 73.73B | 56.95B | 62.15B | 50.67B | 63.09B |
Source: Financial statements and regulatory filings
Cash Flow Statement
| fiscal_date | 2025-09-30 | 2024-09-30 | 2023-09-30 | 2022-09-30 | 2021-09-30 |
|---|---|---|---|---|---|
| Operating Activities Net Income | 112.01B | 93.74B | 97.00B | 99.80B | 94.68B |
| Operating Activities Depreciation | 11.70B | 11.45B | 11.52B | 11.10B | 11.28B |
| Operating Activities Stock Based Compensation | 12.86B | 11.69B | 10.83B | 9.04B | 7.91B |
| Operating Activities Other Non Cash Items | -89.00M | -2.27B | -2.23B | 1.01B | -4.92B |
| Operating Activities Accounts Receivable | -7.03B | -5.14B | -417.00M | -9.34B | -14.03B |
| Operating Activities Accounts Payable | 902.00M | 6.02B | -1.89B | 9.45B | 12.33B |
| Operating Activities Other Assets Liabilities | -18.87B | 2.77B | -4.27B | 1.57B | -1.53B |
| Operating Activities Operating Cash Flow | 111.48B | 118.25B | 110.54B | 123.52B | 100.94B |
| Investing Activities Capital Expenditures | -12.71B | -9.45B | -10.96B | -10.71B | -11.09B |
| Investing Activities Purchase Of Investments | -24.41B | -48.66B | -29.51B | -76.92B | -109.56B |
| Investing Activities Sale Of Investments | 53.80B | 62.35B | 45.51B | 67.36B | 106.48B |
| Investing Activities Other Investing Activity | -1.48B | -1.31B | -1.34B | -2.09B | -385.00M |
| Investing Activities Investing Cash Flow | 15.20B | 2.94B | 3.71B | -22.66B | -14.58B |
| Financing Activities Long Term Debt Issuance | 4.48B | 0.00 | 5.23B | 5.46B | 20.39B |
| Financing Activities Long Term Debt Payments | -10.93B | -9.96B | -11.15B | -9.54B | -8.75B |
| Financing Activities Short Term Debt Issuance | -2.03B | 3.96B | -3.98B | 3.96B | 1.02B |
| Financing Activities Common Stock Repurchase | -90.71B | -94.95B | -77.55B | -89.40B | -85.97B |
| Financing Activities Common Dividends | -15.42B | -15.23B | -15.03B | -14.84B | -14.47B |
| Financing Activities Other Financing Charges | -6.07B | -5.80B | -6.01B | -6.38B | -5.58B |
| Financing Activities Financing Cash Flow | -120.69B | -121.98B | -108.49B | -110.75B | -92.25B |
| End Cash Position | 35.93B | 29.94B | 30.74B | 24.98B | 35.93B |
| Income Tax Paid | 43.37B | 26.10B | 18.68B | 19.57B | 25.39B |
| Free Cash Flow | 98.77B | 108.81B | 99.58B | 111.44B | 92.95B |
| Interest Paid | N/A | N/A | 3.80B | 2.87B | 2.69B |
| Operating Activities Deferred Taxes | N/A | N/A | N/A | 895.00M | -4.77B |
| Investing Activities Net Acquisitions | N/A | N/A | N/A | -306.00M | -33.00M |
| Financing Activities Common Stock Issuance | N/A | N/A | N/A | N/A | 1.10B |
Source: Financial statements and regulatory filings
Technical Analysis
Key Insights
- The current trend direction for Apple’s stock is upward, with price action showing consistent gains and trading near the 52-week high.
- Key support levels are identified around $260, coinciding with the 50-day moving average, while resistance is near the 52-week high at $288.62.
- The stock price is above the 10-day, 50-day ($260.23), and 200-day ($253.34) moving averages, indicating a bullish alignment across short and long-term timeframes.
- Momentum indicators show the RSI in a moderate range, suggesting neither overbought nor oversold conditions; MACD reflects positive momentum with a recent bullish crossover.
- Multi-timeframe analysis across daily, weekly, and monthly charts confirms sustained upward momentum without significant volatility spikes.
- Potential market scenarios include continued consolidation near current levels with possible upward breakout if resistance at $288.62 is breached, or a pullback to support near $260 if profit-taking occurs.
Trending News
1. Headline: Apple gets a price target hike from UBS ahead of earnings
Summary: Apple should see its stock price go up as it continues to secure the electrical components needed to power storage for its iPhones and MacBooks, per UBS.
Sentiment: positive
2. Headline: Apple CFO Kevan Parekh sells $421,850 in company stock By Investing.com
Summary: According to InvestingPro analysis, Apple appears overvalued relative to its Fair Value, placing it among stocks on the Most Overvalued list. The company reports earnings on April 30, just three days away. In other recent news, Apple Inc. has been in the spotlight with several key developments.
Sentiment: negative
3. Headline: Ex-Apple CEO John Sculley says OpenAI is Apple's biggest threat in years | Fox Business
Summary: Former Apple CEO John Sculley says OpenAI is the biggest competitive threat Apple has faced in years, as both companies reportedly race to develop AI-powered wearable devices.
Sentiment: negative
4. Headline: AAPL, AMZN, GOOGL, MSFT: Which Magnificent Seven Stock Is Options Market Betting Will Move Most? - TipRanks.com
Summary: Apple’s expected move sits at 4.24%, while Amazon is the calmest of the group at just 3.28%. With another big earnings week ahead, options traders are betting on which of the four “Magnificent Seven” stocks, including Microsoft (MSFT), Amazon (AMZN), Apple (AAPL), and Alphabet (GOOGL), ...
Sentiment: neutral
5. Headline: Apple Store Union Staff at Closing Location Accuse Company of Retaliation - Bloomberg
Summary: Union representatives said Apple denied workers the ability to easily transfer to other locations, in a departure from its typical practice.
Sentiment: negative
Recent Updates
News Summary
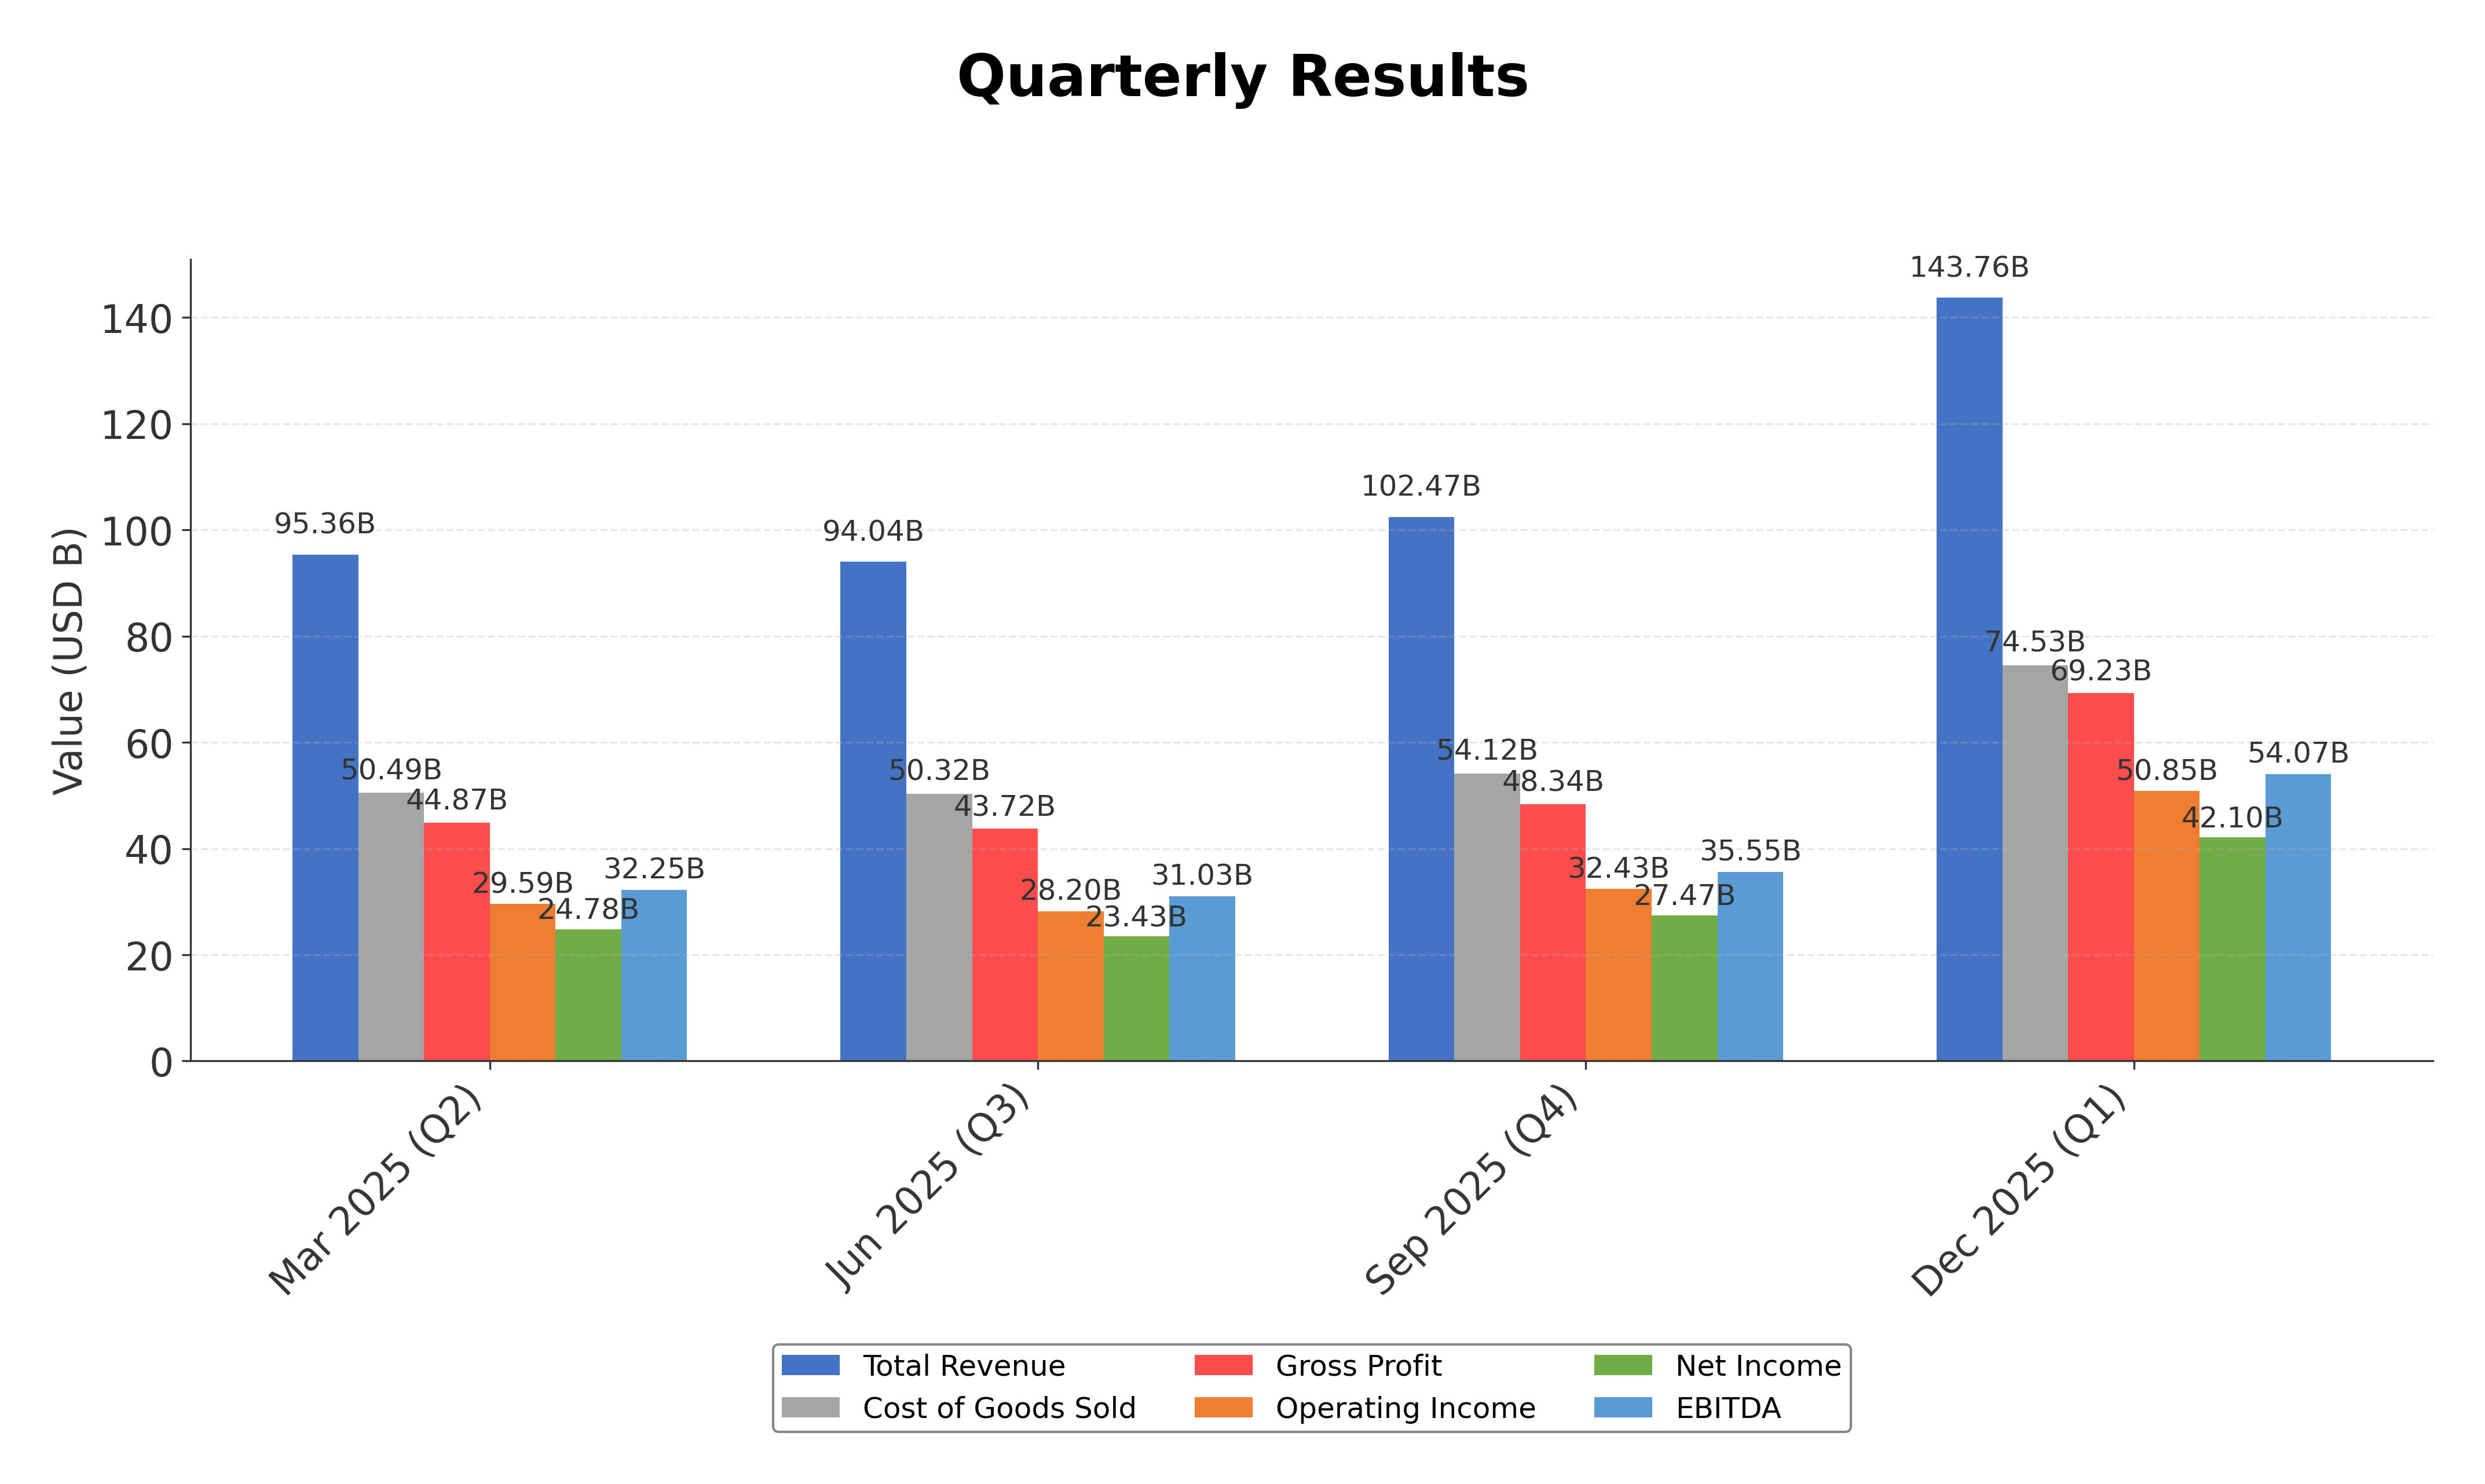
As of 2026-01-29. Apple reported record-breaking quarterly revenue of $143.8 billion for Q1 2026, representing a 16% year-over-year increase, driven by all-time highs in iPhone and Services revenue. The company achieved EPS growth of 19% to $2.84 and generated nearly $54 billion in operating cash flow, enabling a return of almost $32 billion to shareholders through dividends and share repurchases. The installed base of active devices surpassed 2.5 billion, reflecting strong customer loyalty. Earlier in 2025, Apple also reported record revenues and EPS growth in Q3 and Q4, supported by new product launches including the iPhone 17 series, AirPods Pro 3, and Apple Watch lineup. The board declared quarterly dividends consistently throughout the year. These developments underscore Apple's sustained financial strength and operational execution amid leadership transition announcements and competitive challenges.
News Sentiment
Overall sentiment from recent updates is mixed to positive, with strong financial performance and record revenues driving optimism. Positive factors include robust revenue growth, high margins, and significant shareholder returns. However, concerns arise from insider stock sales, competitive threats from AI-focused companies like OpenAI, and labor disputes at retail locations. The leadership transition with CEO Tim Cook stepping down adds an element of uncertainty. The balance of strong fundamentals against these risks suggests a cautious but attentive market stance.
Source List
Analytical Overview
Analysis Summary
Apple’s valuation metrics, including a trailing P/E of 34.61 and forward P/E of 29.17, are elevated relative to the consumer electronics industry average P/E of 34.61, reflecting premium pricing supported by strong brand and growth prospects. The company’s revenue growth of 15.7% and operating cash flow of $135.5 billion demonstrate a solid growth trajectory and robust cash generation. Financial health is supported by a total cash balance of $66.9 billion against total debt of $90.5 billion, with a current ratio near 0.974, indicating adequate liquidity despite a moderate debt-to-equity ratio of 102.63%. Sector-specific challenges include intensifying competition in AI and wearable devices, supply chain constraints, and regulatory scrutiny. Market positioning benefits from Apple’s diversified product ecosystem and strong customer loyalty, while competitive advantages include innovation leadership and scale.
Overall Business and Market Assessment
Supporting Factors: Apple’s record revenue and EPS growth, strong cash flow generation, and dominant market position in consumer electronics and services
Risk Factors: No data
SWOT Analysis
Strengths
- Market leadership in consumer electronics with a diversified product portfolio.
- Robust profitability with a gross margin of 48.16% and net margin of 27.04%.
- Strong cash flow generation with operating cash flow of $135.5 billion.
- Extensive global presence and loyal customer base exceeding 2.5 billion active devices.
Weaknesses
- High price-to-book ratio of 45.59 indicating premium valuation.
- Current ratio below 1 at 0.974, suggesting tight short-term liquidity.
- Moderate debt-to-equity ratio of 102.63% reflecting leverage usage.
- Insider stock sales raising concerns about near-term valuation.
Opportunities
- Expansion of services segment with record revenue growth.
- Innovation in AI-powered wearable devices and ecosystem integration.
- Growth potential in emerging markets such as Greater China and India.
- Strategic partnerships and supply chain enhancements to mitigate constraints.
Threats
- Intense competition from AI companies like OpenAI in wearable technology.
- Regulatory challenges and potential legal proceedings.
- Supply chain disruptions impacting product availability.
- Labor disputes affecting retail operations and brand reputation.
Company Description
Apple Inc. is a leading technology company renowned for designing, manufacturing, and marketing innovative hardware and software products for consumers and businesses worldwide. Its flagship product, the iPhone, accounts for the majority of sales, serving as the central hub of an expansive ecosystem that includes Mac computers, iPad tablets, Apple Watch wearables, and accessories like AirPods. Apple Inc. also offers a suite of services such as the App Store, Apple Music, iCloud, Apple TV+, and Apple Fitness+, providing digital content, cloud storage, and subscription-based platforms. Operating in the consumer electronics industry within the technology sector, the company employs approximately 166,000 people and maintains a broad global presence through online stores, retail outlets, and partnerships with carriers and resellers. With a substantial market capitalization reflecting its scale, Apple Inc. plays a pivotal role in shaping consumer technology trends, emphasizing seamless integration across devices and services to enhance user experience and productivity.