
Apple Inc (AAPL)
Stock Analysis Report
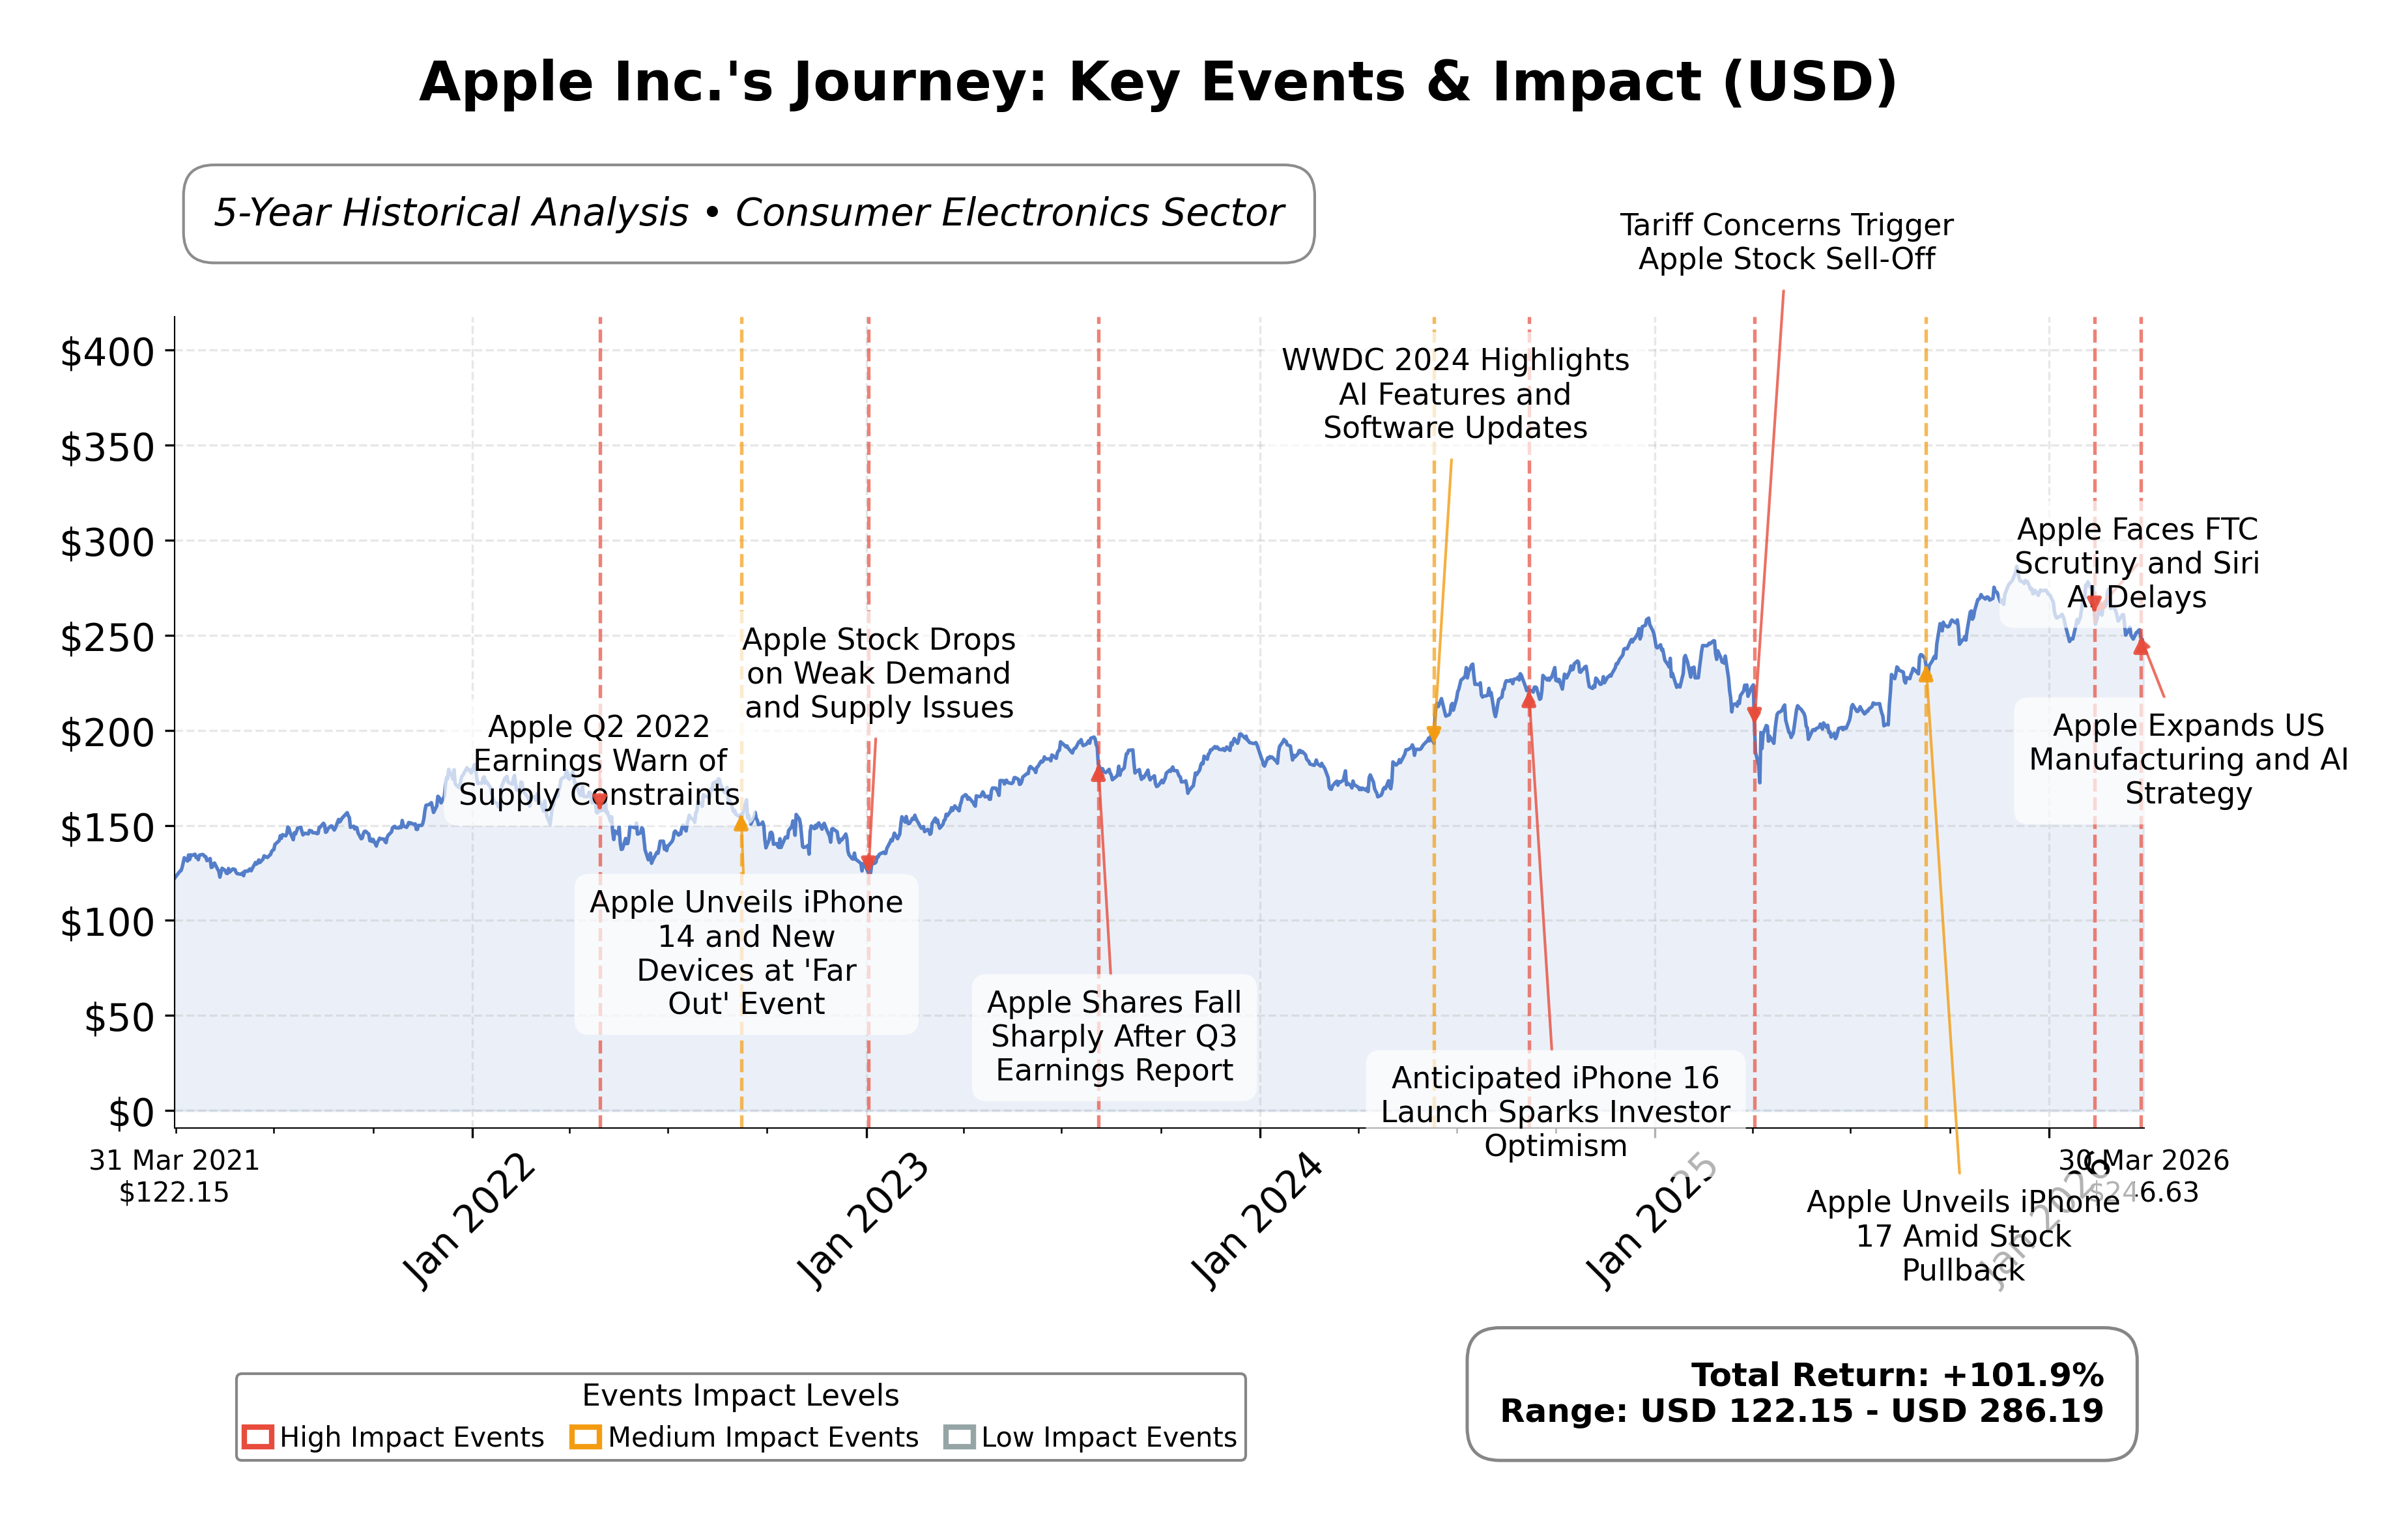
Stock Journey
Key Positives and Key Risks
Pros
- Strong revenue growth with a quarterly increase of 15.7%, indicating robust business expansion.
- High operating cash flow of $135.5 billion supporting financial flexibility and investments.
- Substantial institutional ownership at 65.25%, reflecting market confidence and governance stability.
Cons
- Elevated price-to-book ratio of 42.16, suggesting a premium valuation that may limit upside.
- Current ratio of 0.974, indicating tight short-term liquidity coverage.
- Regulatory challenges in key markets such as China could delay product rollouts and impact revenue.
Disclosure: This information is for general awareness and does not constitute investment advice
Report Summary
Apple Inc. is a leading technology company specializing in the design, manufacturing, and marketing of consumer electronics and software products. Operating primarily in the consumer electronics industry within the technology sector, Apple maintains a strong market position through its flagship iPhone product and an integrated ecosystem including Mac, iPad, Apple Watch, and various digital services. The company has a significant global presence supported by extensive retail and online distribution channels.
Financially, Apple demonstrates robust performance with a trailing twelve-month revenue of approximately $435.6 billion and a net income of about $117.8 billion. The companyâs valuation metrics include a trailing P/E ratio of 32.05 and a forward P/E of 27.15, reflecting investor expectations of continued earnings growth. Market capitalization stands at approximately $3.66 trillion, with a strong gross margin near 48.16% and a profit margin of 27.04%. Apple also maintains substantial cash reserves of around $66.9 billion against total debt of approximately $90.5 billion.
Recent technical indicators reveal Appleâs stock trading near $246.54, positioned above its 200-day moving average ($246.82) but slightly below its 50-day moving average ($261.13), indicating mixed trend signals. Strategic initiatives include advancements in artificial intelligence integration within Siri and expansion of subscription services, alongside leadership continuity. Notable strengths include a diversified product ecosystem and strong cash flow generation, while risks involve regulatory scrutiny and competitive pressures in key markets such as China.
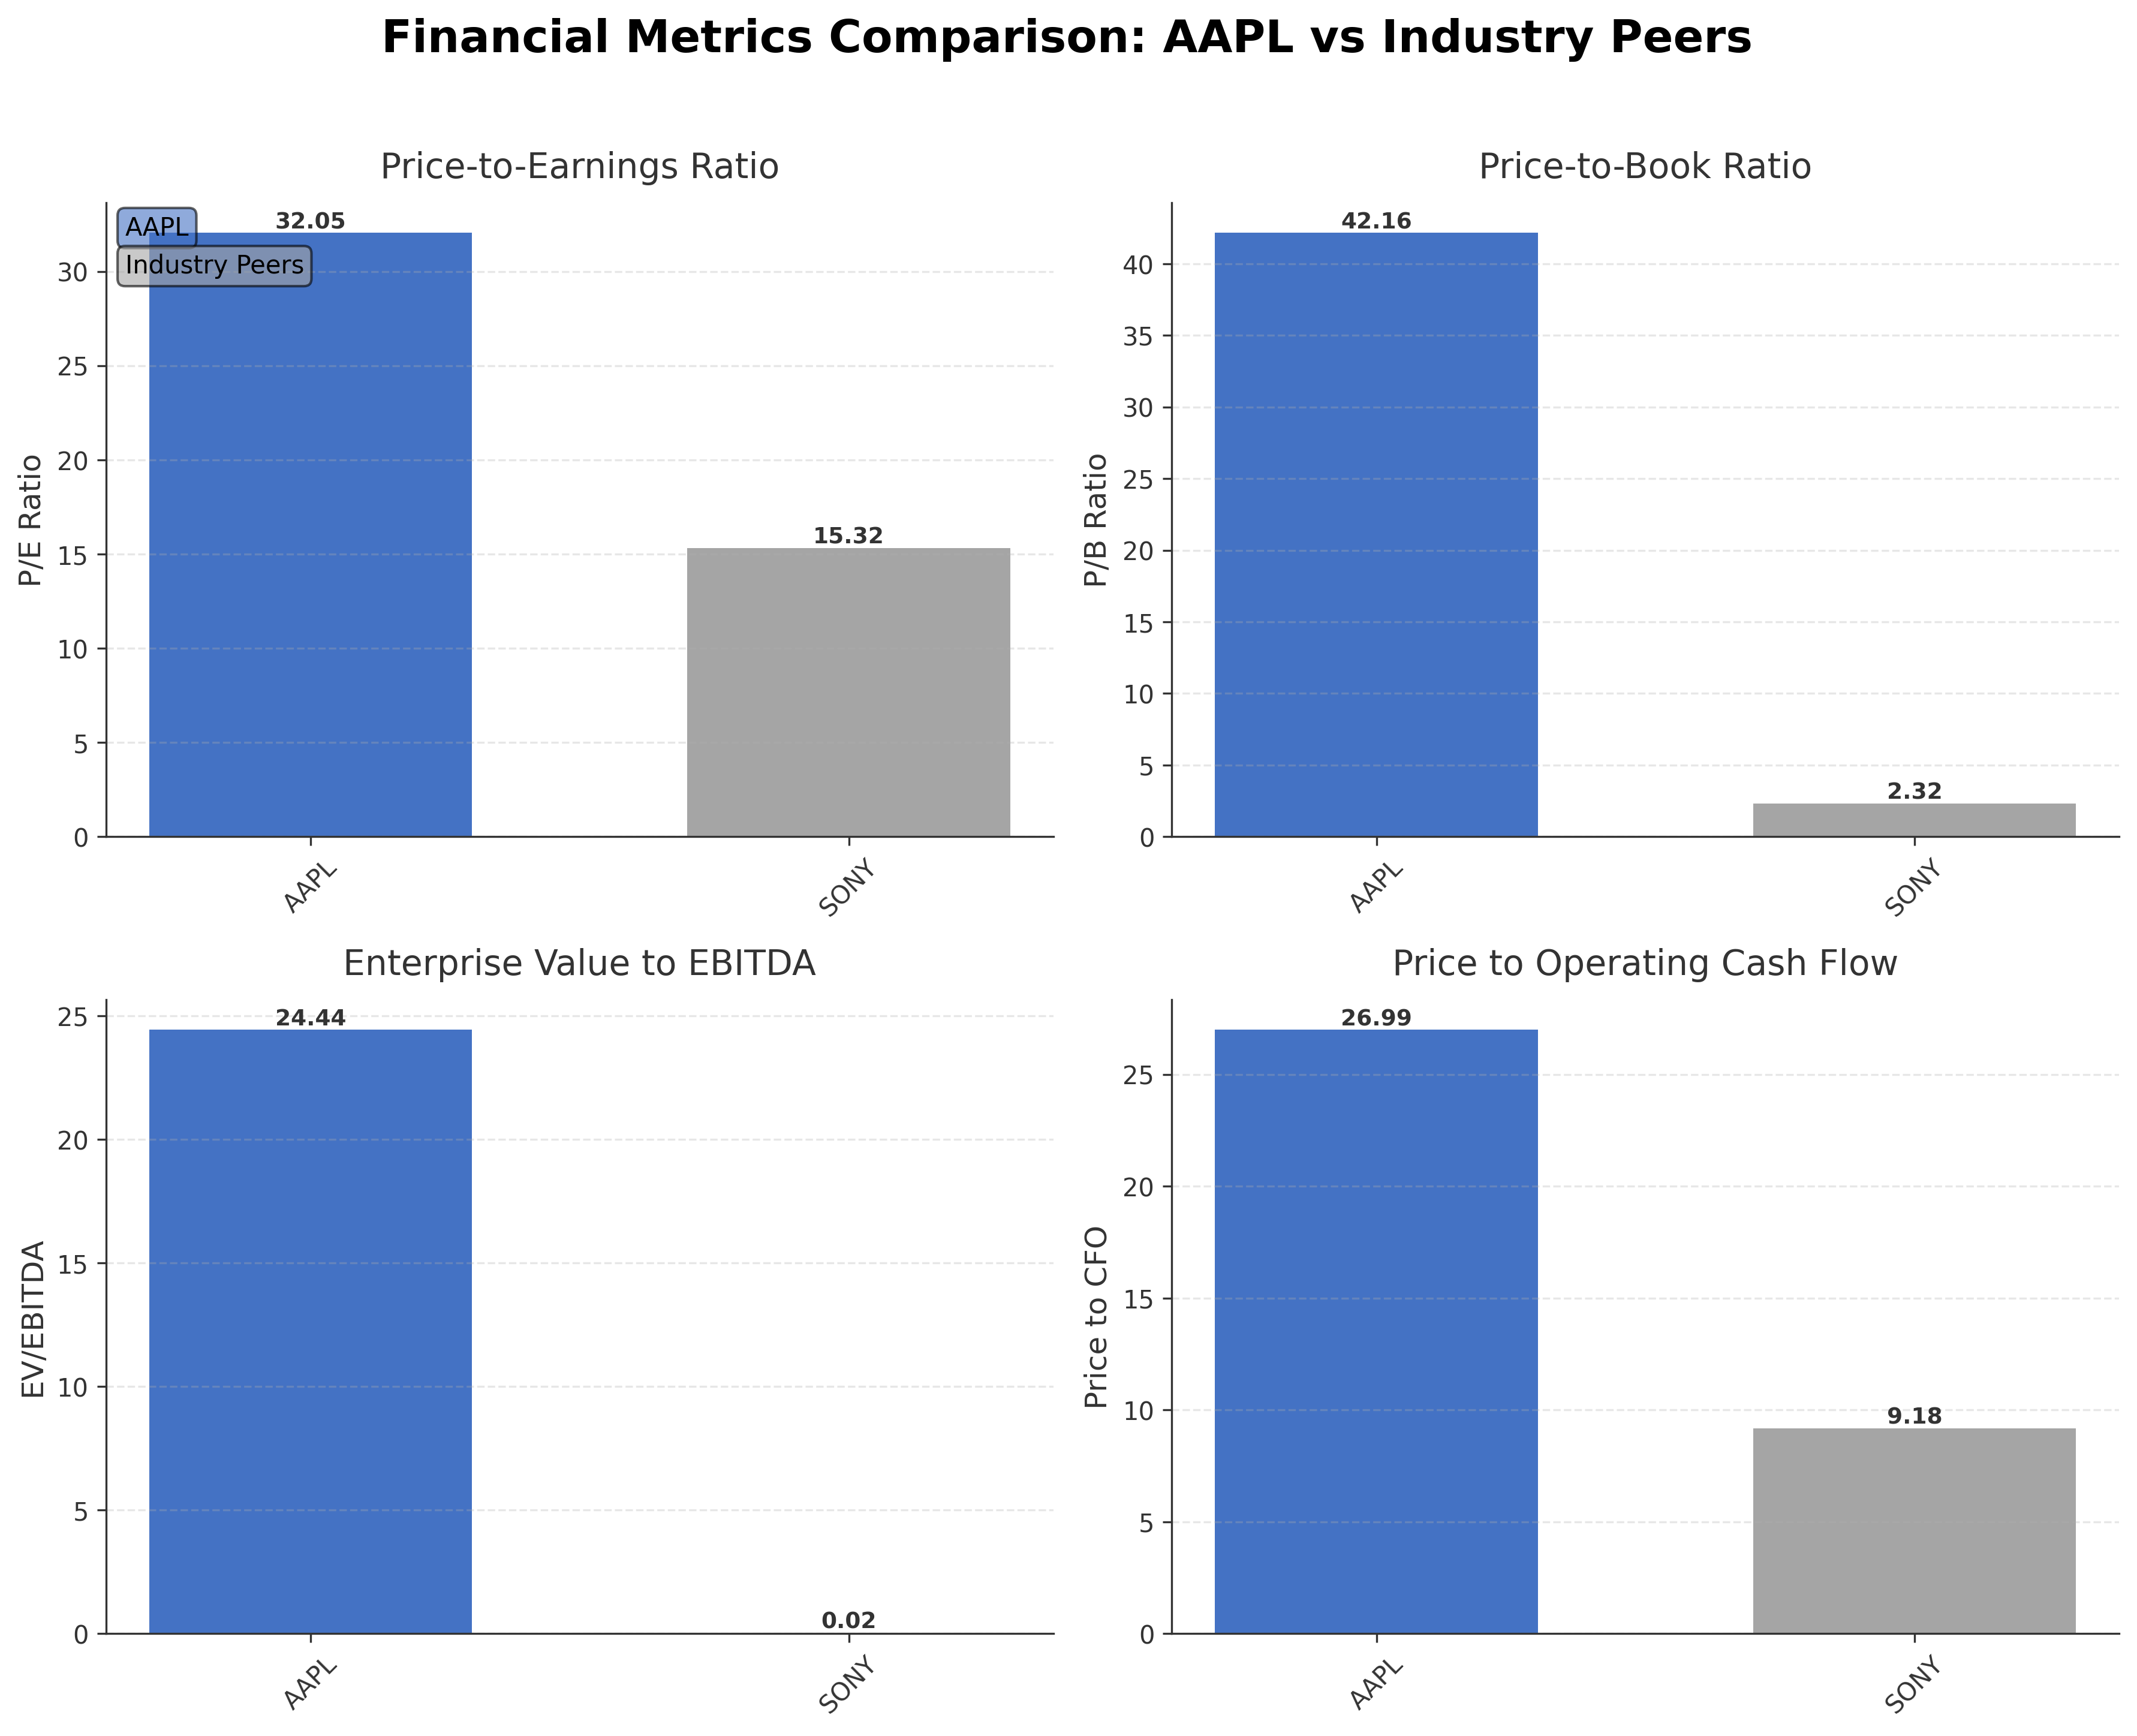
Within the consumer electronics sector in the United States, Appleâs valuation metrics are elevated compared to peers such as Sony Group Corporation, which exhibits a market capitalization of approximately $118.28 billion and a P/E ratio of 15.32. Appleâs return on equity (1.52%) and price-to-book ratio (42.16) are significantly higher than peer averages, reflecting premium market positioning but also higher valuation multiples. This contrast highlights Appleâs scale and profitability relative to regional competitors.
Apple Inc. continues to navigate a dynamic industry landscape marked by rapid technological innovation and evolving consumer preferences. Recent achievements include sustained revenue growth and innovation in AI-powered services, while challenges persist in regulatory environments and competitive dynamics. The company stands at a pivotal juncture where its strategic execution on emerging technologies and market expansion will influence future performance. Given the current data and market context, a balanced approach reflecting ongoing evaluation of operational and market developments may be appropriate for those assessing the stock.
Company and Industry Overview
Company Basics
Price Performance
Company Size
Shareholding Pattern
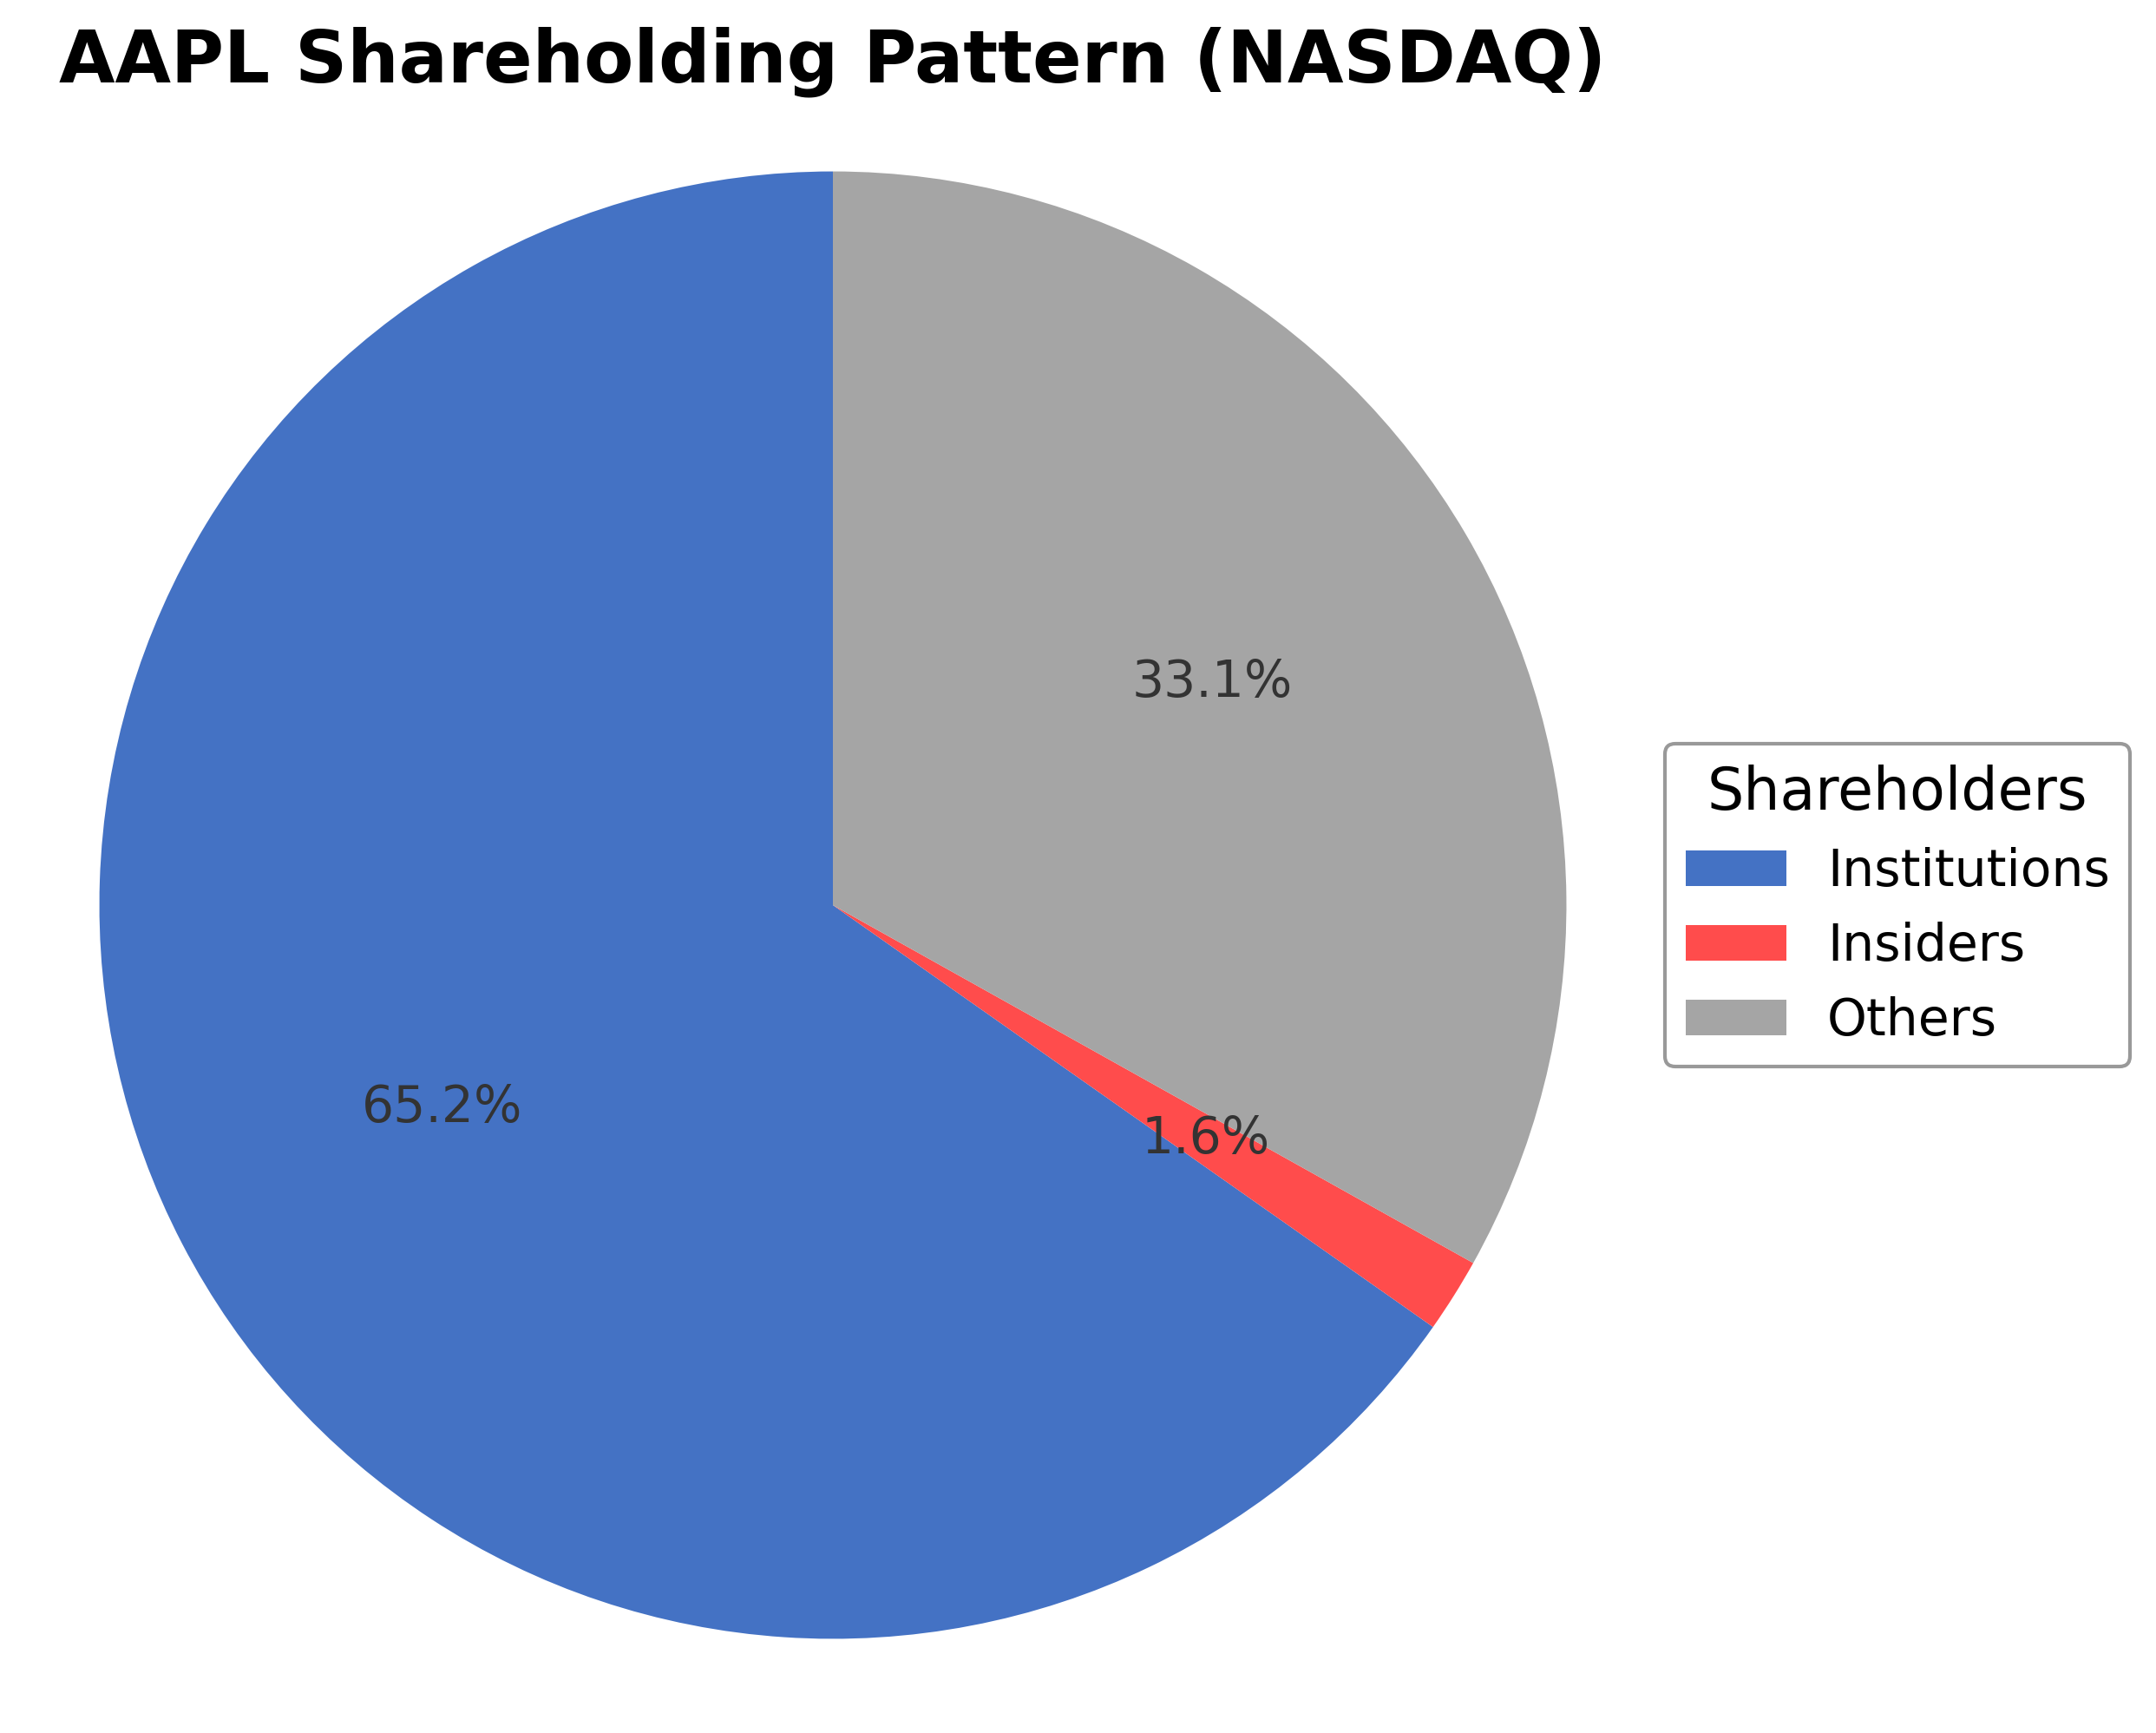
Apple Inc.'s ownership structure comprises approximately 1.64% held by insiders, 65.25% by institutional investors including mutual funds and asset managers, and the remaining 34.75% by other shareholders such as retail investors and employee stock plans. Over the past 12-24 months, institutional ownership has shown moderate accumulation, with notable increases from funds like GEM Asset Management LLC and Spartan Planning & Wealth Management, while some reductions were observed from Appleton Partners Inc. and Marshall Financial Group LLC. These patterns suggest sustained institutional confidence and active portfolio adjustments. The ownership distribution supports strong governance frameworks and may influence strategic decisions, reflecting a balanced market sentiment toward the company within the consumer electronics industry.
Sector and Industry Analysis
Apple Inc. (AAPL) operates primarily within the Technology sector, specifically in the Hardware industry, which encompasses consumer electronics, computing devices, and related software ecosystems. The global hardware market is substantial, driven by continuous innovation in smartphones, personal computing, wearables, and related peripherals. Apple stands as one of the largest players globally, with a market capitalization exceeding $3.6 trillion as of mid-2026, reflecting its dominant position. The sector exhibits a steady growth trajectory fueled by rising consumer demand for connected devices, enterprise adoption of technology solutions, and increasing integration of hardware with proprietary software and services. Key competitors include Samsung, Microsoft, Google (Alphabet), and emerging Chinese manufacturers, each vying for market share in various sub-segments such as smartphones, tablets, and personal computers.
Industry trends highlight a pronounced shift towards ecosystem-driven product strategies, where hardware serves as a gateway to software and services, enhancing customer retention and monetization. Apple’s model exemplifies this with its iPhone-centric ecosystem, integrating devices like Mac, iPad, and Apple Watch with software platforms and subscription services including streaming and augmented reality applications. Technological advancements in semiconductor design, notably Apple's in-house chip development in partnership with foundries like TSMC, underscore the industry's move towards vertical integration for performance and differentiation. Consumer behavior increasingly favors seamless interoperability, privacy, and premium user experiences, driving demand for high-end devices and recurring service revenues. Emerging opportunities are evident in augmented reality, health monitoring technologies, and AI-enhanced user interfaces, positioning hardware companies to capitalize on next-generation computing paradigms.
The regulatory landscape for the hardware industry is complex and evolving, encompassing data privacy laws, trade policies, and antitrust scrutiny. Apple and its peers must navigate compliance with global regulations such as the EU’s GDPR, U.S. Federal Trade Commission guidelines, and country-specific import/export controls, particularly given the geopolitical tensions affecting supply chains and semiconductor sourcing. Intellectual property protection remains critical, with ongoing patent litigations and standards-setting influencing competitive dynamics. Additionally, environmental regulations are increasingly shaping product design and manufacturing processes, as governments and consumers demand sustainability and responsible e-waste management. Compliance with these multifaceted regulatory requirements imposes operational costs but also creates barriers that can protect incumbents from new entrants.
Competitive dynamics in the hardware industry are characterized by high capital intensity, significant R&D investment, and strong brand equity. Market structure tends toward oligopolistic competition with a few dominant firms controlling substantial market share and ecosystem lock-in. Barriers to entry include the need for advanced technological capabilities, extensive supply chain networks, and established distribution channels. Apple’s competitive positioning is reinforced by its integrated hardware-software approach, premium branding, and direct-to-consumer retail strategy, which together create high switching costs for customers. Partnerships with key suppliers such as Foxconn for assembly and TSMC for chip fabrication underpin its operational efficiency. However, rapid technological change and shifting consumer preferences require continuous innovation to maintain leadership. Overall, the hardware industry remains dynamic, with incumbents leveraging scale and ecosystem advantages to sustain competitive moats amid evolving market conditions.
Note: Analysis synthesized from industry research, market reports, and regulatory filings. Information is subject to change based on market conditions.
Illustrative Scenario Analysis
DCF Assumptions:
Method: Two-Stage EPS-Priority Model
Financials
Peer Analysis
| Company Name | Market Cap | P/E Ratio | P/B Ratio | EV/EBITDA | Price to CFO |
|---|---|---|---|---|---|
| Apple Inc. | $3.66T | 32.05 | 42.16 | 24.44 | 26.99 |
| Sony Group Corporation - Sponsored American Depositary Receipt | $118.28B | 15.32 | 2.32 | 0.02 | 9.18 |
Comparison Analysis: Apple Inc. exhibits substantially higher valuation multiples compared to its peer Sony Group Corporation, with a P/E ratio of 32.05 versus Sony’s 15.32 and a price-to-book ratio of 42.16 compared to 2.32. Apple's enterprise value to EBITDA ratio of 24.44 also exceeds Sony’s 0.02, indicating a premium market valuation. Return on equity for Apple at 1.52% outperforms Sony’s 0.15%, reflecting stronger profitability. These disparities underscore Apple's dominant market position and investor expectations relative to regional industry competitors.
Financial Metrics Comparison with Peers
Financial Statements
Comprehensive financial data including income, balance sheet, and cash flow metrics
Income Statement
| fiscal_date | 2025-09-30 | 2024-09-30 | 2023-09-30 | 2022-09-30 | 2021-09-30 |
|---|---|---|---|---|---|
| Sales | 416.16B | 391.04B | 383.29B | 394.33B | 365.82B |
| Cost Of Goods | 220.96B | 210.35B | 214.14B | 223.55B | 212.98B |
| Gross Profit | 195.20B | 180.68B | 169.15B | 170.78B | 152.84B |
| Operating Expense Research And Development | 34.55B | 31.37B | 29.91B | 26.25B | 21.91B |
| Operating Expense Selling General And Administrative | 27.60B | 26.10B | 24.93B | 25.09B | 21.97B |
| Operating Income | 133.05B | 123.22B | 114.30B | 119.44B | 108.95B |
| Other Income Expense | -321.00M | 269.00M | -565.00M | -334.00M | 60.00M |
| Pretax Income | 132.73B | 123.48B | 113.74B | 119.10B | 109.21B |
| Income Tax | 20.72B | 29.75B | 16.74B | 19.30B | 14.53B |
| Net Income | 112.01B | 93.74B | 97.00B | 99.80B | 94.68B |
| Eps Basic | 7.49 | 6.11 | 6.16 | 6.15 | 5.67 |
| Eps Diluted | 7.46 | 6.08 | 6.13 | 6.11 | 5.61 |
| Basic Shares Outstanding | 14.95B | 15.34B | 15.74B | 16.22B | 16.70B |
| Diluted Shares Outstanding | 14.95B | 15.34B | 15.74B | 16.22B | 16.70B |
| Ebit | 133.05B | 123.22B | 114.30B | 119.44B | 111.85B |
| Ebitda | 144.75B | 134.66B | 125.82B | 130.54B | 123.14B |
| Net Income Continuous Operations | 112.01B | 93.74B | 97.00B | 99.80B | 94.68B |
| Non Operating Interest Income | N/A | N/A | 3.75B | 2.83B | 2.84B |
| Non Operating Interest Expense | N/A | N/A | 3.93B | 2.93B | 2.65B |
Source: Financial statements and regulatory filings
Balance Sheet
| fiscal_date | 2025-09-30 | 2024-09-30 | 2023-09-30 | 2022-09-30 | 2021-09-30 |
|---|---|---|---|---|---|
| Cash And Cash Equivalents | 35.93B | 29.94B | 29.96B | 23.65B | 34.94B |
| Accounts Receivable | 39.78B | 33.41B | 29.51B | 28.18B | 26.28B |
| Total Assets | 359.24B | 364.98B | 352.58B | 352.75B | 351.00B |
| Total Liabilities | 285.51B | 308.03B | 290.44B | 302.08B | 287.91B |
| Long Term Debt | 78.33B | 85.75B | 95.28B | 109.71B | 119.38B |
| Shareholders Equity | 73.73B | 56.95B | 62.15B | 50.67B | 63.09B |
Source: Financial statements and regulatory filings
Cash Flow Statement
| fiscal_date | 2025-09-30 | 2024-09-30 | 2023-09-30 | 2022-09-30 | 2021-09-30 |
|---|---|---|---|---|---|
| Operating Activities Net Income | 112.01B | 93.74B | 97.00B | 99.80B | 94.68B |
| Operating Activities Depreciation | 11.70B | 11.45B | 11.52B | 11.10B | 11.28B |
| Operating Activities Stock Based Compensation | 12.86B | 11.69B | 10.83B | 9.04B | 7.91B |
| Operating Activities Other Non Cash Items | -89.00M | -2.27B | -2.23B | 1.01B | -4.92B |
| Operating Activities Accounts Receivable | -7.03B | -5.14B | -417.00M | -9.34B | -14.03B |
| Operating Activities Accounts Payable | 902.00M | 6.02B | -1.89B | 9.45B | 12.33B |
| Operating Activities Other Assets Liabilities | -18.87B | 2.77B | -4.27B | 1.57B | -1.53B |
| Operating Activities Operating Cash Flow | 111.48B | 118.25B | 110.54B | 123.52B | 100.94B |
| Investing Activities Capital Expenditures | -12.71B | -9.45B | -10.96B | -10.71B | -11.09B |
| Investing Activities Purchase Of Investments | -24.41B | -48.66B | -29.51B | -76.92B | -109.56B |
| Investing Activities Sale Of Investments | 53.80B | 62.35B | 45.51B | 67.36B | 106.48B |
| Investing Activities Other Investing Activity | -1.48B | -1.31B | -1.34B | -2.09B | -385.00M |
| Investing Activities Investing Cash Flow | 15.20B | 2.94B | 3.71B | -22.66B | -14.58B |
| Financing Activities Long Term Debt Issuance | 4.48B | 0.00 | 5.23B | 5.46B | 20.39B |
| Financing Activities Long Term Debt Payments | -10.93B | -9.96B | -11.15B | -9.54B | -8.75B |
| Financing Activities Short Term Debt Issuance | -2.03B | 3.96B | -3.98B | 3.96B | 1.02B |
| Financing Activities Common Stock Repurchase | -90.71B | -94.95B | -77.55B | -89.40B | -85.97B |
| Financing Activities Common Dividends | -15.42B | -15.23B | -15.03B | -14.84B | -14.47B |
| Financing Activities Other Financing Charges | -6.07B | -5.80B | -6.01B | -6.38B | -5.58B |
| Financing Activities Financing Cash Flow | -120.69B | -121.98B | -108.49B | -110.75B | -92.25B |
| End Cash Position | 35.93B | 29.94B | 30.74B | 24.98B | 35.93B |
| Income Tax Paid | 43.37B | 26.10B | 18.68B | 19.57B | 25.39B |
| Free Cash Flow | 98.77B | 108.81B | 99.58B | 111.44B | 92.95B |
| Interest Paid | N/A | N/A | 3.80B | 2.87B | 2.69B |
| Operating Activities Deferred Taxes | N/A | N/A | N/A | 895.00M | -4.77B |
| Investing Activities Net Acquisitions | N/A | N/A | N/A | -306.00M | -33.00M |
| Financing Activities Common Stock Issuance | N/A | N/A | N/A | N/A | 1.10B |
Source: Financial statements and regulatory filings
Technical Analysis
Key Insights
- The current trend shows mixed signals with the stock price trading near $246.54, slightly below the 50-day moving average ($261.13) but above the 200-day moving average ($246.82), indicating potential consolidation.
- Key support levels are identified near the 200-day moving average at approximately $246.82 and the 52-week low around $169.21, while resistance is observed near the 50-day moving average at $261.13 and the 52-week high at $288.62.
- The stock is positioned above the 200-day moving average, suggesting long-term support, but below the 50-day moving average, indicating short-term resistance.
- Momentum indicators show a moderate RSI level, with MACD and Stochastic oscillators reflecting neutral to slightly bearish momentum in the short term.
- Multi-timeframe analysis reveals that weekly and monthly charts maintain a generally positive trend, while daily charts indicate sideways movement.
- Potential market scenarios include a continuation of consolidation within the current range or a breakout above the 50-day moving average to resume upward momentum.
Trending News
1. Headline: Mark Gurman Dismisses Apple Intelligence China Launch As Error, Points To Missing Approval And Unusual Ti - Benzinga
Summary: Gurman also highlighted that the feature relies on technology from Alphabet Inc.'s (NASDAQ:GOOG) (NASDAQ:GOOGL) Google — which is restricted in China — further suggesting the rollout wasn't ready for public release. The timing is notable. In January, Apple reported a 38% year-over-year ...
Sentiment: negative
2. Headline: Apple Inc. $AAPL Shares Bought by GEM Asset Management LLC
Summary: GEM Asset Management LLC boosted its stake in shares of Apple Inc. (NASDAQ:AAPL - Free Report) by 32.2% during the 4th quarter, according to the company in its most recent filing with the Securities and Exchange Commission. The fund owned 20,974 shares of the iPhone maker's stock after purchasing a
Sentiment: positive
3. Headline: Appleton Partners Inc. MA Cuts Stock Holdings in Apple Inc. $AAPL
Summary: Appleton Partners Inc. MA lowered its stake in Apple Inc. (NASDAQ:AAPL - Free Report) by 1.8% in the fourth quarter, according to its most recent disclosure with the Securities and Exchange Commission (SEC). The fund owned 341,715 shares of the iPhone maker's stock after selling 6,359 shares during
Sentiment: negative
4. Headline: Apple Inc.’s (AAPL) Siri to Get Powerful AI Features and a Standalone App
Summary: Apple Inc. (NASDAQ:AAPL) is one of the Good Stocks to Buy Now. After a long waiting period, Apple Inc. (NASDAQ:AAPL)’s Siri is expected to get more powerful AI features and a standalone app for Mac and iPhone, as per a March 24 report by Bloomberg. Mark Gurman from Bloomberg reported that ...
Sentiment: positive
5. Headline: Apple Intelligence Won’t Drive Revenue, Gurman Says “The Opportunity Has Passed”
Summary: Gurman also reports that Apple is preparing deeper third-party AI integration, including a future Siri experience that can work with outside chatbot services. That matters because it creates room for Apple to profit from AI apps and subscriptions through the App Store, where it still takes ...
Sentiment: positive
6. Headline: Developers Warn Flood of Vibe-Coded Apps Could Slow Apple Approvals - Business Insider
Summary: Apple's App Store is seeing an influx of new apps each month. Developers say the flood of apps is increasing wait times.
Sentiment: negative
7. Headline: Independence Wealth Advisors LLC Makes New $1.89 Million Investment in Apple Inc. $AAPL
Summary: Independence Wealth Advisors LLC acquired a new stake in Apple Inc. (NASDAQ:AAPL - Free Report) in the fourth quarter, according to its most recent Form 13F filing with the Securities and Exchange Commission. The institutional investor acquired 6,945 shares of the iPhone maker's stock, valued at a
Sentiment: neutral
8. Headline: Marshall Financial Group LLC Reduces Position in Apple Inc. $AAPL
Summary: Marshall Financial Group LLC reduced its stake in Apple Inc. (NASDAQ:AAPL - Free Report) by 15.8% during the fourth quarter, according to the company in its most recent Form 13F filing with the Securities and Exchange Commission. The fund owned 49,427 shares of the iPhone maker's stock after sellin
Sentiment: positive
9. Headline: Spartan Planning & Wealth Management Acquires 2,024 Shares of Apple Inc. $AAPL
Summary: Spartan Planning & Wealth Management increased its stake in shares of Apple Inc. (NASDAQ:AAPL - Free Report) by 7.0% in the 4th quarter, according to its most recent 13F filing with the Securities and Exchange Commission (SEC). The fund owned 30,874 shares of the iPhone maker's stock after purchasi
Sentiment: positive
10. Headline: Prediction: These 2 Stocks Will Be Worth More Than Apple in a Decade | The Motley Fool
Summary: From this trend, each could produce ... Apple's by 2035. Image source: Getty Images. Few may call Amazon an AI front-runner, but this perception could change within the next few years. Already the dominant player in the cloud computing market through its Amazon Web Services (AWS) division, the company is benefiting from increased demand in ...
Sentiment: positive
Recent Updates
News Summary
Recent news highlights include institutional portfolio adjustments with E. Ohman J or Asset Management AB reducing its Apple stake by 13% during the fourth quarter, reflecting active management of holdings. Apple’s Siri is set to receive significant AI enhancements and a standalone app launch, signaling ongoing innovation in voice assistant technology. The company celebrated its 50th anniversary, marking a milestone in its evolution from a garage startup to a global technology leader. Legal developments include the affirmation of a U.S. International Trade Commission exclusion order against Apple Watch, underscoring ongoing regulatory and intellectual property challenges. These themes underscore Apple's continued focus on innovation, market positioning, and navigating regulatory landscapes.
News Sentiment
The overall sentiment from recent updates is moderately positive, driven by technological advancements and milestone celebrations, tempered by regulatory and legal challenges. Institutional activity shows mixed positioning, indicating balanced market views. The sentiment across sources suggests cautious optimism about Apple's future prospects amid a complex operating environment.
Analytical Overview
Analysis Summary
Valuation Metrics: Apple’s trailing P/E ratio of 32.05 is aligned with the industry average of 32.05, while the forward P/E of 27.15 suggests expectations of earnings growth. The price-to-book ratio of 42.16 is significantly higher than typical industry levels, reflecting premium valuation.
Growth Trajectory: The company exhibits strong revenue growth with a quarterly revenue increase of 15.7% and positive earnings growth of 15.9% year-over-year. Operating and free cash flow remain robust, supporting ongoing investment and shareholder returns.
Financial Health: Apple maintains a strong liquidity position with total cash of approximately $66.9 billion and operating cash flow of $135.5 billion. The debt-to-equity ratio of 102.63% indicates moderate leverage, balanced by substantial cash reserves and cash flow generation.
Sector Specific Factors: The consumer electronics sector faces challenges including regulatory scrutiny, supply chain constraints, and competitive innovation pressures. Apple’s diversified product ecosystem and service offerings provide opportunities to mitigate these risks and capitalize on emerging technology trends.
Market Positioning: Apple’s dominant market share, brand strength, and integrated ecosystem confer competitive advantages, supporting resilience amid evolving market conditions and technological shifts.
Investment Conclusion
Supporting Factors: Robust revenue and earnings growth with strong cash flow generation.
Risk Factors: High price-to-book ratio suggesting stretched valuation.
SWOT Analysis
Strengths
- Market leadership with a diversified product and services ecosystem.
- Strong brand recognition and global distribution network.
- Robust financial performance with high profitability and cash flow.
- Significant institutional ownership supporting governance.
Weaknesses
- High valuation multiples relative to industry peers.
- Moderate leverage with a debt-to-equity ratio above 100%.
- Dependence on flagship products like the iPhone for revenue.
- Current ratio below 1 indicating tight short-term liquidity.
Opportunities
- Expansion of AI capabilities and integration in products and services.
- Growth in subscription-based digital services and content platforms.
- Potential market share gains in emerging markets.
- Innovation in wearable technology and health-related devices.
Threats
- Regulatory challenges and approval delays in key markets such as China.
- Intense competition from other technology and consumer electronics firms.
- Supply chain disruptions impacting production and delivery.
- Legal disputes affecting product availability and brand reputation.
Company Description
Apple Inc. is a leading technology company renowned for designing, manufacturing, and marketing innovative hardware and software products for consumers and businesses worldwide. Its flagship product, the iPhone, accounts for the majority of sales, serving as the central hub of an expansive ecosystem that includes Mac computers, iPad tablets, Apple Watch wearables, and accessories like AirPods. Apple Inc. also offers a suite of services such as the App Store, Apple Music, iCloud, Apple TV+, and Apple Fitness+, providing digital content, cloud storage, and subscription-based platforms. Operating in the consumer electronics industry within the technology sector, the company employs approximately 166,000 people and maintains a broad global presence through online stores, retail outlets, and partnerships with carriers and resellers. With a substantial market capitalization reflecting its scale, Apple Inc. plays a pivotal role in shaping consumer technology trends, emphasizing seamless integration across devices and services to enhance user experience and productivity.