
Apple Inc (AAPL)
Stock Analysis Report
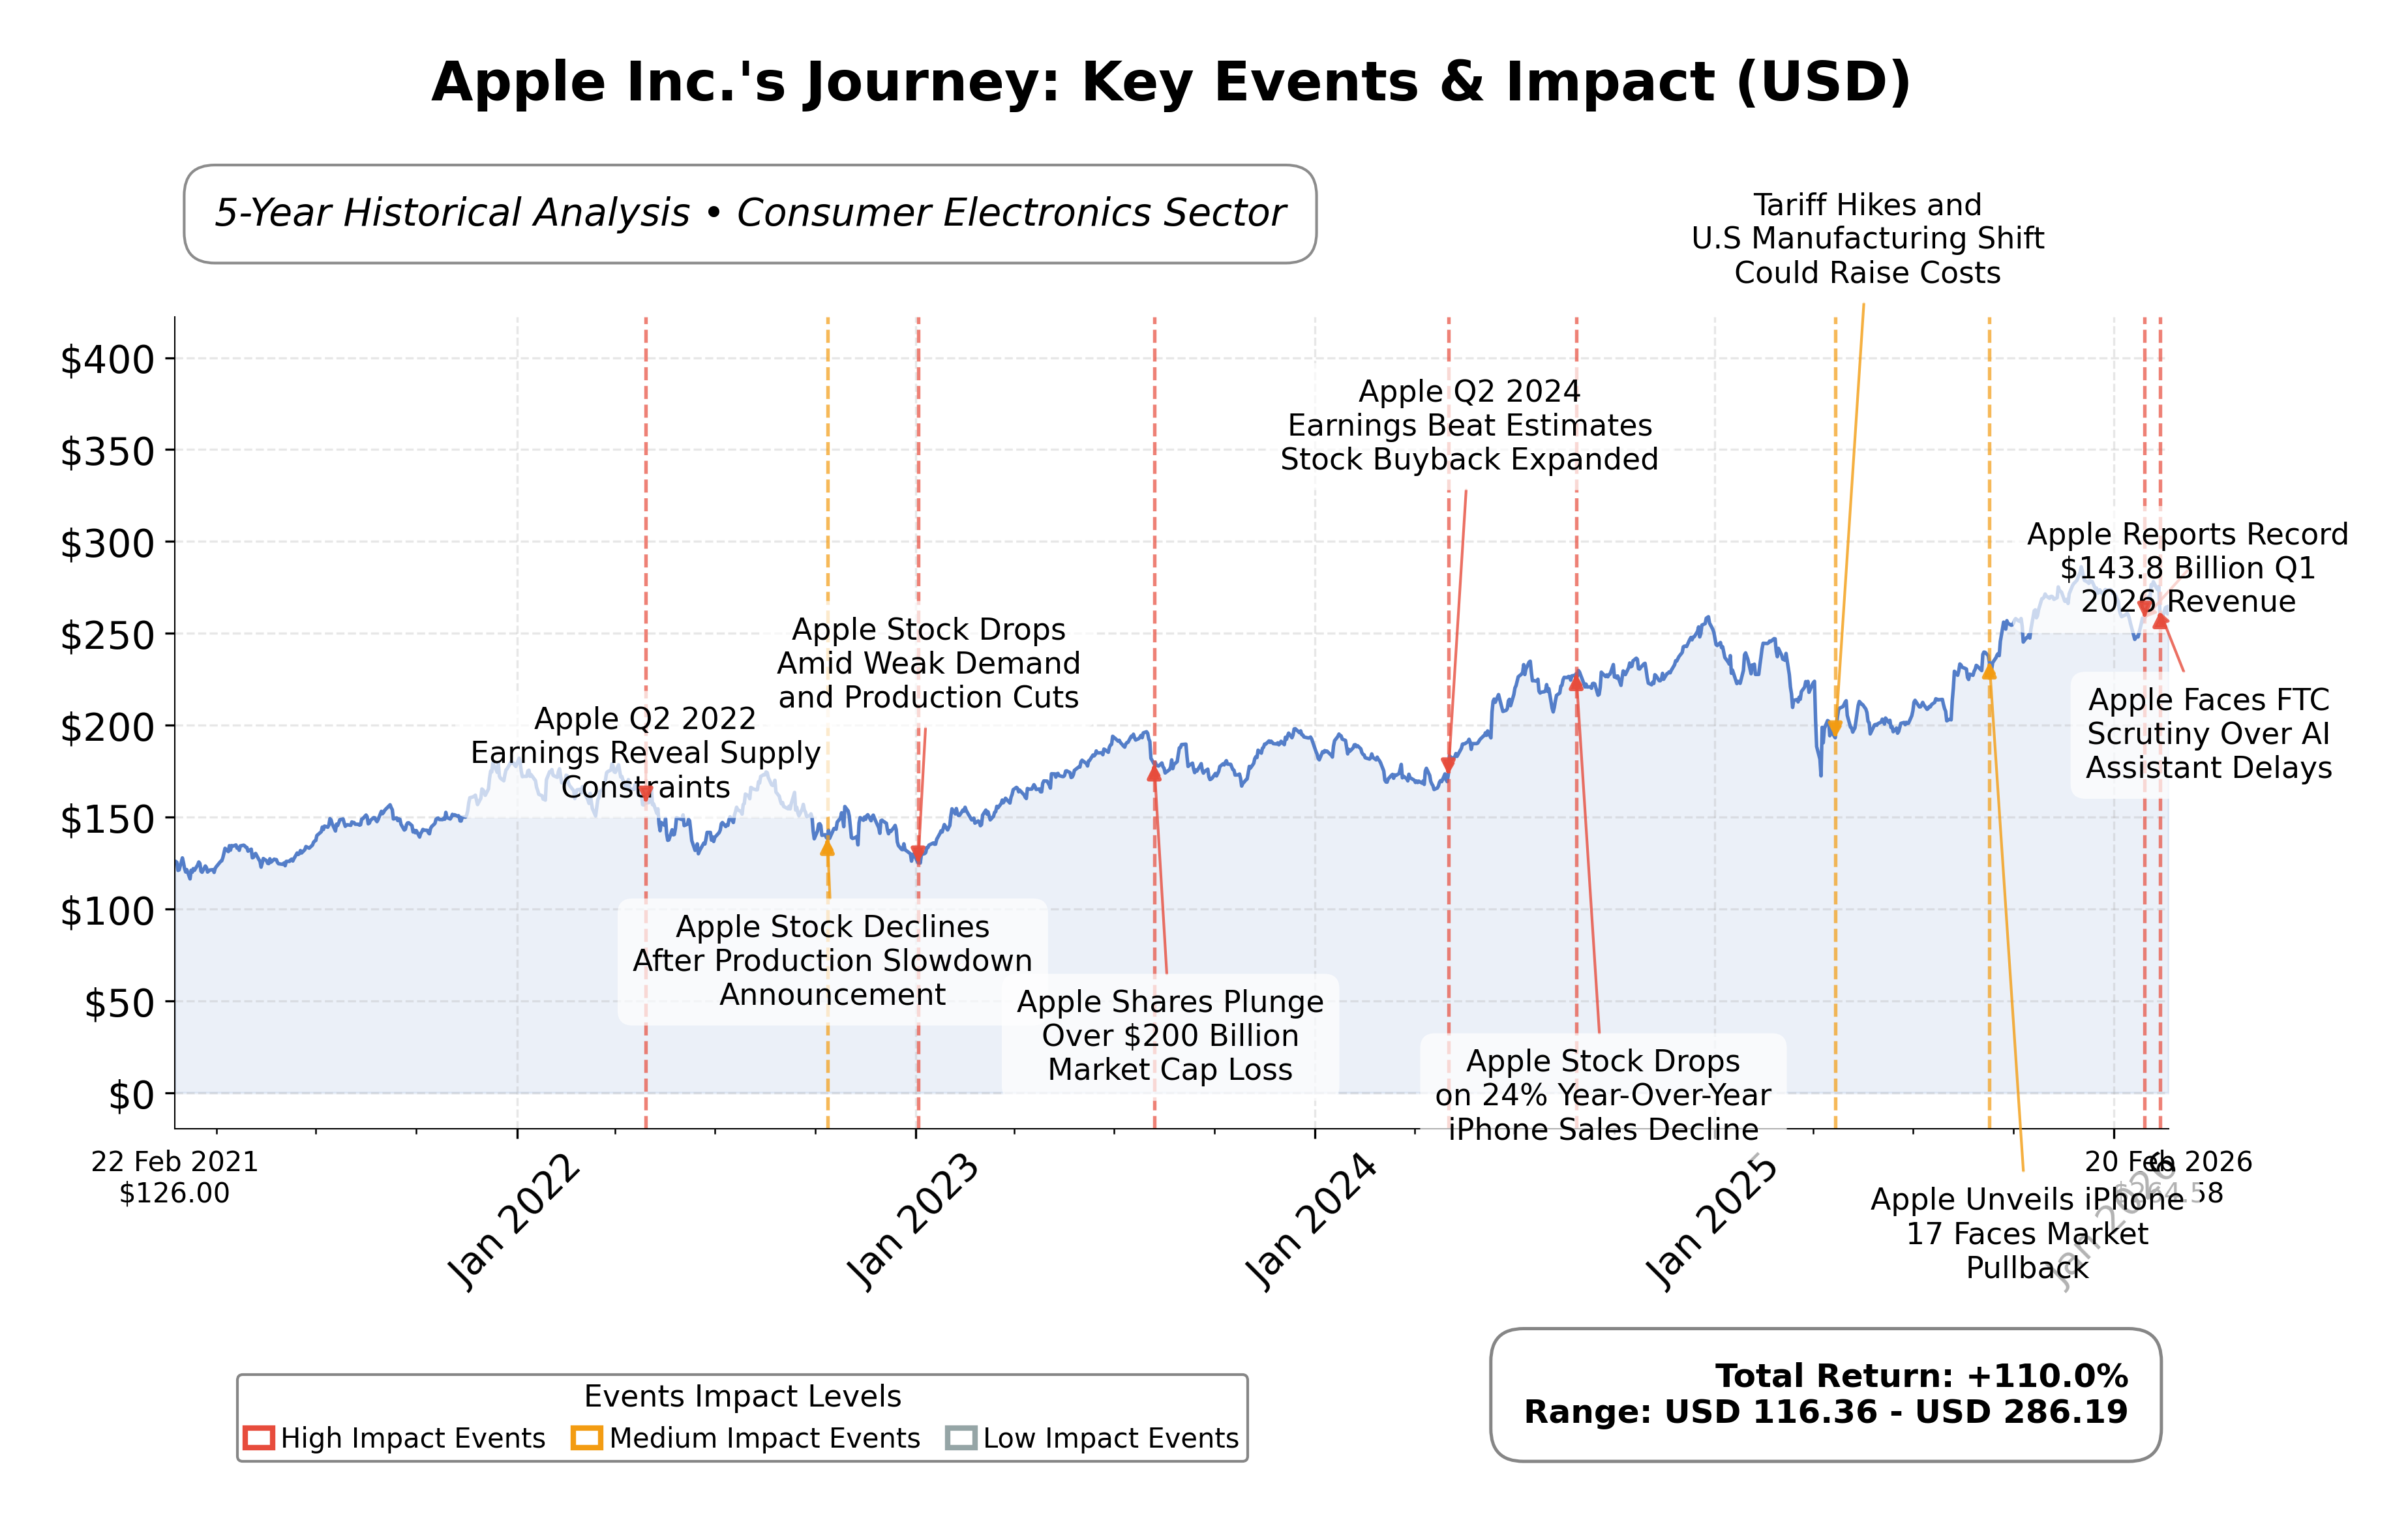
Stock Journey
Key Positives and Key Risks
Pros
- Strong revenue growth of 15.7% quarterly and earnings growth of 15.9% year-over-year highlight robust financial performance.
- Substantial cash reserves of $66.9 billion and free cash flow of $106.3 billion support financial stability and investment capacity.
- Dominant market capitalization of $3.89 trillion and premium valuation multiples reflect leadership and growth expectations.
Cons
- High trailing P/E ratio of 33.45 and price-to-book ratio of 44.11 indicate elevated valuation relative to peers.
- Regulatory and legal challenges, including lawsuits related to iCloud content, pose potential operational risks.
- Current ratio below 1 (0.974) suggests tight short-term liquidity which may impact operational flexibility.
Disclosure: This information is for general awareness and does not constitute investment advice
Report Summary
Apple Inc. is a leading technology company specializing in the design, manufacturing, and marketing of consumer electronics and software products. Its core offerings include the iPhone, Mac computers, iPad tablets, Apple Watch, and a suite of digital services such as the App Store, Apple Music, and iCloud. Operating within the consumer electronics industry and technology sector, Apple maintains a strong global presence and is recognized for its integrated ecosystem that enhances user experience and productivity.
Financially, Apple exhibits robust performance with a market capitalization of approximately $3.89 trillion and a trailing P/E ratio of 33.45, slightly above the industry average. The company reported a trailing twelve months (TTM) revenue of $435.6 billion and a net income of $117.8 billion, reflecting strong profitability with a profit margin of 27.0%. Key valuation metrics such as forward P/E at 28.45 and PEG ratio of 1.83 indicate moderate growth expectations relative to earnings. The balance sheet shows a total asset base of $379.3 billion and a debt-to-equity ratio near 0.95, suggesting a balanced capital structure.
From a technical and strategic perspective, Appleâs stock price currently trades near $264.59, with a 52-week high of $288.62 and low of $169.21, indicating upside potential of approximately 9.1%. The company benefits from solid momentum indicators and maintains price levels above key moving averages. Recent strategic initiatives include accelerated development of AI-powered wearable devices, while leadership remains stable. Notable risks include regulatory scrutiny exemplified by recent lawsuits and competitive pressures in the technology sector. Institutional shareholding exceeds 65%, reflecting strong confidence, though some recent position adjustments by major funds have been observed.
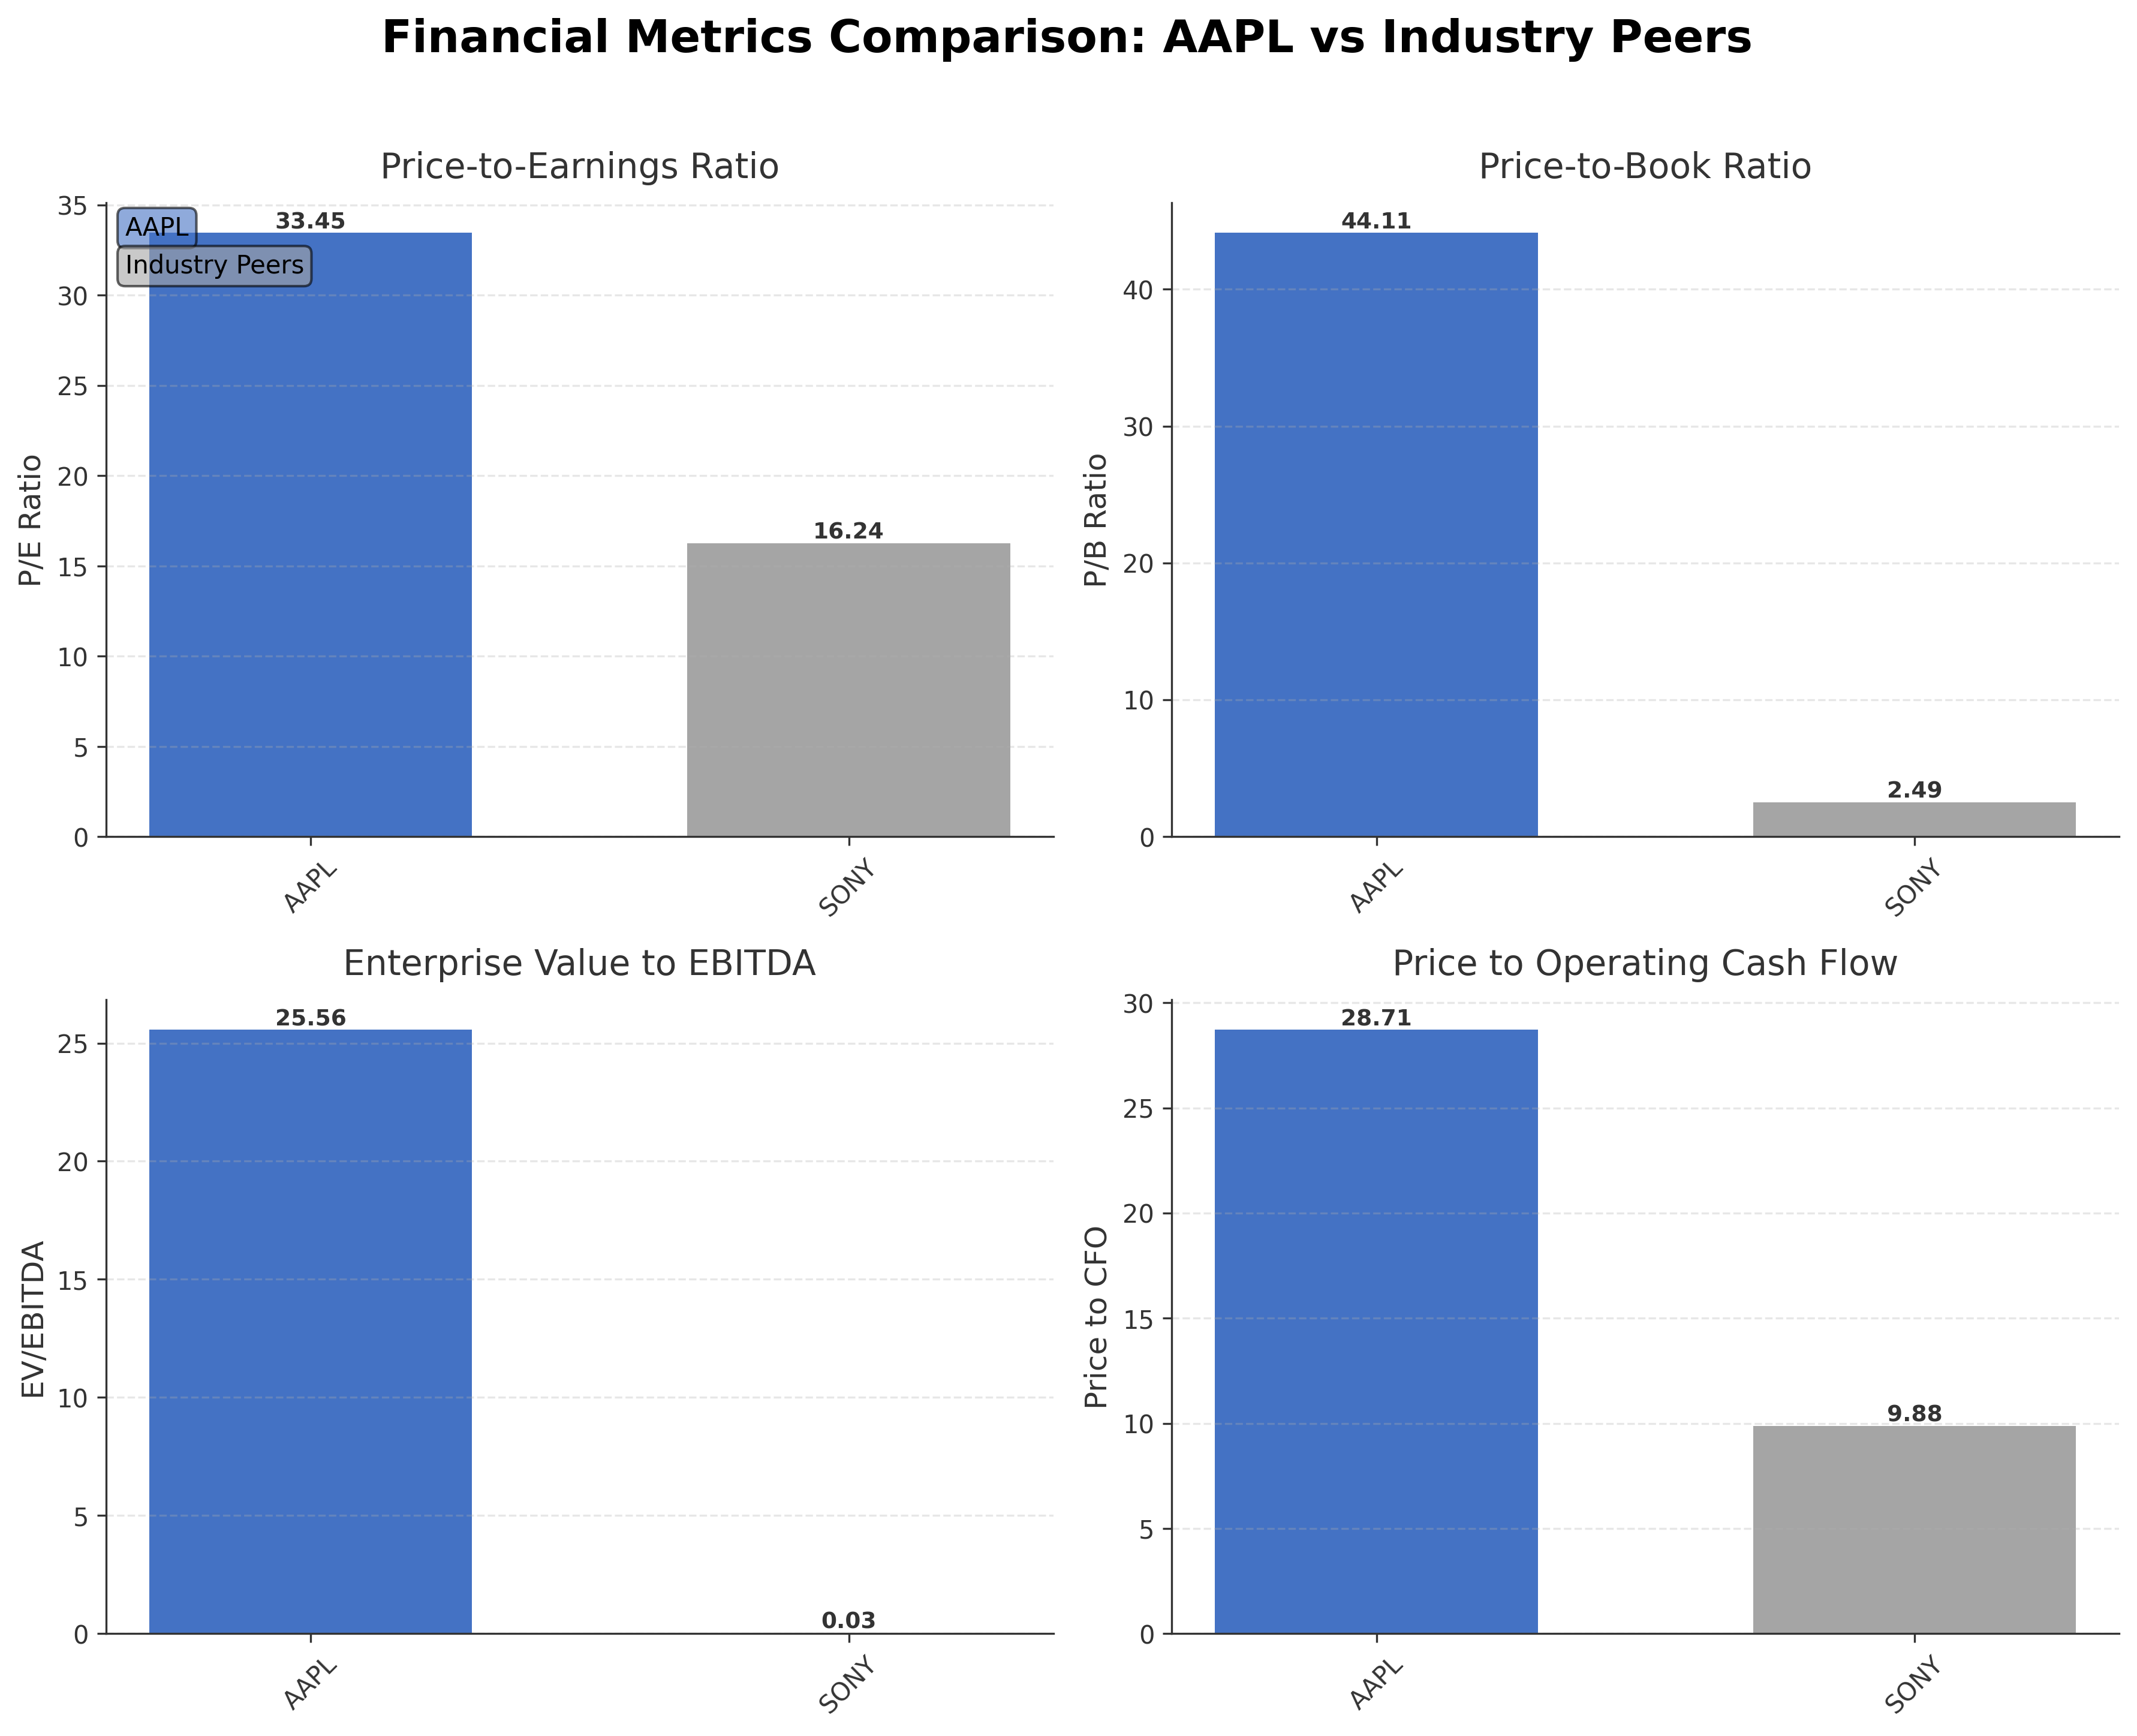
In peer comparison, Apple stands out with a significantly larger market capitalization and higher valuation multiples compared to regional peers such as Sony Group Corporation, which has a market cap of $130.78 billion and lower P/E and EV/EBITDA ratios. This disparity underscores Appleâs dominant market position and premium valuation within the consumer electronics industry in the United States. While peers may offer lower valuations, Appleâs scale and profitability metrics reflect its leadership and innovation capabilities.
Apple navigates a complex industry landscape marked by rapid technological evolution and regulatory challenges. Recent achievements include strong revenue growth and expansion into AI-driven hardware, while ongoing challenges involve legal disputes and competitive dynamics. The companyâs strategic direction and market conditions present pivotal moments that could influence its future trajectory. Given the current financial and market data, a balanced stance may be appropriate for those evaluating the stock, considering both the companyâs strengths and the external risks it faces.
Company and Industry Overview
Company Basics
Price Performance
Company Size
Shareholding Pattern
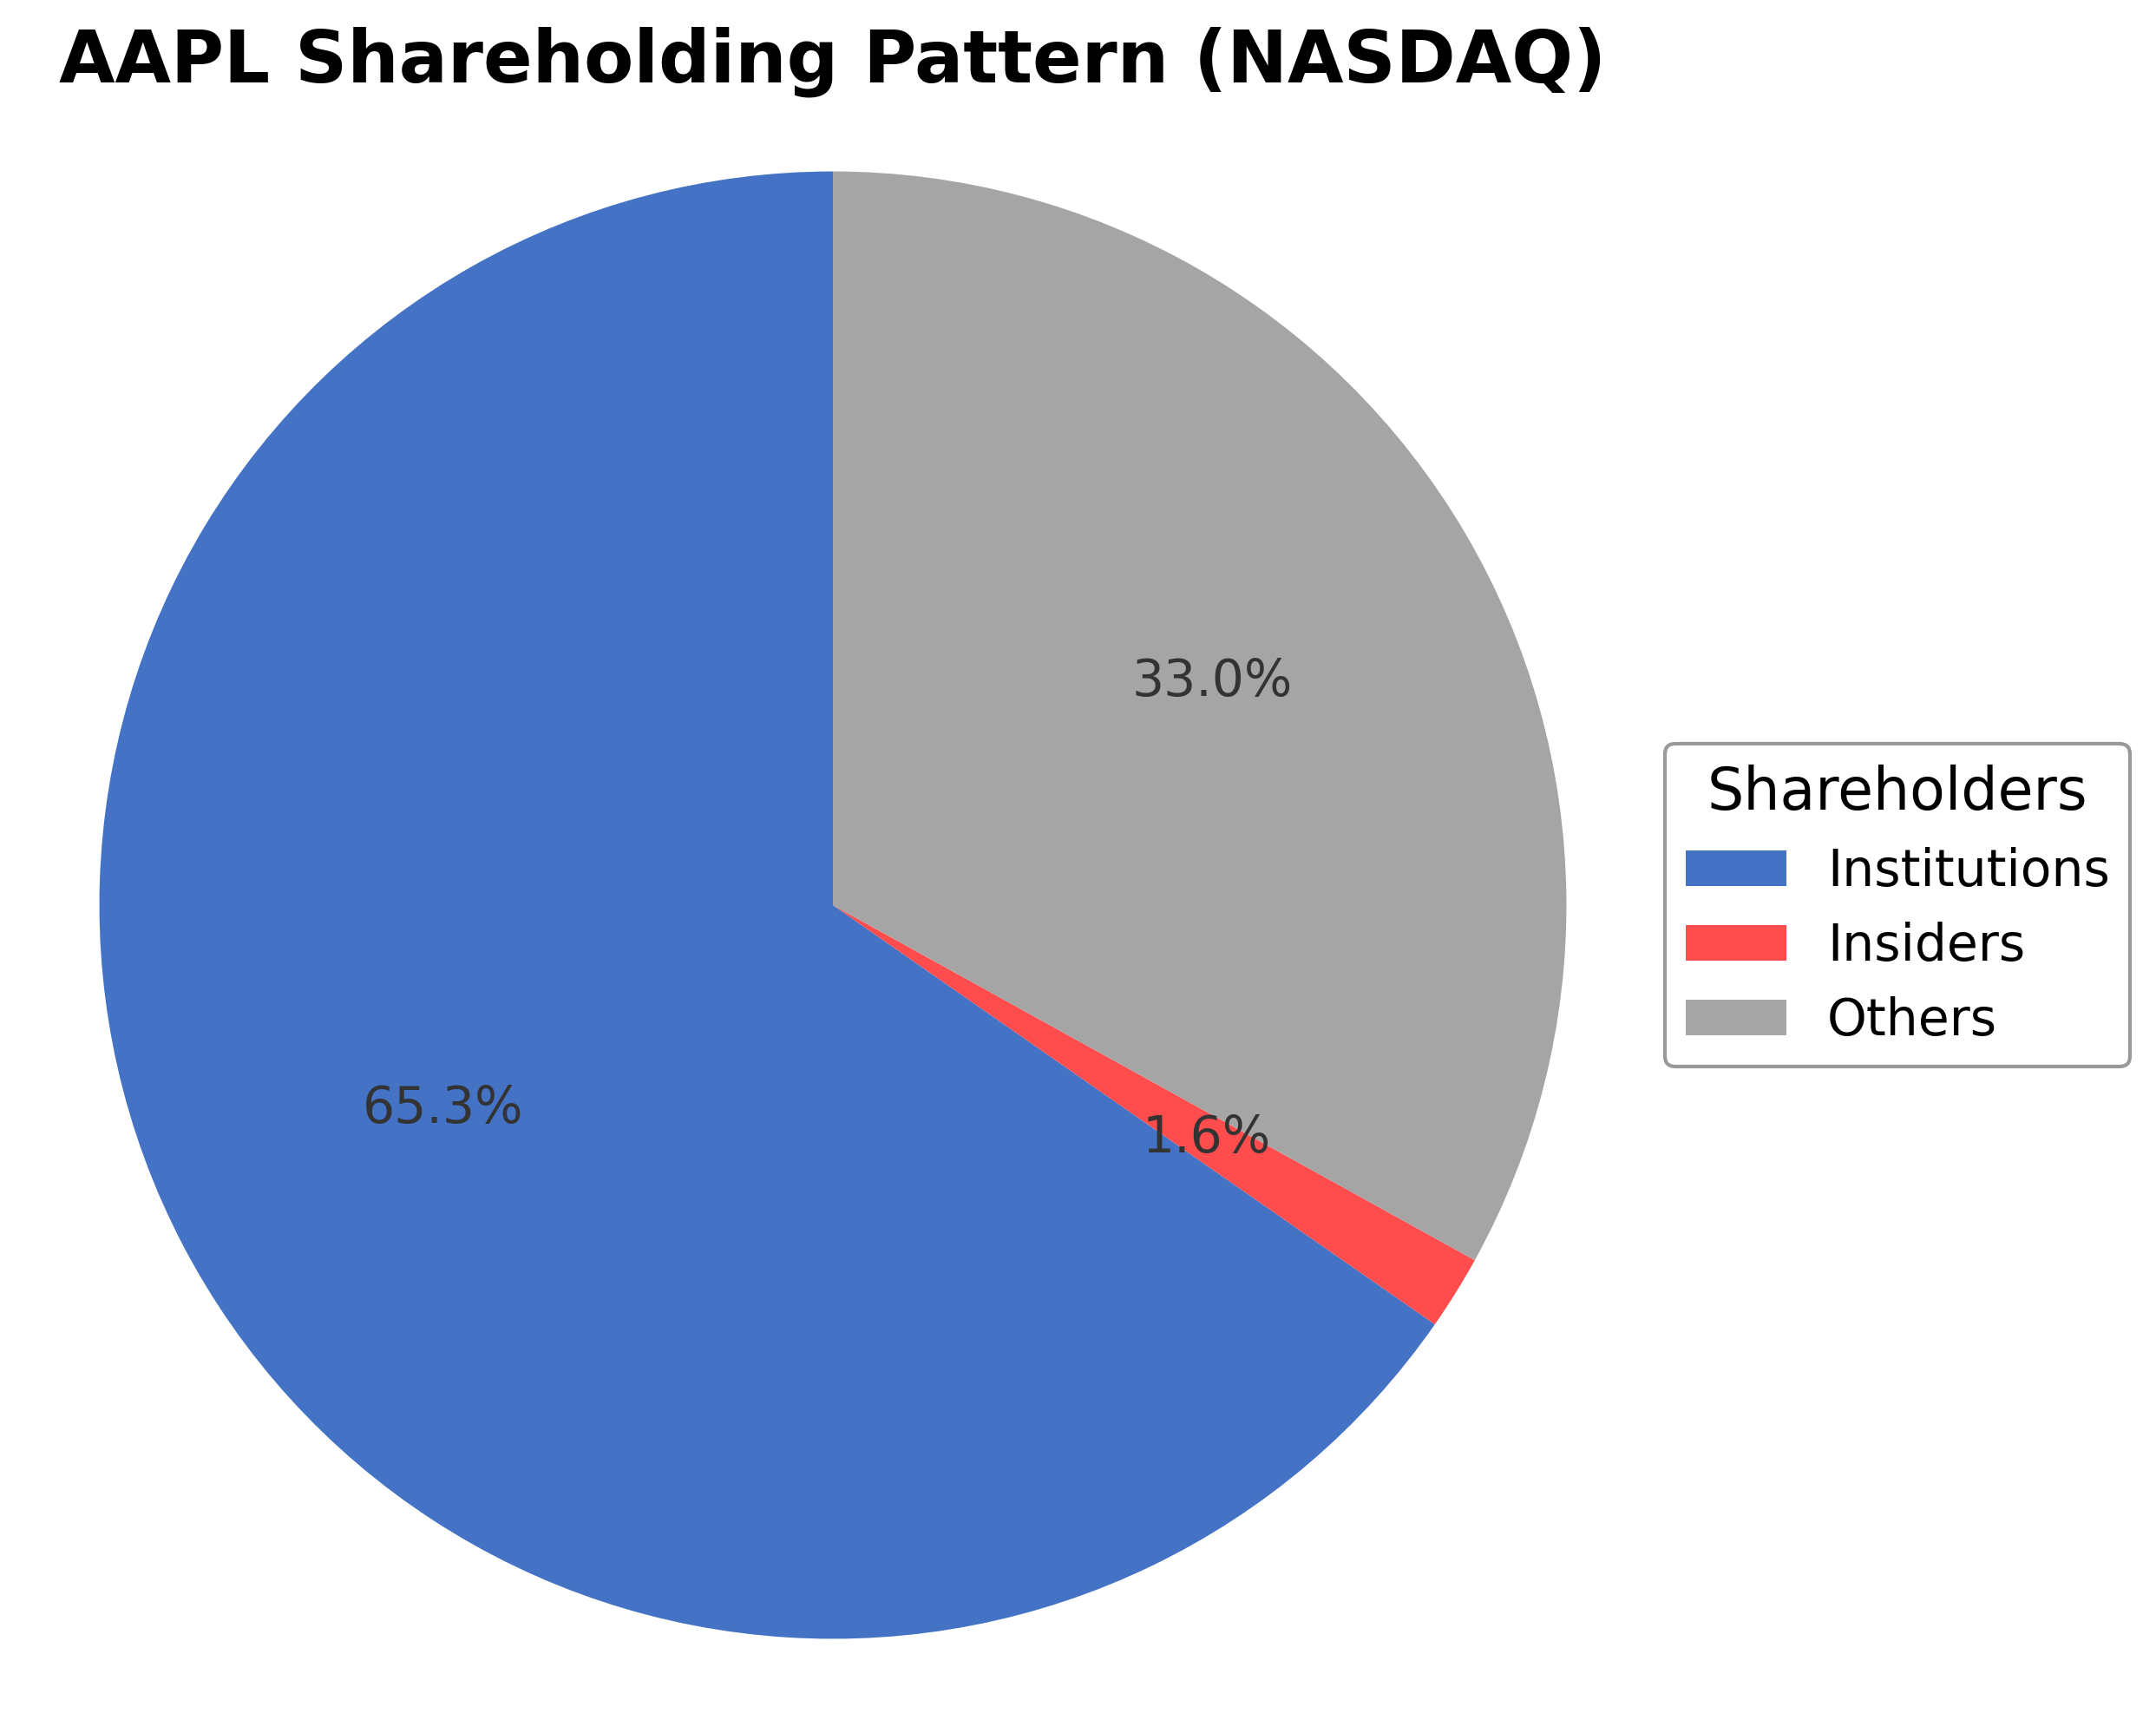
Apple Inc.'s ownership structure is characterized by a majority institutional investor presence at approximately 65.32%, with public shareholders comprising about 34.17%, and insiders holding a minimal 0.16%. Over the past 12-24 months, institutional holdings have shown some adjustments, with notable funds such as Drive Wealth Management LLC reducing their positions, while others like Rossmore Private Capital and Woodline Partners LP have increased stakes. This pattern suggests a mixed but generally positive market sentiment toward the company, reflecting confidence in its governance and strategic direction. The substantial institutional ownership supports stable governance frameworks and may influence future corporate actions, while the broad public ownership ensures liquidity and market participation. Operating within the consumer electronics industry, Apple leverages its integrated ecosystem and innovation focus to maintain leadership amid competitive and regulatory challenges.
Sector and Industry Analysis
Apple Inc. (AAPL) operates primarily within the Technology sector, specifically in the Consumer Electronics and Software industry segments. The global technology sector is one of the largest and fastest-growing markets worldwide, driven by rapid innovation, increasing digital adoption, and expanding consumer demand for connected devices and integrated ecosystems. Key players alongside Apple include Samsung, Microsoft, Google (Alphabet), and Amazon, each competing across hardware, software, and services. The sector’s growth trajectory remains robust, supported by advancements in semiconductor technology, 5G connectivity, artificial intelligence, and cloud computing, with market size projected to continue expanding as digital transformation accelerates across industries.
Within the consumer electronics and software industry, several notable trends are shaping the landscape. There is a pronounced shift toward ecosystem integration, where companies like Apple leverage hardware-software synergy to enhance user experience and lock in customers. Consumer behavior increasingly favors seamless, multi-device connectivity, subscription-based services, and personalized content delivery, fueling growth in areas such as streaming, augmented reality, and wearable technology. Additionally, the industry is witnessing a pivot toward sustainability and circular economy principles, impacting product design and supply chain management. Emerging opportunities lie in augmented reality (AR), virtual reality (VR), health tech, and IoT (Internet of Things), where innovation can drive new revenue streams beyond traditional device sales.
The regulatory environment for the technology sector is complex and evolving, with significant implications for companies like Apple. Key regulatory areas include data privacy and security (e.g., GDPR in Europe, CCPA in California), antitrust scrutiny, intellectual property rights, and cross-border trade policies. Governments worldwide are increasingly focused on regulating big tech firms to address concerns over market dominance, consumer data use, and competitive fairness. Compliance requirements are stringent, necessitating robust governance frameworks and proactive risk management. Policy impacts can influence product design, data handling practices, and market access, making regulatory agility a critical capability for sustained growth and operational resilience.
Competitive dynamics in the consumer electronics and software industry are characterized by high concentration among a few dominant firms, substantial capital and R&D intensity, and rapid innovation cycles. Barriers to entry are significant due to the need for advanced technological expertise, extensive supply chain networks, brand equity, and ecosystem development. Apple’s competitive positioning is strengthened by its vertically integrated model, proprietary software and silicon design, strong brand loyalty, and expansive services portfolio. The market structure encourages continuous innovation and strategic partnerships, with firms competing on product differentiation, user experience, and platform ecosystems. Emerging competitors and disruptive technologies pose ongoing challenges, necessitating sustained investment in innovation and customer engagement.
Note: Analysis synthesized from industry research, market reports, and regulatory filings. Information is subject to change based on market conditions.
Illustrative Scenario Analysis
DCF Assumptions:
Method: Two-Stage EPS-Priority Model
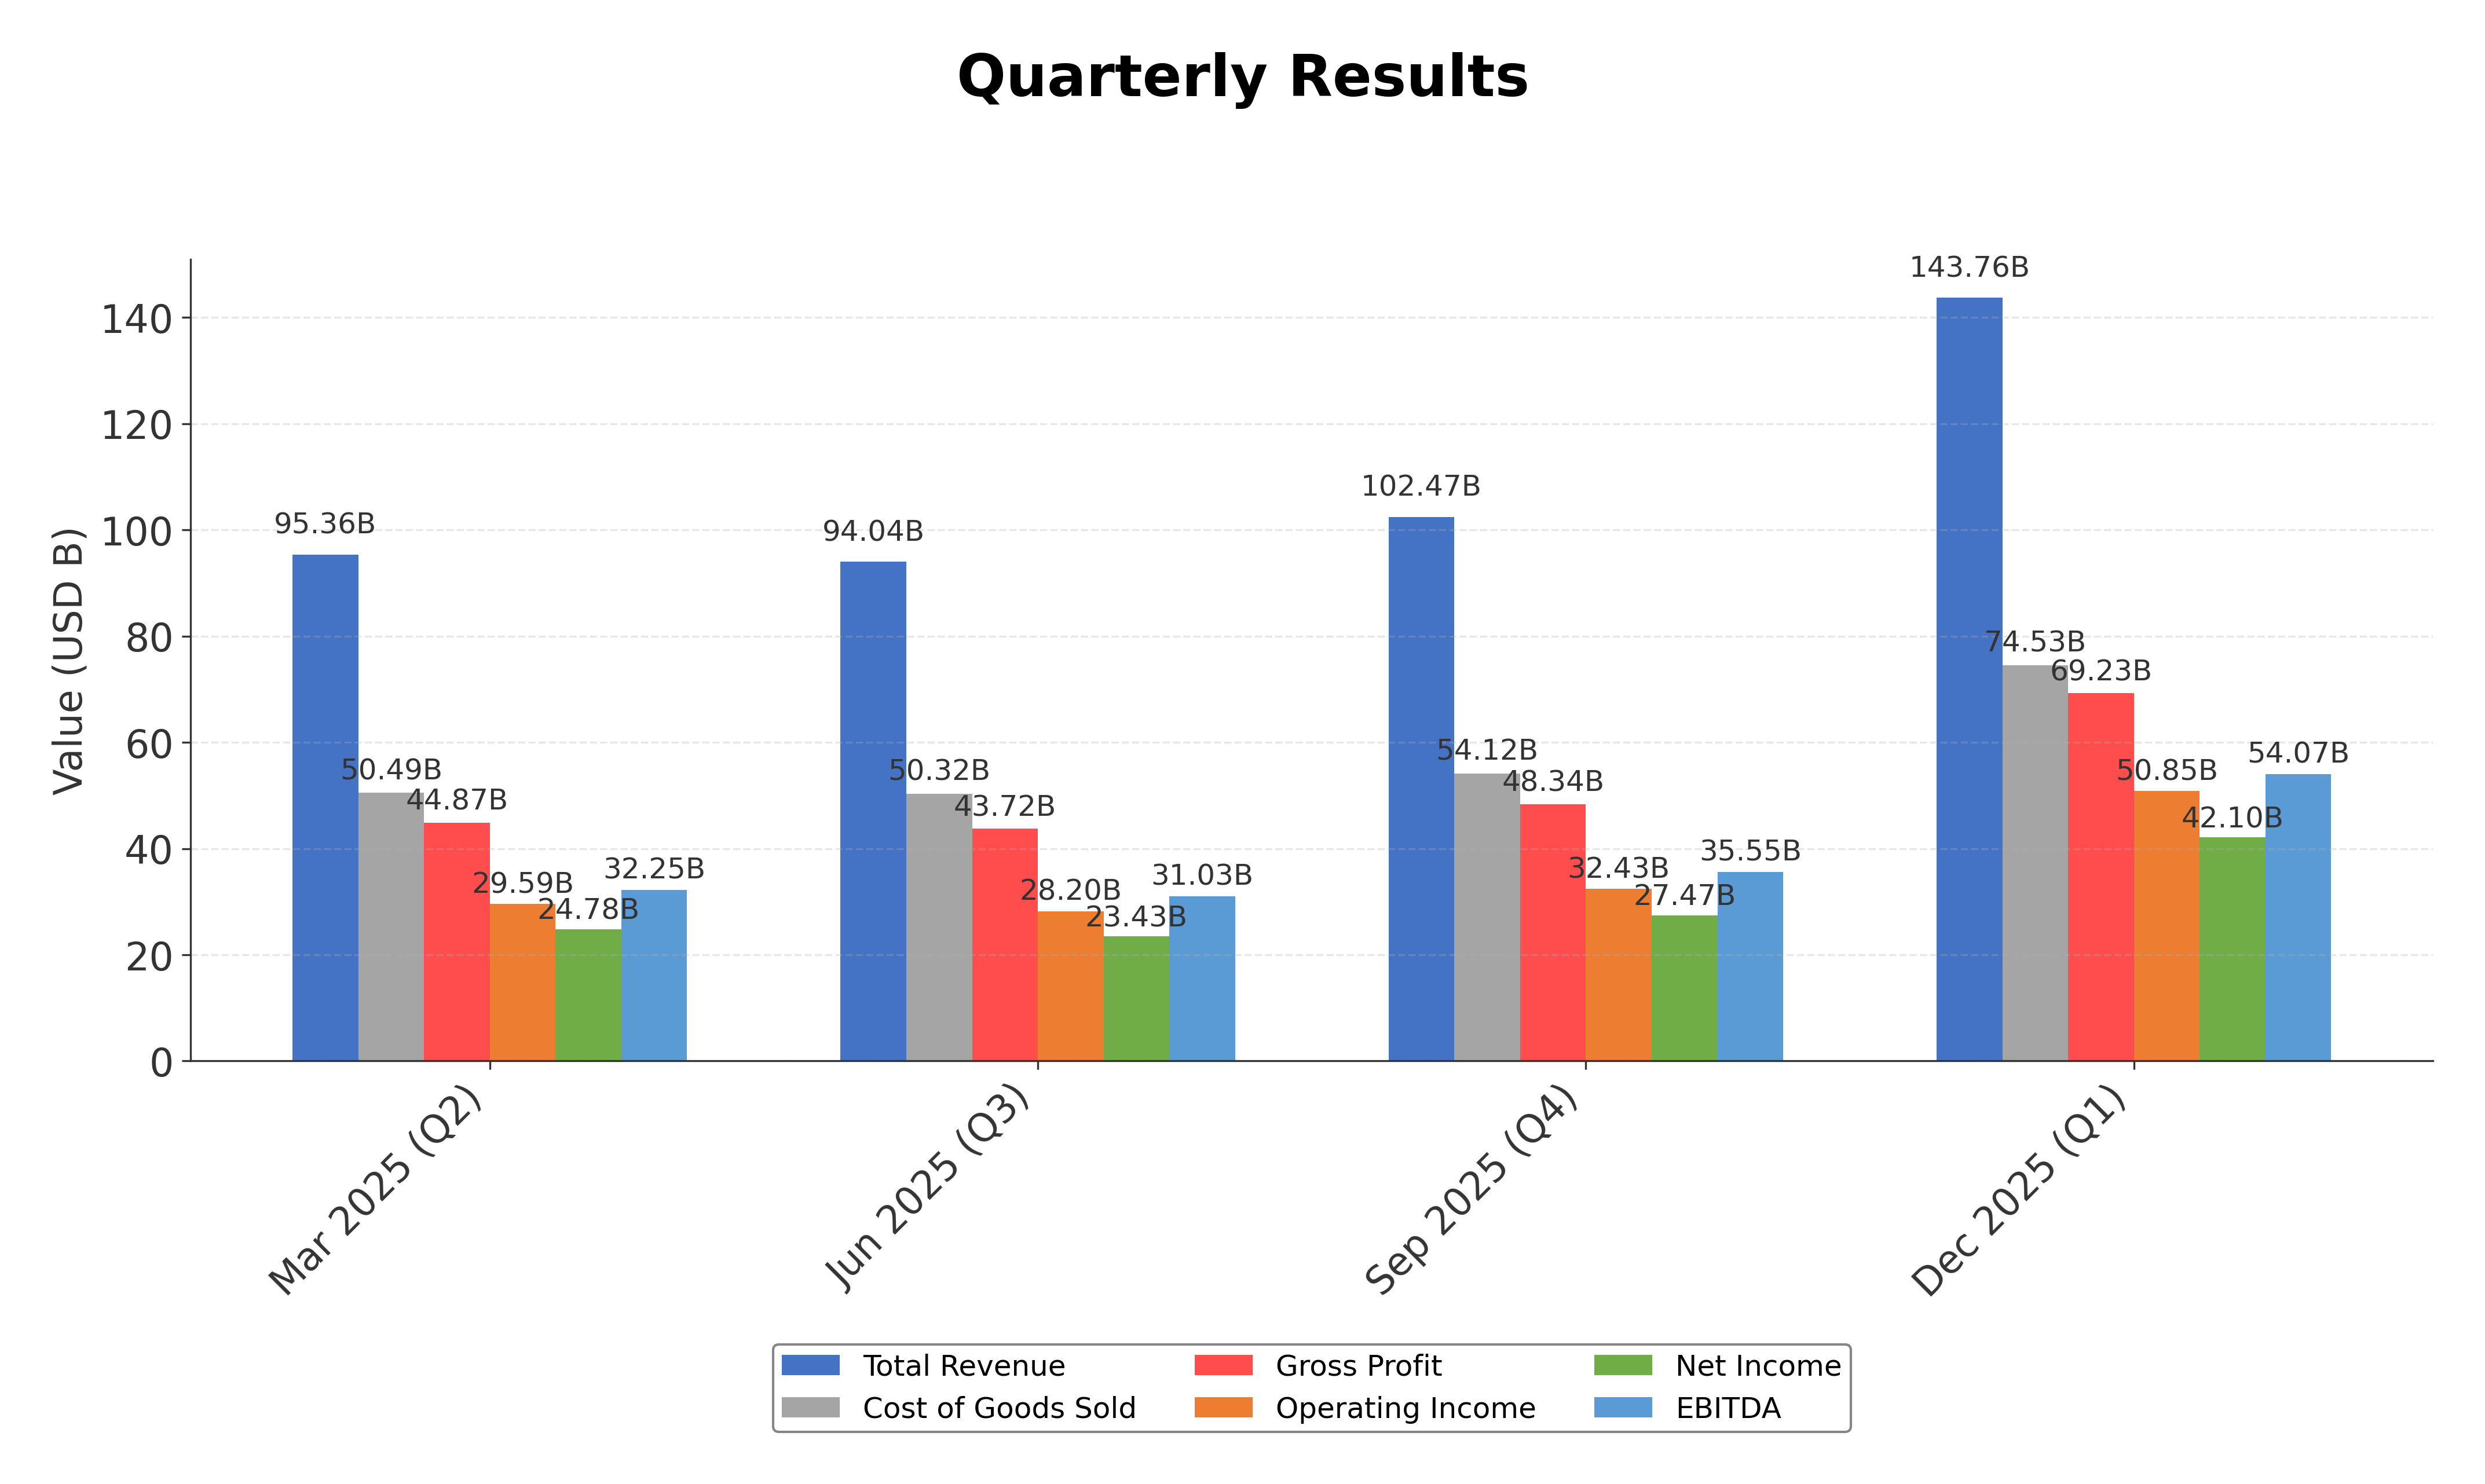
Financials
Peer Analysis
| Company Name | Market Cap | P/E Ratio | P/B Ratio | EV/EBITDA | Price to CFO |
|---|---|---|---|---|---|
| Apple Inc. | $3.89T | 33.45 | 44.11 | 25.56 | 28.71 |
| Sony Group Corporation - Sponsored American Depositary Receipt | $130.78B | 16.24 | 2.49 | 0.03 | 9.88 |
Comparison Analysis: Apple Inc. significantly surpasses its regional peer Sony Group Corporation in market capitalization, reflecting its dominant scale in the consumer electronics industry. Apple's valuation multiples, including a P/E ratio of 33.45 and EV/EBITDA of 25.56, are substantially higher than Sony's P/E of 16.24 and EV/EBITDA near zero, indicating a premium valuation likely driven by stronger profitability and growth prospects. The price-to-book ratio of 44.11 for Apple contrasts sharply with Sony's 2.49, underscoring Apple's substantial intangible assets and brand value. Price to CFO also favors Apple, suggesting efficient cash flow generation relative to market price. Overall, Apple exhibits leadership in financial metrics among its peers, though its elevated multiples reflect higher market expectations.
Financial Metrics Comparison with Peers
Financial Statements
Comprehensive financial data including income, balance sheet, and cash flow metrics
Income Statement
| fiscal_date | 2025-09-30 | 2024-09-30 | 2023-09-30 | 2022-09-30 | 2021-09-30 |
|---|---|---|---|---|---|
| Sales | 416.16B | 391.04B | 383.29B | 394.33B | 365.82B |
| Cost Of Goods | 220.96B | 210.35B | 214.14B | 223.55B | 212.98B |
| Gross Profit | 195.20B | 180.68B | 169.15B | 170.78B | 152.84B |
| Operating Expense Research And Development | 34.55B | 31.37B | 29.91B | 26.25B | 21.91B |
| Operating Expense Selling General And Administrative | 27.60B | 26.10B | 24.93B | 25.09B | 21.97B |
| Operating Income | 133.05B | 123.22B | 114.30B | 119.44B | 108.95B |
| Other Income Expense | -321.00M | 269.00M | -565.00M | -334.00M | 60.00M |
| Pretax Income | 132.73B | 123.48B | 113.74B | 119.10B | 109.21B |
| Income Tax | 20.72B | 29.75B | 16.74B | 19.30B | 14.53B |
| Net Income | 112.01B | 93.74B | 97.00B | 99.80B | 94.68B |
| Eps Basic | 7.49 | 6.11 | 6.16 | 6.15 | 5.67 |
| Eps Diluted | 7.46 | 6.08 | 6.13 | 6.11 | 5.61 |
| Basic Shares Outstanding | 14.95B | 15.34B | 15.74B | 16.22B | 16.70B |
| Diluted Shares Outstanding | 14.95B | 15.34B | 15.74B | 16.22B | 16.70B |
| Ebit | 133.05B | 123.22B | 114.30B | 119.44B | 111.85B |
| Ebitda | 144.75B | 134.66B | 125.82B | 130.54B | 123.14B |
| Net Income Continuous Operations | 112.01B | 93.74B | 97.00B | 99.80B | 94.68B |
| Non Operating Interest Income | N/A | N/A | 3.75B | 2.83B | 2.84B |
| Non Operating Interest Expense | N/A | N/A | 3.93B | 2.93B | 2.65B |
Data provided by Twelve Data
Balance Sheet
| fiscal_date | 2025-12-31 | 2025-09-30 | 2025-06-30 | 2025-03-31 | 2024-12-31 |
|---|---|---|---|---|---|
| Cash And Cash Equivalents | 45.32B | 35.93B | 36.27B | 28.16B | 30.30B |
| Accounts Receivable | 39.92B | 39.78B | 27.56B | 26.14B | 29.64B |
| Total Assets | 379.30B | 359.24B | 331.50B | 331.23B | 344.08B |
| Total Liabilities | 291.11B | 285.51B | 265.67B | 264.44B | 277.33B |
| Long Term Debt | 76.69B | 78.33B | 82.43B | 78.57B | 83.96B |
| Shareholders Equity | 88.19B | 73.73B | 65.83B | 66.80B | 66.76B |
Data provided by Twelve Data
Cash Flow Statement
| fiscal_date | 2025-09-30 | 2024-09-30 | 2023-09-30 | 2022-09-30 | 2021-09-30 |
|---|---|---|---|---|---|
| Operating Activities Net Income | 112.01B | 93.74B | 97.00B | 99.80B | 94.68B |
| Operating Activities Depreciation | 11.70B | 11.45B | 11.52B | 11.10B | 11.28B |
| Operating Activities Stock Based Compensation | 12.86B | 11.69B | 10.83B | 9.04B | 7.91B |
| Operating Activities Other Non Cash Items | -89.00M | -2.27B | -2.23B | 1.01B | -4.92B |
| Operating Activities Accounts Receivable | -7.03B | -5.14B | -417.00M | -9.34B | -14.03B |
| Operating Activities Accounts Payable | 902.00M | 6.02B | -1.89B | 9.45B | 12.33B |
| Operating Activities Other Assets Liabilities | -18.87B | 2.77B | -4.27B | 1.57B | -1.53B |
| Operating Activities Operating Cash Flow | 111.48B | 118.25B | 110.54B | 123.52B | 100.94B |
| Investing Activities Capital Expenditures | -12.71B | -9.45B | -10.96B | -10.71B | -11.09B |
| Investing Activities Purchase Of Investments | -24.41B | -48.66B | -29.51B | -76.92B | -109.56B |
| Investing Activities Sale Of Investments | 53.80B | 62.35B | 45.51B | 67.36B | 106.48B |
| Investing Activities Other Investing Activity | -1.48B | -1.31B | -1.34B | -2.09B | -385.00M |
| Investing Activities Investing Cash Flow | 15.20B | 2.94B | 3.71B | -22.66B | -14.58B |
| Financing Activities Long Term Debt Issuance | 4.48B | 0.00 | 5.23B | 5.46B | 20.39B |
| Financing Activities Long Term Debt Payments | -10.93B | -9.96B | -11.15B | -9.54B | -8.75B |
| Financing Activities Short Term Debt Issuance | -2.03B | 3.96B | -3.98B | 3.96B | 1.02B |
| Financing Activities Common Stock Repurchase | -90.71B | -94.95B | -77.55B | -89.40B | -85.97B |
| Financing Activities Common Dividends | -15.42B | -15.23B | -15.03B | -14.84B | -14.47B |
| Financing Activities Other Financing Charges | -6.07B | -5.80B | -6.01B | -6.38B | -5.58B |
| Financing Activities Financing Cash Flow | -120.69B | -121.98B | -108.49B | -110.75B | -92.25B |
| End Cash Position | 35.93B | 29.94B | 30.74B | 24.98B | 35.93B |
| Income Tax Paid | 43.37B | 26.10B | 18.68B | 19.57B | 25.39B |
| Free Cash Flow | 98.77B | 108.81B | 99.58B | 111.44B | 92.95B |
| Interest Paid | N/A | N/A | 3.80B | 2.87B | 2.69B |
| Operating Activities Deferred Taxes | N/A | N/A | N/A | 895.00M | -4.77B |
| Investing Activities Net Acquisitions | N/A | N/A | N/A | -306.00M | -33.00M |
| Financing Activities Common Stock Issuance | N/A | N/A | N/A | N/A | 1.10B |
Data provided by Twelve Data
Technical Analysis
Key Insights
- Apple's current trend shows a bullish momentum with price action maintaining above the 50-day moving average ($266.38) and 200-day moving average ($240.85), indicating sustained upward movement.
- Key support levels are identified near $240 and $260, while resistance is observed around the 52-week high of $288.62.
- The stock price is trading above its 10-day, 50-day, and 200-day moving averages, suggesting positive medium- and long-term trends.
- Momentum indicators show RSI near neutral to slightly overbought levels, MACD indicates positive momentum, and Stochastic oscillators confirm short-term strength.
- Multi-timeframe analysis across daily, weekly, and monthly charts reveals consistent upward trends with occasional consolidations.
- Current technical setup suggests potential continuation of the upward trend with possible short-term pullbacks near resistance zones.
Trending News
1. Headline: Drive Wealth Management LLC Reduces Apple Position by 16.1%
Summary: Drive Wealth Management LLC trimmed its position in Apple Inc. by 16.1% during the third quarter, holding 56,678 shares after selling 10,903 shares, reflecting a cautious stance amid market fluctuations.
Sentiment: Negative
2. Headline: Supreme Court Decision Impacts Apple’s $3.3 Billion Tariff Bill
Summary: The Supreme Court ruling affects Apple’s tariff obligations, with CEO Tim Cook attending the 60th presidential inauguration, highlighting ongoing regulatory challenges impacting the company’s financials.
Sentiment: Neutral
3. Headline: Salomon & Ludwin, LLC Increases Apple Stake by 1.03%
Summary: Salomon & Ludwin, LLC purchased an additional 710 shares of Apple, raising its total holdings to 69,693 shares valued at approximately $18.6 million, signaling confidence in the company’s prospects.
Sentiment: Positive
4. Headline: Rossmore Private Capital Boosts Apple Position by 1.1%
Summary: Rossmore Private Capital increased its holdings in Apple by 1.1% during the third quarter, owning 204,242 shares, reflecting a positive outlook on the company’s performance.
Sentiment: Positive
5. Headline: Lockheed Martin Investment Management Co. Reduces Apple Shares by 27.3%
Summary: Lockheed Martin Investment Management Co. decreased its Apple holdings by 27.3% in the third quarter, holding 493,180 shares after selling a significant portion, indicating a shift in portfolio allocation.
Sentiment: Negative
Powered by Brave
Recent Updates
News Summary
Recent news highlights a legal challenge with West Virginia suing Apple over alleged child sexual abuse material stored and shared on iCloud, marking a significant regulatory risk. The company faces scrutiny from government agencies, with calls for enhanced monitoring systems. Meanwhile, market sentiment remains mixed as Evercore ISI notes bullish sentiment for Apple amid hardware memory price spikes, contrasting with cautious views on valuation. Apple is also accelerating development of AI-powered wearable devices, signaling strategic innovation efforts despite regulatory and legal headwinds. These developments collectively impact Apple's operational environment, investor perception, and future growth prospects within a competitive technology landscape.
News Sentiment
Sentiment analysis reveals a nuanced picture with positive signals from strategic innovation and some institutional buying, counterbalanced by negative regulatory and legal challenges. Sources vary from neutral to slightly positive or negative, reflecting uncertainty but also confidence in Apple's adaptability and market position. The overall sentiment suggests cautious optimism with attention to emerging risks and opportunities.
Analytical Overview
Analysis Summary
Apple's valuation metrics, including a trailing P/E of 33.45 and forward P/E of 28.45, are elevated relative to the industry average P/E of 33.45, indicating a premium valuation consistent with its market leadership and growth prospects.
The company demonstrates a strong growth trajectory with quarterly revenue growth of 15.7% and earnings growth of 15.9% year-over-year, supported by substantial operating and free cash flows.
Financial health appears solid with a debt-to-equity ratio near 0.95 and robust cash reserves of approximately $66.9 billion, though the current ratio below 1 suggests tight short-term liquidity.
Sector-specific challenges include regulatory scrutiny and competitive pressures, while opportunities arise from innovation in AI-powered wearables and expanding services revenue.
Consideration of market positioning and competitive advantages highlights Apple's integrated ecosystem and brand strength as key differentiators in the global technology landscape.
Investment Conclusion
Supporting Factors: Primary supporting factors include strong revenue and earnings growth, substantial cash flow generation, and a dominant market position with a diversified product and services portfolio.
Risk Factors: Main risk factors to monitor involve regulatory challenges, legal disputes, and valuation levels that reflect high market expectations.
SWOT Analysis
Strengths
- Market leadership with a strong global brand and ecosystem integration.
- Robust revenue growth and high profit margins.
- Substantial cash reserves and strong free cash flow generation.
- Diverse product and services portfolio enhancing customer loyalty.
Weaknesses
- High valuation multiples relative to industry peers.
- Current ratio below 1 indicating tight short-term liquidity.
- Dependence on flagship products like the iPhone for majority of revenue.
- Limited insider ownership which may affect alignment with shareholders.
Opportunities
- Expansion into AI-powered wearable devices and new hardware categories.
- Growth in digital services and subscription-based revenue streams.
- Potential market share gains in emerging markets.
- Strategic partnerships and acquisitions to enhance innovation.
Threats
- Regulatory and legal challenges including lawsuits related to content management.
- Intense competition in the consumer electronics and technology sectors.
- Supply chain disruptions impacting product availability and costs.
- Macroeconomic factors affecting consumer spending and technology investment.
Company Description
Apple Inc. is a leading technology company renowned for designing, manufacturing, and marketing innovative hardware and software products for consumers and businesses worldwide. Its flagship product, the iPhone, accounts for the majority of sales, serving as the central hub of an expansive ecosystem that includes Mac computers, iPad tablets, Apple Watch wearables, and accessories like AirPods. Apple Inc. also offers a suite of services such as the App Store, Apple Music, iCloud, Apple TV+, and Apple Fitness+, providing digital content, cloud storage, and subscription-based platforms. Operating in the consumer electronics industry within the technology sector, the company employs approximately 166,000 people and maintains a broad global presence through online stores, retail outlets, and partnerships with carriers and resellers. With a substantial market capitalization reflecting its scale, Apple Inc. plays a pivotal role in shaping consumer technology trends, emphasizing seamless integration across devices and services to enhance user experience and productivity.