


Apple Inc (AAPL)
Stock Analysis Report
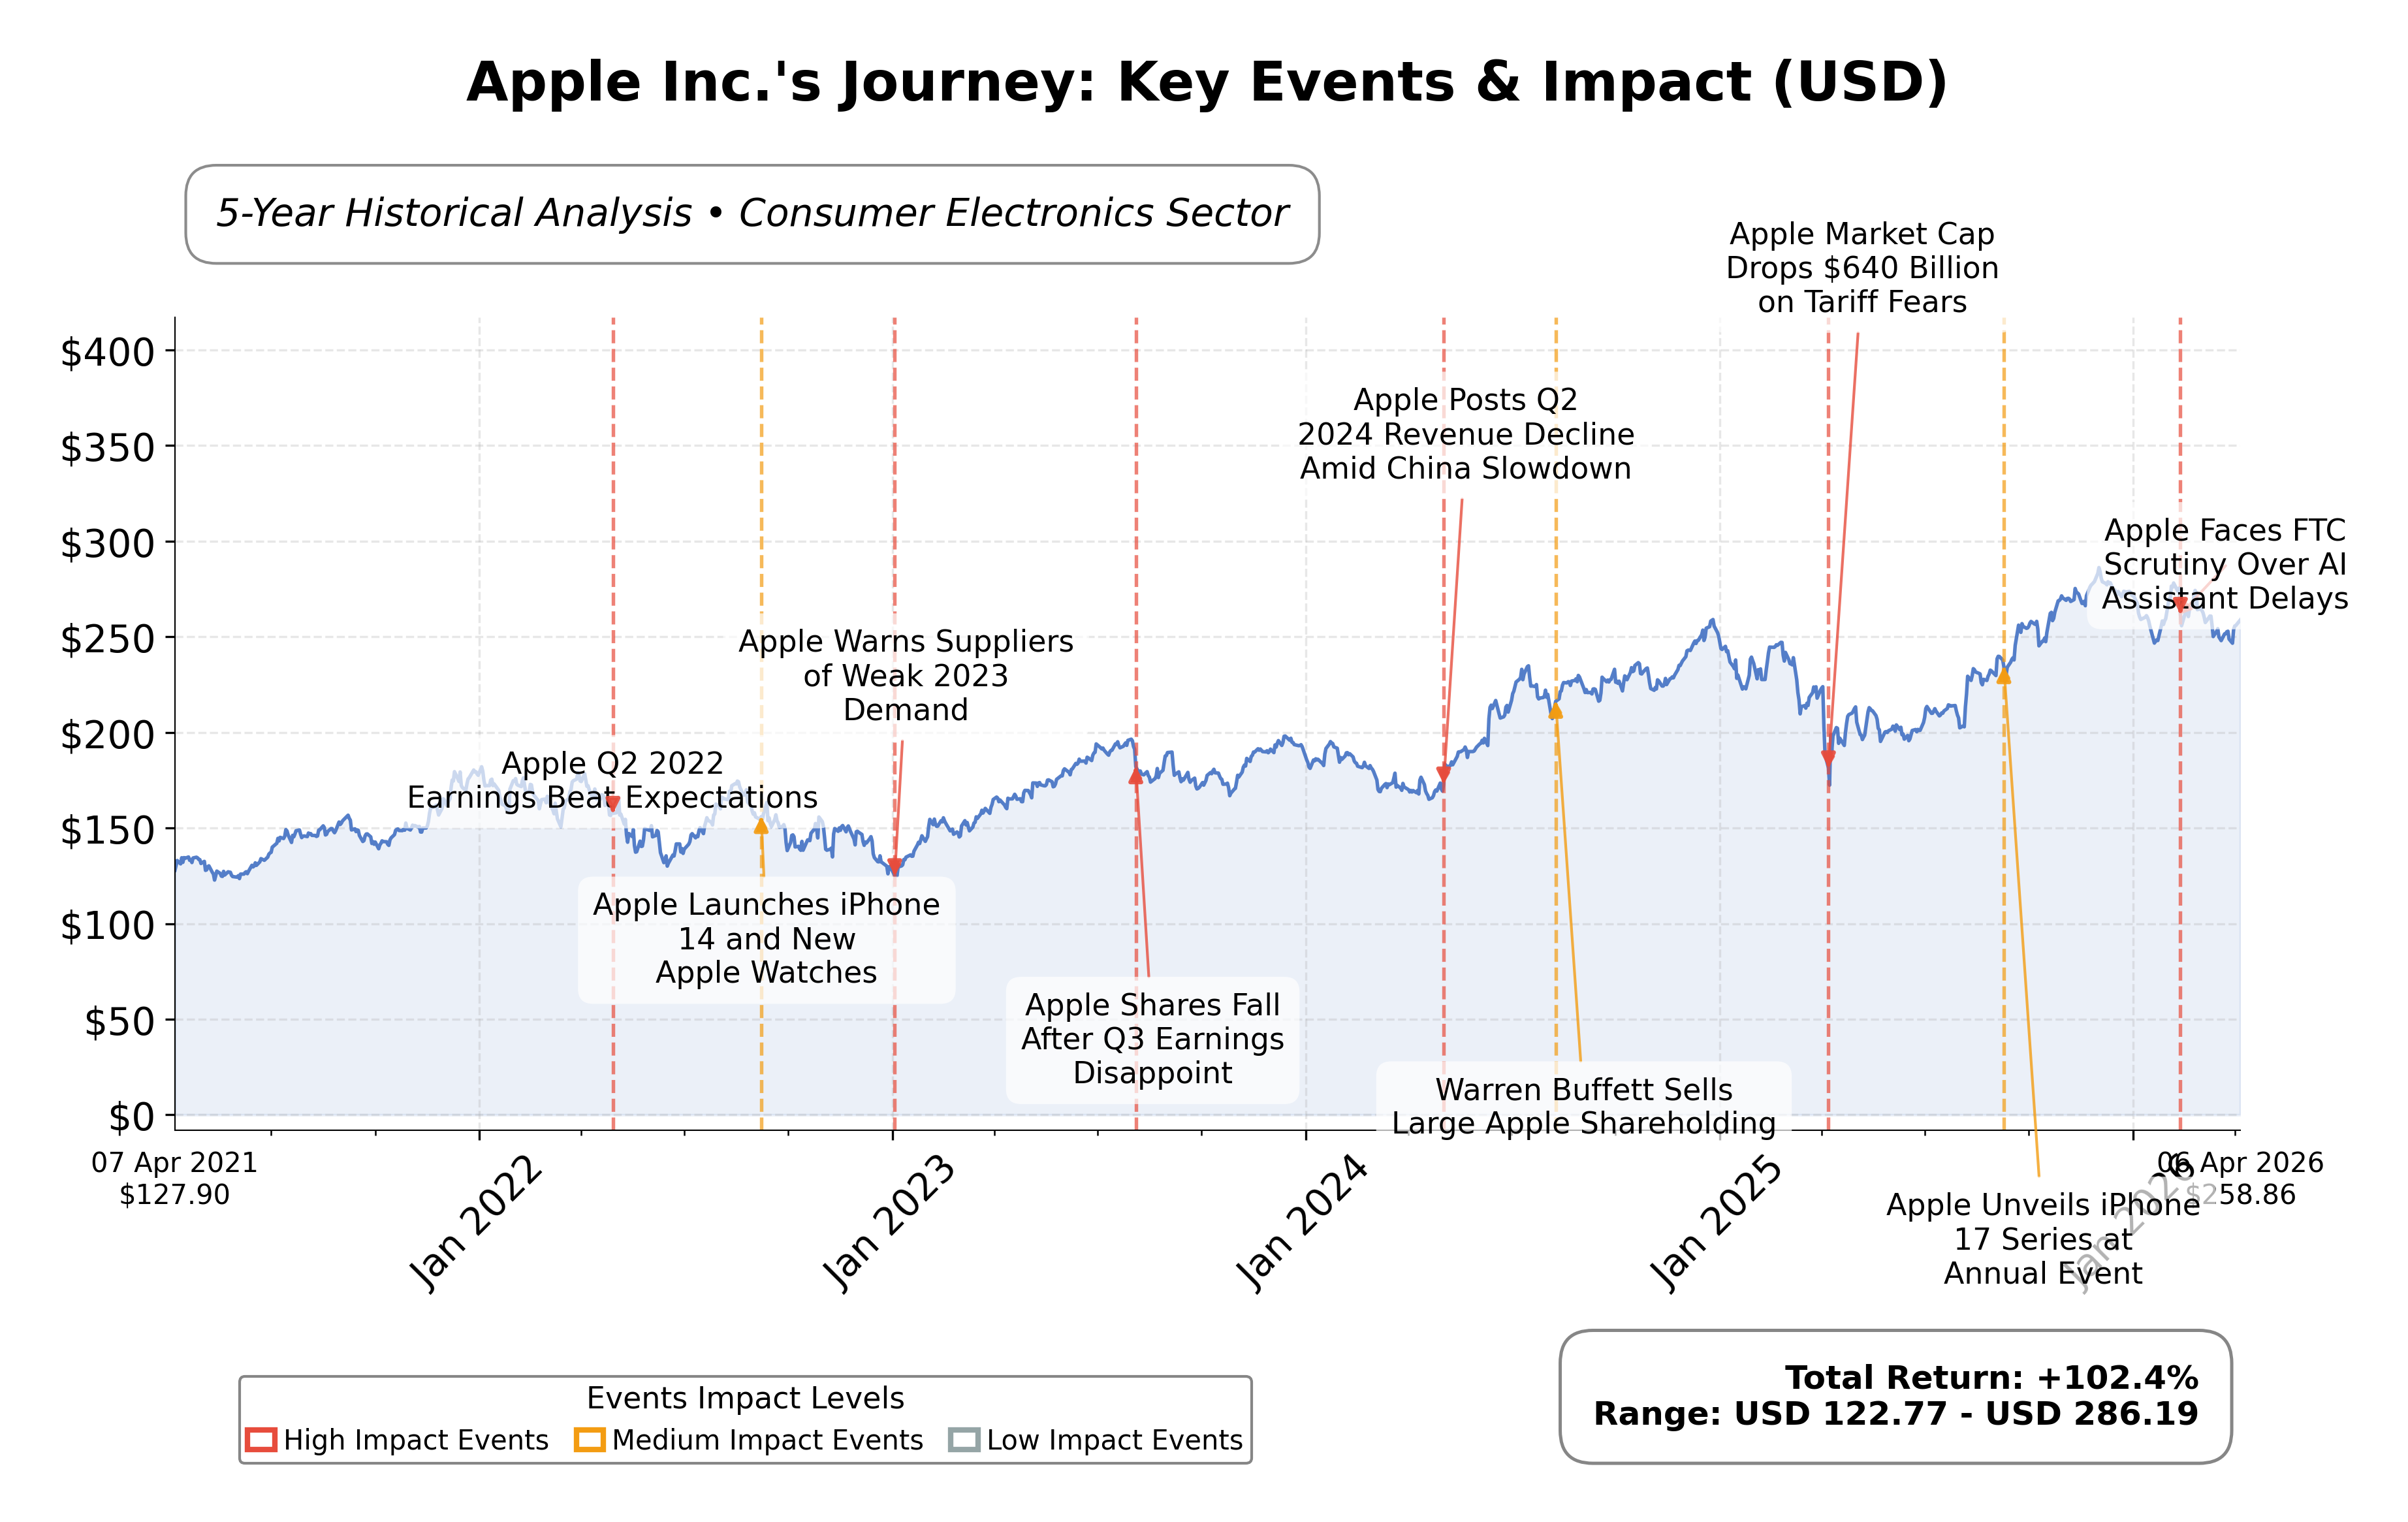
Stock Journey
Key Positives and Key Risks
Pros
- Market capitalization of $3.76 trillion underscores dominant industry position and scale.
- Quarterly revenue growth of 15.7% and earnings growth of 15.9% indicate strong growth trajectory.
- Operating cash flow of approximately $135.5 billion supports financial flexibility and innovation.
Cons
- High price-to-book ratio of 42.67 suggests premium valuation that may limit upside.
- Current ratio of 0.974 indicates tight short-term liquidity conditions.
- Debt-to-equity ratio of 102.63 reflects relatively high leverage compared to peers.
Disclosure: This information is for general awareness and does not constitute investment advice
Report Summary
Apple Inc. is a leading technology company specializing in designing, manufacturing, and marketing consumer electronics and software products globally. Operating primarily in the consumer electronics industry within the technology sector, Apple is renowned for its flagship iPhone, alongside a broad ecosystem including Mac computers, iPads, wearables, and digital services such as the App Store and Apple Music. The company maintains a significant global presence through retail stores and partnerships, positioning itself as a dominant player in the technology market.
Financially, Apple demonstrates robust performance with a trailing twelve-month revenue of approximately $435.6 billion and net income of $117.8 billion. Key valuation metrics include a market capitalization of about $3.76 trillion, a trailing P/E ratio of 32.35, and a forward P/E of 27.47. The company maintains strong profitability with a gross margin near 48.16% and an operating margin of 35.37%. Its return on equity stands at 1.52%, supported by solid operating cash flow and free cash flow generation exceeding $135 billion and $106 billion respectively.
Technically, Appleâs stock is trading near $251.42, with a 52-week range between $169.21 and $288.62, indicating an upside potential of approximately 14.8%. The stock remains above its 200-day moving average, reflecting sustained momentum. Recent strategic initiatives include product launches such as the MacBook Neo and anticipated foldable iPhone, alongside leadership continuity. Notable strengths include a diversified product ecosystem and strong cash flows, while risks involve competitive pressures and supply chain challenges. Market sentiment is mixed with recent institutional buying and some profit-taking activity.
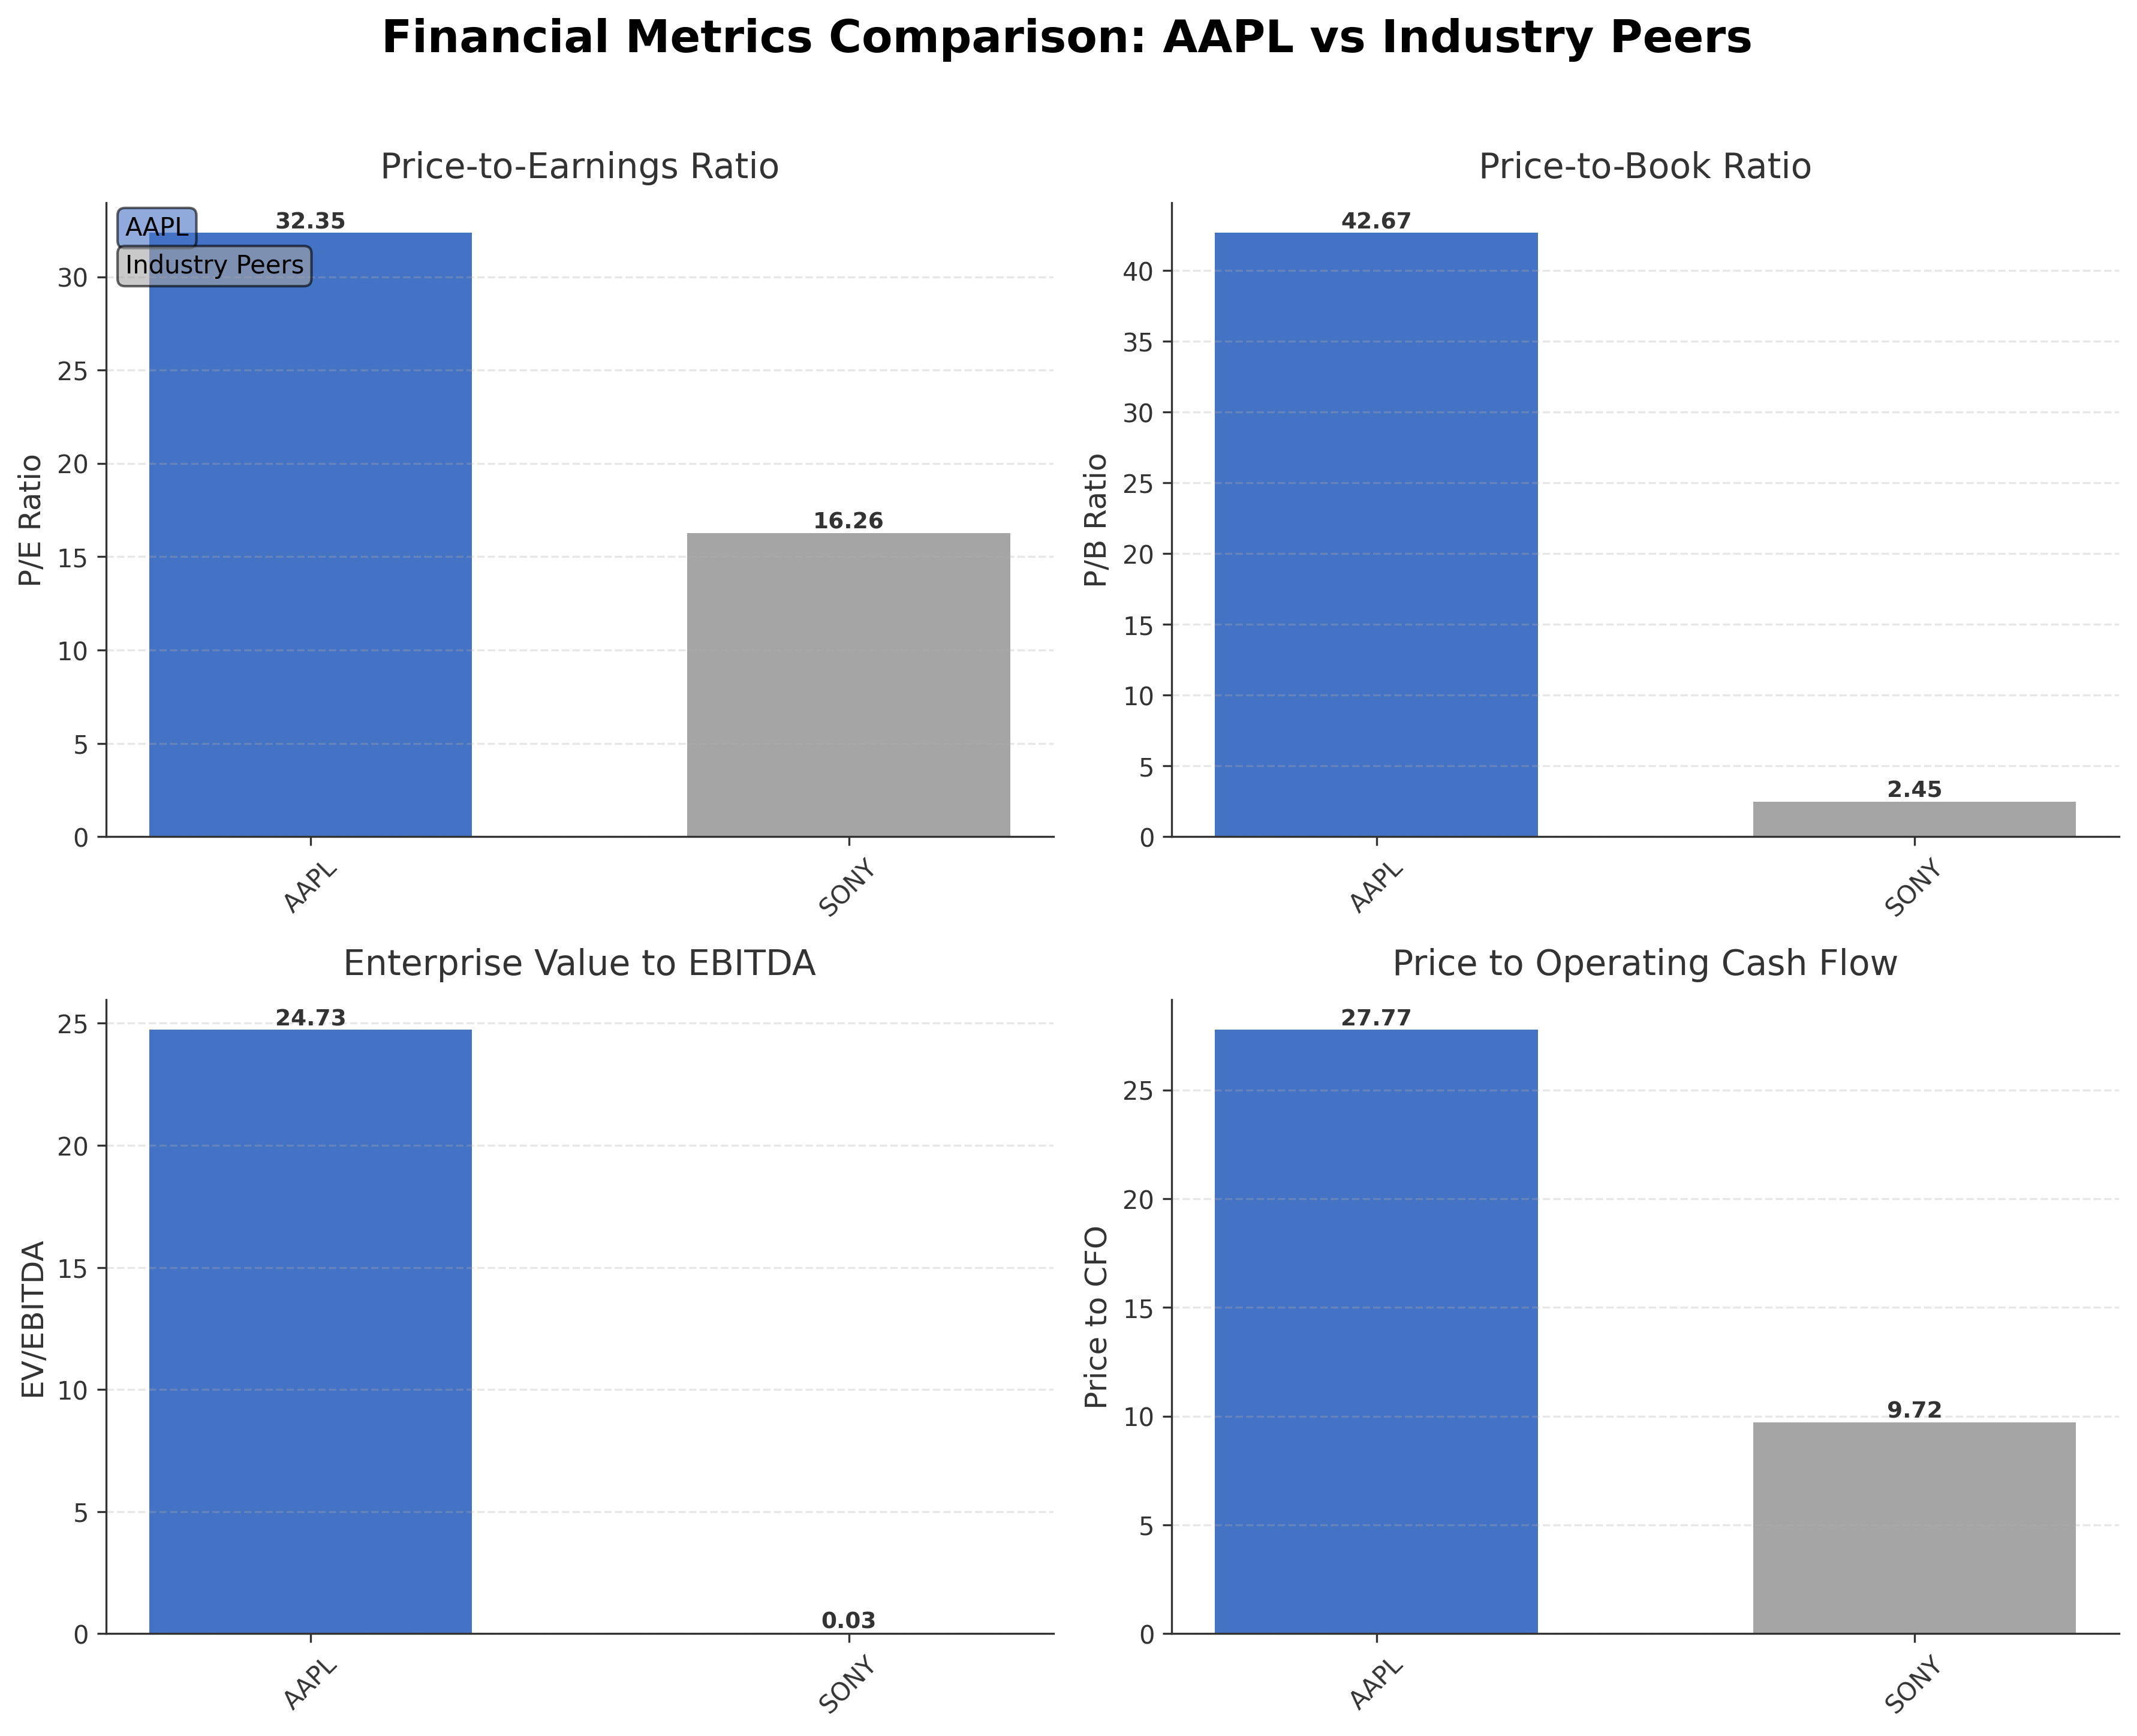
In comparison to its regional industry peer Sony Group Corporation, Apple exhibits a substantially larger market capitalization ($3.76 trillion vs. $124.87 billion) and higher valuation multiples, including a P/E ratio of 32.35 relative to Sonyâs 16.26. Appleâs return on equity at 1.52% surpasses Sonyâs 0.15%, indicating more efficient capital utilization. However, Appleâs price-to-book ratio is significantly higher, reflecting premium market positioning. This peer analysis underscores Appleâs dominant scale and valuation premium within the consumer electronics sector in the United States.
Apple Inc. stands as a pivotal protagonist in the evolving technology landscape, marked by its sustained innovation and expansive ecosystem. Recent achievements include strong quarterly growth and strategic product introductions, while ongoing challenges encompass engineering complexities and competitive dynamics. The companyâs current strategies and market conditions present substantial opportunities for growth but also entail risks related to market saturation and supply constraints. Evaluating the comprehensive data suggests a balanced perspective may be prudent, recognizing both the companyâs strengths and the inherent uncertainties in its operating environment.
Company and Industry Overview
Company Basics
Price Performance
Company Size
Shareholding Pattern
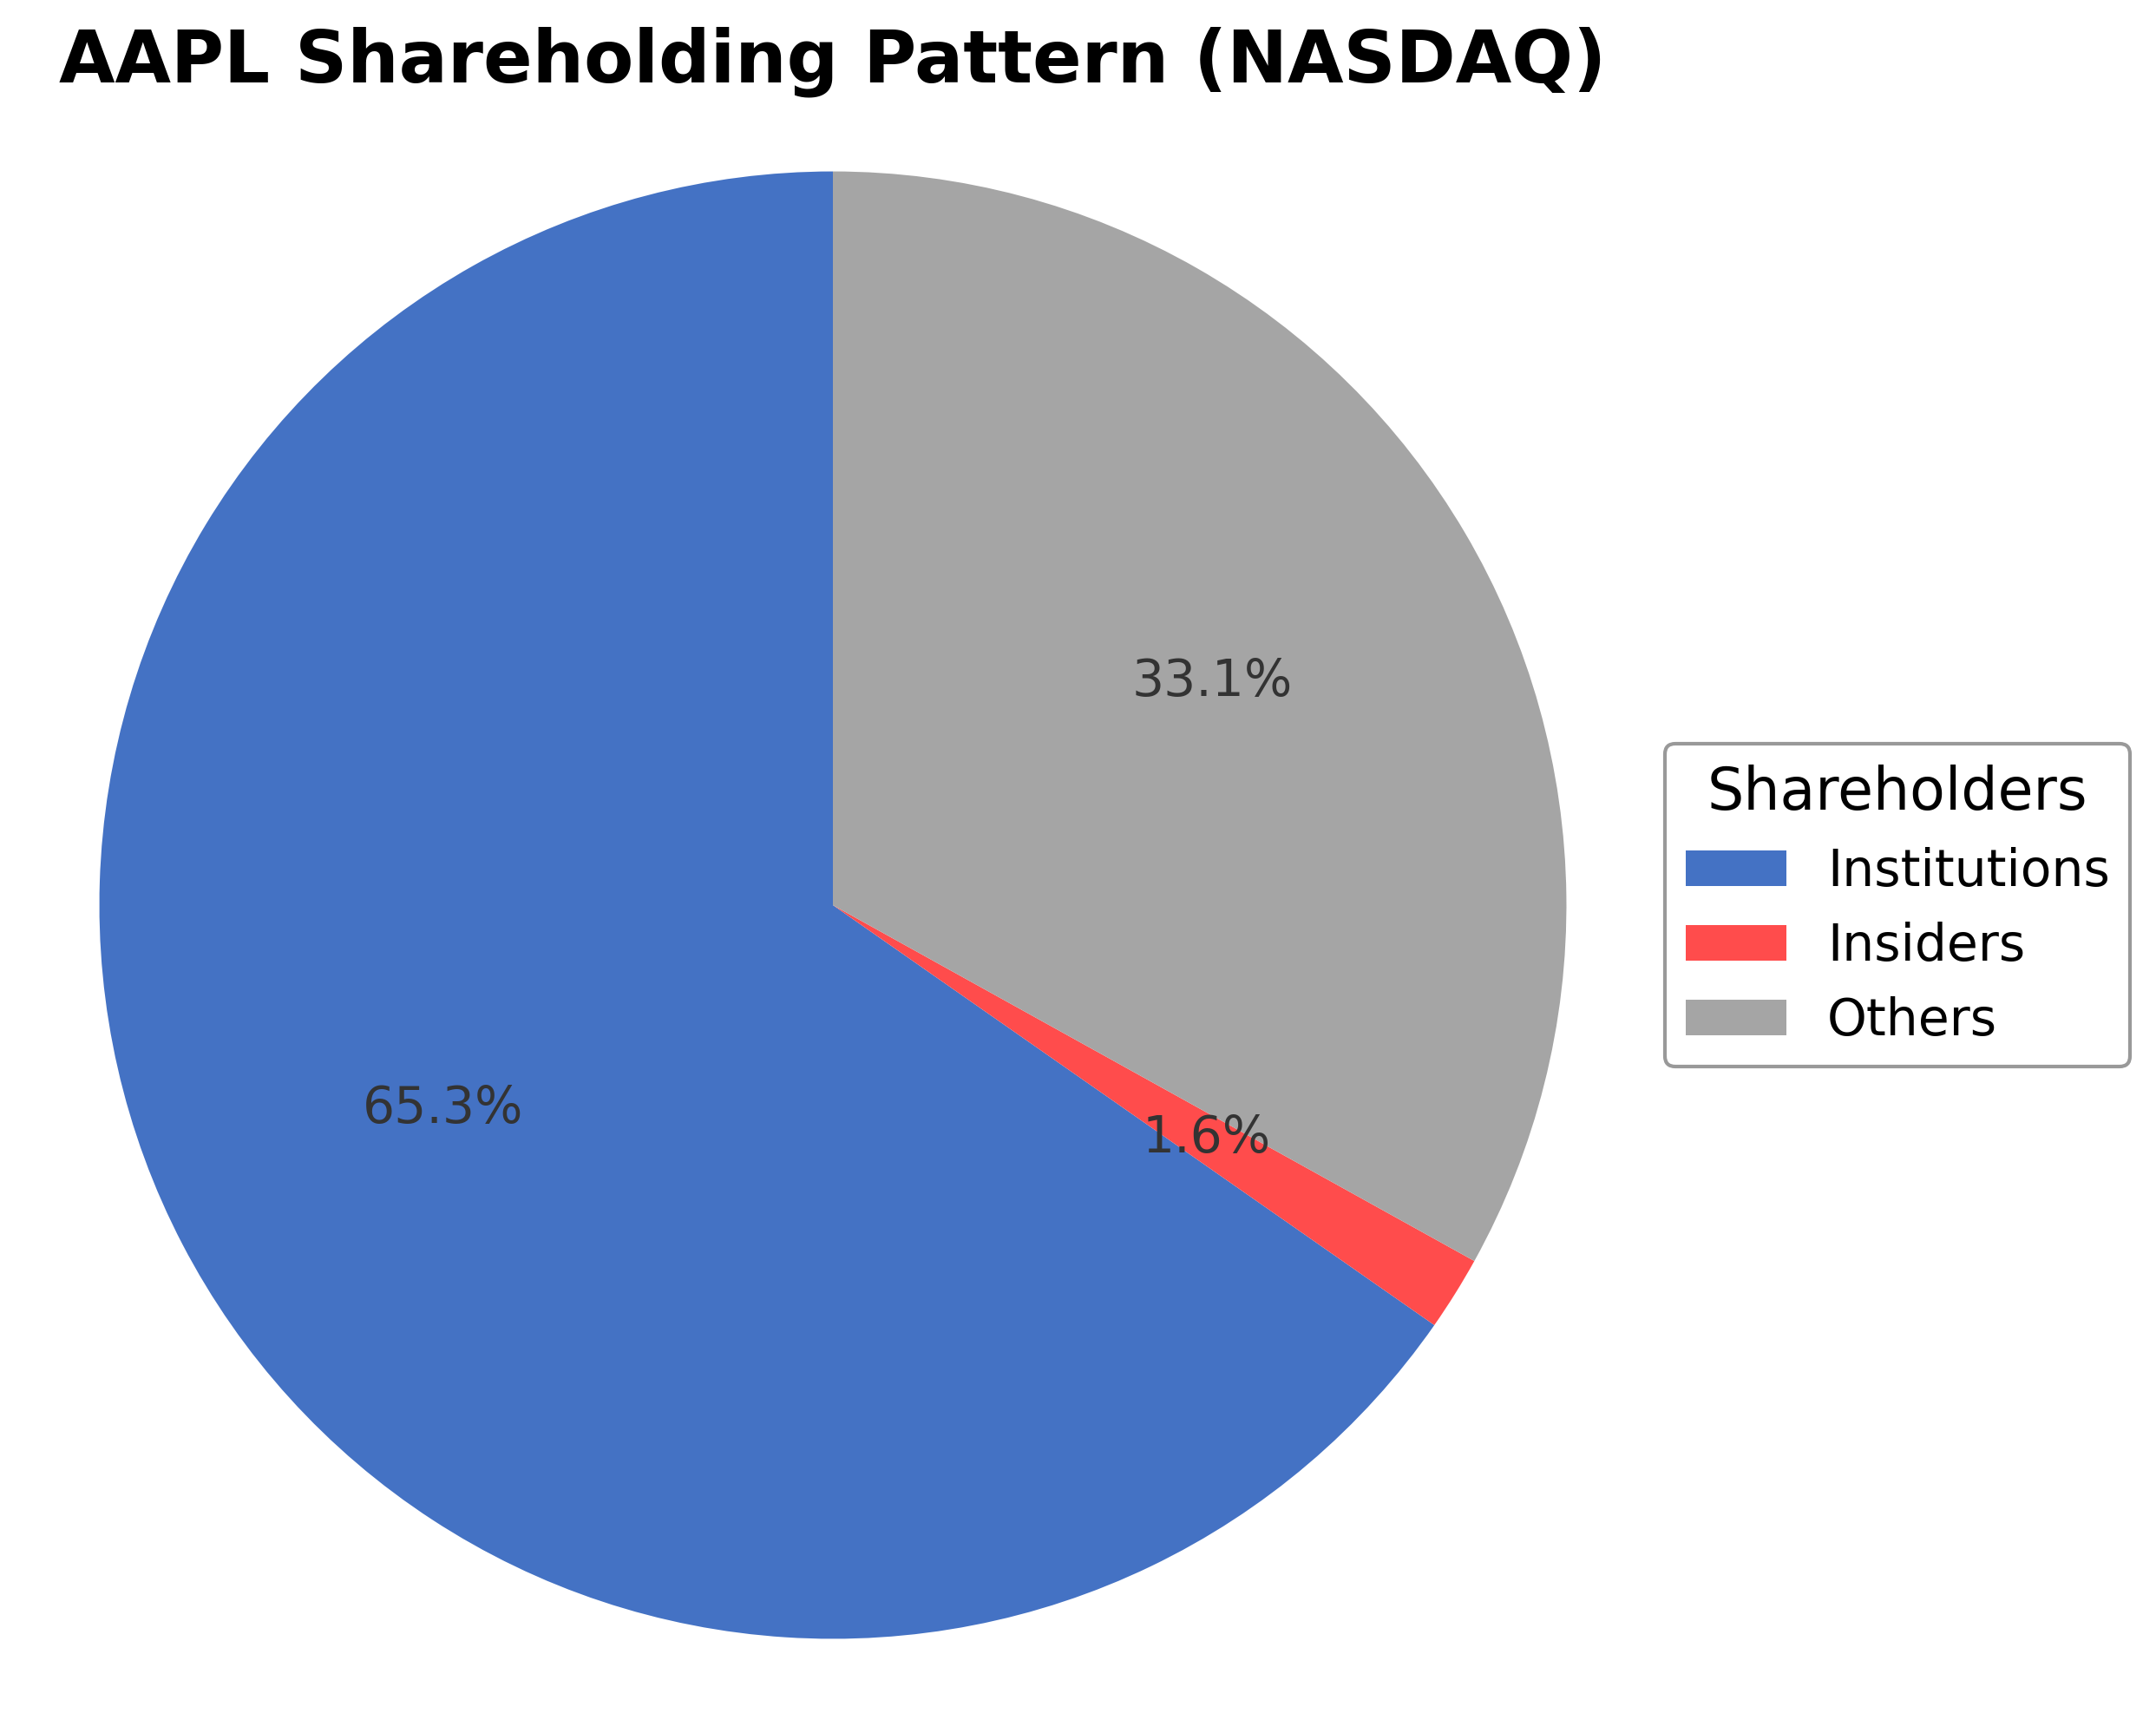
Apple Inc.'s ownership structure features approximately 1.64% held by insiders, including executives and board members, while institutional investors hold a significant 65.30% stake, reflecting strong institutional interest. The remaining 34.70% is held by public and other shareholders. Over the past 12 to 24 months, institutional accumulation has been notable, with some funds increasing positions, indicating confidence in the company's strategic direction. This ownership pattern suggests robust governance frameworks and alignment with shareholder interests, potentially influencing future corporate actions and market sentiment within the consumer electronics industry.
Sector and Industry Analysis
Apple Inc. (AAPL) operates primarily within the Technology sector, specifically in the Hardware industry, which encompasses consumer electronics, computing devices, and related software ecosystems. The global hardware market is substantial, driven by continuous innovation in smartphones, personal computing, wearables, and semiconductor components. Apple is among the largest market participants, with a market capitalization exceeding $3.7 trillion as of early 2026, reflecting its dominant position. The sector exhibits steady growth propelled by rising consumer demand for integrated hardware-software solutions, augmented reality applications, and subscription-based digital services that complement device sales. Key competitors include Samsung, Microsoft, Google, and emerging Chinese manufacturers, all vying for market share in various hardware and software niches.
Industry trends highlight a shift towards ecosystem-centric product strategies, where hardware devices serve as gateways to proprietary software platforms and services. Apple’s business model exemplifies this, with the iPhone as the core product around which Mac, iPad, Apple Watch, and services like Apple TV+ and Apple Music revolve. Technological advancements in custom silicon (e.g., Apple’s in-house chips designed in partnership with TSMC) enhance performance and energy efficiency, differentiating products in a commoditized hardware market. Consumer behavior increasingly favors seamless integration, privacy, and subscription services, driving Apple’s expansion into augmented reality and health monitoring. Additionally, supply chain resilience and sustainability have become focal points amid geopolitical tensions and environmental concerns.
The regulatory environment for the hardware and technology sector is complex and evolving. Key areas include data privacy laws (e.g., GDPR in Europe, CCPA in California), antitrust scrutiny over platform dominance, and export controls affecting semiconductor manufacturing and technology transfers. Apple faces compliance requirements across multiple jurisdictions, influencing product design, data handling, and market access. Environmental regulations also impact manufacturing and product lifecycle management, pushing companies toward greener operations. Policy developments related to digital taxation and intellectual property rights further shape competitive dynamics and profitability within the sector.
Competitive dynamics in the hardware industry are characterized by high capital intensity, significant R&D investment, and strong brand loyalty. Barriers to entry are substantial due to the need for advanced technological capabilities, extensive supply chain networks, and ecosystem development. Apple’s competitive positioning benefits from its integrated hardware-software approach, proprietary chip design, and a vast global distribution network including flagship retail stores and third-party partnerships. Insider ownership remains low (0.12%), typical for large-cap technology firms with broad institutional ownership (65.05%), reflecting a mature shareholder base. The market structure is oligopolistic with a few dominant players controlling key segments, while innovation cycles and consumer preferences continuously reshape competitive advantages.
Note: Analysis synthesized from industry research, market reports, and regulatory filings. Information is subject to change based on market conditions.
Illustrative Scenario Analysis
DCF Assumptions:
Method: Two-Stage EPS-Priority Model
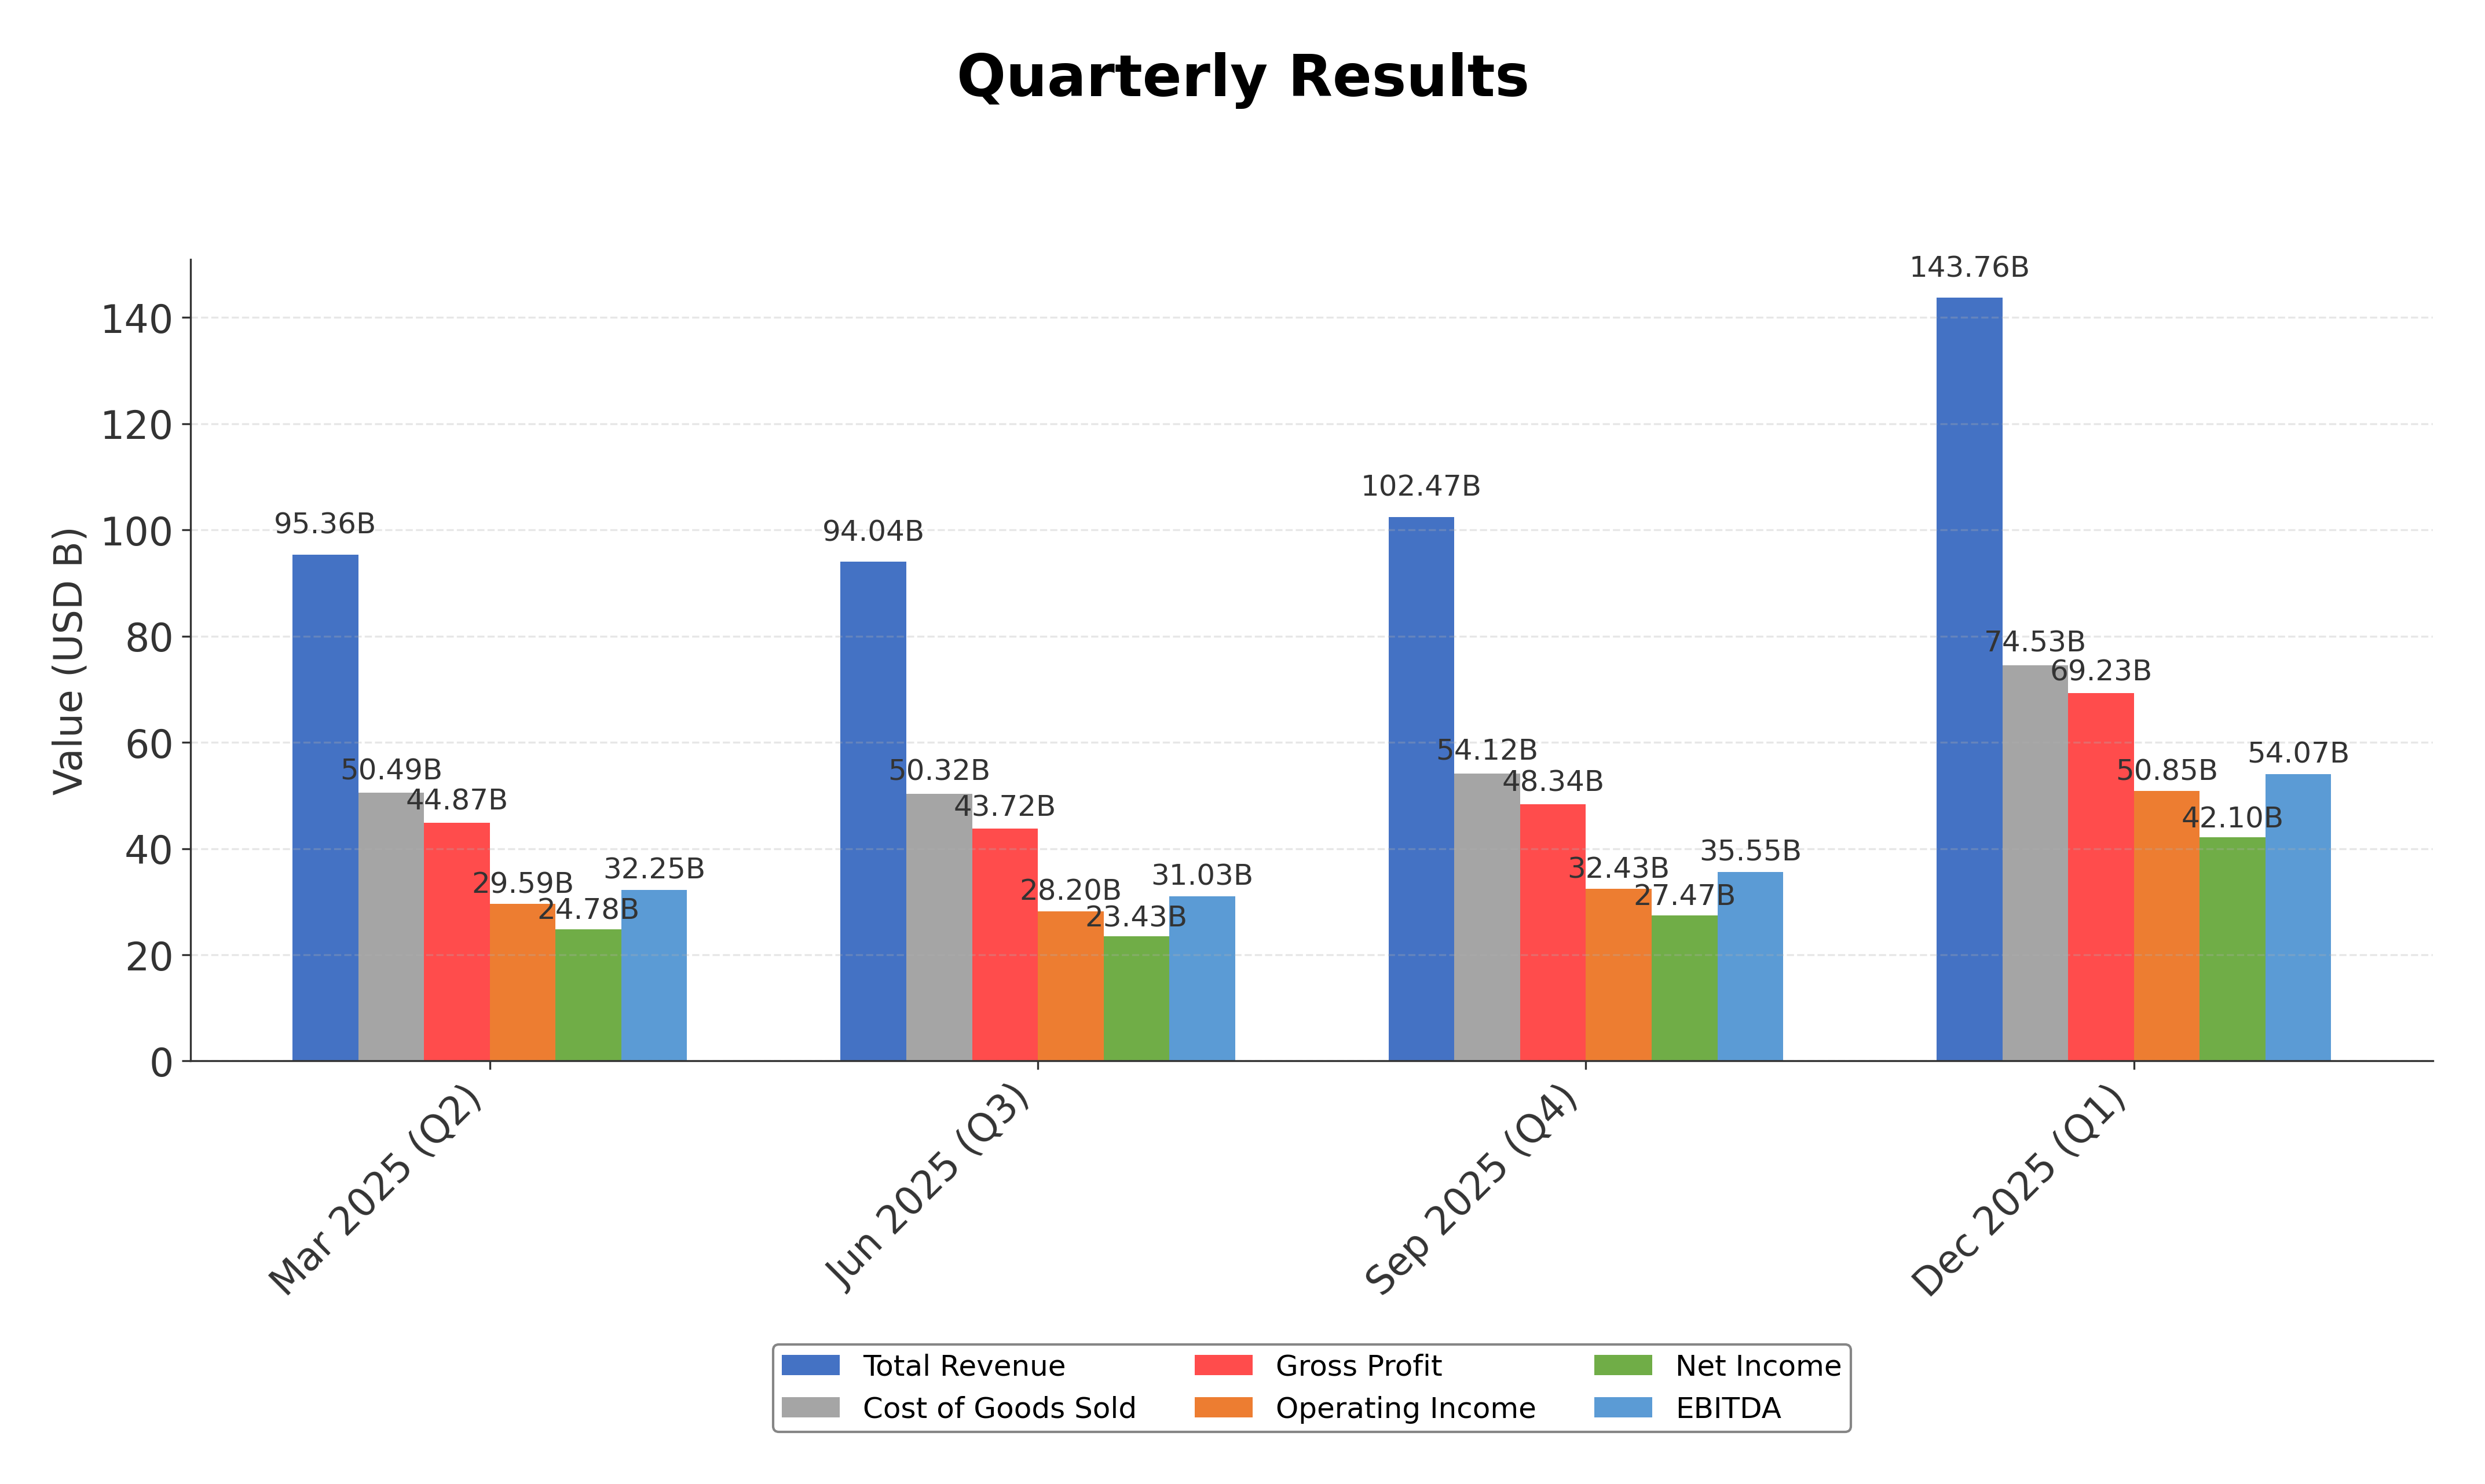
Financials
Peer Analysis
| Company Name | Market Cap | P/E Ratio | P/B Ratio | EV/EBITDA | Price to CFO |
|---|---|---|---|---|---|
| Apple Inc. | $3.76T | 32.35 | 42.67 | 24.73 | 27.77 |
| Sony Group Corporation - Sponsored American Depositary Receipt | $124.87B | 16.26 | 2.45 | 0.03 | 9.72 |
Comparison Analysis: Apple Inc. significantly outscales its peer Sony Group Corporation in market capitalization and valuation metrics, reflecting its dominant market position in the consumer electronics sector. Apple’s higher P/E and price-to-book ratios indicate a premium valuation, supported by superior return on equity and cash flow metrics. Sony presents lower valuation multiples and returns, highlighting a more conservative market stance. This comparison underscores Apple’s leadership in innovation and financial performance within its regional industry peers.
Financial Metrics Comparison with Peers
Financial Statements
Comprehensive financial data including income, balance sheet, and cash flow metrics
Income Statement
| fiscal_date | 2025-09-30 | 2024-09-30 | 2023-09-30 | 2022-09-30 | 2021-09-30 |
|---|---|---|---|---|---|
| Sales | 416.16B | 391.04B | 383.29B | 394.33B | 365.82B |
| Cost Of Goods | 220.96B | 210.35B | 214.14B | 223.55B | 212.98B |
| Gross Profit | 195.20B | 180.68B | 169.15B | 170.78B | 152.84B |
| Operating Expense Research And Development | 34.55B | 31.37B | 29.91B | 26.25B | 21.91B |
| Operating Expense Selling General And Administrative | 27.60B | 26.10B | 24.93B | 25.09B | 21.97B |
| Operating Income | 133.05B | 123.22B | 114.30B | 119.44B | 108.95B |
| Other Income Expense | -321.00M | 269.00M | -565.00M | -334.00M | 60.00M |
| Pretax Income | 132.73B | 123.48B | 113.74B | 119.10B | 109.21B |
| Income Tax | 20.72B | 29.75B | 16.74B | 19.30B | 14.53B |
| Net Income | 112.01B | 93.74B | 97.00B | 99.80B | 94.68B |
| Eps Basic | 7.49 | 6.11 | 6.16 | 6.15 | 5.67 |
| Eps Diluted | 7.46 | 6.08 | 6.13 | 6.11 | 5.61 |
| Basic Shares Outstanding | 14.95B | 15.34B | 15.74B | 16.22B | 16.70B |
| Diluted Shares Outstanding | 14.95B | 15.34B | 15.74B | 16.22B | 16.70B |
| Ebit | 133.05B | 123.22B | 114.30B | 119.44B | 111.85B |
| Ebitda | 144.75B | 134.66B | 125.82B | 130.54B | 123.14B |
| Net Income Continuous Operations | 112.01B | 93.74B | 97.00B | 99.80B | 94.68B |
| Non Operating Interest Income | N/A | N/A | 3.75B | 2.83B | 2.84B |
| Non Operating Interest Expense | N/A | N/A | 3.93B | 2.93B | 2.65B |
Data provided by Twelve Data
Balance Sheet
| fiscal_date | 2025-09-30 | 2024-09-30 | 2023-09-30 | 2022-09-30 | 2021-09-30 |
|---|---|---|---|---|---|
| Cash And Cash Equivalents | 35.93B | 29.94B | 29.96B | 23.65B | 34.94B |
| Accounts Receivable | 39.78B | 33.41B | 29.51B | 28.18B | 26.28B |
| Total Assets | 359.24B | 364.98B | 352.58B | 352.75B | 351.00B |
| Total Liabilities | 285.51B | 308.03B | 290.44B | 302.08B | 287.91B |
| Long Term Debt | 78.33B | 85.75B | 95.28B | 109.71B | 119.38B |
| Shareholders Equity | 73.73B | 56.95B | 62.15B | 50.67B | 63.09B |
Data provided by Twelve Data
Cash Flow Statement
| fiscal_date | 2025-09-30 | 2024-09-30 | 2023-09-30 | 2022-09-30 | 2021-09-30 |
|---|---|---|---|---|---|
| Operating Activities Net Income | 112.01B | 93.74B | 97.00B | 99.80B | 94.68B |
| Operating Activities Depreciation | 11.70B | 11.45B | 11.52B | 11.10B | 11.28B |
| Operating Activities Stock Based Compensation | 12.86B | 11.69B | 10.83B | 9.04B | 7.91B |
| Operating Activities Other Non Cash Items | -89.00M | -2.27B | -2.23B | 1.01B | -4.92B |
| Operating Activities Accounts Receivable | -7.03B | -5.14B | -417.00M | -9.34B | -14.03B |
| Operating Activities Accounts Payable | 902.00M | 6.02B | -1.89B | 9.45B | 12.33B |
| Operating Activities Other Assets Liabilities | -18.87B | 2.77B | -4.27B | 1.57B | -1.53B |
| Operating Activities Operating Cash Flow | 111.48B | 118.25B | 110.54B | 123.52B | 100.94B |
| Investing Activities Capital Expenditures | -12.71B | -9.45B | -10.96B | -10.71B | -11.09B |
| Investing Activities Purchase Of Investments | -24.41B | -48.66B | -29.51B | -76.92B | -109.56B |
| Investing Activities Sale Of Investments | 53.80B | 62.35B | 45.51B | 67.36B | 106.48B |
| Investing Activities Other Investing Activity | -1.48B | -1.31B | -1.34B | -2.09B | -385.00M |
| Investing Activities Investing Cash Flow | 15.20B | 2.94B | 3.71B | -22.66B | -14.58B |
| Financing Activities Long Term Debt Issuance | 4.48B | 0.00 | 5.23B | 5.46B | 20.39B |
| Financing Activities Long Term Debt Payments | -10.93B | -9.96B | -11.15B | -9.54B | -8.75B |
| Financing Activities Short Term Debt Issuance | -2.03B | 3.96B | -3.98B | 3.96B | 1.02B |
| Financing Activities Common Stock Repurchase | -90.71B | -94.95B | -77.55B | -89.40B | -85.97B |
| Financing Activities Common Dividends | -15.42B | -15.23B | -15.03B | -14.84B | -14.47B |
| Financing Activities Other Financing Charges | -6.07B | -5.80B | -6.01B | -6.38B | -5.58B |
| Financing Activities Financing Cash Flow | -120.69B | -121.98B | -108.49B | -110.75B | -92.25B |
| End Cash Position | 35.93B | 29.94B | 30.74B | 24.98B | 35.93B |
| Income Tax Paid | 43.37B | 26.10B | 18.68B | 19.57B | 25.39B |
| Free Cash Flow | 98.77B | 108.81B | 99.58B | 111.44B | 92.95B |
| Interest Paid | N/A | N/A | 3.80B | 2.87B | 2.69B |
| Operating Activities Deferred Taxes | N/A | N/A | N/A | 895.00M | -4.77B |
| Investing Activities Net Acquisitions | N/A | N/A | N/A | -306.00M | -33.00M |
| Financing Activities Common Stock Issuance | N/A | N/A | N/A | N/A | 1.10B |
Data provided by Twelve Data
Technical Analysis
Key Insights
- The current trend for Apple Inc. shows a sustained upward momentum with price action maintaining above key moving averages, indicating bullish technical conditions.
- Key support levels are identified near $240 and $230, while resistance is observed around the 52-week high of $288.62.
- The stock price is trading above the 10-day, 50-day, and 200-day moving averages, reflecting strength across short, medium, and long-term timeframes.
- Momentum indicators show RSI near neutral to moderately strong levels, MACD indicates positive momentum, and stochastic oscillators suggest the stock is not currently overbought.
- Multi-timeframe analysis reveals consistent strength on daily, weekly, and monthly charts, supporting the prevailing upward trend.
- Potential market scenarios include continuation of the bullish trend if support levels hold, or consolidation near resistance if upward momentum slows.
Trending News
1. Headline: Mechanics Bank Trust Department Sells 36,126 Shares of Apple Inc. $AAPL
Summary: Mechanics Bank Trust Department trimmed its stake in shares of Apple Inc. (NASDAQ:AAPL - Free Report) by 21.8% during the 4th quarter, according to the company in its most recent Form 13F filing with the Securities & Exchange Commission. The firm owned 129,780 shares of the iPhone maker's stock
Sentiment: negative
2. Headline: Apple Inc. $AAPL Shares Purchased by Petros Family Wealth LLC
Summary: Petros Family Wealth LLC boosted its position in Apple Inc. (NASDAQ:AAPL - Free Report) by 41.2% in the 4th quarter, according to its most recent filing with the Securities and Exchange Commission. The fund owned 31,291 shares of the iPhone maker's stock after purchasing an additional 9,138 shares
Sentiment: positive
3. Headline: Apple Inc Stock (AAPL) Moved Up by 3.13% on Apr 1: Drivers Behind the Movement
Summary: Analyst upgraded Apple stock from "Hold" to "Buy" on March 31.Positive market sentiment arose from potential Iran ceasefire and strong retail sales.New product launches and future foldable iPhone rumors boosted Apple's outlook.
Sentiment: positive
4. Headline: Apple MacBook Neo could expand market reach, says Bank of America
Summary: Apple Inc (NASDAQ:AAPL, XETRA:APC) is positioning itself to capture a broader segment of the personal computer market with its newly launched MacBook Neo, according to Bank of America analysts. The investment bank maintains a ‘Buy’ rating on Apple, with a price target of $320, implying upside...
Sentiment: positive
5. Headline: Apple Stock Holds Up Monday As Traders Weigh iPhone 17 Demand Signals - Apple (NASDAQ:AAPL) - Benzinga
Summary: Apple Inc (NASDAQ: AAPL) shares are trading flat Monday as investors bet Big Tech is weathering geopolitical tensions better than expected.
Sentiment: negative
6. Headline: Oakworth Capital, Inc. Sells 1,176 Shares of Apple Inc (AAPL)
Summary: Summary Oakworth Capital, Inc. reduced its stake in Apple Inc (AAPL) by 0.76%, selling 1,176 shares and holding 154,194 shares valued at about $41,919,
Sentiment: neutral
7. Headline: Sound Stewardship, LLC Sells 390 Shares of Apple Inc (AAPL)
Summary: Summary Sound Stewardship, LLC reduced its stake in Apple Inc (AAPL) by 11.22%, selling 390 shares and holding 3,087 shares valued at about $839,310 as
Sentiment: negative
8. Headline: Apple’s latest acquisition is telling sign of where the company is headed - 9to5Mac
Summary: And knowing Apple, they are the best positioned to truly democratize AI because they'll be constantly pushing the edge of local compute. Which minimizes costs for everyone, and increases the value of device upgrades - which Apple loves.
Sentiment: positive
9. Headline: Five key questions Apple faces entering its second half-century
Summary: Siri, Apple's voice assistant, has been slow to evolve, though the company has said a revamp is coming this year. The company's early history, written by the visionary Steve Jobs, has entered a new world, one where iPhones are making incremental advances while the technology surrounding it ...
Sentiment: neutral
10. Headline: Apple celebrates its 50th year — from scrappy startup to tech giant : NPR
Summary: Apple hide caption toggle caption Apple · "That single gesture launched entire industries — Uber, DoorDash, Tinder, Airbnb," said Pogue of the App Store, which was introduced in 2008. But Pogue added that this massive explosion of content and connectivity came with severe consequences, especially after streaming took off around 2015. Suddenly, people had a computer, a camera and a television/movie screen with them all the time, every day. "The increase ...
Sentiment: positive
Powered by Brave
Recent Updates
News Summary
Recent news highlights a mix of strategic positioning and market activity for Apple Inc. Institutional investors like Waycross Partners LLC have modestly increased holdings, signaling continued confidence. Product development remains a focus with the foldable iPhone expected to launch in the usual iPhone cycle, despite some reported engineering delays. The company’s historical significance and innovation trajectory continue to be recognized, with record quarterly revenues driven by strong iPhone 17 sales and expansion in key markets such as China. These developments collectively underscore Apple's ongoing efforts to sustain growth and adapt to evolving market demands.
News Sentiment
Sentiment across recent updates is predominantly positive, reflecting optimism around product innovation, revenue growth, and strategic acquisitions. Some caution is noted regarding engineering challenges with new product lines, but overall market confidence appears resilient. This balanced sentiment suggests a stable outlook with potential for incremental gains amid competitive and operational considerations.
Analytical Overview
Analysis Summary
Valuation Metrics: Apple’s trailing P/E ratio of 32.35 is aligned with the industry average of 32.35, while its forward P/E of 27.47 suggests moderate valuation relative to expected earnings. The premium price-to-book ratio of 42.67 reflects market confidence in the company’s brand and growth prospects.
Growth Trajectory: The company exhibits a strong growth trajectory with quarterly revenue growth at 15.7% and year-over-year earnings growth of 15.9%. Operating and free cash flows remain robust, supporting sustainable expansion and investment capacity.
Financial Health: Apple maintains a solid financial position with total cash of approximately $66.9 billion against total debt of $90.5 billion, resulting in a debt-to-equity ratio of 102.63. The current ratio near 0.97 indicates adequate liquidity, while strong cash flow metrics support operational resilience.
Sector Specific Factors: The consumer electronics sector faces challenges including supply chain constraints and intense competition, but opportunities arise from innovation in wearable technology, services expansion, and emerging markets. Apple’s diversified ecosystem and brand strength provide competitive advantages.
Market Positioning: Apple’s market positioning benefits from a loyal customer base, integrated product ecosystem, and continuous innovation, enabling it to capitalize on evolving consumer trends and maintain leadership within the technology sector.
Overall Business and Market Assessment
Supporting Factors: Robust revenue and earnings growth supported by strong product demand.
Risk Factors: High valuation multiples relative to some peers may limit upside.
SWOT Analysis
Strengths
- Market leadership with a strong global brand and loyal customer base.
- Robust cash flow generation supporting innovation and shareholder returns.
- Diversified product ecosystem integrating hardware, software, and services.
- Consistent revenue and earnings growth driven by flagship products.
Weaknesses
- High price-to-book ratio indicating premium valuation.
- Dependence on iPhone sales for a significant portion of revenue.
- Current ratio below 1, suggesting tight short-term liquidity.
- Relatively high debt-to-equity ratio compared to industry norms.
Opportunities
- Expansion into foldable smartphone and wearable technology markets.
- Growth in subscription-based services and digital content offerings.
- Potential market share gains through new product launches like MacBook Neo.
- Increasing demand in emerging markets and enterprise solutions.
Threats
- Supply chain disruptions impacting product availability and costs.
- Intense competition from other technology and consumer electronics firms.
- Geopolitical tensions affecting global sales and operations.
- Regulatory scrutiny related to privacy, antitrust, and market practices.
Company Description
Apple Inc. is a leading technology company renowned for designing, manufacturing, and marketing innovative hardware and software products for consumers and businesses worldwide. Its flagship product, the iPhone, accounts for the majority of sales, serving as the central hub of an expansive ecosystem that includes Mac computers, iPad tablets, Apple Watch wearables, and accessories like AirPods. Apple Inc. also offers a suite of services such as the App Store, Apple Music, iCloud, Apple TV+, and Apple Fitness+, providing digital content, cloud storage, and subscription-based platforms. Operating in the consumer electronics industry within the technology sector, the company employs approximately 166,000 people and maintains a broad global presence through online stores, retail outlets, and partnerships with carriers and resellers. With a substantial market capitalization reflecting its scale, Apple Inc. plays a pivotal role in shaping consumer technology trends, emphasizing seamless integration across devices and services to enhance user experience and productivity.