
Apple Inc (AAPL)
Stock Analysis Report
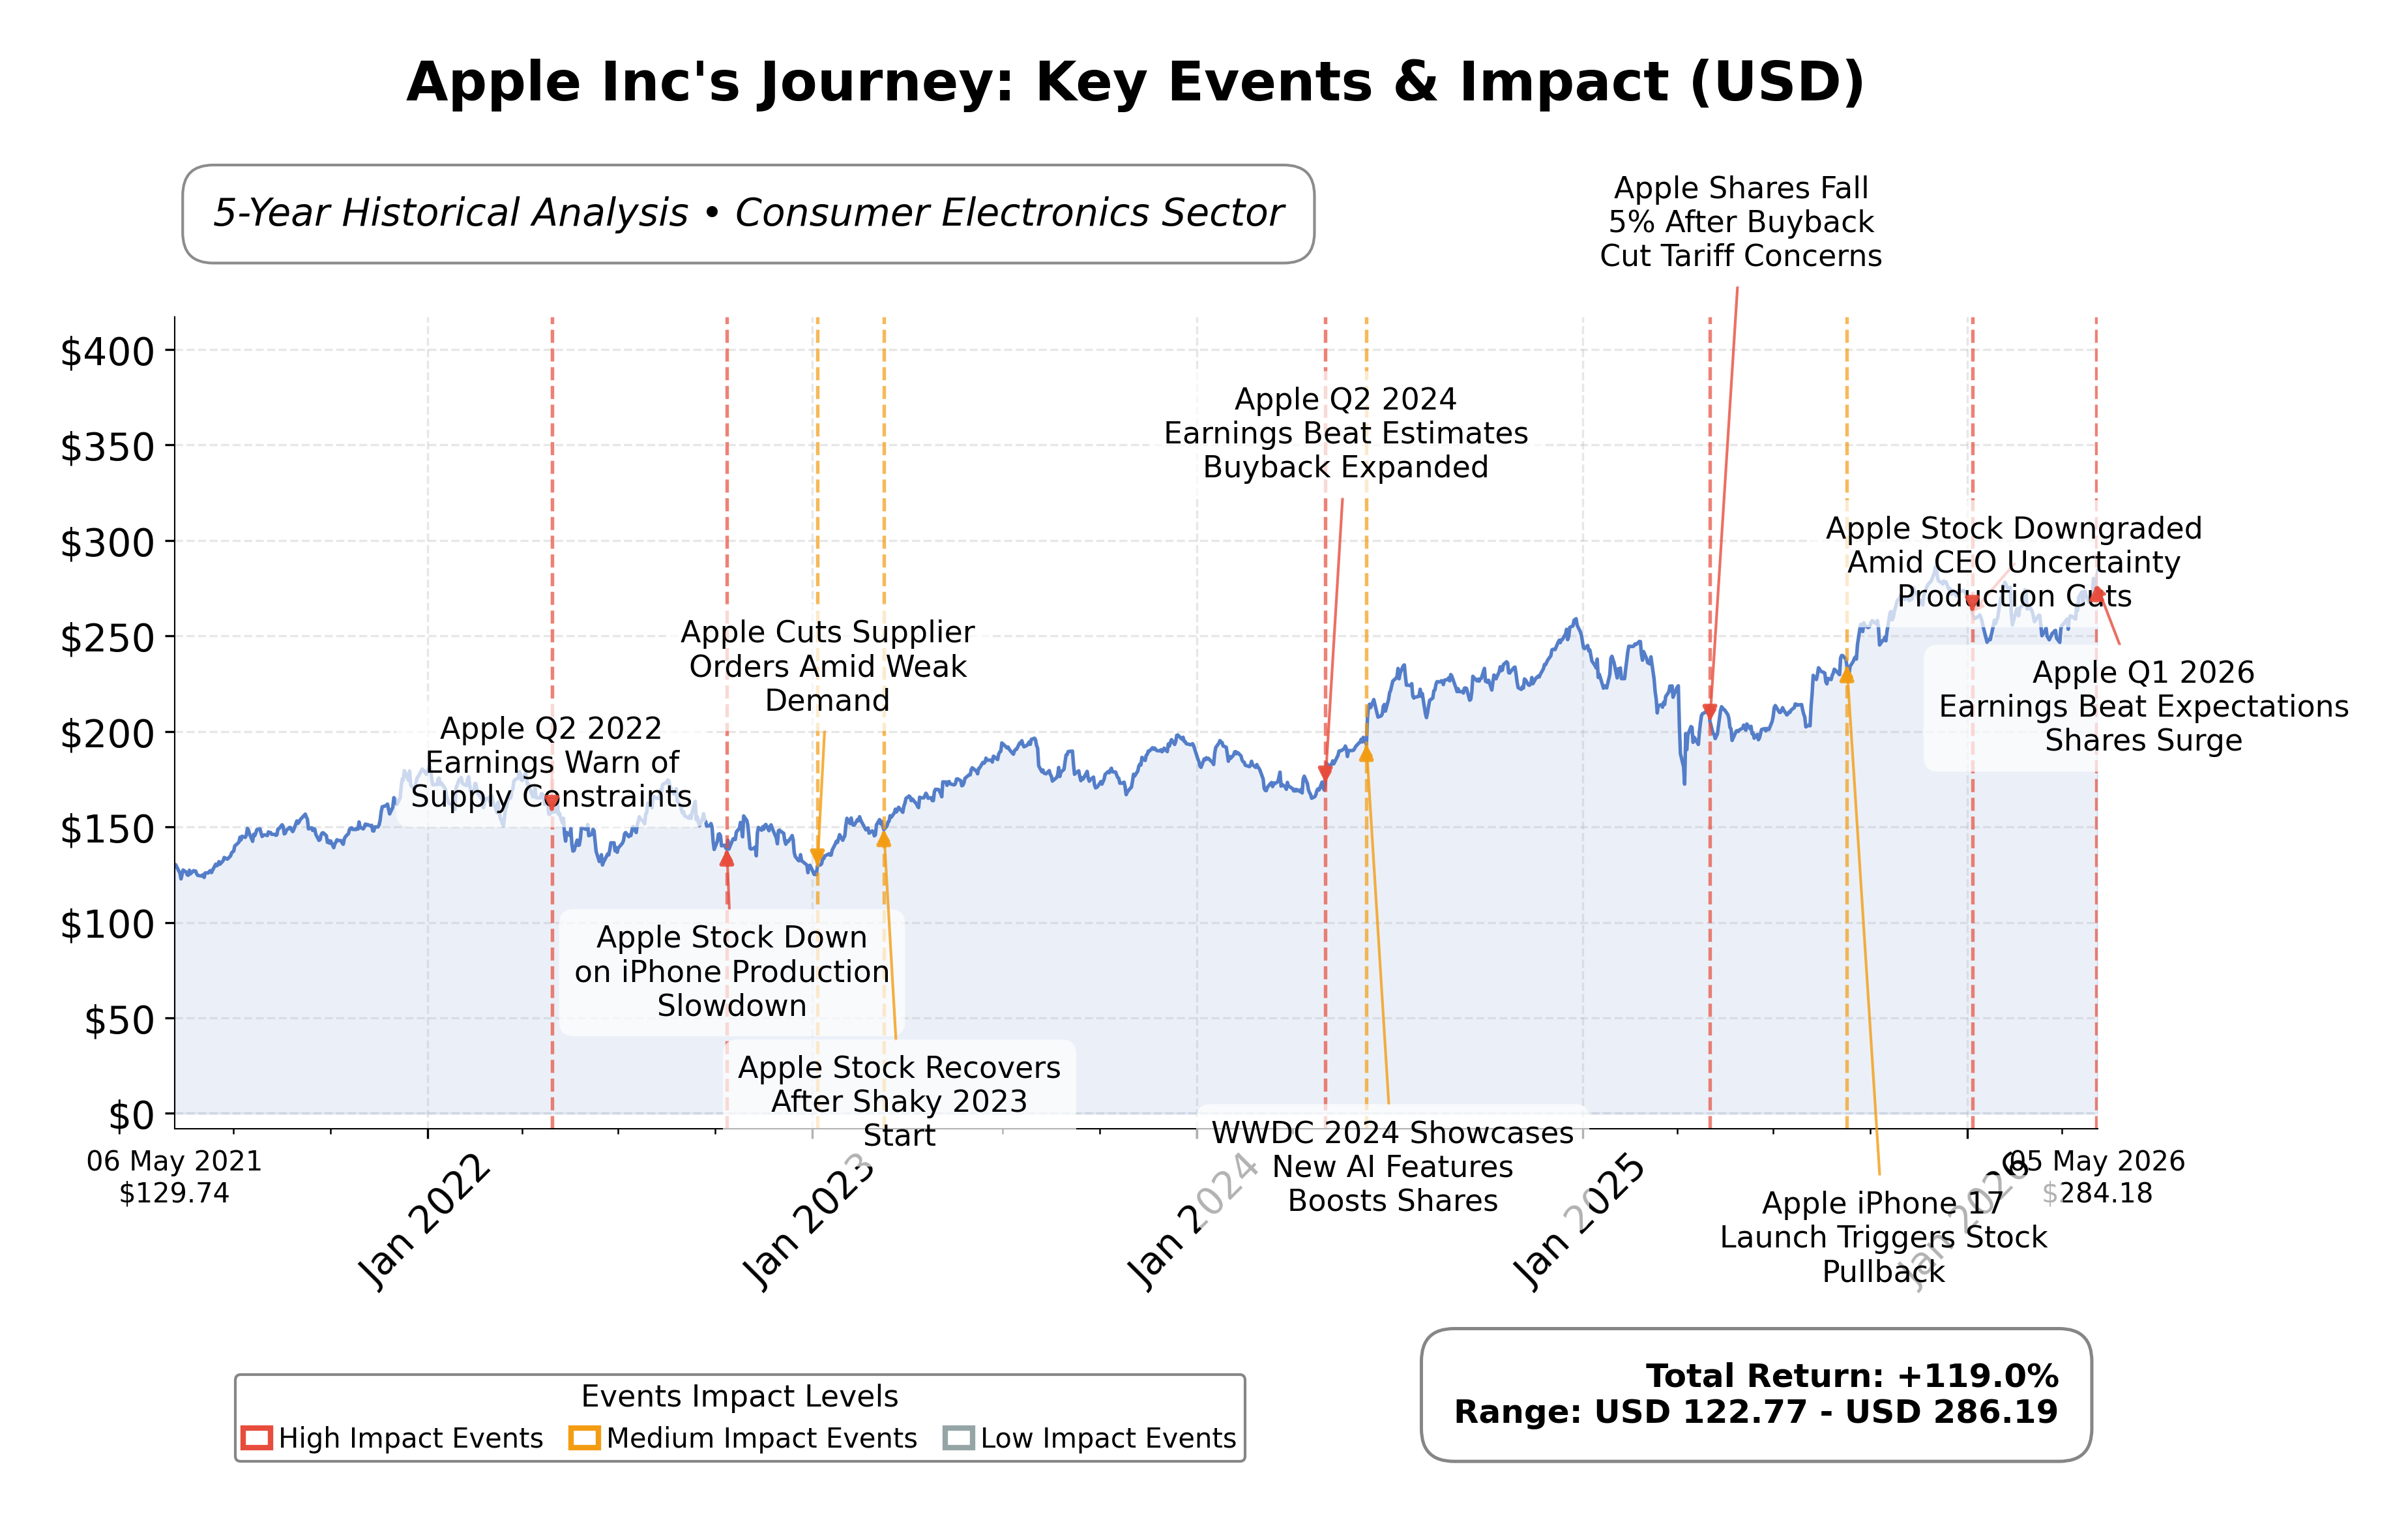
Stock Journey
Key Positives and Key Risks
Pros
- Market capitalization of $4.11 trillion underscores Apple’s scale and market dominance.
- Strong profitability metrics with a 27.15% profit margin and 141.47% return on equity demonstrate efficient capital utilization.
- Robust cash flow generation with $140.2 billion in operating cash flow and $100.5 billion in free cash flow supports strategic investments and shareholder returns.
Cons
- High valuation multiples including a P/E ratio of 33.92 and P/B ratio of 46.71 may limit upside potential relative to peers.
- Supply chain constraints and reliance on a limited number of flagship products pose operational risks.
- Recent legal challenges such as the $250 million AI Siri settlement introduce potential reputational and financial risks.
Disclosure: This information is for general awareness and does not constitute investment advice
Report Summary
Apple Inc. is a leading technology company listed on the NASDAQ exchange, operating within the consumer electronics sector. The company designs, manufactures, and markets a broad range of innovative hardware and software products, including the flagship iPhone, Mac computers, iPads, Apple Watch, and accessories such as AirPods. Apple also offers a suite of digital services, including the App Store, Apple Music, iCloud, Apple TV+, and Apple Fitness+, which complement its hardware ecosystem. With a global presence and a workforce of approximately 166,000 employees, Apple holds a prominent market position in the technology industry.
Financially, Apple reported trailing twelve months (TTM) revenue of approximately $451.4 billion, with a strong profit margin of 27.15%, operating margin of 32.28%, and net income of $122.6 billion. The company demonstrates robust efficiency metrics, including a return on equity (ROE) of 141.47% and return on assets (ROA) of 26.23%, reflecting effective use of shareholder capital and assets. Operating cash flow stands at $140.2 billion, with free cash flow of $100.5 billion, underscoring strong cash generation capabilities.
Apple’s valuation metrics indicate a trailing price-to-earnings (P/E) ratio of 33.92 and a forward P/E of 29.39, with a price-to-book (P/B) ratio of 46.71 and an enterprise value to EBITDA (EV/EBITDA) of 25.79. The market capitalization is approximately $4.11 trillion, positioning Apple as one of the largest companies globally. The stock currently trades near its 52-week high of $288.62, with a current price of $284.99, reflecting a 29% increase over the past year.
Key strengths include Apple’s substantial cash reserves of $68.5 billion, manageable debt levels with a debt-to-equity ratio of 79.55%, and market leadership in consumer electronics and digital services. Risks involve supply chain constraints, competitive pressures, and regulatory scrutiny. Recent strategic developments include exploratory talks with Intel and Samsung to diversify chip manufacturing beyond Taiwan Semiconductor Manufacturing Co., and a $100 billion share repurchase authorization, signaling capital return initiatives.
Technically, Apple’s stock exhibits a strong uptrend, trading above its 50-day and 200-day moving averages, supported by positive momentum indicators. Recent news highlights mixed sentiments, with positive developments around chip supply diversification and earnings growth tempered by legal challenges and cautious memory demand outlooks. The data suggests a balanced market stance with attention warranted on supply chain and competitive dynamics.
Company and Industry Overview
Company Basics
Price Performance
Company Size
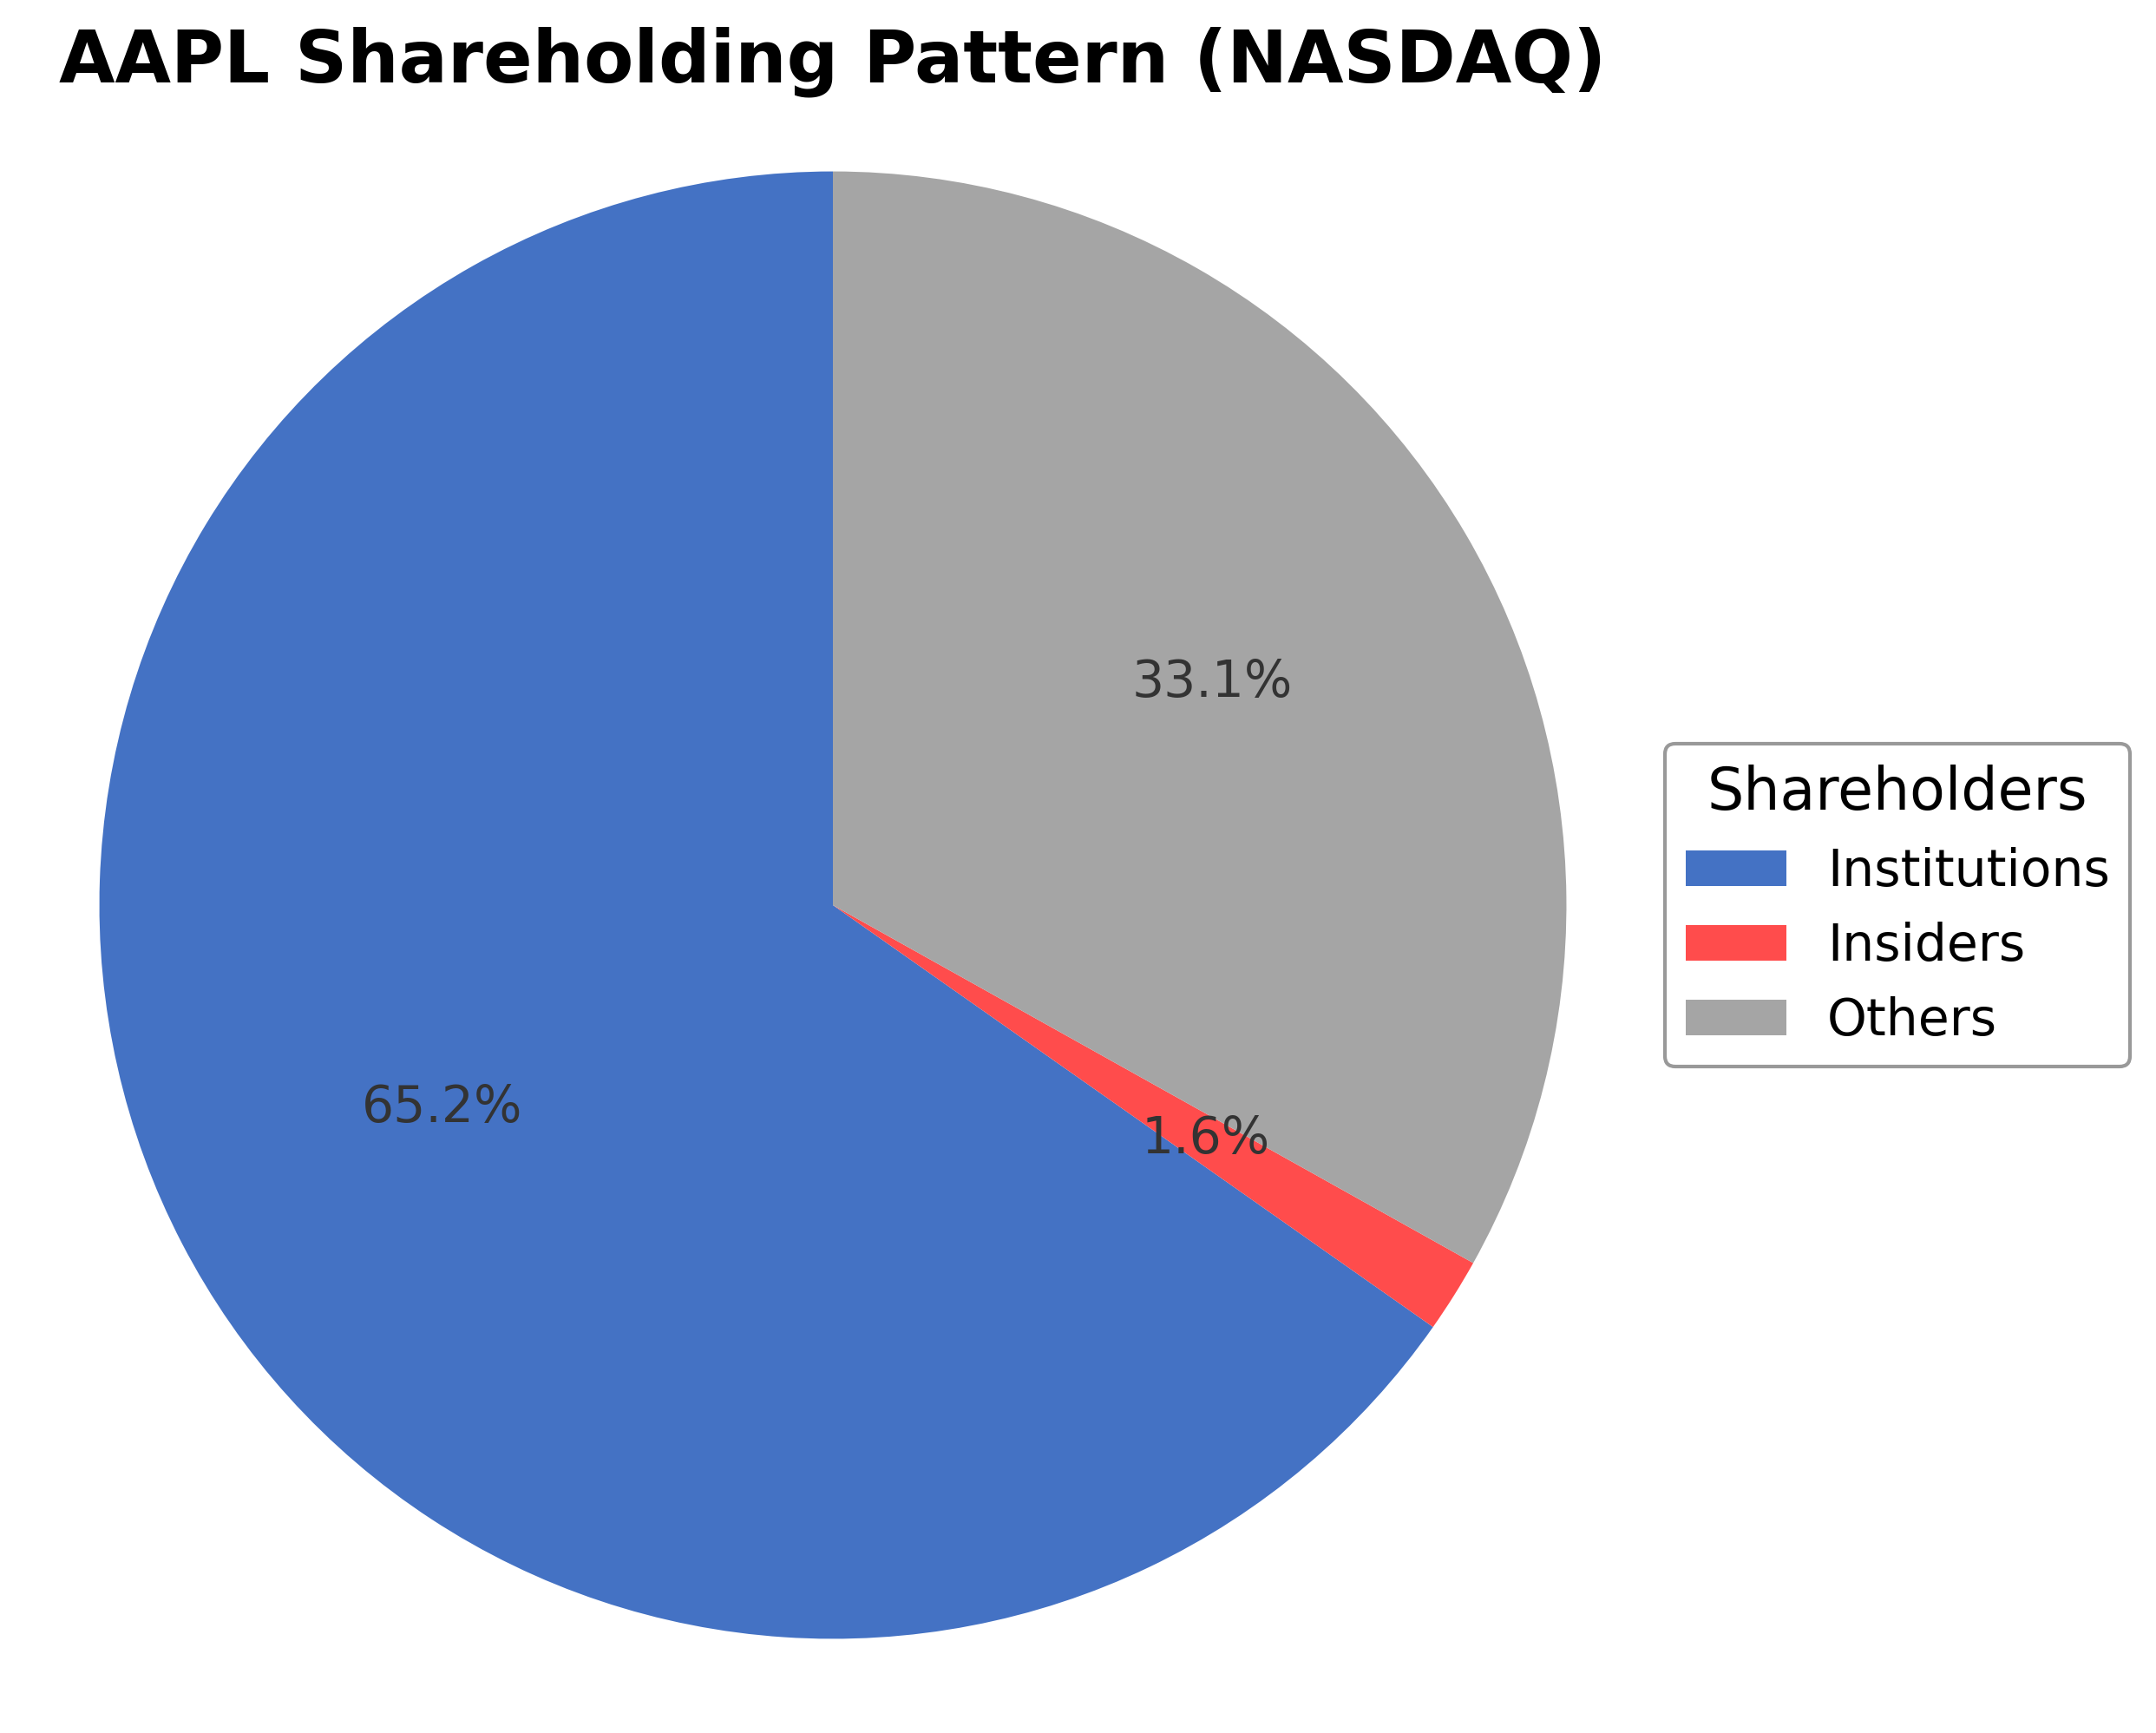
Shareholding Pattern
Sector and Industry Analysis
The global apple market is projected to grow by approximately USD 15.94 billion from 2024 to 2029, with a compound annual growth rate (CAGR) of 3.4%. This growth is supported by increasing consumer demand driven by health benefits and the introduction of new apple varieties. Key players in the market include Auvil Fruit Co. Inc., Batlow Fruit Co. Pty Ltd, Stemilt Growers LLC, and Washington Fruit Growers, among others, which collectively shape the competitive landscape.
Industry trends highlight a rising popularity of urban farming and the expansion of retail sectors, including private-label brands, which are contributing to market growth. The market faces moderate barriers to entry due to established vendor presence and the need for differentiation through product variety and quality. Competitive dynamics are influenced by factors such as pricing strategies, distribution channels (offline and online), and product innovation to meet evolving consumer preferences.
The regulatory environment for the apple market involves compliance with food safety standards and agricultural policies that vary by region, impacting production and distribution practices. Regulations related to pesticide use, import-export controls, and quality certifications play a critical role in market operations. Ongoing regulatory scrutiny aims to ensure consumer safety and sustainability, which will continue to influence market strategies and growth prospects.
Note: Analysis synthesized from industry research, market reports, and regulatory filings. Information is subject to change based on market conditions.
Financial Ratios Dashboard
Illustrative Scenario Analysis
DCF Assumptions:
Method: Two-Stage EPS-Priority Model
Financials
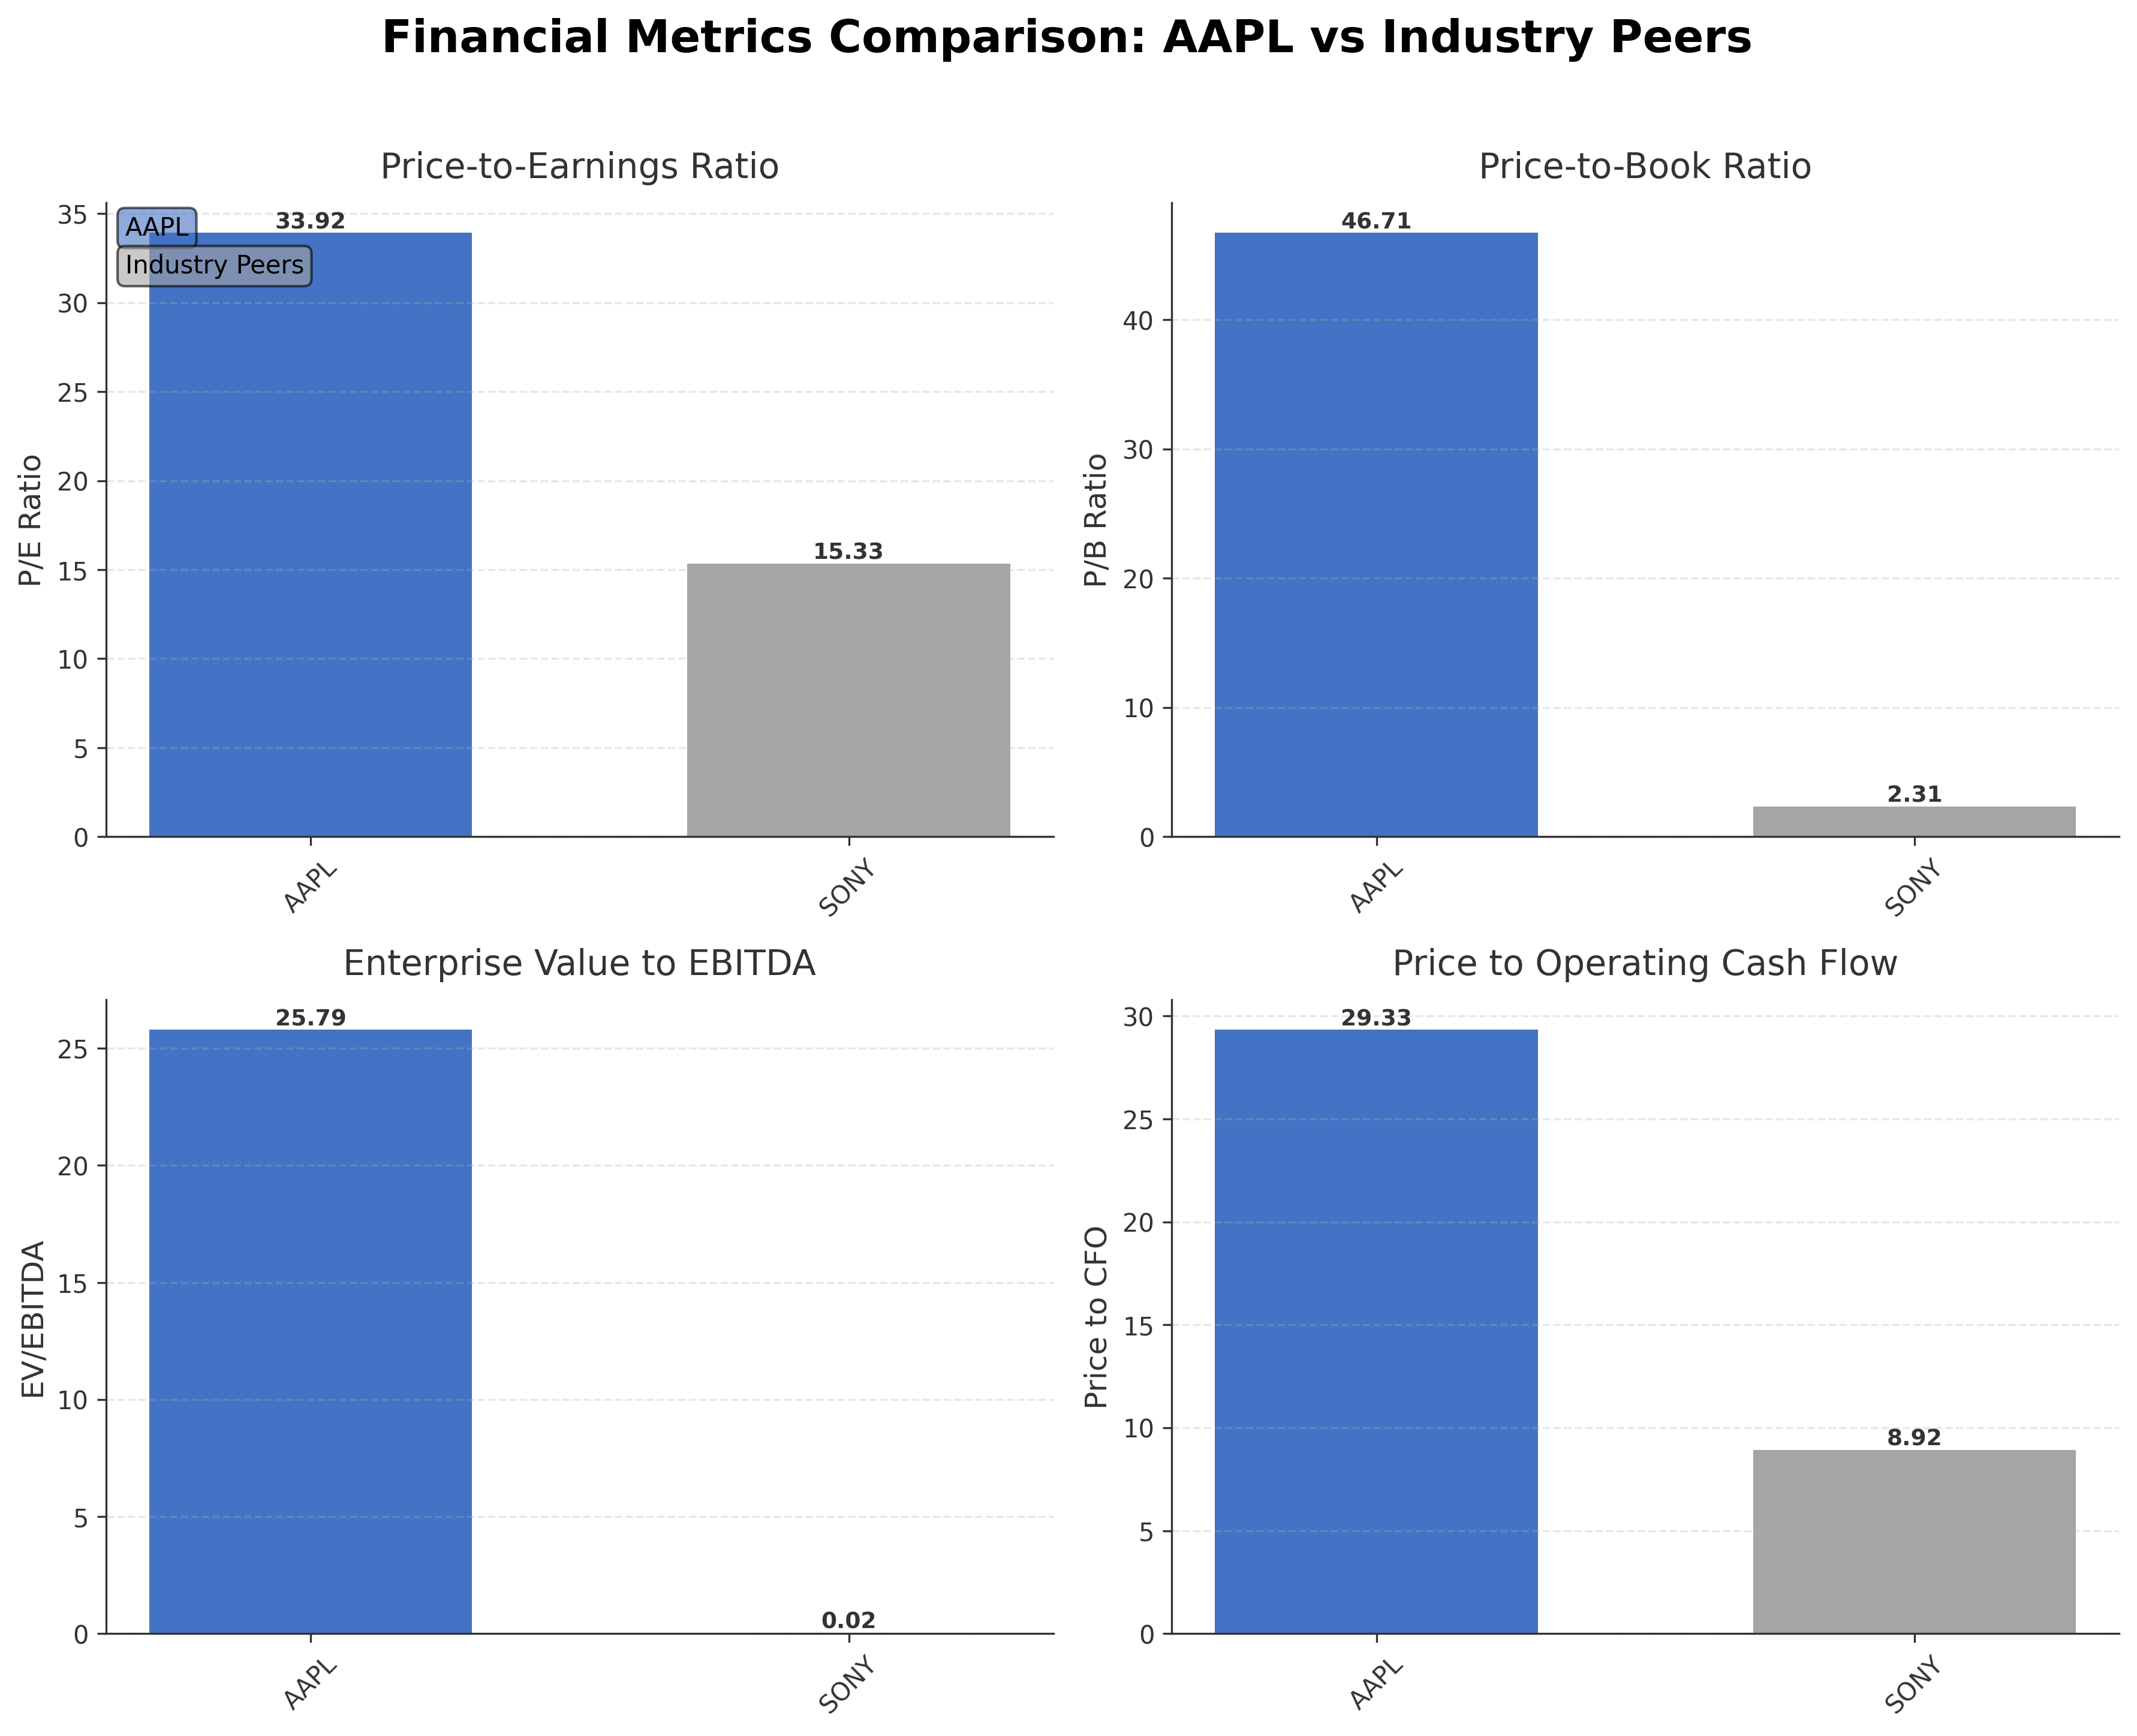
Peer Analysis
| Company Name | Market Cap | P/E Ratio | P/B Ratio | EV/EBITDA | Price to CFO |
|---|---|---|---|---|---|
| Apple Inc | $4.11T | 33.92 | 46.71 | 25.79 | 29.33 |
| Sony Group Corporation - Sponsored American Depositary Receipt | $116.85B | 15.33 | 2.31 | 0.02 | 8.92 |
Comparison Analysis: Apple Inc. significantly outpaces its peer Sony Group Corporation in market capitalization, reflecting its dominant industry position. Apple's P/E ratio of 33.92 is more than double Sony's 15.33, indicating a higher valuation relative to earnings, consistent with its strong profitability and growth prospects. The P/B ratio of 46.71 for Apple is substantially higher than Sony's 2.31, reflecting premium valuation of Apple's brand and assets. Apple's EV/EBITDA of 25.79 contrasts sharply with Sony's minimal 0.02, highlighting Apple's superior earnings before interest, taxes, depreciation, and amortization relative to enterprise value. Return on equity for Apple at 1.41% also exceeds Sony's 0.15%, demonstrating more effective use of equity capital.
Financial Metrics Comparison with Peers
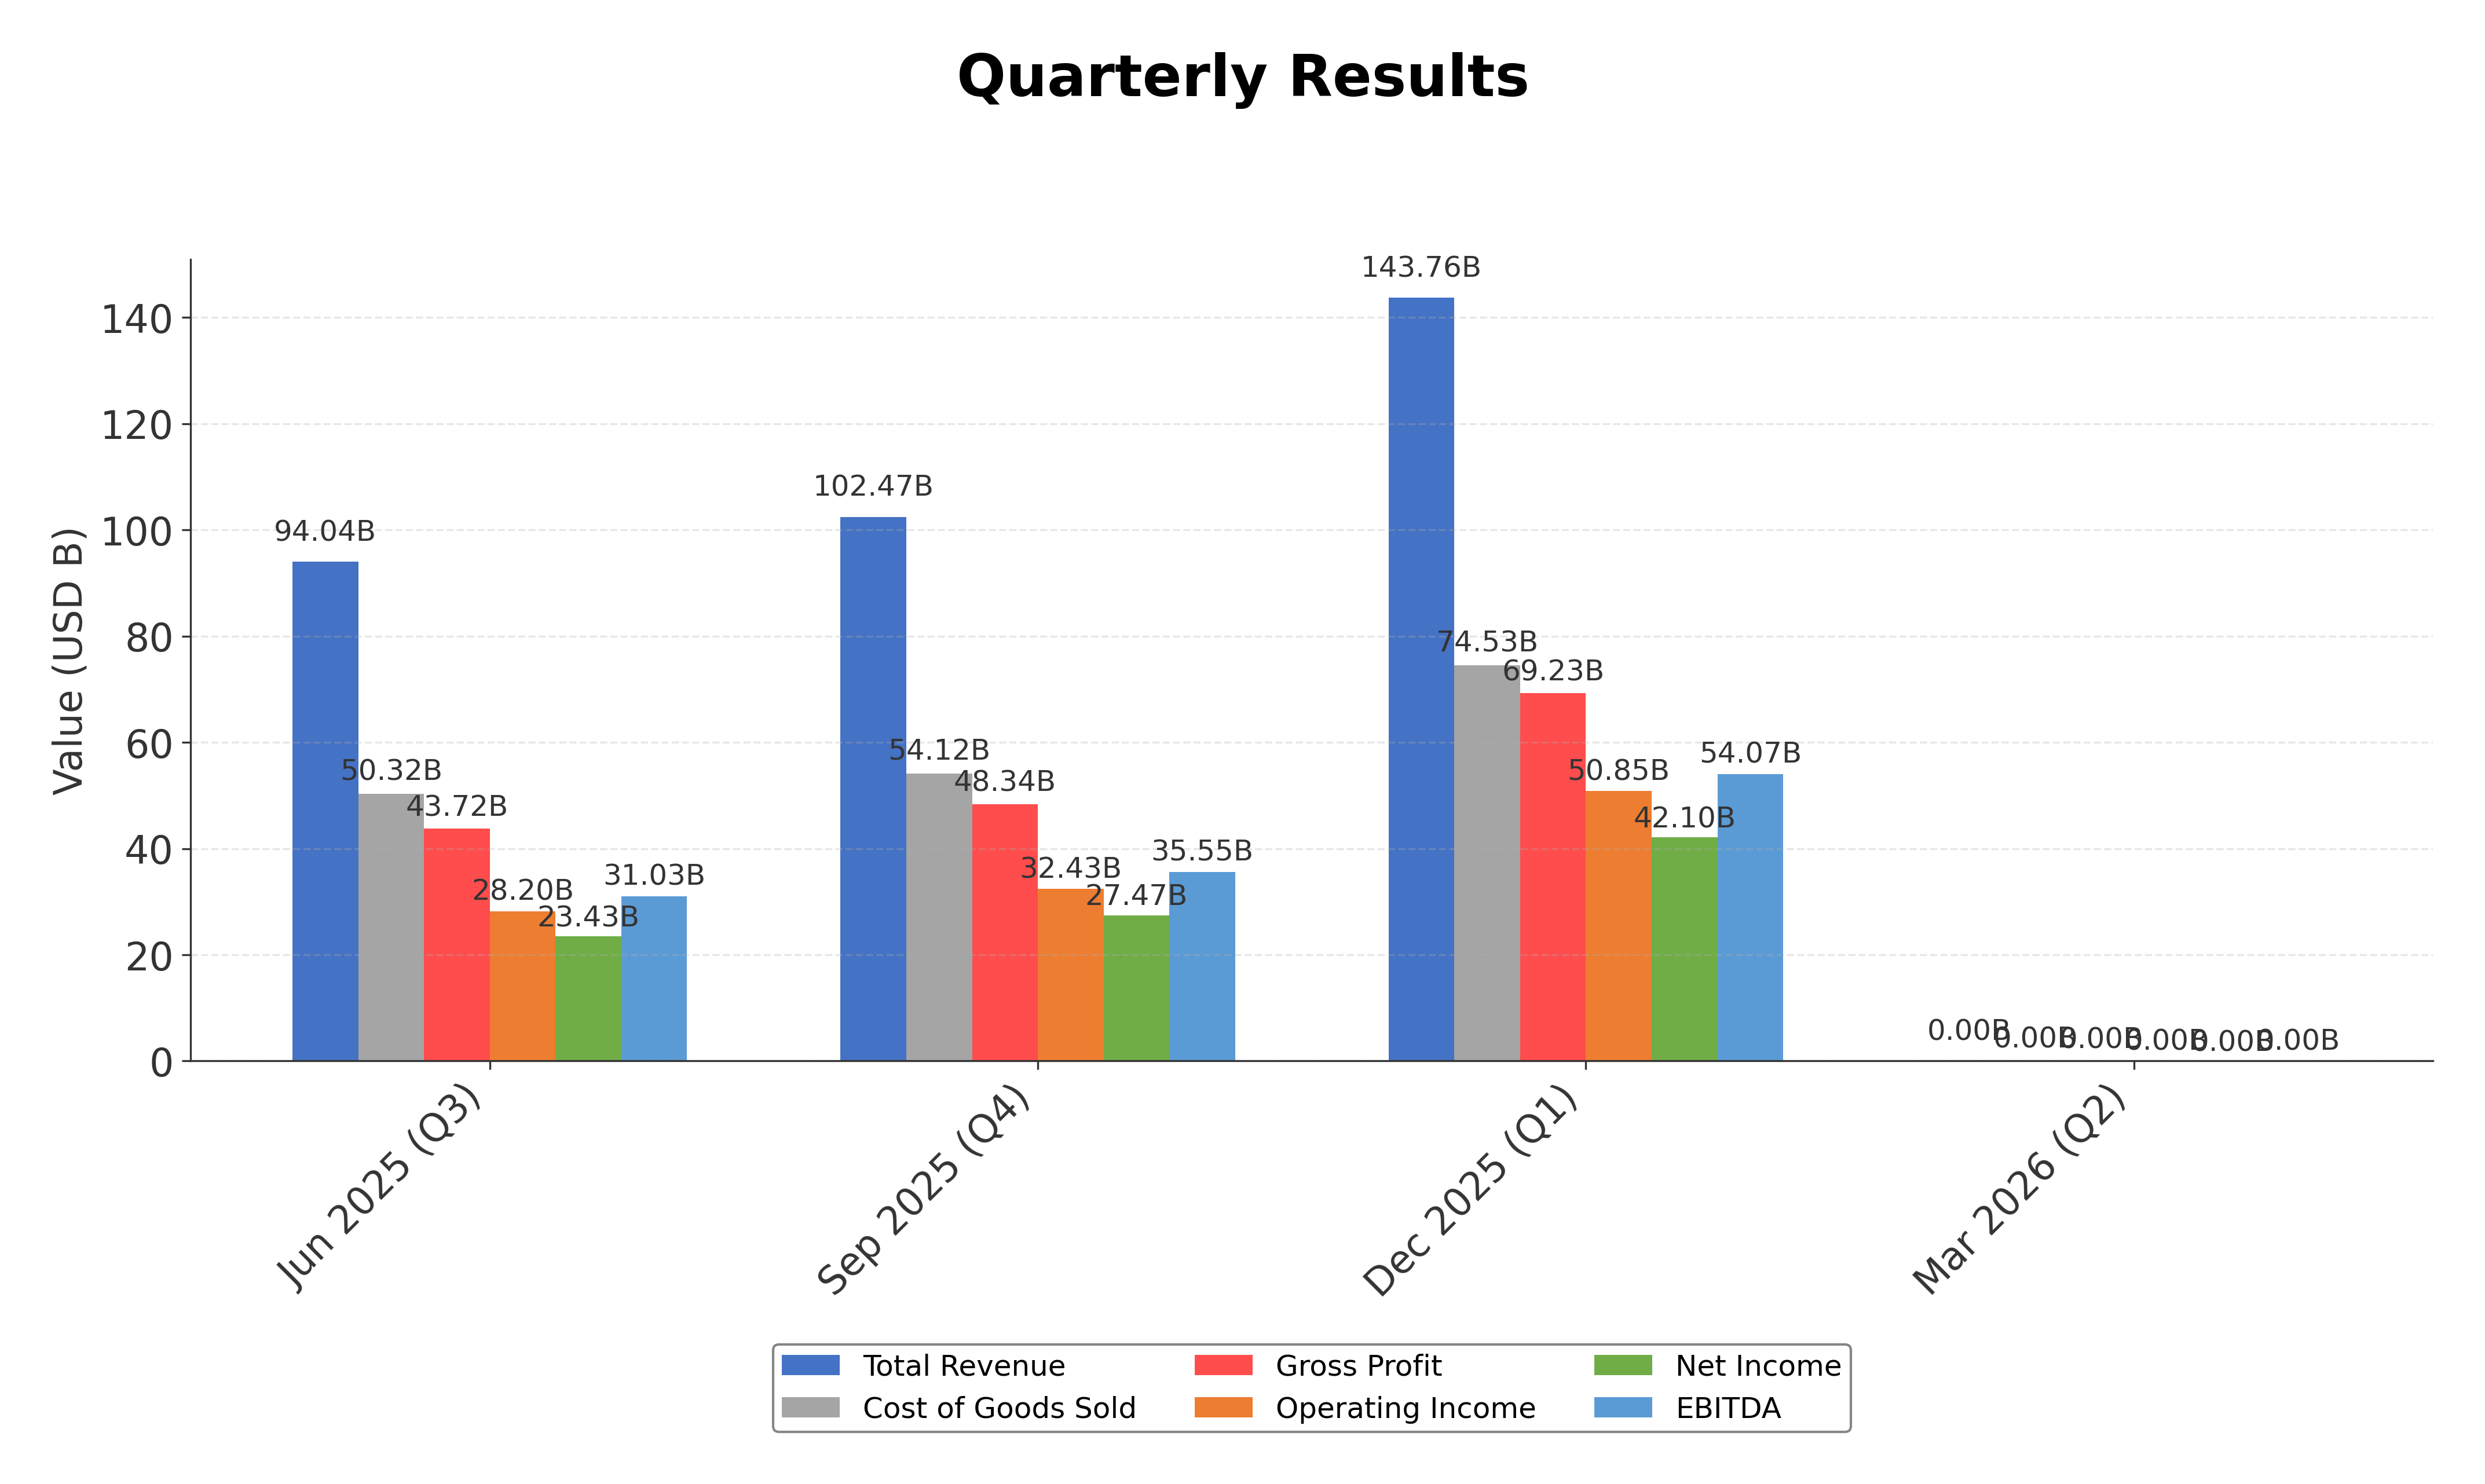
Financial Statements
Comprehensive financial data including income, balance sheet, and cash flow metrics
Income Statement
| fiscal_date | 2025-09-30 | 2024-09-30 | 2023-09-30 | 2022-09-30 | 2021-09-30 |
|---|---|---|---|---|---|
| Sales | 416.16B | 391.04B | 383.29B | 394.33B | 365.82B |
| Cost Of Goods | 220.96B | 210.35B | 214.14B | 223.55B | 212.98B |
| Gross Profit | 195.20B | 180.68B | 169.15B | 170.78B | 152.84B |
| Operating Expense Research And Development | 34.55B | 31.37B | 29.91B | 26.25B | 21.91B |
| Operating Expense Selling General And Administrative | 27.60B | 26.10B | 24.93B | 25.09B | 21.97B |
| Operating Income | 133.05B | 123.22B | 114.30B | 119.44B | 108.95B |
| Other Income Expense | -321.00M | 269.00M | -565.00M | -334.00M | 60.00M |
| Pretax Income | 132.73B | 123.48B | 113.74B | 119.10B | 109.21B |
| Income Tax | 20.72B | 29.75B | 16.74B | 19.30B | 14.53B |
| Net Income | 112.01B | 93.74B | 97.00B | 99.80B | 94.68B |
| Eps Basic | 7.49 | 6.11 | 6.16 | 6.15 | 5.67 |
| Eps Diluted | 7.46 | 6.08 | 6.13 | 6.11 | 5.61 |
| Basic Shares Outstanding | 14.95B | 15.34B | 15.74B | 16.22B | 16.70B |
| Diluted Shares Outstanding | 14.95B | 15.34B | 15.74B | 16.22B | 16.70B |
| Ebit | 133.05B | 123.22B | 114.30B | 119.44B | 111.85B |
| Ebitda | 144.75B | 134.66B | 125.82B | 130.54B | 123.14B |
| Net Income Continuous Operations | 112.01B | 93.74B | 97.00B | 99.80B | 94.68B |
| Non Operating Interest Income | N/A | N/A | 3.75B | 2.83B | 2.84B |
| Non Operating Interest Expense | N/A | N/A | 3.93B | 2.93B | 2.65B |
Source: Financial statements and regulatory filings
Balance Sheet
| fiscal_date | 2025-09-30 | 2024-09-30 | 2023-09-30 | 2022-09-30 | 2021-09-30 |
|---|---|---|---|---|---|
| Cash And Cash Equivalents | 35.93B | 29.94B | 29.96B | 23.65B | 34.94B |
| Accounts Receivable | 39.78B | 33.41B | 29.51B | 28.18B | 26.28B |
| Total Assets | 359.24B | 364.98B | 352.58B | 352.75B | 351.00B |
| Total Liabilities | 285.51B | 308.03B | 290.44B | 302.08B | 287.91B |
| Long Term Debt | 78.33B | 85.75B | 95.28B | 109.71B | 119.38B |
| Shareholders Equity | 73.73B | 56.95B | 62.15B | 50.67B | 63.09B |
Source: Financial statements and regulatory filings
Cash Flow Statement
| fiscal_date | 2025-09-30 | 2024-09-30 | 2023-09-30 | 2022-09-30 | 2021-09-30 |
|---|---|---|---|---|---|
| Operating Activities Net Income | 112.01B | 93.74B | 97.00B | 99.80B | 94.68B |
| Operating Activities Depreciation | 11.70B | 11.45B | 11.52B | 11.10B | 11.28B |
| Operating Activities Stock Based Compensation | 12.86B | 11.69B | 10.83B | 9.04B | 7.91B |
| Operating Activities Other Non Cash Items | -89.00M | -2.27B | -2.23B | 1.01B | -4.92B |
| Operating Activities Accounts Receivable | -7.03B | -5.14B | -417.00M | -9.34B | -14.03B |
| Operating Activities Accounts Payable | 902.00M | 6.02B | -1.89B | 9.45B | 12.33B |
| Operating Activities Other Assets Liabilities | -18.87B | 2.77B | -4.27B | 1.57B | -1.53B |
| Operating Activities Operating Cash Flow | 111.48B | 118.25B | 110.54B | 123.52B | 100.94B |
| Investing Activities Capital Expenditures | -12.71B | -9.45B | -10.96B | -10.71B | -11.09B |
| Investing Activities Purchase Of Investments | -24.41B | -48.66B | -29.51B | -76.92B | -109.56B |
| Investing Activities Sale Of Investments | 53.80B | 62.35B | 45.51B | 67.36B | 106.48B |
| Investing Activities Other Investing Activity | -1.48B | -1.31B | -1.34B | -2.09B | -385.00M |
| Investing Activities Investing Cash Flow | 15.20B | 2.94B | 3.71B | -22.66B | -14.58B |
| Financing Activities Long Term Debt Issuance | 4.48B | 0.00 | 5.23B | 5.46B | 20.39B |
| Financing Activities Long Term Debt Payments | -10.93B | -9.96B | -11.15B | -9.54B | -8.75B |
| Financing Activities Short Term Debt Issuance | -2.03B | 3.96B | -3.98B | 3.96B | 1.02B |
| Financing Activities Common Stock Repurchase | -90.71B | -94.95B | -77.55B | -89.40B | -85.97B |
| Financing Activities Common Dividends | -15.42B | -15.23B | -15.03B | -14.84B | -14.47B |
| Financing Activities Other Financing Charges | -6.07B | -5.80B | -6.01B | -6.38B | -5.58B |
| Financing Activities Financing Cash Flow | -120.69B | -121.98B | -108.49B | -110.75B | -92.25B |
| End Cash Position | 35.93B | 29.94B | 30.74B | 24.98B | 35.93B |
| Income Tax Paid | 43.37B | 26.10B | 18.68B | 19.57B | 25.39B |
| Free Cash Flow | 98.77B | 108.81B | 99.58B | 111.44B | 92.95B |
| Interest Paid | N/A | N/A | 3.80B | 2.87B | 2.69B |
| Operating Activities Deferred Taxes | N/A | N/A | N/A | 895.00M | -4.77B |
| Investing Activities Net Acquisitions | N/A | N/A | N/A | -306.00M | -33.00M |
| Financing Activities Common Stock Issuance | N/A | N/A | N/A | N/A | 1.10B |
Source: Financial statements and regulatory filings
Technical Analysis
Key Insights
- Apple's stock is currently in a strong uptrend, trading near its 52-week high with price action showing higher highs and higher lows.
- Key support levels are identified near $260 and $255, while resistance is close to the recent high around $288.62.
- The stock price is above its 10-day, 50-day ($261.22), and 200-day ($255.18) moving averages, indicating sustained bullish momentum.
- Momentum indicators show a Relative Strength Index (RSI) near overbought levels but not extreme, MACD remains positive, and Stochastic oscillators suggest continued upward momentum.
- Multi-timeframe analysis across daily, weekly, and monthly charts confirms a consistent bullish trend with no significant reversal signals.
- Potential market scenarios include continuation of the uptrend supported by strong earnings and technical strength, with caution advised near resistance levels where profit-taking could occur.
Trending News
1. Headline: Apple reaches $250mn settlement over delayed ‘AI Siri’
Summary: iPhone buyers sued the tech giant for touting features in 2024 that have yet to launch
Sentiment: negative
2. Headline: Micron Stock: Apple CEO Issues Stark Warning on Memory Demand | MU - TheStreet
Summary: A blunt take from Apple is turning heads on Wall Street.
Sentiment: negative
3. Headline: Intel soars 13% on report of Apple chip talks, hits new all-time high
Summary: The jump comes on reports that Apple is discussing using Intel chips for its U.S. devices and follows a historic 114% surge last month.
Sentiment: positive
4. Headline: Intel Stock Soars on Reported Chip Talks With Apple - Business Insider
Summary: Intel stock rose by double digits to a fresh record high on Tuesday. The move came after a report of talks with Apple for a chipmaking partnership. Intel eclipsed its dot-com era peak last week after strong earnings. ... Summaries are generated by an AI model trained on Business Insider's articles. AI may make mistakes or provide inaccurate/incomplete ...
Sentiment: positive
5. Headline: Apple Explores Using Intel and Samsung to Build Main Device Chips in the US
Summary: (Bloomberg) -- Apple Inc. has held exploratory discussions about using Intel Corp. and Samsung Electronics Co. to produce the main processors for its devices in the US, a move that would offer a secondary option beyond longtime partner Taiwan Semiconductor Manufacturing Co.Most Read from ...
Sentiment: neutral
Recent Updates
News Summary
As of May 5, 2026. Apple has engaged in exploratory discussions with Intel Corp. and Samsung Electronics Co. to manufacture the main processors for its devices in the United States, aiming to diversify its chip supply chain beyond Taiwan Semiconductor Manufacturing Co. The talks remain preliminary with no confirmed orders. In its fiscal second quarter ended March 28, 2026, Apple reported record revenue of $111.2 billion, a 17% year-over-year increase, and diluted EPS of $2.01, up 22%. The company highlighted strong demand for the iPhone 17 lineup and record services revenue. Apple declared a 4% increase in its quarterly dividend and authorized a $100 billion share repurchase program, reflecting robust cash flow and capital return strategy. The company continues to provide investor information through its corporate website and maintains transparency via SEC filings and earnings calls.
News Sentiment
The overall sentiment from recent updates is predominantly positive, driven by strong financial performance with record revenues and earnings growth, as well as strategic initiatives to enhance supply chain resilience. The exploratory talks with Intel and Samsung signal proactive risk management amid global supply constraints. Dividend increases and substantial share repurchase authorization further support a constructive capital allocation outlook. Neutral tones arise from the preliminary nature of chip manufacturing discussions and routine investor communications. No significant negative developments are evident in the recent material disclosures, indicating stable operational momentum.
Source List
- https://www.cnbc.com/2026/04/30/apple-aapl-q2-2026-earnings-report.html
Analytical Overview
Analysis Summary
Apple’s valuation metrics, including a trailing P/E of 33.92 and forward P/E of 29.39, are elevated relative to the consumer electronics industry average P/E of approximately 33.92, reflecting premium pricing consistent with its market leadership and growth profile. The company’s revenue growth of 16.6% year-over-year and strong operating cash flow of $140.2 billion demonstrate a solid growth trajectory supported by robust product demand and expanding services revenue. Financial health appears strong with a manageable debt-to-equity ratio of 79.55% and substantial free cash flow of $100.5 billion, enabling capital returns and strategic investments. Sector-specific challenges include supply chain constraints and competitive pressures, while opportunities arise from diversification of chip manufacturing and expansion of digital services. Market positioning and competitive advantages include a loyal customer base, integrated ecosystem, and innovation leadership.
Overall Business and Market Assessment
Supporting Factors: Apple’s record revenue and earnings growth, strong cash flow generation, and strategic initiatives to diversify supply chain risks
Risk Factors: potential supply chain disruptions, legal challenges such as the AI Siri settlement, and competitive dynamics in consumer electronics and semiconductor supply
SWOT Analysis
Strengths
- Market leadership in consumer electronics and digital services.
- Robust profitability with a 27.15% profit margin and strong cash flow generation.
- Strong brand recognition and a loyal global customer base.
- Substantial cash reserves and manageable debt levels.
Weaknesses
- High valuation multiples relative to industry peers.
- Dependence on a limited number of flagship products like the iPhone.
- Supply chain constraints impacting product availability.
- Legal and regulatory challenges such as the AI Siri settlement.
Opportunities
- Diversification of chip manufacturing with Intel and Samsung partnerships.
- Growth in digital services and subscription-based platforms.
- Expansion into emerging markets and new product categories.
- Increased capital return programs including share repurchases.
Threats
- Intense competition in technology and consumer electronics sectors.
- Geopolitical risks affecting supply chains and manufacturing.
- Rapid technological changes requiring continuous innovation.
- Regulatory scrutiny and potential litigation risks.
Company Description
Apple Inc. is a leading technology company renowned for designing, manufacturing, and marketing innovative hardware and software products for consumers and businesses worldwide. Its flagship product, the iPhone, accounts for the majority of sales, serving as the central hub of an expansive ecosystem that includes Mac computers, iPad tablets, Apple Watch wearables, and accessories like AirPods. Apple Inc. also offers a suite of services such as the App Store, Apple Music, iCloud, Apple TV+, and Apple Fitness+, providing digital content, cloud storage, and subscription-based platforms. Operating in the consumer electronics industry within the technology sector, the company employs approximately 166,000 people and maintains a broad global presence through online stores, retail outlets, and partnerships with carriers and resellers. With a substantial market capitalization reflecting its scale, Apple Inc. plays a pivotal role in shaping consumer technology trends, emphasizing seamless integration across devices and services to enhance user experience and productivity.