
Apple Inc (AAPL)
Stock Analysis Report
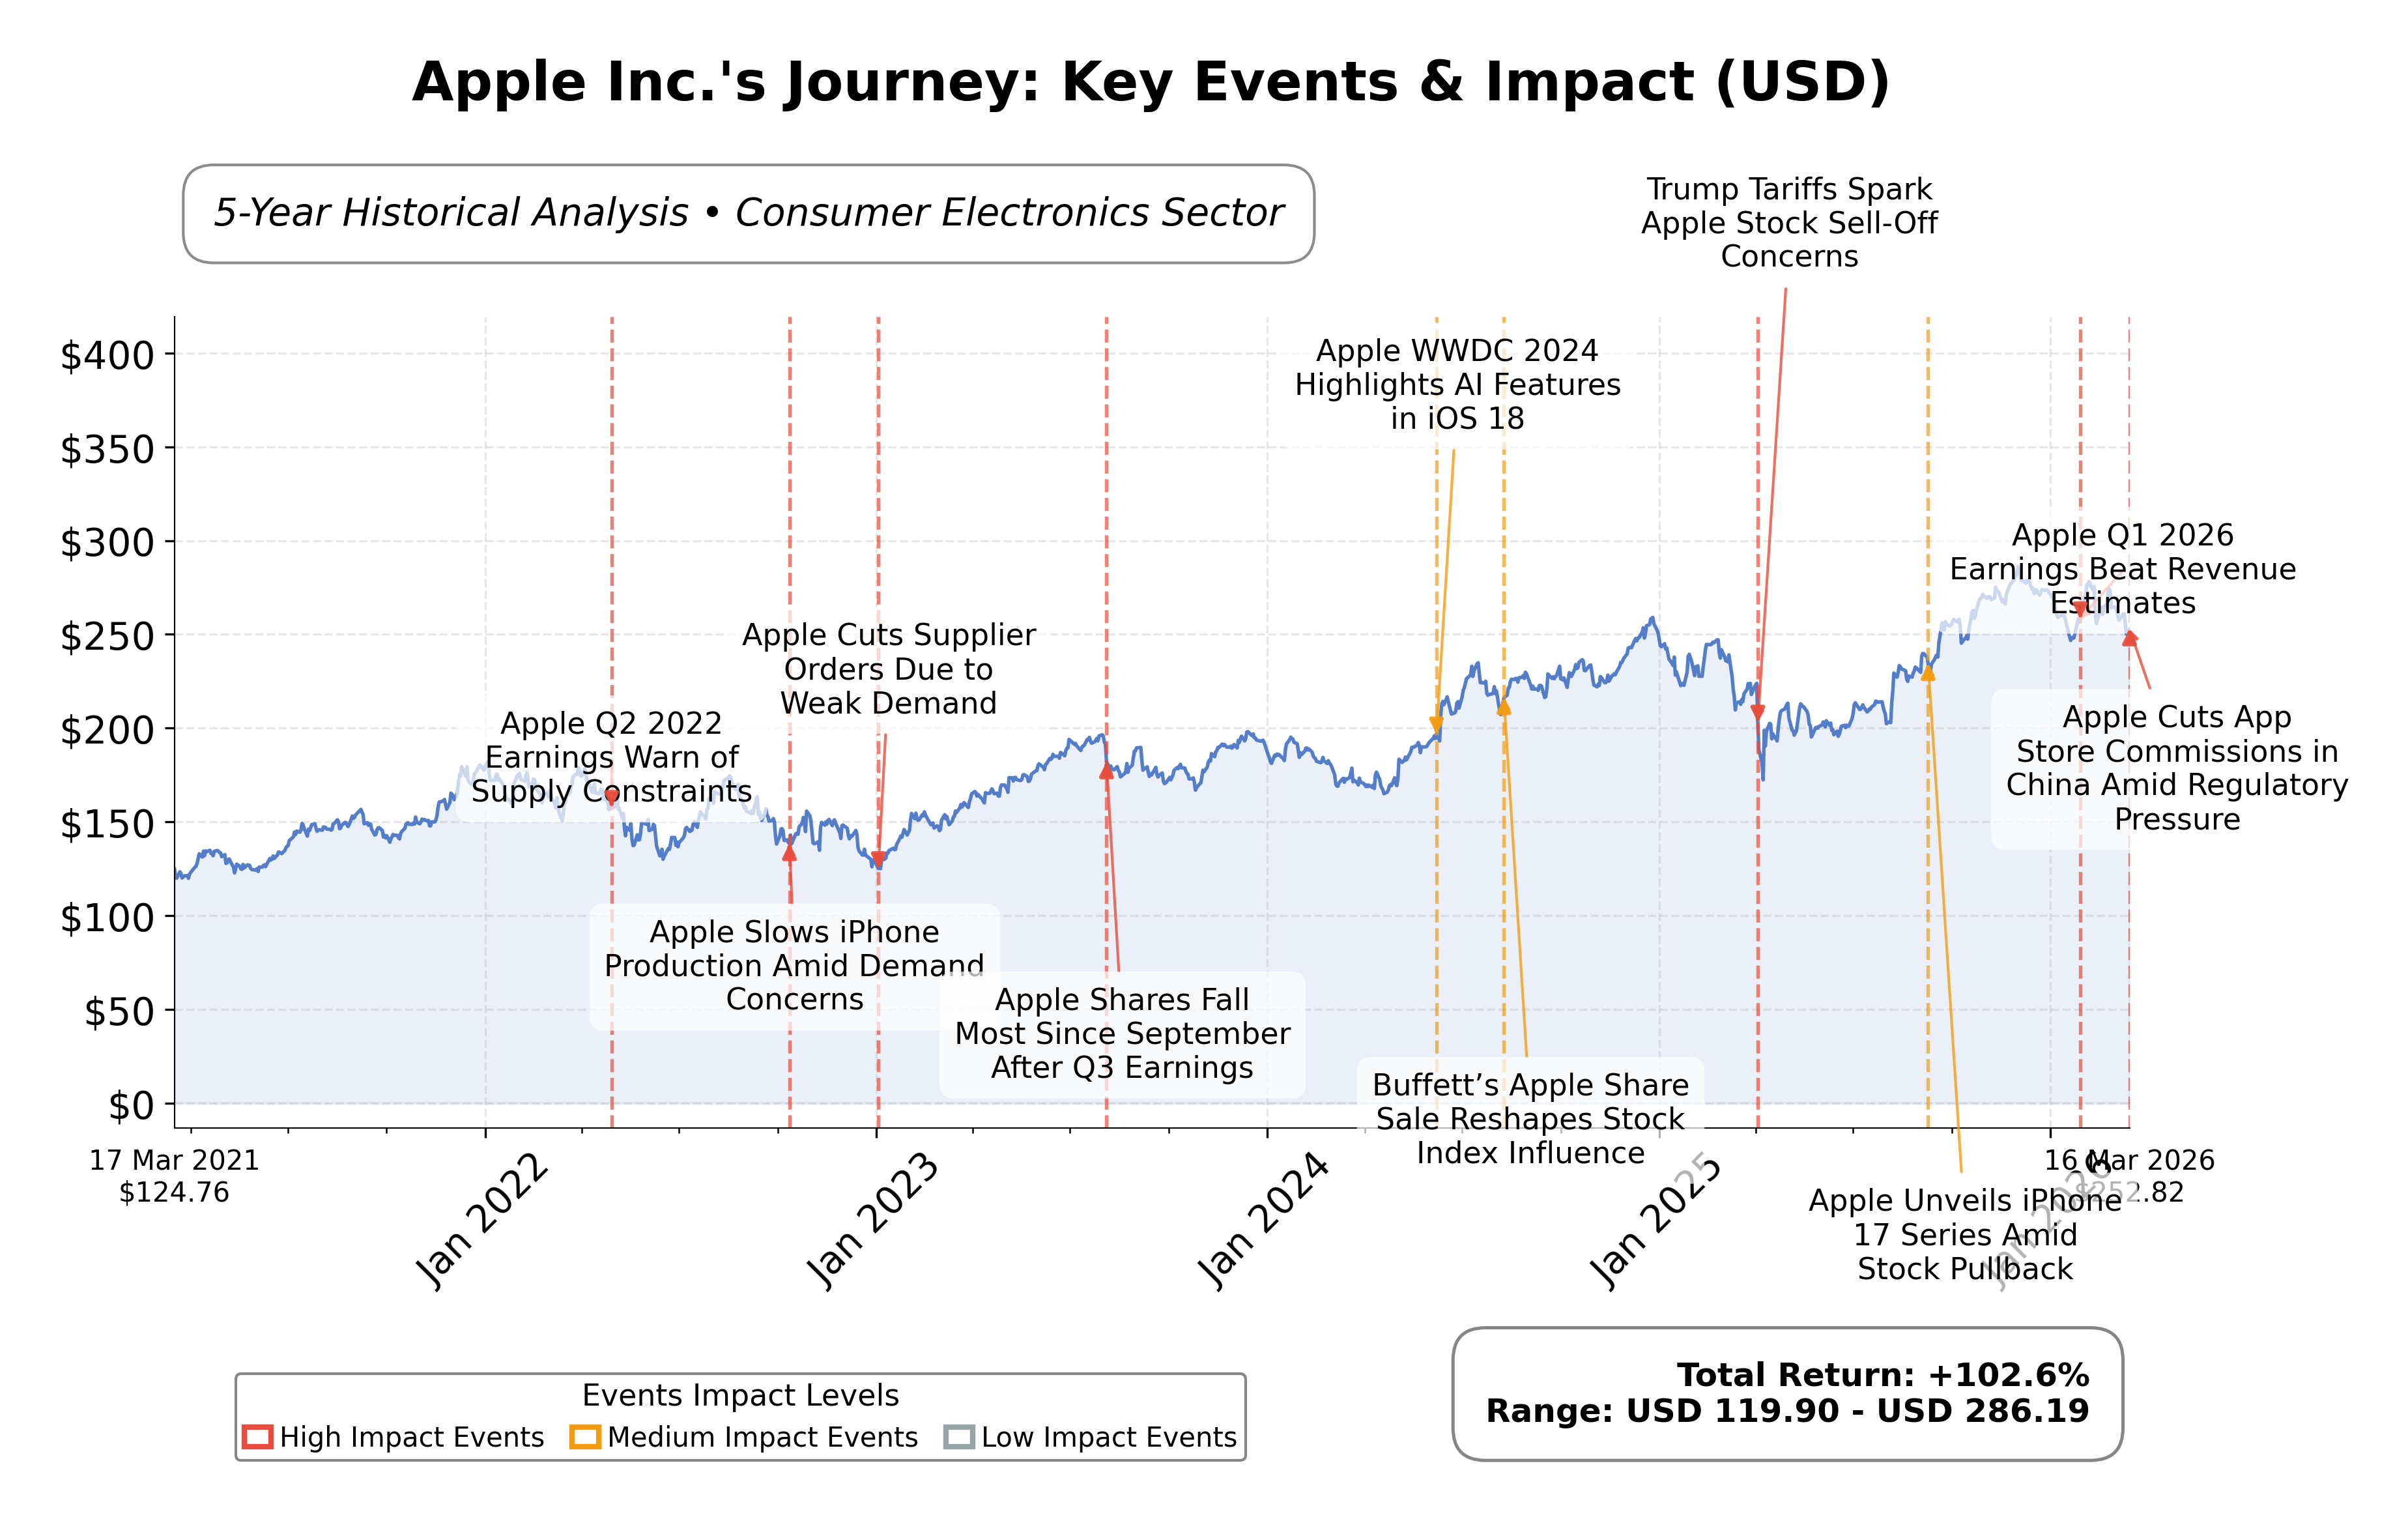
Stock Journey
Key Positives and Key Risks
Pros
- Market capitalization of $3.68 trillion reflects substantial scale and market leadership.
- Strong revenue growth of 15.7% year-over-year supports a positive growth trajectory.
- Robust operating cash flow of $135.5 billion indicates healthy liquidity and operational efficiency.
Cons
- High price-to-book ratio of 42.64 suggests a premium valuation that may limit upside.
- Debt-to-equity ratio exceeding 100% indicates significant leverage on the balance sheet.
- Recent institutional selling by multiple funds points to cautious sentiment among some large shareholders.
Disclosure: This information is for general awareness and does not constitute investment advice
Report Summary
Apple Inc. operates as a leading technology company specializing in the design, manufacture, and marketing of consumer electronics and software products. Its core offerings include the iPhone, Mac computers, iPad tablets, Apple Watch, and a variety of accessories, complemented by a growing suite of digital services such as the App Store, Apple Music, iCloud, and Apple TV+. Positioned prominently in the consumer electronics industry within the technology sector, Apple maintains a significant global footprint through retail stores, online platforms, and partnerships.
Financially, Apple demonstrates robust performance with a market capitalization exceeding $3.67 trillion and a trailing P/E ratio of approximately 32.37, aligned with industry averages. The company reports strong profitability metrics including a profit margin of 27.0%, operating margin of 35.4%, and a return on assets near 24.4%. Revenue growth remains solid at 15.7% year-over-year, supported by substantial operating and free cash flows of $135.5 billion and $106.3 billion respectively. Dividend yield stands modestly at 0.42%, reflecting a balanced approach to shareholder returns.
From a strategic perspective, Apple recently unveiled the second-generation AirPods Max and completed an acquisition of MotionVFX to enhance its services ecosystem. Leadership continuity under CEO Tim Cook remains a notable strength, while institutional shareholding exceeds 65%, indicating strong institutional interest. Risks include regulatory scrutiny, particularly in markets like China, and competitive pressures in consumer electronics. Recent share activity shows mixed institutional buying and selling, suggesting varied sentiment.
In peer comparison within the consumer electronics sector and U.S. market, Appleâs valuation metrics such as P/E and P/B ratios are significantly higher than peers like Sony Group Corporation, reflecting its premium market positioning and growth expectations. Appleâs return on equity also surpasses many competitors, underscoring operational efficiency. However, its elevated valuation multiples may imply heightened expectations relative to peers.
Apple navigates a complex industry landscape marked by rapid innovation, regulatory challenges, and evolving consumer preferences. Recent product launches and strategic acquisitions highlight ongoing efforts to sustain growth and ecosystem integration. The company faces pivotal moments in balancing innovation, market expansion, and regulatory compliance. Given the current financial and market data, a neutral and observant stance may be appropriate for those evaluating the stock, considering both the companyâs strengths and the risks inherent in its operating environment.
Company and Industry Overview
Company Basics
Price Performance
Company Size
Shareholding Pattern
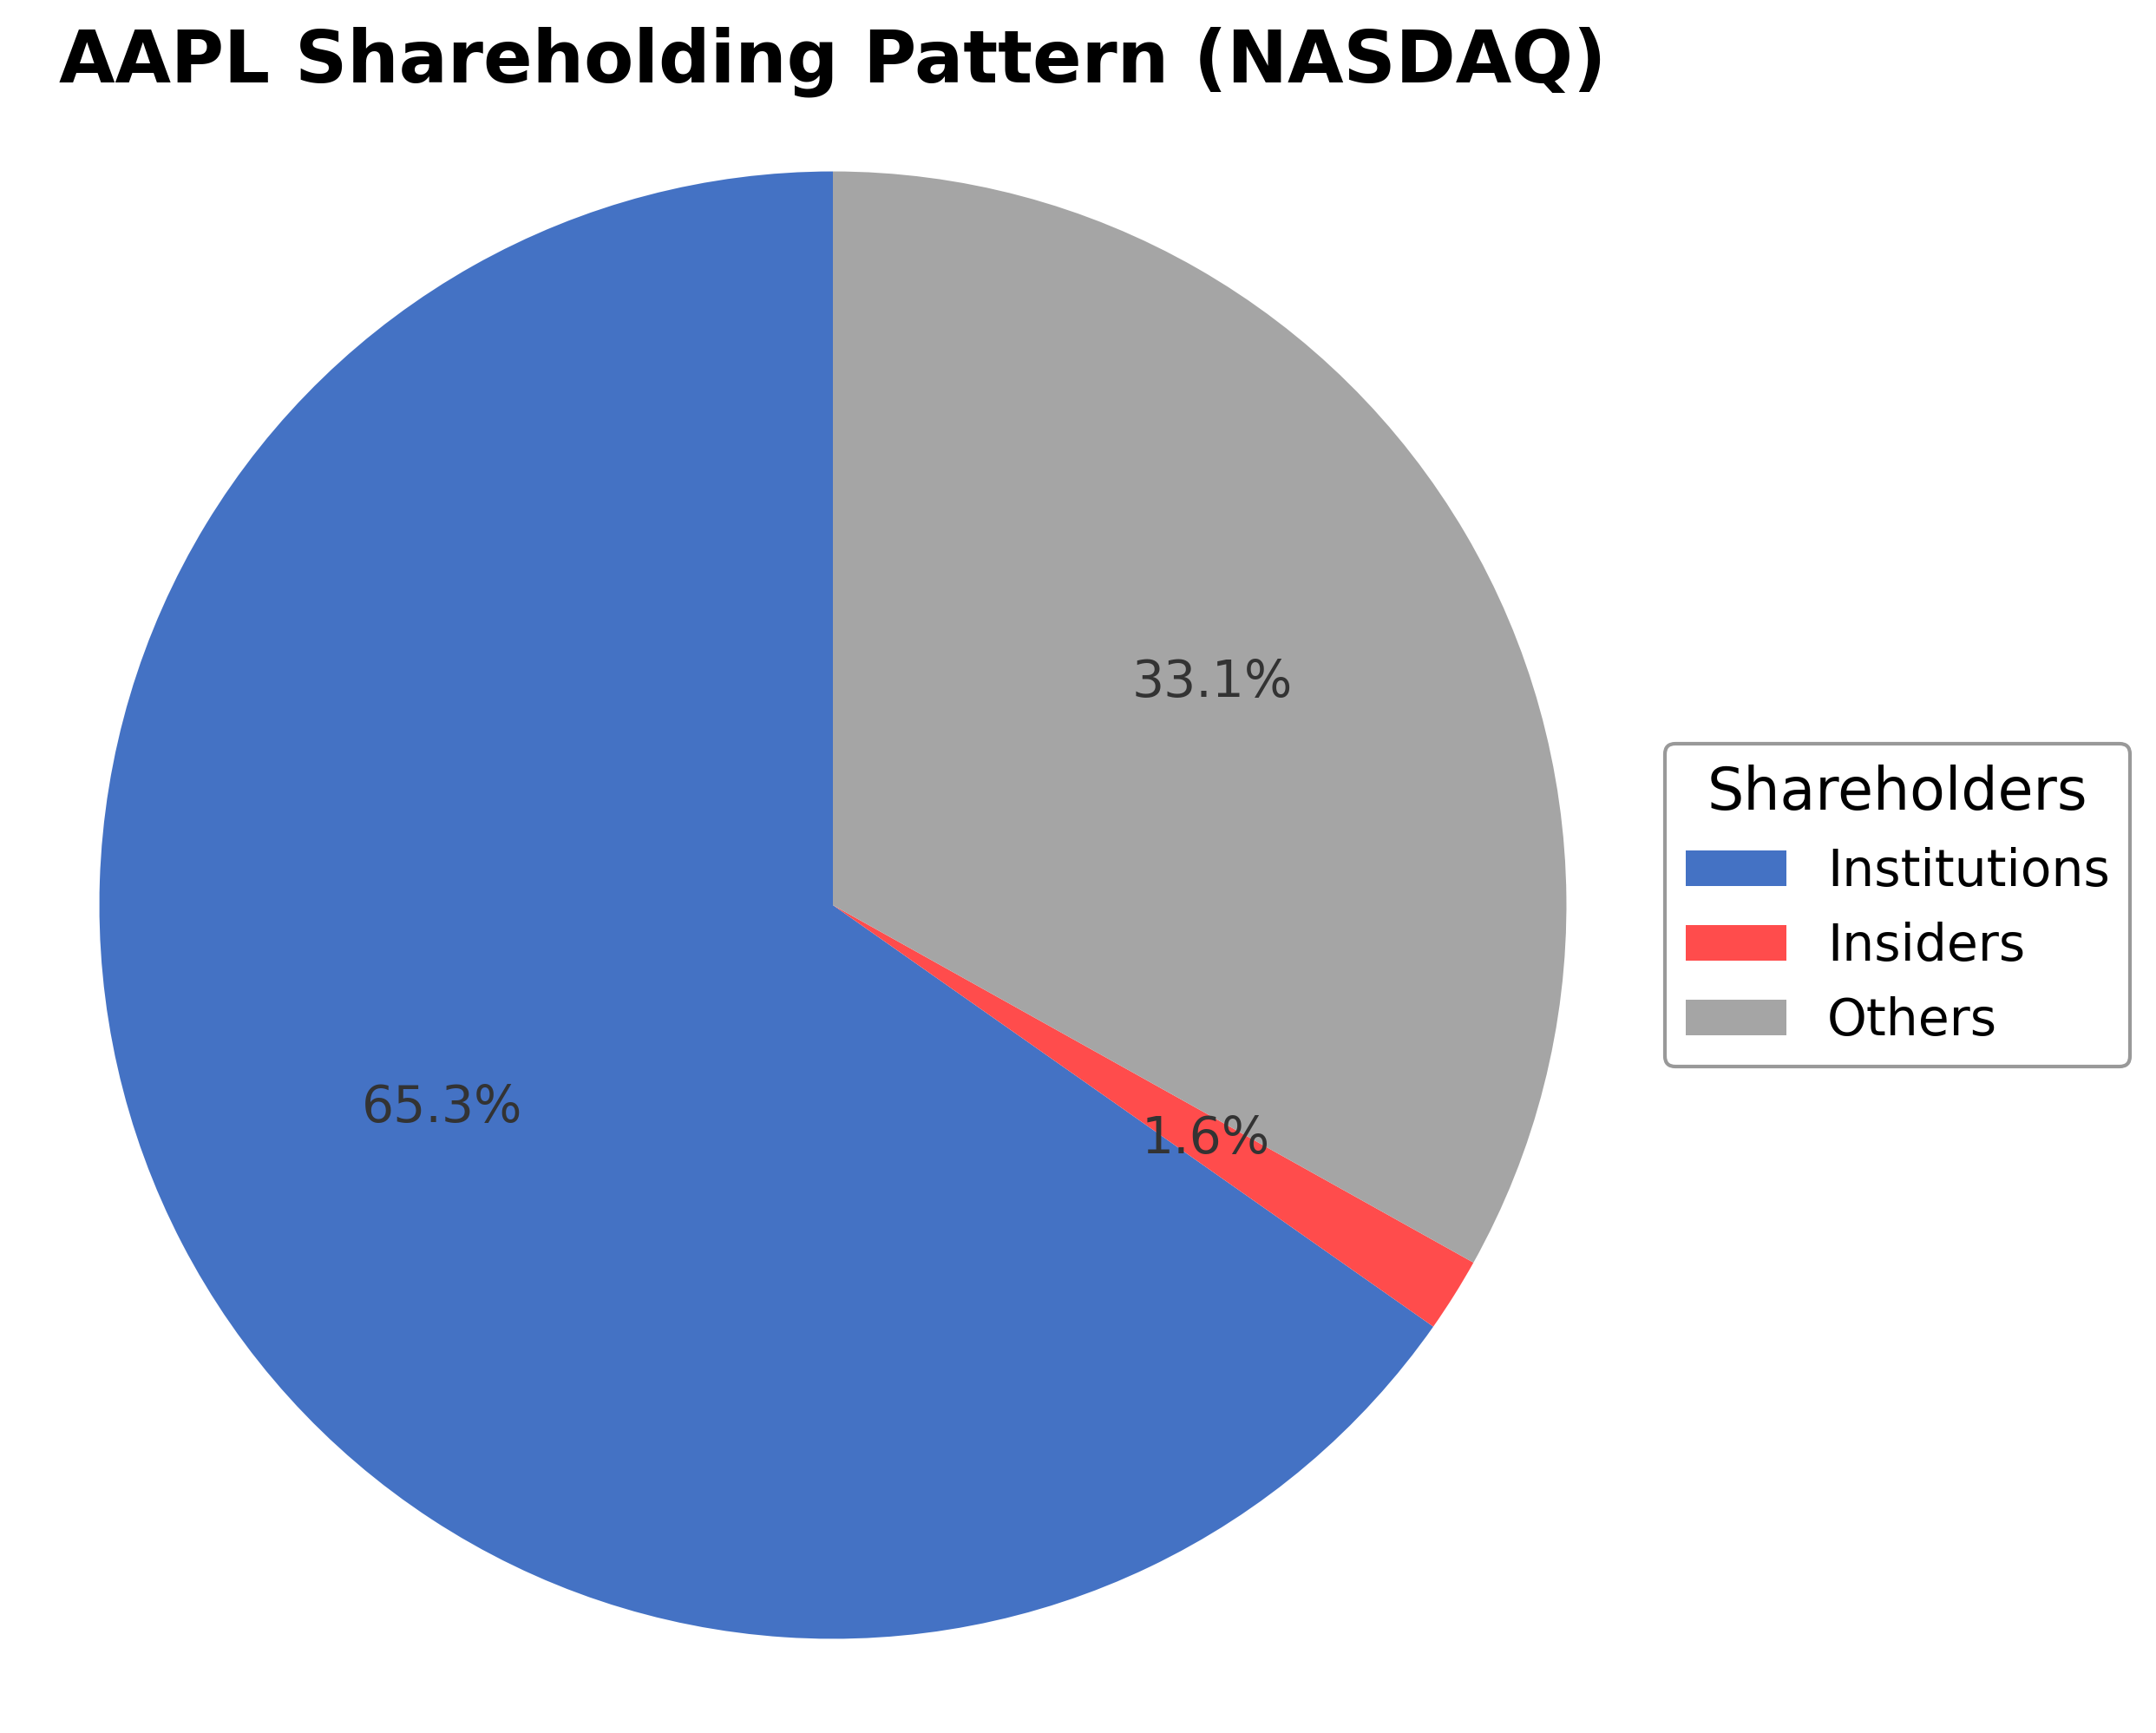
Apple Inc.'s ownership structure is characterized by a significant institutional investor presence at approximately 65.26%, reflecting strong confidence from mutual funds, pension funds, and asset managers. Insider holdings, including executives and board members, represent about 1.64%, while other shareholders, including retail investors and employee stock plans, account for roughly 34.74%. Over the past 12-24 months, institutional accumulation has shown mixed activity with notable increases by firms such as Fred Alger Management LLC, alongside reductions by others like Elevation Point Wealth Partners LLC and Clough Capital Partners L P. These patterns suggest a nuanced market sentiment balancing optimism about Apple's innovation and growth prospects with caution around valuation and regulatory risks. The current ownership distribution supports robust governance structures and strategic direction, potentially influencing future corporate decisions and market positioning within the consumer electronics industry.
Sector and Industry Analysis
Apple Inc. (AAPL) operates primarily within the Technology sector, specifically in the hardware and consumer electronics industry. This sector is characterized by rapid innovation, large market capitalization, and significant global consumer demand. The global consumer electronics market, encompassing smartphones, personal computers, tablets, and wearable devices, is valued in the trillions of dollars and continues to grow steadily, driven by technological advancements and increasing digitalization worldwide. Key players alongside Apple include Samsung, Microsoft, Google, and Huawei, each competing across overlapping product lines and ecosystems. Apple’s dominant position is anchored by its flagship iPhone, which constitutes the majority of its revenue, supplemented by Mac computers, iPads, Apple Watch, and a growing services segment including streaming, subscriptions, and software.
Industry trends reflect a strong pivot toward integrated ecosystems combining hardware, software, and services. Consumer behavior increasingly favors seamless user experiences, privacy, and device interoperability, which Apple addresses through its proprietary operating systems and chip designs. Technological shifts include the adoption of augmented reality (AR), artificial intelligence (AI), and 5G connectivity, all of which present emerging opportunities for product innovation and new revenue streams. The expansion of subscription-based services and content streaming also diversifies revenue beyond hardware sales, mitigating cyclicality and enhancing customer retention. Additionally, supply chain dynamics, including partnerships with key manufacturers like Foxconn and chip foundries such as TSMC, remain critical for scaling production and maintaining cost efficiencies.
The regulatory landscape for Apple and its peers is increasingly complex, involving data privacy laws (e.g., GDPR in Europe, CCPA in California), antitrust scrutiny, and trade policies affecting global supply chains. Compliance with these regulations impacts product design, data handling, and market access. Antitrust investigations and litigation, particularly concerning app store practices and ecosystem control, pose ongoing challenges and potential operational constraints. Moreover, environmental regulations and sustainability mandates are shaping corporate strategies around product lifecycle management and carbon footprint reduction, with growing investor and consumer attention on ESG factors.
Competitive dynamics in the hardware industry are defined by high barriers to entry due to substantial capital requirements, advanced R&D capabilities, and established brand loyalty. Apple’s competitive positioning benefits from its integrated ecosystem, strong brand equity, and control over both hardware and software, which creates switching costs for consumers. The market structure is oligopolistic, with a few dominant firms controlling significant market share. Innovation pace, supply chain management, and ecosystem expansion are key competitive levers. While new entrants face challenges in scale and technology, incumbents continuously invest in proprietary technologies and strategic partnerships to sustain differentiation and market leadership.
Note: Analysis synthesized from industry research, market reports, and regulatory filings. Information is subject to change based on market conditions.
Illustrative Scenario Analysis
DCF Assumptions:
Method: Two-Stage EPS-Priority Model
Financials
Peer Analysis
| Company Name | Market Cap | P/E Ratio | P/B Ratio | EV/EBITDA | Price to CFO |
|---|---|---|---|---|---|
| Apple Inc. | $3.68T | 32.37 | 42.64 | 24.71 | 27.14 |
| Sony Group Corporation - Sponsored American Depositary Receipt | $127.61B | 16.53 | 2.50 | 0.03 | 9.90 |
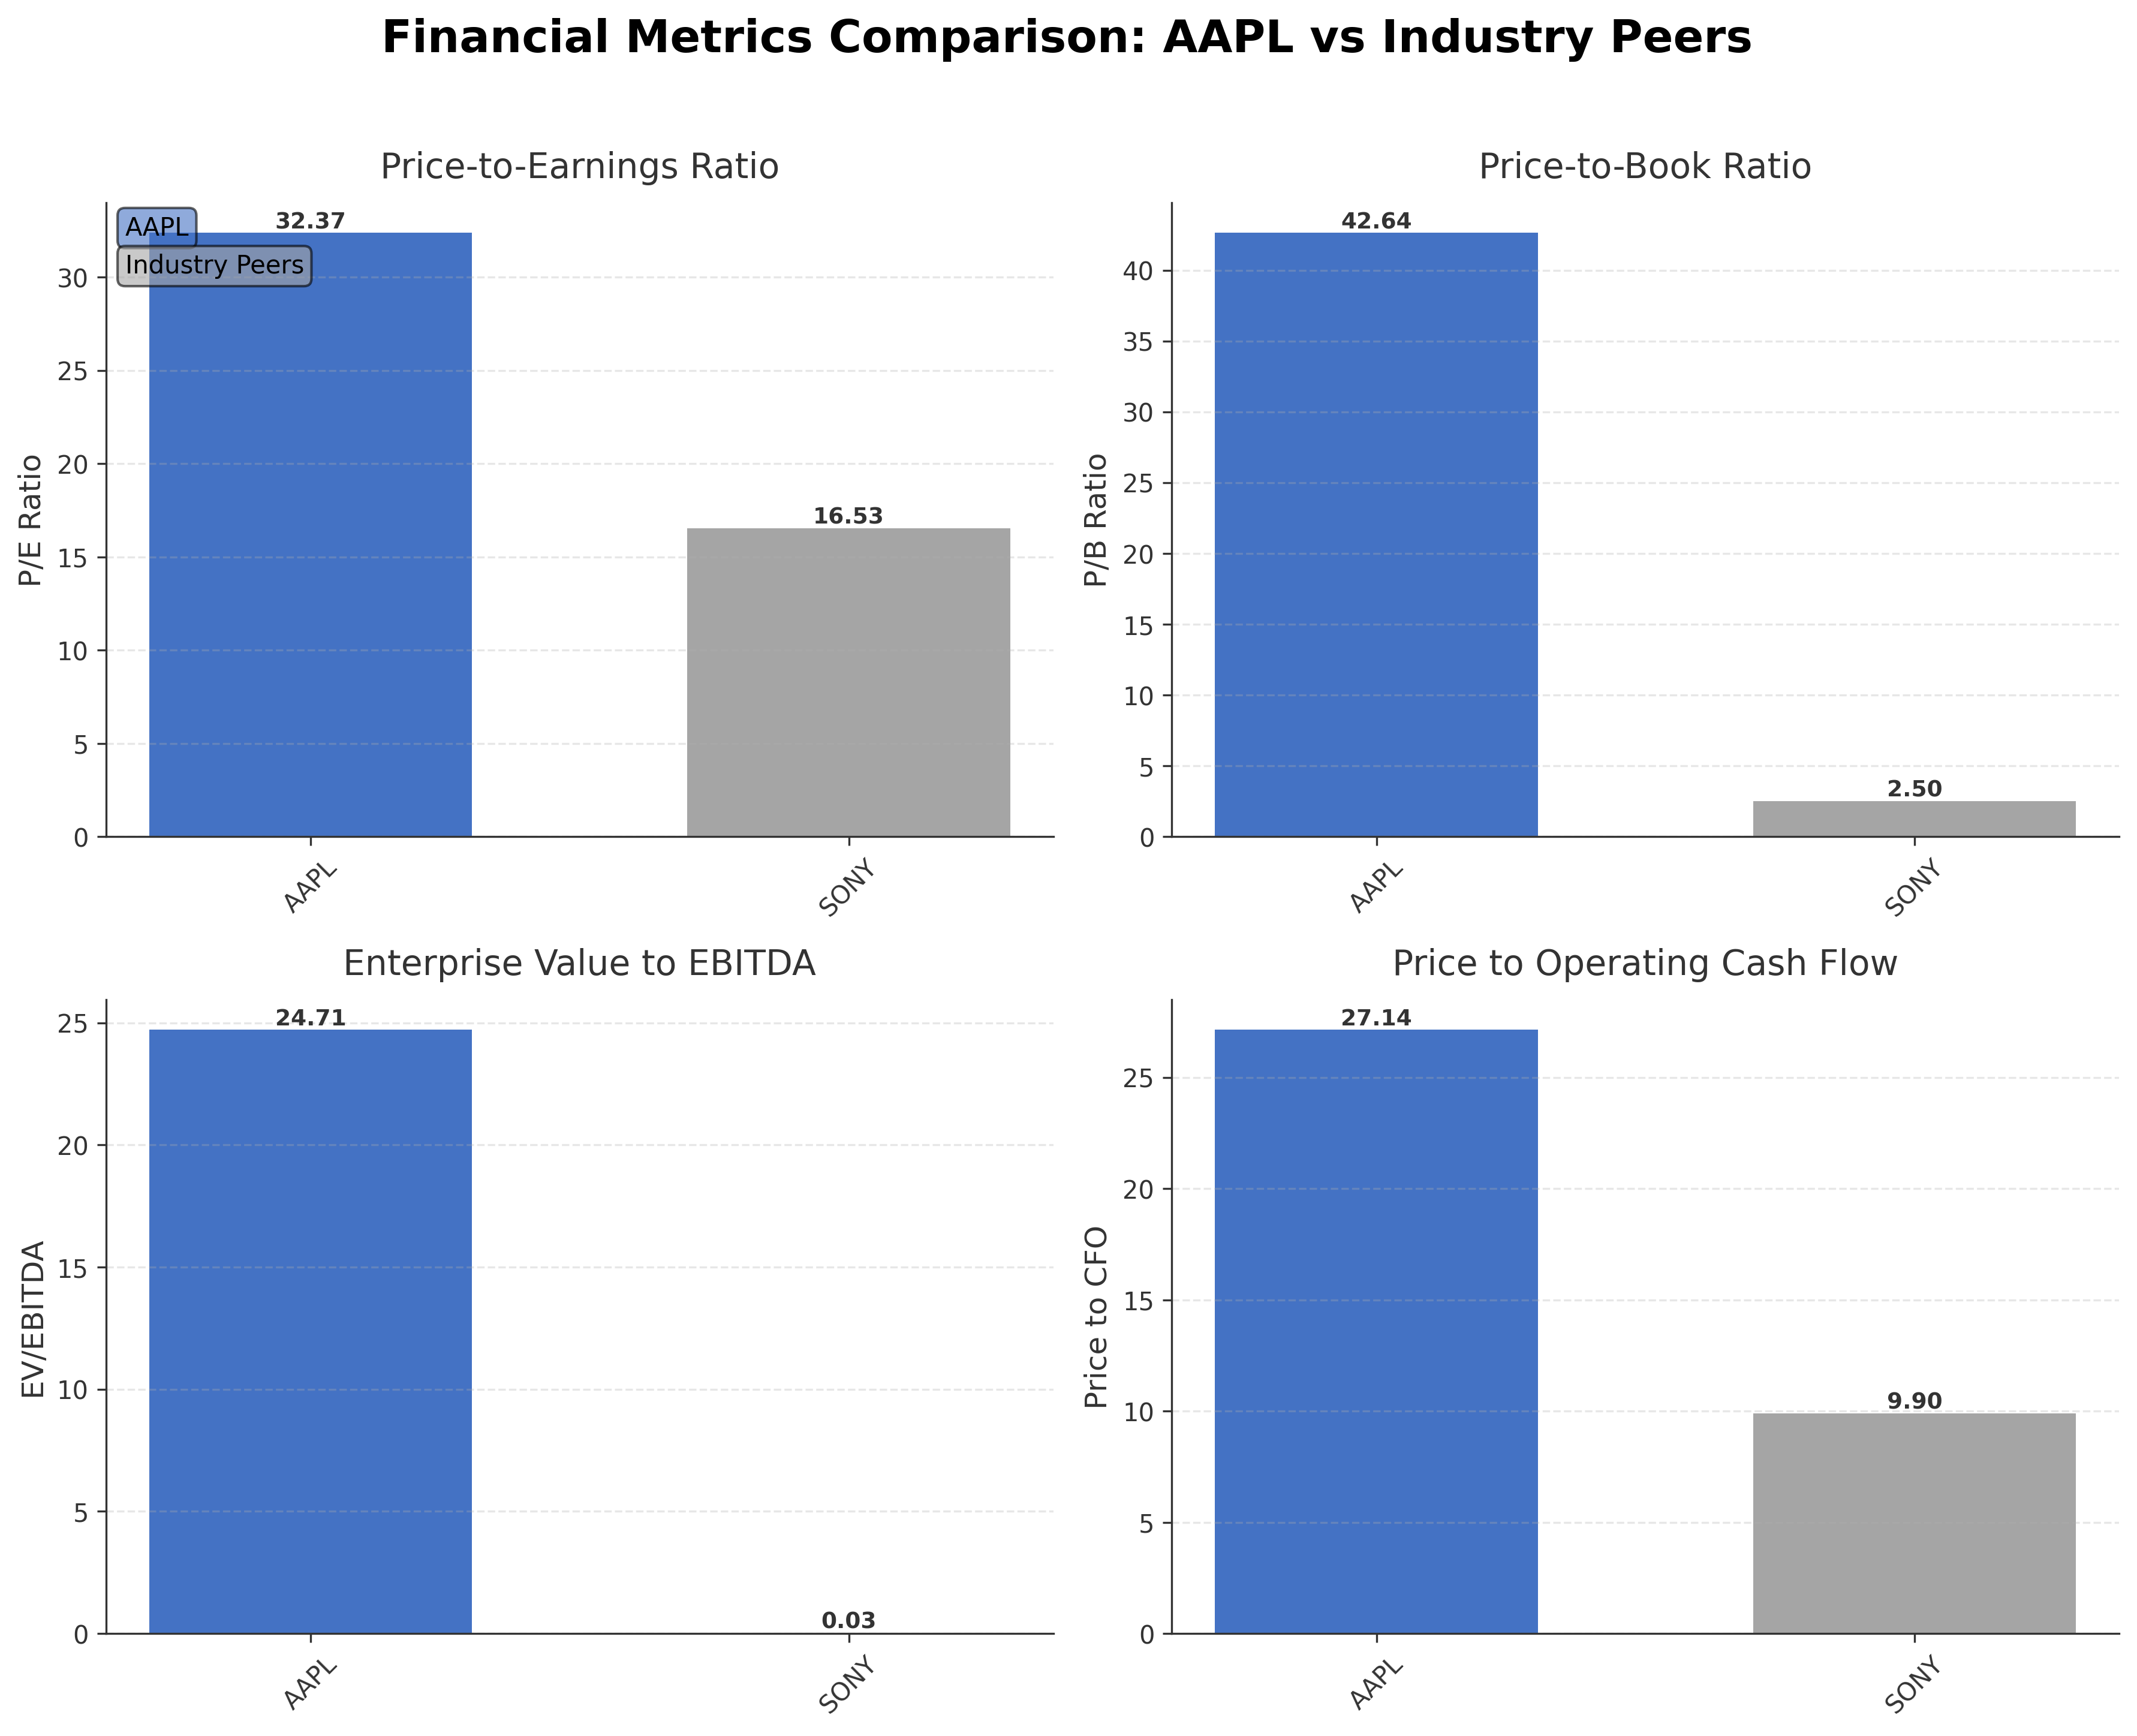
Comparison Analysis: Apple Inc. exhibits substantially higher valuation multiples compared to its peer Sony Group Corporation, with a P/E ratio of 32.37 versus Sony's 16.53 and a P/B ratio of 42.64 compared to 2.50. Apple's EV/EBITDA and price to CFO metrics similarly exceed those of Sony, reflecting its premium market valuation and growth expectations. The return on equity for Apple at 1.52% notably surpasses Sony's 0.15%, indicating stronger profitability and capital efficiency. These differences underscore Apple's dominant market position and investor confidence relative to regional industry peers.
Financial Metrics Comparison with Peers
Financial Statements
Comprehensive financial data including income, balance sheet, and cash flow metrics
Income Statement
| fiscal_date | 2025-09-30 | 2024-09-30 | 2023-09-30 | 2022-09-30 | 2021-09-30 |
|---|---|---|---|---|---|
| Sales | 416.16B | 391.04B | 383.29B | 394.33B | 365.82B |
| Cost Of Goods | 220.96B | 210.35B | 214.14B | 223.55B | 212.98B |
| Gross Profit | 195.20B | 180.68B | 169.15B | 170.78B | 152.84B |
| Operating Expense Research And Development | 34.55B | 31.37B | 29.91B | 26.25B | 21.91B |
| Operating Expense Selling General And Administrative | 27.60B | 26.10B | 24.93B | 25.09B | 21.97B |
| Operating Income | 133.05B | 123.22B | 114.30B | 119.44B | 108.95B |
| Other Income Expense | -321.00M | 269.00M | -565.00M | -334.00M | 60.00M |
| Pretax Income | 132.73B | 123.48B | 113.74B | 119.10B | 109.21B |
| Income Tax | 20.72B | 29.75B | 16.74B | 19.30B | 14.53B |
| Net Income | 112.01B | 93.74B | 97.00B | 99.80B | 94.68B |
| Eps Basic | 7.49 | 6.11 | 6.16 | 6.15 | 5.67 |
| Eps Diluted | 7.46 | 6.08 | 6.13 | 6.11 | 5.61 |
| Basic Shares Outstanding | 14.95B | 15.34B | 15.74B | 16.22B | 16.70B |
| Diluted Shares Outstanding | 14.95B | 15.34B | 15.74B | 16.22B | 16.70B |
| Ebit | 133.05B | 123.22B | 114.30B | 119.44B | 111.85B |
| Ebitda | 144.75B | 134.66B | 125.82B | 130.54B | 123.14B |
| Net Income Continuous Operations | 112.01B | 93.74B | 97.00B | 99.80B | 94.68B |
| Non Operating Interest Income | N/A | N/A | 3.75B | 2.83B | 2.84B |
| Non Operating Interest Expense | N/A | N/A | 3.93B | 2.93B | 2.65B |
Data provided by Twelve Data
Balance Sheet
| fiscal_date | 2025-09-30 | 2024-09-30 | 2023-09-30 | 2022-09-30 | 2021-09-30 |
|---|---|---|---|---|---|
| Cash And Cash Equivalents | 35.93B | 29.94B | 29.96B | 23.65B | 34.94B |
| Accounts Receivable | 39.78B | 33.41B | 29.51B | 28.18B | 26.28B |
| Total Assets | 359.24B | 364.98B | 352.58B | 352.75B | 351.00B |
| Total Liabilities | 285.51B | 308.03B | 290.44B | 302.08B | 287.91B |
| Long Term Debt | 78.33B | 85.75B | 95.28B | 109.71B | 119.38B |
| Shareholders Equity | 73.73B | 56.95B | 62.15B | 50.67B | 63.09B |
Data provided by Twelve Data
Cash Flow Statement
| fiscal_date | 2025-09-30 | 2024-09-30 | 2023-09-30 | 2022-09-30 | 2021-09-30 |
|---|---|---|---|---|---|
| Operating Activities Net Income | 112.01B | 93.74B | 97.00B | 99.80B | 94.68B |
| Operating Activities Depreciation | 11.70B | 11.45B | 11.52B | 11.10B | 11.28B |
| Operating Activities Stock Based Compensation | 12.86B | 11.69B | 10.83B | 9.04B | 7.91B |
| Operating Activities Other Non Cash Items | -89.00M | -2.27B | -2.23B | 1.01B | -4.92B |
| Operating Activities Accounts Receivable | -7.03B | -5.14B | -417.00M | -9.34B | -14.03B |
| Operating Activities Accounts Payable | 902.00M | 6.02B | -1.89B | 9.45B | 12.33B |
| Operating Activities Other Assets Liabilities | -18.87B | 2.77B | -4.27B | 1.57B | -1.53B |
| Operating Activities Operating Cash Flow | 111.48B | 118.25B | 110.54B | 123.52B | 100.94B |
| Investing Activities Capital Expenditures | -12.71B | -9.45B | -10.96B | -10.71B | -11.09B |
| Investing Activities Purchase Of Investments | -24.41B | -48.66B | -29.51B | -76.92B | -109.56B |
| Investing Activities Sale Of Investments | 53.80B | 62.35B | 45.51B | 67.36B | 106.48B |
| Investing Activities Other Investing Activity | -1.48B | -1.31B | -1.34B | -2.09B | -385.00M |
| Investing Activities Investing Cash Flow | 15.20B | 2.94B | 3.71B | -22.66B | -14.58B |
| Financing Activities Long Term Debt Issuance | 4.48B | 0.00 | 5.23B | 5.46B | 20.39B |
| Financing Activities Long Term Debt Payments | -10.93B | -9.96B | -11.15B | -9.54B | -8.75B |
| Financing Activities Short Term Debt Issuance | -2.03B | 3.96B | -3.98B | 3.96B | 1.02B |
| Financing Activities Common Stock Repurchase | -90.71B | -94.95B | -77.55B | -89.40B | -85.97B |
| Financing Activities Common Dividends | -15.42B | -15.23B | -15.03B | -14.84B | -14.47B |
| Financing Activities Other Financing Charges | -6.07B | -5.80B | -6.01B | -6.38B | -5.58B |
| Financing Activities Financing Cash Flow | -120.69B | -121.98B | -108.49B | -110.75B | -92.25B |
| End Cash Position | 35.93B | 29.94B | 30.74B | 24.98B | 35.93B |
| Income Tax Paid | 43.37B | 26.10B | 18.68B | 19.57B | 25.39B |
| Free Cash Flow | 98.77B | 108.81B | 99.58B | 111.44B | 92.95B |
| Interest Paid | N/A | N/A | 3.80B | 2.87B | 2.69B |
| Operating Activities Deferred Taxes | N/A | N/A | N/A | 895.00M | -4.77B |
| Investing Activities Net Acquisitions | N/A | N/A | N/A | -306.00M | -33.00M |
| Financing Activities Common Stock Issuance | N/A | N/A | N/A | N/A | 1.10B |
Data provided by Twelve Data
Technical Analysis
Key Insights
- The current trend shows a moderate downward price movement from the 52-week high of $288.62 to the current price of $252.78, indicating some recent selling pressure.
- Key support levels are observed near the 200-day moving average at approximately $245.33, while resistance is noted around the 50-day moving average near $263.17 and the 52-week high at $288.62.
- The stock price is currently trading below the 50-day moving average but remains above the 200-day moving average, suggesting mixed momentum across short and long-term timeframes.
- Momentum indicators such as RSI and MACD show neutral to slightly bearish signals, with no extreme overbought or oversold conditions detected.
- Analysis across daily, weekly, and monthly timeframes indicates consolidation phases with intermittent volatility, reflecting cautious market sentiment.
- Potential market scenarios include a rebound if support levels hold or further declines if resistance levels prove strong, emphasizing the importance of monitoring moving averages and momentum shifts.
Trending News
1. Headline: Apple unveils second-generation AirPods Max at $549 By Investing.com
Summary: Powered by Apple’s in-house H2 chip, which runs the latest range of AirPods devices, the new headphones will be available to order from March 25 in more than 30 countries, with retail availability beginning early next month, the company said. Upgrades to the AirPods Max 2 include better active ...
Sentiment: neutral
2. Headline: Apple Inc. $AAPL Shares Purchased by Fred Alger Management LLC
Summary: Fred Alger Management LLC lifted its holdings in shares of Apple Inc. (NASDAQ:AAPL - Free Report) by 9.9% during the third quarter, according to the company in its most recent Form 13F filing with the SEC. The firm owned 4,112,719 shares of the iPhone maker's stock after purchasing an additional 37
Sentiment: positive
3. Headline: Apple Inc. $AAPL Shares Sold by Elevation Point Wealth Partners LLC
Summary: Elevation Point Wealth Partners LLC lowered its stake in shares of Apple Inc. (NASDAQ:AAPL - Free Report) by 82.8% during the 3rd quarter, according to the company in its most recent Form 13F filing with the Securities & Exchange Commission. The institutional investor owned 119,784 shares of t
Sentiment: negative
4. Headline: Clough Capital Partners L P Cuts Position in Apple Inc. $AAPL
Summary: Clough Capital Partners L P decreased its holdings in Apple Inc. (NASDAQ:AAPL - Free Report) by 22.9% in the third quarter, according to its most recent filing with the Securities and Exchange Commission. The firm owned 85,033 shares of the iPhone maker's stock after selling 25,325 shares during th
Sentiment: negative
5. Headline: Crawford Investment Counsel Inc. Has $63.22 Million Stock Holdings in Apple Inc. $AAPL
Summary: Crawford Investment Counsel Inc. decreased its position in shares of Apple Inc. (NASDAQ:AAPL - Free Report) by 1.1% during the 3rd quarter, according to its most recent filing with the Securities and Exchange Commission (SEC). The fund owned 248,267 shares of the iPhone maker's stock after selling
Sentiment: negative
6. Headline: Apple Inc. $AAPL is Capitolis Liquid Global Markets LLC's 6th Largest Position
Summary: Capitolis Liquid Global Markets LLC cut its stake in Apple Inc. (NASDAQ:AAPL - Free Report) by 48.2% in the third quarter, according to its most recent 13F filing with the Securities & Exchange Commission. The institutional investor owned 2,190,468 shares of the iPhone maker's stock after sell
Sentiment: negative
7. Headline: Apple Inc. (AAPL) Seen as Solid Investment Choice - Cupertino Today
Summary: A recent bullish analysis on Apple Inc. (AAPL) by David J. Waldron of Quality Value Investing's Substack outlines the case for the tech giant as a good stock to buy now. The report emphasizes Apple's dominant market position, loyal customer base, and exceptional financial performance, including ...
Sentiment: positive
8. Headline: Is It Time To Reassess Apple (AAPL) After Recent Share Price Pullback? - Simply Wall St News
Summary: If you are wondering whether Apple is still a reasonable entry at around US$250.12, or if too much future optimism is already priced in, this article is designed to help you frame that question clearly. Apple’s share price has seen a 2.9% decline over the last week and a 2.2% decline over ...
Sentiment: negative
9. Headline: Steve Jobs Gave Tim Cook 1 Piece of Advice. It Still Shapes Apple Today
Summary: Inc. PremiumGrowDavid Rabie’s Tovala Had 3 Weeks of Cash Left. Now It’s a 9-Figure Company · LeadPsychologists Have a New Way to Measure ‘Corporate Bullshit’—and It Reveals a Surprising Secret About Performance ... The founder trusted Cook to lead in his own style. ... Apple CEO Tim Cook.
Sentiment: neutral
10. Headline: Apple Inc. $AAPL Stake Reduced by BNP Paribas | MarketBeat
Summary: BNP Paribas reduced its position in shares of Apple Inc. (NASDAQ:AAPL - Free Report) by 4.4% in the third quarter, according to the company in its most recent filing with the SEC. The institutional investor owned 467,800 shares of the iPhone maker's stock after selling 21,305 shares during the qua
Sentiment: negative
Powered by Brave
Recent Updates
News Summary
Recent news highlights a mix of strategic initiatives and market reactions for Apple Inc. The company unveiled the second-generation AirPods Max, enhancing its premium audio product line, and acquired MotionVFX to strengthen its video editing capabilities, supporting service ecosystem growth. Institutional shareholding changes include notable purchases by Fred Alger Management LLC and reductions by several other funds, reflecting varied market sentiment. Regulatory scrutiny remains a theme, with calls from Chinese authorities to address app store policies. These developments collectively influence Apple's revenue potential, market positioning, and investor perspectives amid a competitive and regulatory landscape.
News Sentiment
Sentiment across recent news is mixed, with positive signals from product launches and institutional buying balanced by negative tones from institutional selling and regulatory concerns. Overall, the sentiment suggests cautious optimism tempered by external challenges, indicating a nuanced market environment.
Analytical Overview
Analysis Summary
Apple's valuation metrics, including a trailing P/E of 32.37 and forward P/E of 27.51, align closely with industry averages, indicating a premium valuation consistent with its market leadership. The PEG ratio of 1.77 suggests moderate growth expectations relative to earnings.
The company exhibits a strong growth trajectory, with quarterly revenue growth of 15.7% and year-over-year earnings growth of 15.9%, supported by robust operating and free cash flow generation exceeding $135 billion and $106 billion respectively.
Financial health is solid, though the debt-to-equity ratio of 102.63% indicates a leveraged balance sheet; however, substantial cash reserves of approximately $66.9 billion and a current ratio near 0.97 provide liquidity support.
Sector-specific challenges include regulatory scrutiny, particularly in international markets, and intense competition in consumer electronics, while opportunities arise from expanding services and ecosystem integration.
Consideration of market positioning and competitive advantages highlights Apple's strong brand loyalty, diversified product portfolio, and innovation-driven growth, which underpin its resilience in a dynamic technology sector.
Investment Conclusion
Supporting Factors: Primary supporting factors include robust revenue and earnings growth, strong cash flow generation, and a diversified product and services ecosystem.
Risk Factors: Main risk factors to monitor encompass regulatory challenges, high valuation multiples, and competitive pressures in key markets.
SWOT Analysis
Strengths
- Strong global brand recognition and loyal customer base.
- Robust revenue growth supported by diversified product and service offerings.
- High operating and profit margins indicating efficient operations.
- Substantial cash reserves providing financial flexibility.
Weaknesses
- High price-to-book ratio reflecting premium valuation.
- Leverage indicated by a debt-to-equity ratio exceeding 100%.
- Current ratio below 1, suggesting tight short-term liquidity.
- Dependence on flagship products like the iPhone for majority of revenue.
Opportunities
- Expansion of digital services and subscription-based platforms.
- Growth potential in emerging markets and new product categories.
- Strategic acquisitions to enhance technology and content offerings.
- Increasing demand for wearable and audio devices.
Threats
- Regulatory scrutiny and antitrust investigations in key markets.
- Intense competition from other technology and consumer electronics firms.
- Supply chain disruptions impacting product availability.
- Geopolitical tensions affecting international operations.
Company Description
Apple Inc. is a leading technology company renowned for designing, manufacturing, and marketing innovative hardware and software products for consumers and businesses worldwide. Its flagship product, the iPhone, accounts for the majority of sales, serving as the central hub of an expansive ecosystem that includes Mac computers, iPad tablets, Apple Watch wearables, and accessories like AirPods. Apple Inc. also offers a suite of services such as the App Store, Apple Music, iCloud, Apple TV+, and Apple Fitness+, providing digital content, cloud storage, and subscription-based platforms. Operating in the consumer electronics industry within the technology sector, the company employs approximately 166,000 people and maintains a broad global presence through online stores, retail outlets, and partnerships with carriers and resellers. With a substantial market capitalization reflecting its scale, Apple Inc. plays a pivotal role in shaping consumer technology trends, emphasizing seamless integration across devices and services to enhance user experience and productivity.