
Apple Inc (AAPL)
Stock Analysis Report
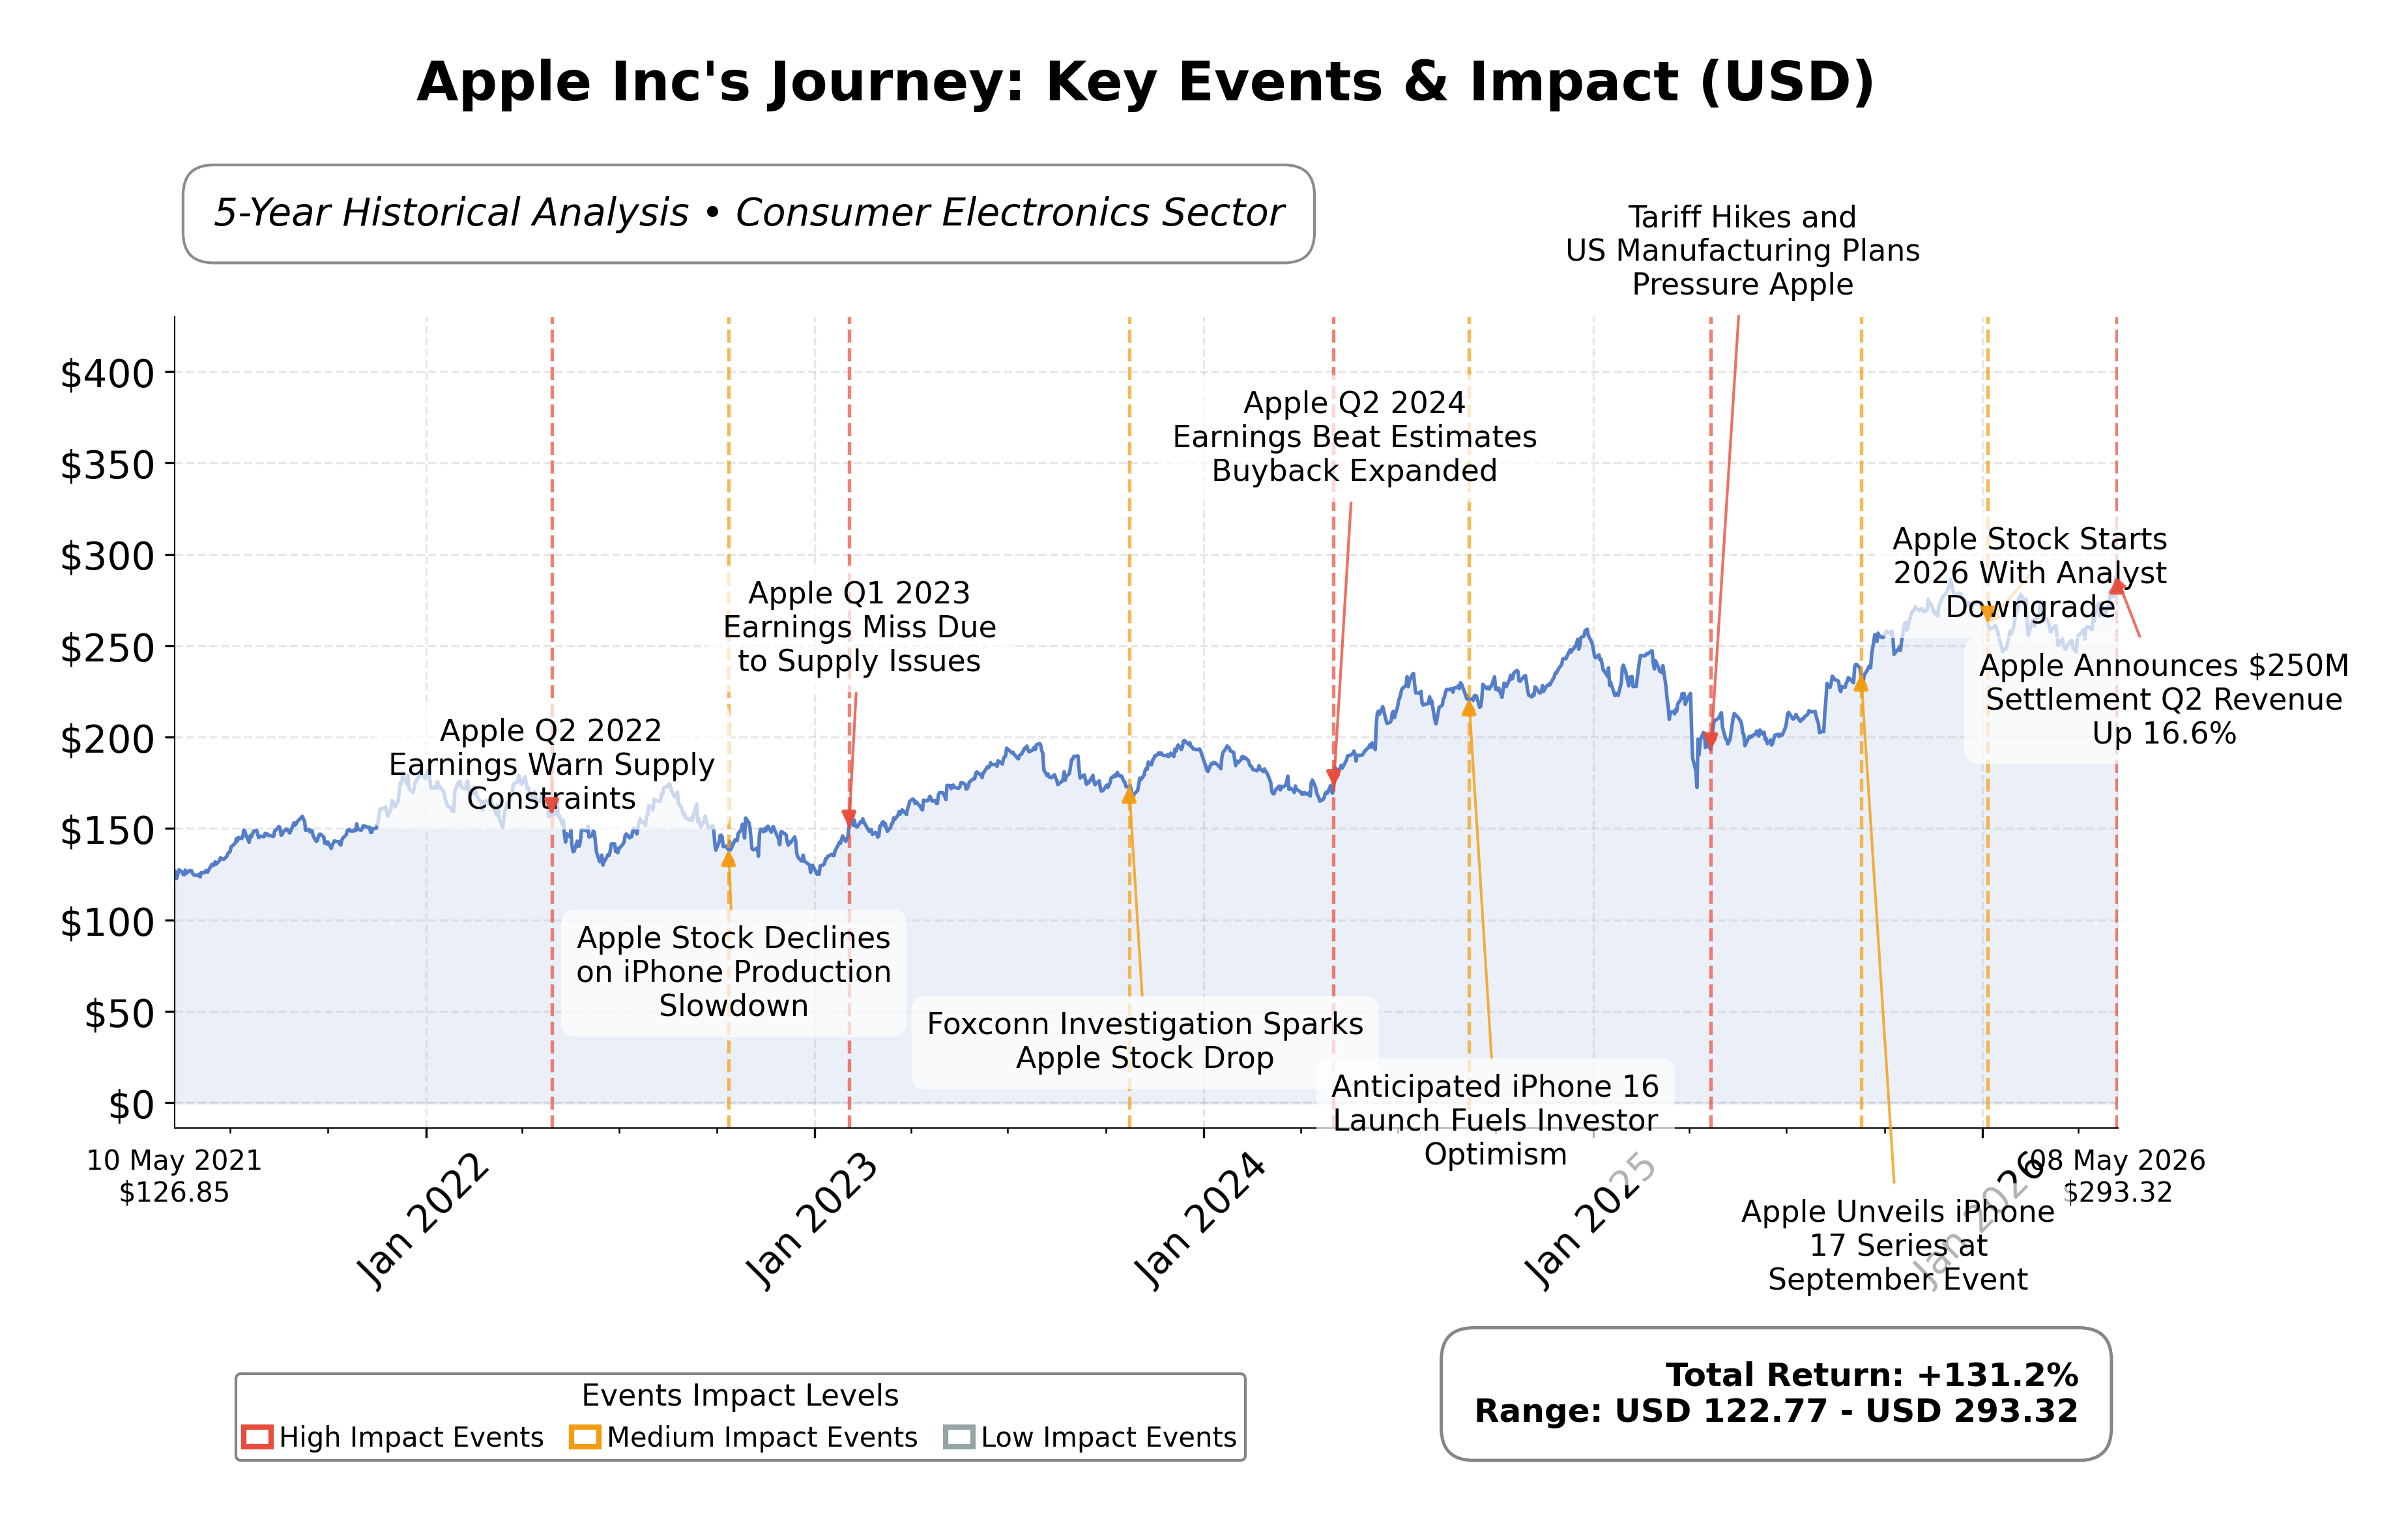
Stock Journey
Key Positives and Key Risks
Pros
- Strong profitability with a net profit margin of 27.2%, indicating efficient operations and robust earnings generation.
- Substantial free cash flow of $101.1 billion, providing liquidity for investments and shareholder returns.
- High return on equity of 141.5%, reflecting effective use of shareholder capital and strong financial performance.
Cons
- Elevated valuation multiples with a trailing P/E of 35.47 and P/B ratio of 40.40, suggesting premium pricing relative to fundamentals.
- Margin pressure from rising memory costs, potentially compressing gross margins as indicated by management guidance.
- Significant dependence on iPhone sales for revenue, which may expose the company to product cycle risks.
Disclosure: This information is for general awareness and does not constitute investment advice
Report Summary
Apple Inc. is a leading technology company listed on NASDAQ under the symbol AAPL, operating primarily in the consumer electronics industry within the technology sector. The company designs, manufactures, and markets a broad range of innovative hardware and software products, including the flagship iPhone, Mac computers, iPads, Apple Watch, and accessories like AirPods. Apple also offers a suite of digital services such as the App Store, Apple Music, iCloud, and subscription platforms, maintaining a strong global presence through retail and online channels. Its market positioning is reinforced by a highly integrated ecosystem that enhances user experience and loyalty.
Financially, Apple reported trailing twelve-month revenue of approximately $451.4 billion with a gross margin of 49.3%, an operating margin of 32.3%, and a net profit margin of 27.2%, indicating robust profitability and operational efficiency. The company’s return on equity (ROE) stands at 141.5%, and return on assets (ROA) at 26.2%, reflecting effective use of shareholder capital and asset base. Additionally, Apple’s return on invested capital (ROIC) is strong, supported by substantial operating cash flow of $140.2 billion and free cash flow of $101.1 billion, underscoring its cash-generating capability.
Apple’s valuation metrics show a trailing price-to-earnings (P/E) ratio of 35.47 and a forward P/E of 30.68, with a price-to-book (P/B) ratio of 40.40 and an enterprise value to EBITDA (EV/EBITDA) multiple of 27.03. The company’s market capitalization is approximately $4.31 trillion, positioning it among the largest global technology firms. The stock price currently trades near $293.28, close to its 52-week high of $294.76 and well above its 52-week low of $193.46, indicating strong market valuation relative to fundamentals.
Key strengths include Apple’s dominant market leadership, strong cash flow generation, and a wide economic moat supported by its integrated ecosystem and brand loyalty. Risks involve regulatory scrutiny, competitive pressures in technology and consumer electronics, and potential margin compression from rising memory costs. Recent strategic developments include a reported chip supply deal with Intel, signaling a pivot in hardware sourcing and a focus on AI integration, alongside analyst optimism on AI-driven revenue growth and potential iPhone redesigns.
Technically, Apple’s stock exhibits an upward trend, trading above its 50-day and 200-day moving averages, with momentum indicators reflecting positive sentiment across multiple timeframes. The recent news flow highlights strong earnings performance and strategic initiatives, suggesting a favorable environment for monitoring accumulation or consolidation. Overall, the data portrays a company with solid fundamentals and strategic positioning, warranting close observation for evolving market dynamics.
Company and Industry Overview
Company Basics
Price Performance
Company Size
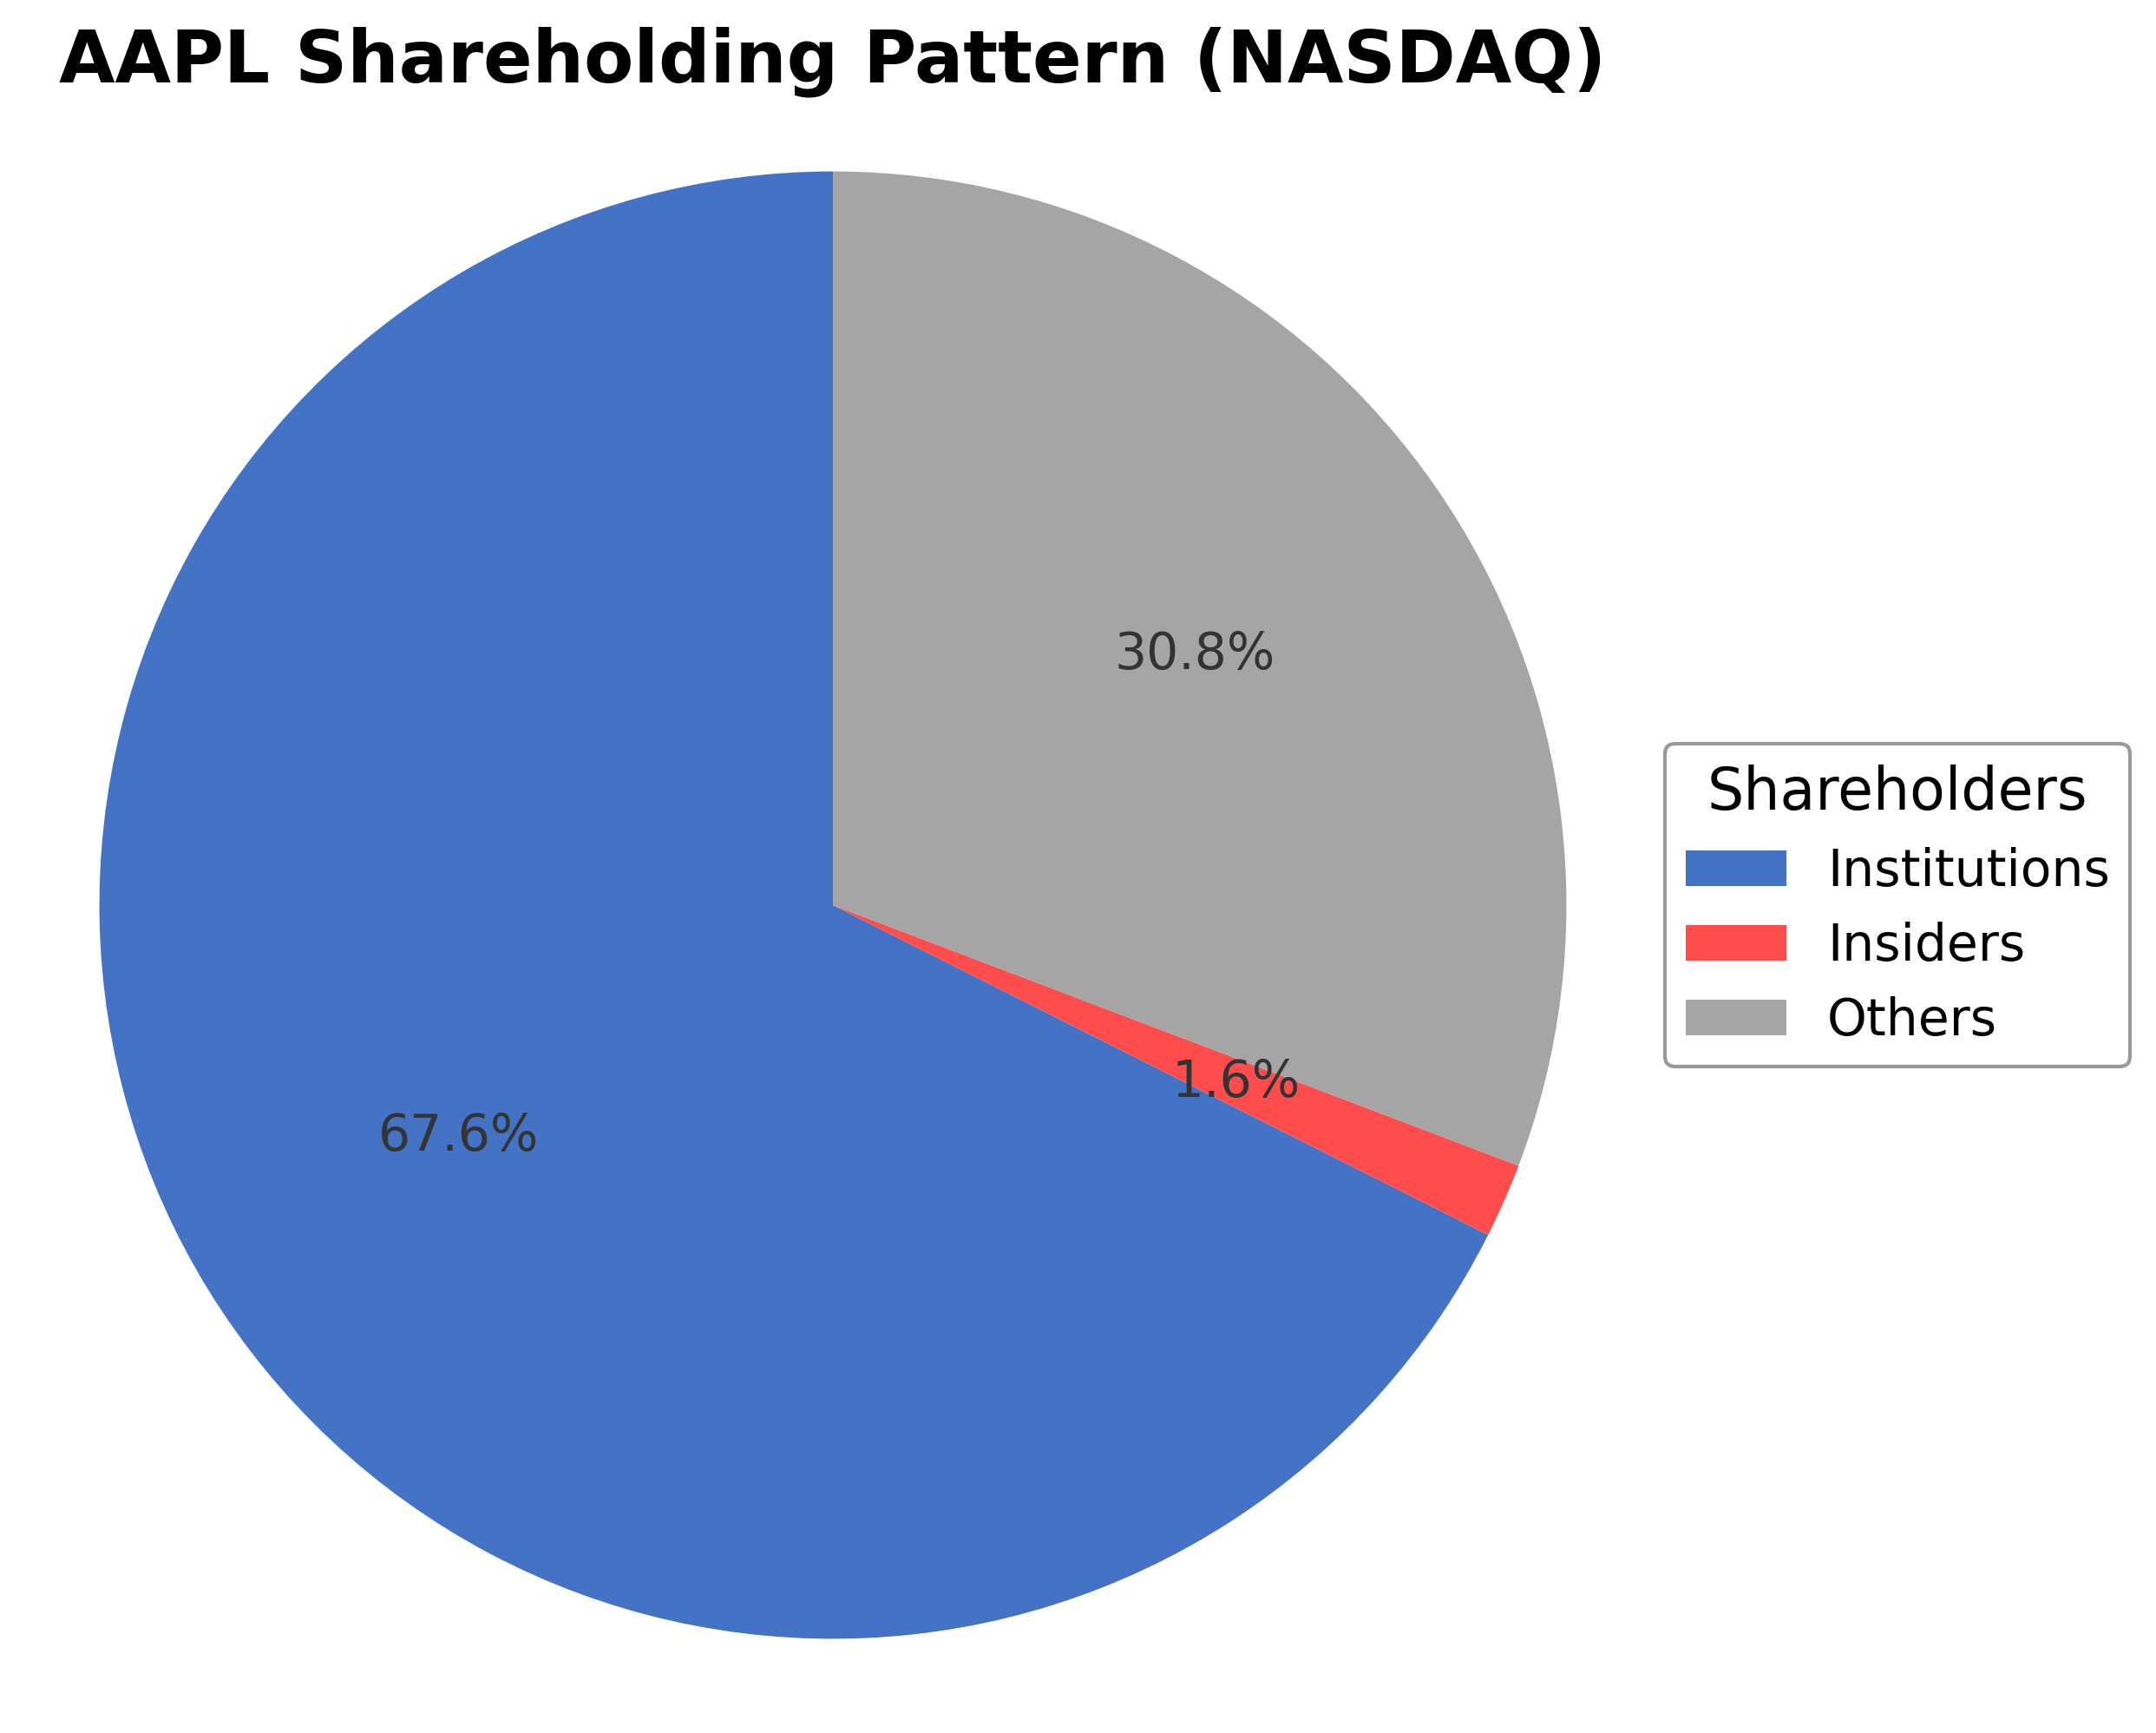
Shareholding Pattern
Sector and Industry Analysis
The global apple market is projected to grow by USD 15.94 billion from 2024 to 2029, with a compound annual growth rate (CAGR) of 3.4%. This growth is supported by increasing demand for superfoods and health-conscious consumption patterns. Key players in the market include Auvil Fruit Co. Inc., Batlow Fruit Co. Pty Ltd, and Stemilt Growers LLC, among approximately 25 vendors analyzed in the sector.
Industry trends highlight the rising popularity of urban farming and the expansion of private-label brands, which are driving demand across both offline and online distribution channels. Competitive dynamics are shaped by factors such as pricing, product differentiation, and supply chain efficiencies, with barriers to entry including established vendor relationships and scale advantages. The market is characterized by moderate rivalry and evolving consumer preferences toward new apple varieties.
The regulatory environment affecting the apple market includes food safety standards and import-export policies that influence supply chain operations and market access. Compliance with agricultural and health regulations remains critical for vendors to maintain market position and meet consumer expectations. Looking ahead, regulatory frameworks are expected to support sustainable farming practices and traceability, impacting operational strategies within the industry.
Note: Analysis synthesized from industry research, market reports, and regulatory filings. Information is subject to change based on market conditions.
Financial Ratios Dashboard
Illustrative Scenario Analysis
DCF Assumptions:
Method: Two-Stage EPS-Priority Model
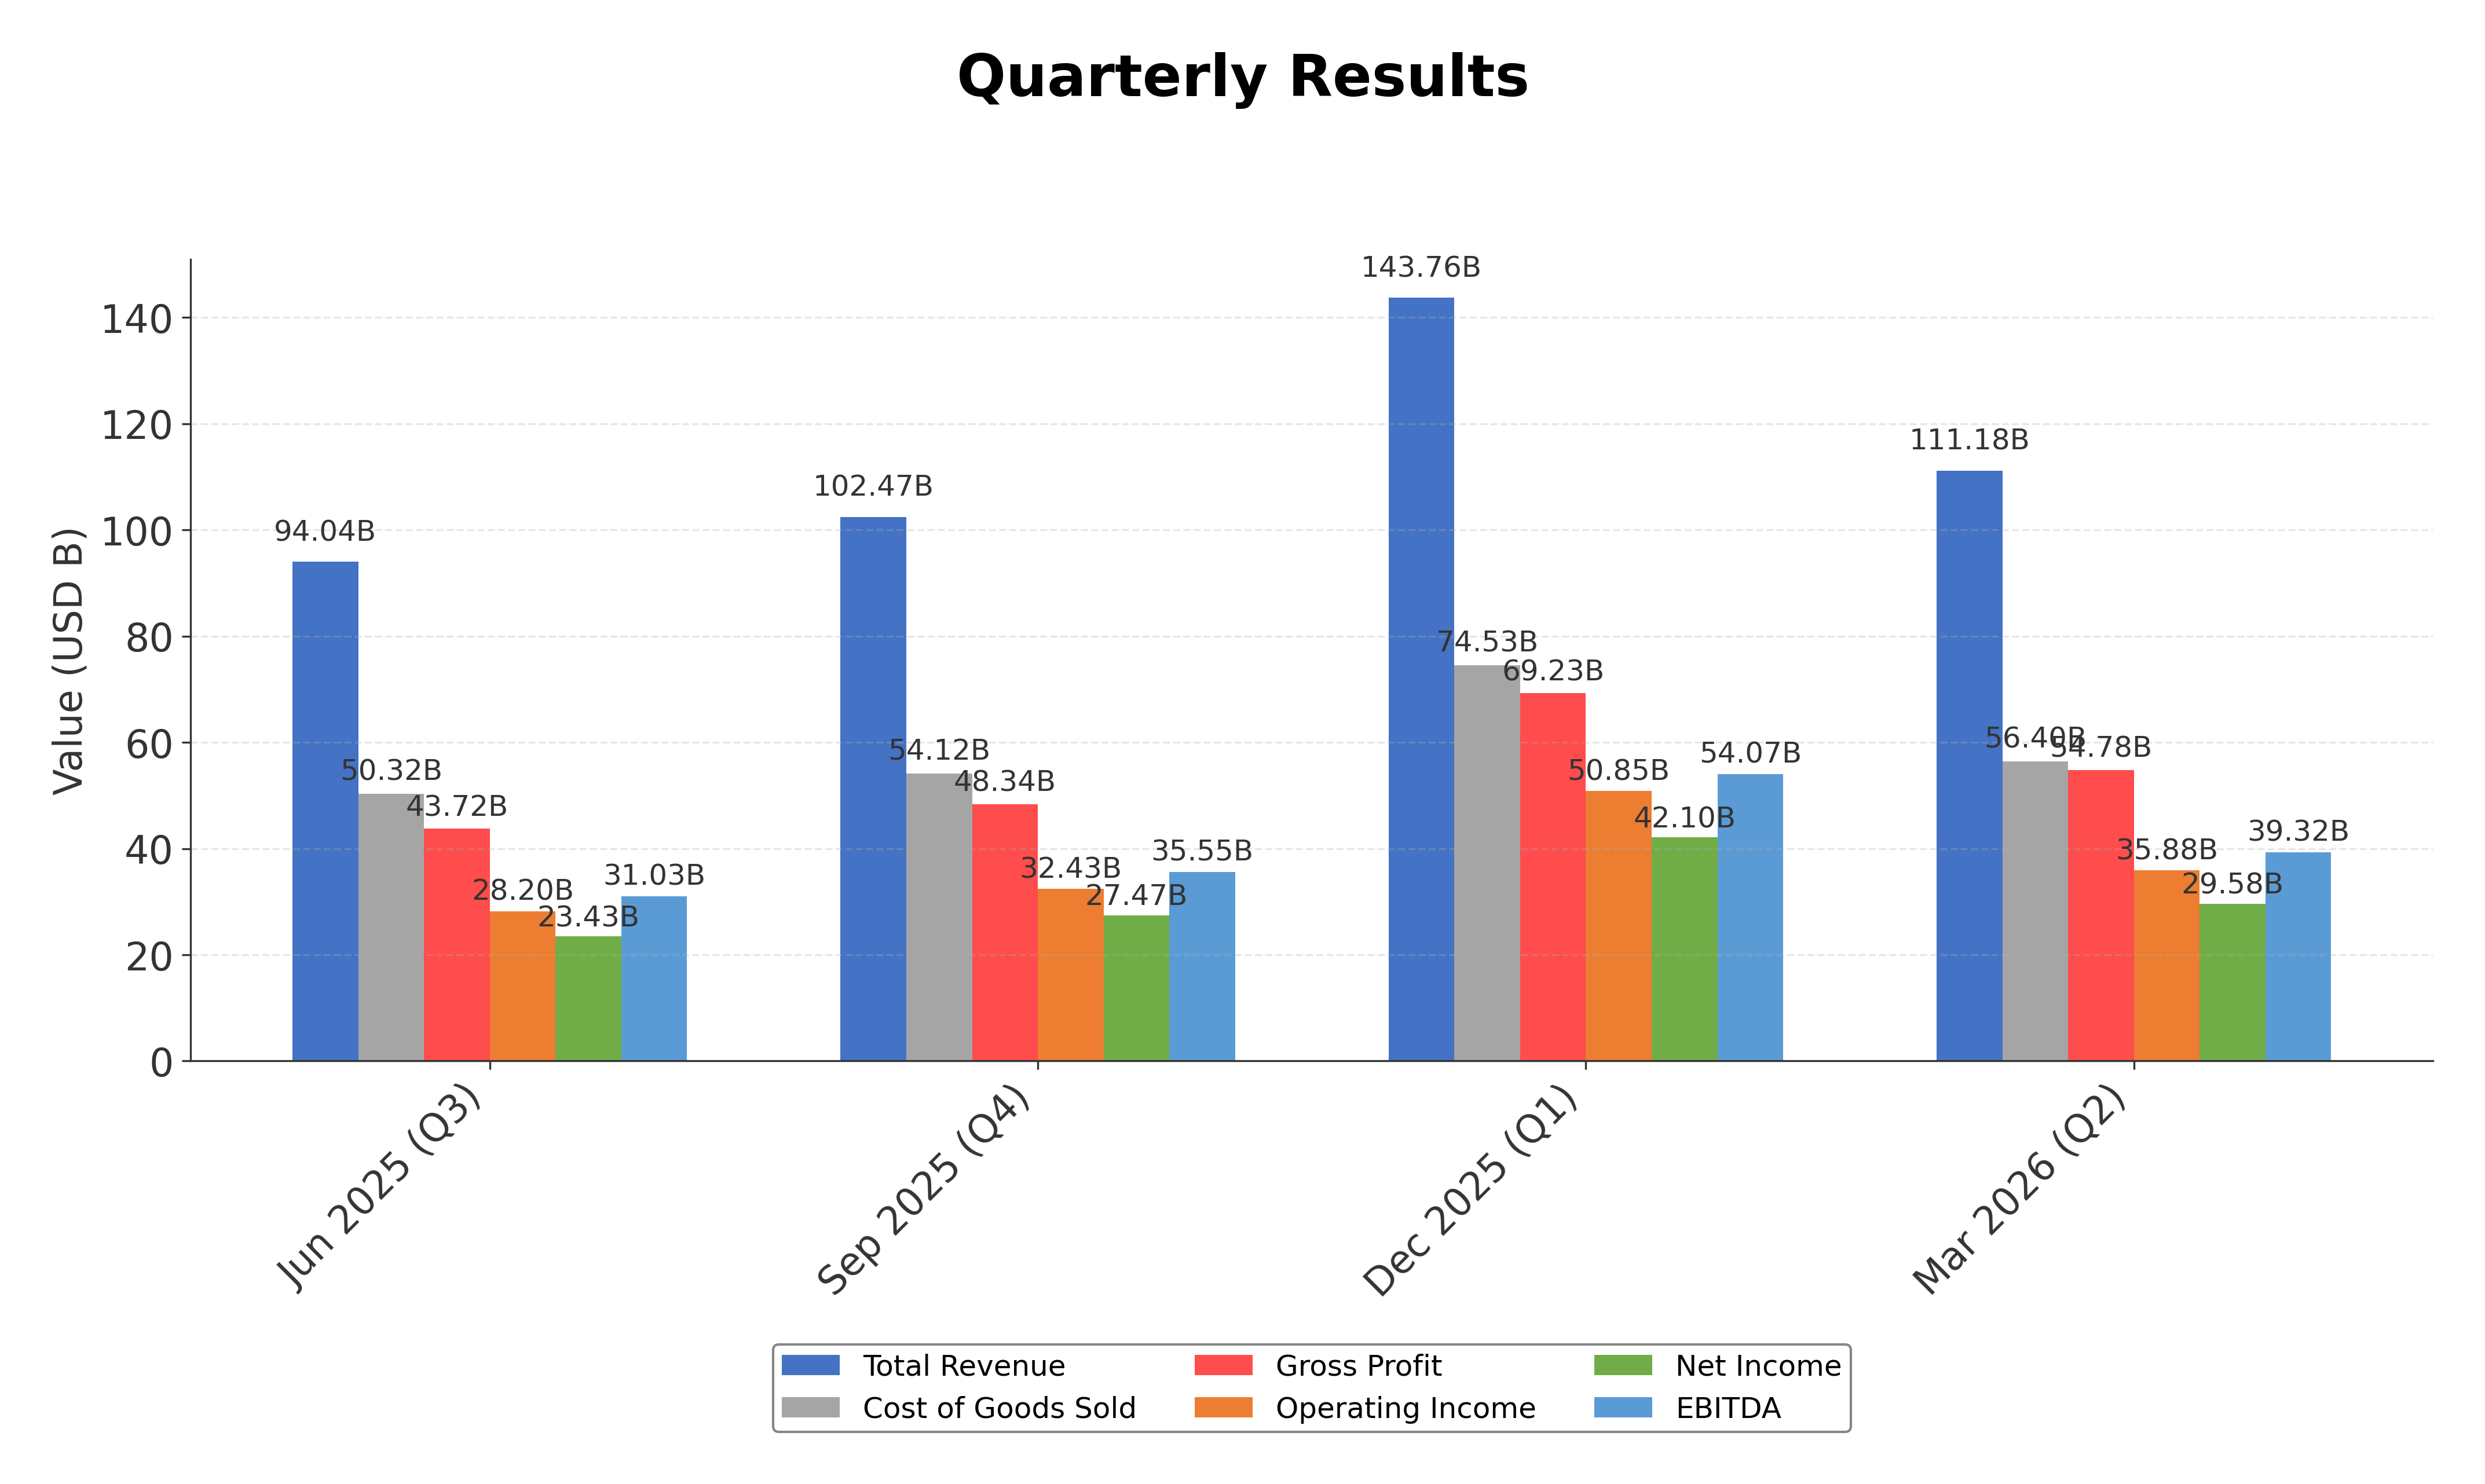
Financials
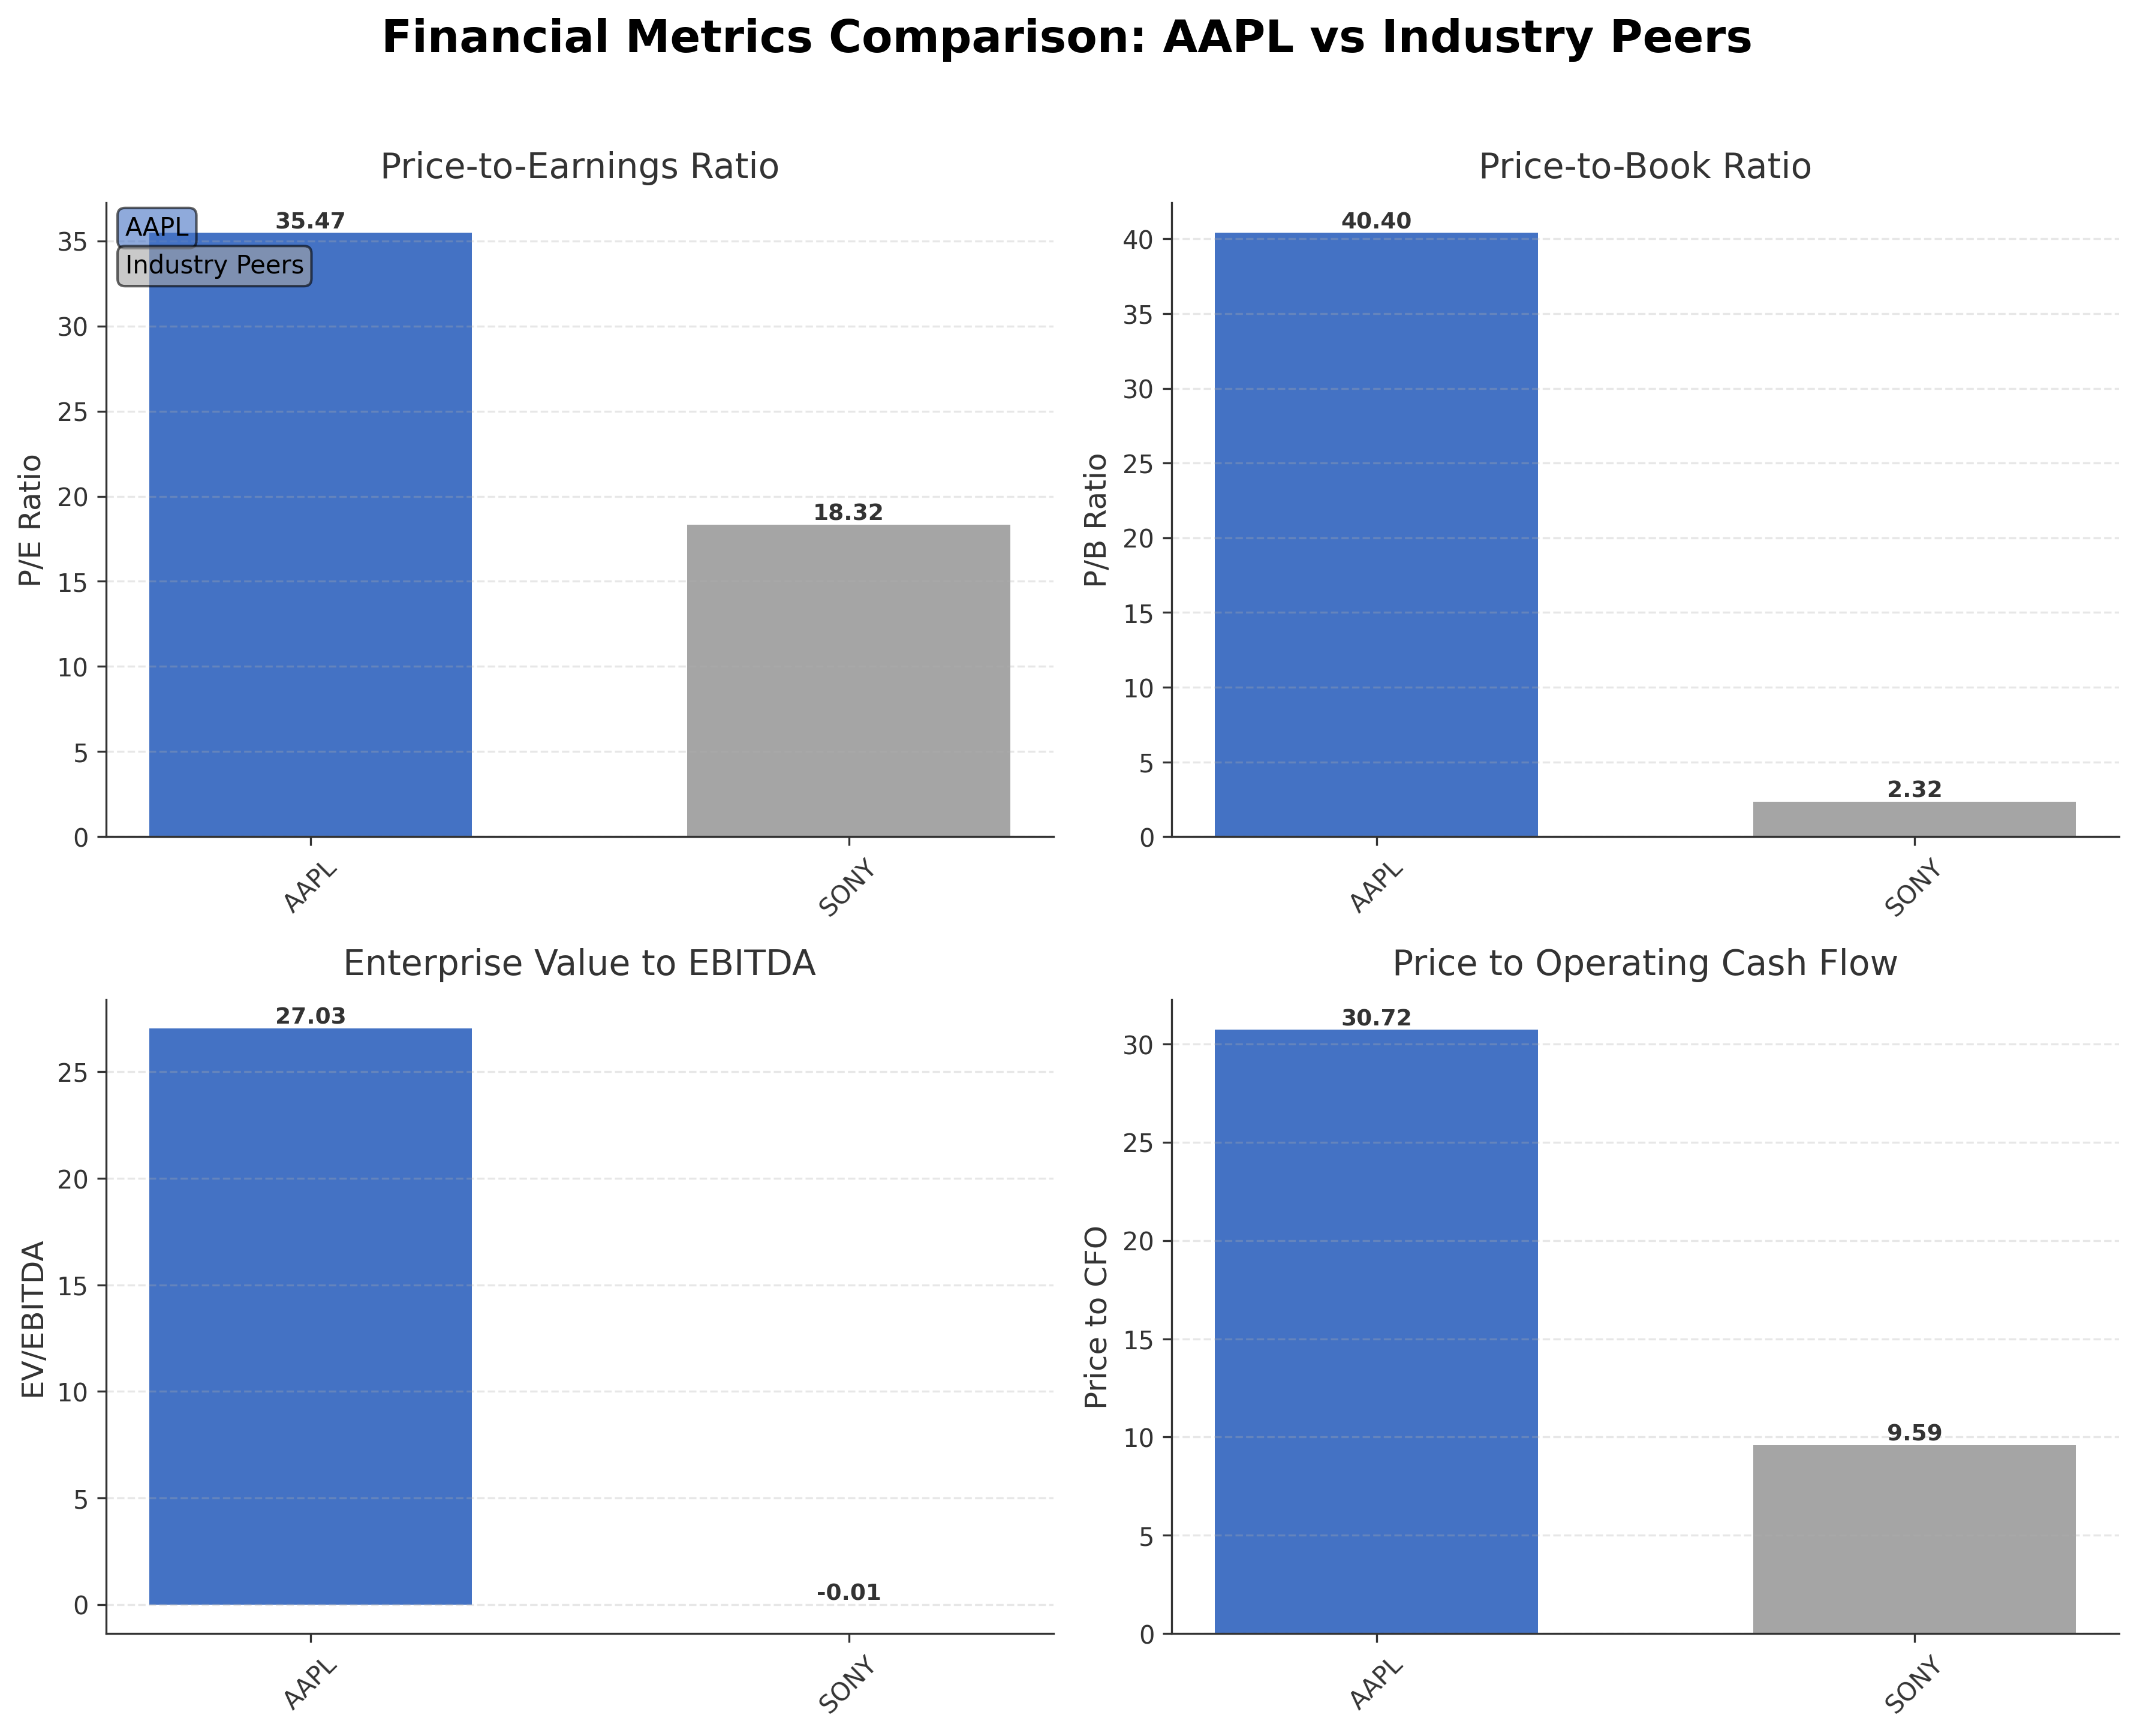
Peer Analysis
| Company Name | Market Cap | P/E Ratio | P/B Ratio | EV/EBITDA | Price to CFO |
|---|---|---|---|---|---|
| Apple Inc | $4.31T | 35.47 | 40.40 | 27.03 | 30.72 |
| Sony Group Corporation - Sponsored American Depositary Receipt | $119.04B | 18.32 | 2.32 | -0.01 | 9.59 |
Comparison Analysis: Compared to its peer Sony Group Corporation, Apple Inc. exhibits significantly higher valuation multiples, including a P/E ratio of 35.47 versus Sony's 18.32 and a P/B ratio of 40.40 compared to 2.32. Apple's EV/EBITDA of 27.03 far exceeds Sony's negative figure, reflecting stronger profitability and market expectations. The company also demonstrates superior return on equity at 141.47%, vastly outperforming Sony's 0.12%, indicating more efficient capital utilization. Apple's price to cash flow ratio of 30.72 is considerably higher than Sony's 9.59, consistent with its premium market positioning and growth prospects. Overall, Apple stands out as a dominant industry leader with robust financial metrics relative to regional peers.
Financial Metrics Comparison with Peers
Financial Statements
Comprehensive financial data including income, balance sheet, and cash flow metrics
Income Statement
| fiscal_date | 2025-09-30 | 2024-09-30 | 2023-09-30 | 2022-09-30 | 2021-09-30 |
|---|---|---|---|---|---|
| Sales | 416.16B | 391.04B | 383.29B | 394.33B | 365.82B |
| Cost Of Goods | 220.96B | 210.35B | 214.14B | 223.55B | 212.98B |
| Gross Profit | 195.20B | 180.68B | 169.15B | 170.78B | 152.84B |
| Operating Expense Research And Development | 34.55B | 31.37B | 29.91B | 26.25B | 21.91B |
| Operating Expense Selling General And Administrative | 27.60B | 26.10B | 24.93B | 25.09B | 21.97B |
| Operating Income | 133.05B | 123.22B | 114.30B | 119.44B | 108.95B |
| Other Income Expense | -321.00M | 269.00M | -565.00M | -334.00M | 60.00M |
| Pretax Income | 132.73B | 123.48B | 113.74B | 119.10B | 109.21B |
| Income Tax | 20.72B | 29.75B | 16.74B | 19.30B | 14.53B |
| Net Income | 112.01B | 93.74B | 97.00B | 99.80B | 94.68B |
| Eps Basic | 7.49 | 6.11 | 6.16 | 6.15 | 5.67 |
| Eps Diluted | 7.46 | 6.08 | 6.13 | 6.11 | 5.61 |
| Basic Shares Outstanding | 14.95B | 15.34B | 15.74B | 16.22B | 16.70B |
| Diluted Shares Outstanding | 14.95B | 15.34B | 15.74B | 16.22B | 16.70B |
| Ebit | 133.05B | 123.22B | 114.30B | 119.44B | 111.85B |
| Ebitda | 144.75B | 134.66B | 125.82B | 130.54B | 123.14B |
| Net Income Continuous Operations | 112.01B | 93.74B | 97.00B | 99.80B | 94.68B |
| Non Operating Interest Income | N/A | N/A | 3.75B | 2.83B | 2.84B |
| Non Operating Interest Expense | N/A | N/A | 3.93B | 2.93B | 2.65B |
Source: Financial statements and regulatory filings
Balance Sheet
| fiscal_date | 2025-09-30 | 2024-09-30 | 2023-09-30 | 2022-09-30 | 2021-09-30 |
|---|---|---|---|---|---|
| Cash And Cash Equivalents | 35.93B | 29.94B | 29.96B | 23.65B | 34.94B |
| Accounts Receivable | 39.78B | 33.41B | 29.51B | 28.18B | 26.28B |
| Total Assets | 359.24B | 364.98B | 352.58B | 352.75B | 351.00B |
| Total Liabilities | 285.51B | 308.03B | 290.44B | 302.08B | 287.91B |
| Long Term Debt | 78.33B | 85.75B | 95.28B | 109.71B | 119.38B |
| Shareholders Equity | 73.73B | 56.95B | 62.15B | 50.67B | 63.09B |
Source: Financial statements and regulatory filings
Cash Flow Statement
| fiscal_date | 2025-09-30 | 2024-09-30 | 2023-09-30 | 2022-09-30 | 2021-09-30 |
|---|---|---|---|---|---|
| Operating Activities Net Income | 112.01B | 93.74B | 97.00B | 99.80B | 94.68B |
| Operating Activities Depreciation | 11.70B | 11.45B | 11.52B | 11.10B | 11.28B |
| Operating Activities Stock Based Compensation | 12.86B | 11.69B | 10.83B | 9.04B | 7.91B |
| Operating Activities Other Non Cash Items | -89.00M | -2.27B | -2.23B | 1.01B | -4.92B |
| Operating Activities Accounts Receivable | -7.03B | -5.14B | -417.00M | -9.34B | -14.03B |
| Operating Activities Accounts Payable | 902.00M | 6.02B | -1.89B | 9.45B | 12.33B |
| Operating Activities Other Assets Liabilities | -18.87B | 2.77B | -4.27B | 1.57B | -1.53B |
| Operating Activities Operating Cash Flow | 111.48B | 118.25B | 110.54B | 123.52B | 100.94B |
| Investing Activities Capital Expenditures | -12.71B | -9.45B | -10.96B | -10.71B | -11.09B |
| Investing Activities Purchase Of Investments | -24.41B | -48.66B | -29.51B | -76.92B | -109.56B |
| Investing Activities Sale Of Investments | 53.80B | 62.35B | 45.51B | 67.36B | 106.48B |
| Investing Activities Other Investing Activity | -1.48B | -1.31B | -1.34B | -2.09B | -385.00M |
| Investing Activities Investing Cash Flow | 15.20B | 2.94B | 3.71B | -22.66B | -14.58B |
| Financing Activities Long Term Debt Issuance | 4.48B | 0.00 | 5.23B | 5.46B | 20.39B |
| Financing Activities Long Term Debt Payments | -10.93B | -9.96B | -11.15B | -9.54B | -8.75B |
| Financing Activities Short Term Debt Issuance | -2.03B | 3.96B | -3.98B | 3.96B | 1.02B |
| Financing Activities Common Stock Repurchase | -90.71B | -94.95B | -77.55B | -89.40B | -85.97B |
| Financing Activities Common Dividends | -15.42B | -15.23B | -15.03B | -14.84B | -14.47B |
| Financing Activities Other Financing Charges | -6.07B | -5.80B | -6.01B | -6.38B | -5.58B |
| Financing Activities Financing Cash Flow | -120.69B | -121.98B | -108.49B | -110.75B | -92.25B |
| End Cash Position | 35.93B | 29.94B | 30.74B | 24.98B | 35.93B |
| Income Tax Paid | 43.37B | 26.10B | 18.68B | 19.57B | 25.39B |
| Free Cash Flow | 98.77B | 108.81B | 99.58B | 111.44B | 92.95B |
| Interest Paid | N/A | N/A | 3.80B | 2.87B | 2.69B |
| Operating Activities Deferred Taxes | N/A | N/A | N/A | 895.00M | -4.77B |
| Investing Activities Net Acquisitions | N/A | N/A | N/A | -306.00M | -33.00M |
| Financing Activities Common Stock Issuance | N/A | N/A | N/A | N/A | 1.10B |
Source: Financial statements and regulatory filings
Technical Analysis
Key Insights
- Apple's stock is currently in a strong uptrend, trading near its 52-week high with consistent higher highs and higher lows observed in recent price action.
- Key support levels are identified near $260 and $250, while resistance is close to the recent high around $295.
- The stock price is trading above its 10-day, 50-day (approximately $262.80), and 200-day (approximately $257.02) moving averages, indicating bullish momentum.
- Momentum indicators show the Relative Strength Index (RSI) in the mid-60s range, MACD is positive with a bullish crossover, and Stochastic oscillator signals upward momentum.
- Multi-timeframe analysis reveals bullish trends on daily, weekly, and monthly charts, with no significant bearish divergences detected.
- Potential market scenarios include continuation of the upward trend if support levels hold, while a break below $250 could signal a short-term correction.
Trending News
1. Headline: Apple Stock Week Ahead: AAPL Rally Faces CPI, AI and Intel Chip Deal Test
Summary: Apple Stock Week Ahead: AAPL Rally Faces CPI, AI and Intel Chip Deal Test · Amazon Stock Week Ahead: AMZN Faces Fresh Test After AWS Outage, AI Rally View all ... May 10, 2026, 9:11 AM EDT. XRP is trading around $1.40 with a market cap near $87 billion. To hit $20, XRP's market cap must soar to $1.23 trillion, a 14-fold increase ...
Sentiment: positive
2. Headline: Aol
Summary: The stock still trades at a premium. ... Apple (NASDAQ: AAPL) is the odd man out in the list of the world's largest companies. It is the only major tech company not actively investing hundreds of billions of dollars into artificial intelligence technologies. Instead, it's choosing to outsource ...
Sentiment: neutral
3. Headline: Top Wedbush Analyst Lifts Apple Stock Price Target, Calls AAPL the ‘Consumer Hub of AI’ - TipRanks.com
Summary: Top Wedbush analyst Daniel Ives raised his price target on Apple ($AAPL) to a Street-high $400 from $350 while maintaining an Outperform rating, indicating 36% upsi...
Sentiment: positive
4. Headline: XY Planning Network Inc. Raises Stock Holdings in Apple Inc. $AAPL
Summary: XY Planning Network Inc. raised its stake in Apple Inc. (NASDAQ:AAPL - Free Report) by 49.8% during the fourth quarter, according to the company in its most recent Form 13F filing with the Securities and Exchange Commission. The fund owned 25,550 shares of the iPhone maker's stock after acquiring a
Sentiment: positive
5. Headline: Intel shares soar on Apple chip deal report. Here's why it signals a total pivot for chipmaking
Summary: Samsung, Intel and Taiwan Semiconductor are the only three companies in the world capable of manufacturing the most advanced chips needed for AI.
Sentiment: positive
Recent Updates
News Summary
As of May 10, 2026. Apple reported strong fiscal second-quarter earnings with revenue rising 17% year over year to $111 billion, driven by a 22% increase in iPhone sales and record gross margins of 49.3%. Management projects continued growth with slight margin compression due to memory cost pressures. Wedbush raised Apple's price target to $400, emphasizing the company's emerging role as a consumer hub for artificial intelligence, with potential additional annual services revenue of $15 billion. A strategic chip supply deal with Intel was announced, marking a significant shift in Apple's hardware sourcing and reinforcing its AI ambitions. Institutional investors like XY Planning Network Inc. have increased their holdings, reflecting confidence in Apple's growth trajectory and strategic initiatives.
News Sentiment
The overall sentiment from recent updates is predominantly positive, driven by strong earnings performance, record gross margins, and strategic moves into AI and chip supply partnerships. Analyst upgrades and increased institutional holdings further support a favorable view of Apple's prospects. However, some caution is noted regarding margin pressures from rising memory costs and ongoing regulatory scrutiny. The balance of these factors suggests a constructive outlook grounded in Apple's operational strength and innovation pipeline.
Source List
- https://finance.yahoo.com/sectors/technology/articles/apple-aapl-shares-gain-wedbush-133112199.html
Analytical Overview
Analysis Summary
Apple's valuation metrics, including a trailing P/E of 35.47 and forward P/E of 30.68, are elevated relative to the consumer electronics industry average P/E of 35.47, reflecting premium market expectations for growth and profitability. The company's revenue growth rate of 16.6% year over year and strong operating cash flow trends underscore a solid growth trajectory supported by robust product cycles and expanding services. Financial health is sound, with a manageable total debt to equity ratio of 79.5% and substantial free cash flow of over $101 billion, indicating strong liquidity and capacity to fund strategic initiatives. Sector-specific challenges include rising memory costs impacting margins and regulatory scrutiny, while opportunities arise from AI integration and expanding digital services. Market positioning and competitive advantages, such as Apple's ecosystem and brand strength, further support its resilience and growth potential.
Overall Business and Market Assessment
Supporting Factors: No data
Risk Factors: Apple's investment case is supported by strong revenue growth, high profitability margins, and a wide economic moat driven by its integrated ecosystem and brand loyalty. Key risks include margin pressure from increasing memory costs and ongoing regulatory challenges that could affect operational flexibility. The company’s substantial free cash flow and strategic partnerships, such as the Intel chip deal and AI initiatives, position it well for medium to long-term growth. Overall, the balanced outlook reflects a mix of robust fundamentals tempered by sector-specific headwinds, suitable for investors with a medium to long-term horizon monitoring evolving market conditions.
SWOT Analysis
Strengths
- Market leadership with a strong global brand and loyal customer base.
- Robust profitability with high gross and net profit margins.
- Wide economic moat supported by an integrated hardware and software ecosystem.
- Strong cash flow generation enabling strategic investments and shareholder returns.
Weaknesses
- High valuation multiples relative to industry peers.
- Exposure to rising memory and component costs impacting margins.
- Significant reliance on iPhone sales for majority of revenue.
- Moderate debt level with a total debt to equity ratio near 80%.
Opportunities
- Expansion of AI-powered services and integration across product lines.
- Strategic partnerships, such as the Intel chip supply deal, enhancing hardware capabilities.
- Growth in digital services and subscription revenues.
- Potential major redesigns of flagship products boosting consumer interest.
Threats
- Regulatory scrutiny and geopolitical tensions affecting global operations.
- Intense competition in consumer electronics and technology sectors.
- Supply chain disruptions impacting product availability.
- Rising costs of components potentially compressing profit margins.
Company Description
Apple Inc. is a leading technology company renowned for designing, manufacturing, and marketing innovative hardware and software products for consumers and businesses worldwide. Its flagship product, the iPhone, accounts for the majority of sales, serving as the central hub of an expansive ecosystem that includes Mac computers, iPad tablets, Apple Watch wearables, and accessories like AirPods. Apple Inc. also offers a suite of services such as the App Store, Apple Music, iCloud, Apple TV+, and Apple Fitness+, providing digital content, cloud storage, and subscription-based platforms. Operating in the consumer electronics industry within the technology sector, the company employs approximately 166,000 people and maintains a broad global presence through online stores, retail outlets, and partnerships with carriers and resellers. With a substantial market capitalization reflecting its scale, Apple Inc. plays a pivotal role in shaping consumer technology trends, emphasizing seamless integration across devices and services to enhance user experience and productivity.