
Apple Inc (AAPL)
Stock Analysis Report
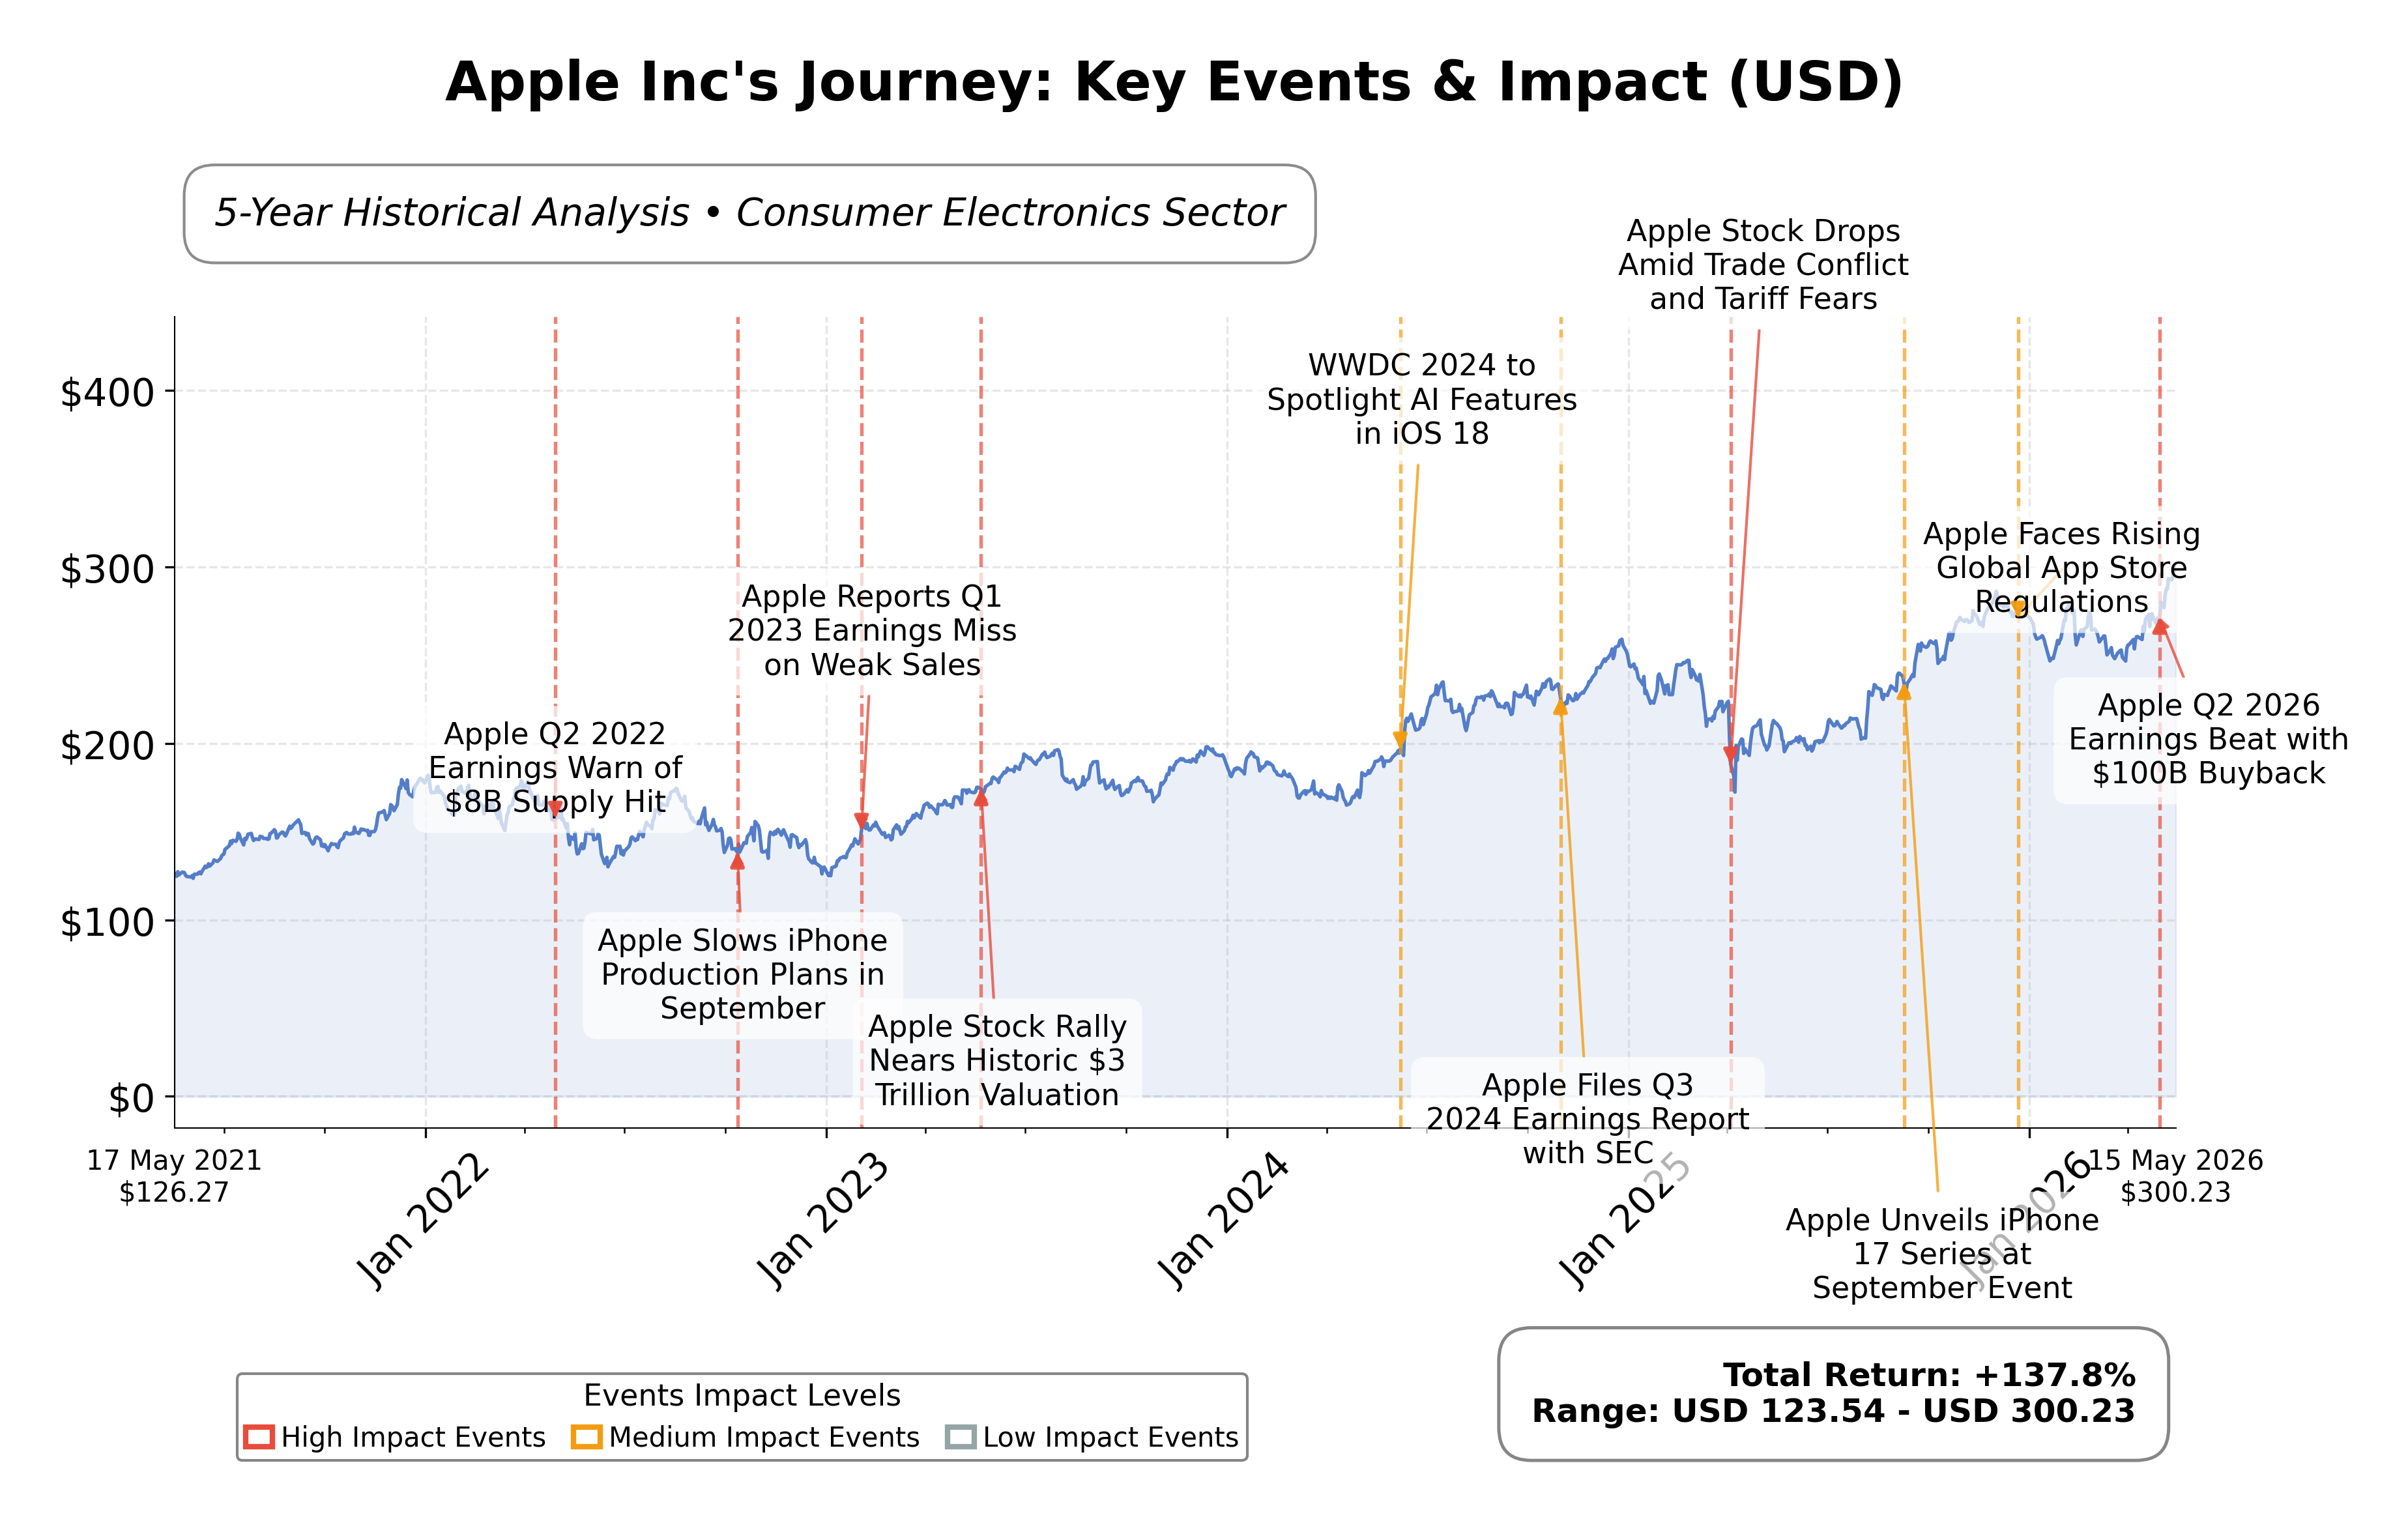
Stock Journey
Key Positives and Key Risks
Pros
- Strong profitability with a net profit margin of 27.15% and ROE of 141.47%, indicating efficient capital utilization.
- Robust free cash flow of approximately $101 billion TTM supports operational flexibility and strategic investments.
- Market capitalization of $4.41 trillion reflects dominant industry positioning and investor confidence.
Cons
- High valuation multiples with a P/E ratio of 36.35 and P/B ratio of 41.35 may limit upside potential.
- Potential legal risks arising from OpenAI’s consideration of legal action could impact AI strategy and partnerships.
- Debt-to-equity ratio of 79.55% requires ongoing monitoring amid evolving market conditions.
Disclosure: This information is for general awareness and does not constitute investment advice
Report Summary
Apple Inc. operates as a leading technology company listed on the NASDAQ exchange under the symbol AAPL. The company designs, manufactures, and markets a broad portfolio of consumer electronics, including the iPhone, Mac computers, iPad tablets, and a range of wearables and accessories such as AirPods and Apple Watch. Additionally, Apple offers various digital services like the App Store and Apple Music, positioning itself as a dominant player in the consumer electronics sector with a strong global presence and integrated ecosystem. Its market positioning is reinforced by a diversified revenue stream spanning hardware, software, and services.
Financially, Apple reported trailing twelve months (TTM) revenue of approximately $451.4 billion, with a gross margin of 49.27%, operating margin of 32.28%, and net profit margin of 27.15%. The company demonstrates robust profitability and operational efficiency, supported by a return on equity (ROE) of 141.47% and return on assets (ROA) of 26.23%. Its return on invested capital (ROIC) is also strong, reflecting effective capital allocation. These metrics underscore Apple’s ability to generate substantial earnings relative to its equity and assets base.
Valuation metrics indicate a trailing price-to-earnings (P/E) ratio of 36.35 and a forward P/E of 31.32, with a price-to-book (P/B) ratio of 41.35 and an enterprise value to EBITDA (EV/EBITDA) of 27.67. The market capitalization stands at approximately $4.41 trillion, reflecting its status as one of the largest companies globally. The stock trades near its 52-week high of $303.20, with a current price of $300.22, suggesting valuation levels are elevated but consistent with its growth and profitability profile.
Apple’s strengths include strong free cash flow generation of over $101 billion TTM, a manageable debt-to-equity ratio of 79.55%, and a dominant market position in consumer electronics and digital services. Key risks involve regulatory scrutiny, competitive pressures in technology and AI sectors, and recent tensions with OpenAI that could impact its AI strategy. Recent strategic developments include ongoing partnerships and legal challenges related to AI integration, alongside leadership stability under CEO Tim Cook.
Technically, Apple’s stock exhibits an upward trend with price action near all-time highs, supported by key moving averages. Momentum indicators show strength across multiple timeframes, although recent news of legal disputes introduces some caution. The data suggests a balanced stance where market participants may be weighing potential growth against emerging risks, warranting close observation of developments in AI partnerships and regulatory environments.
Company and Industry Overview
Company Basics
Price Performance
Company Size
Shareholding Pattern
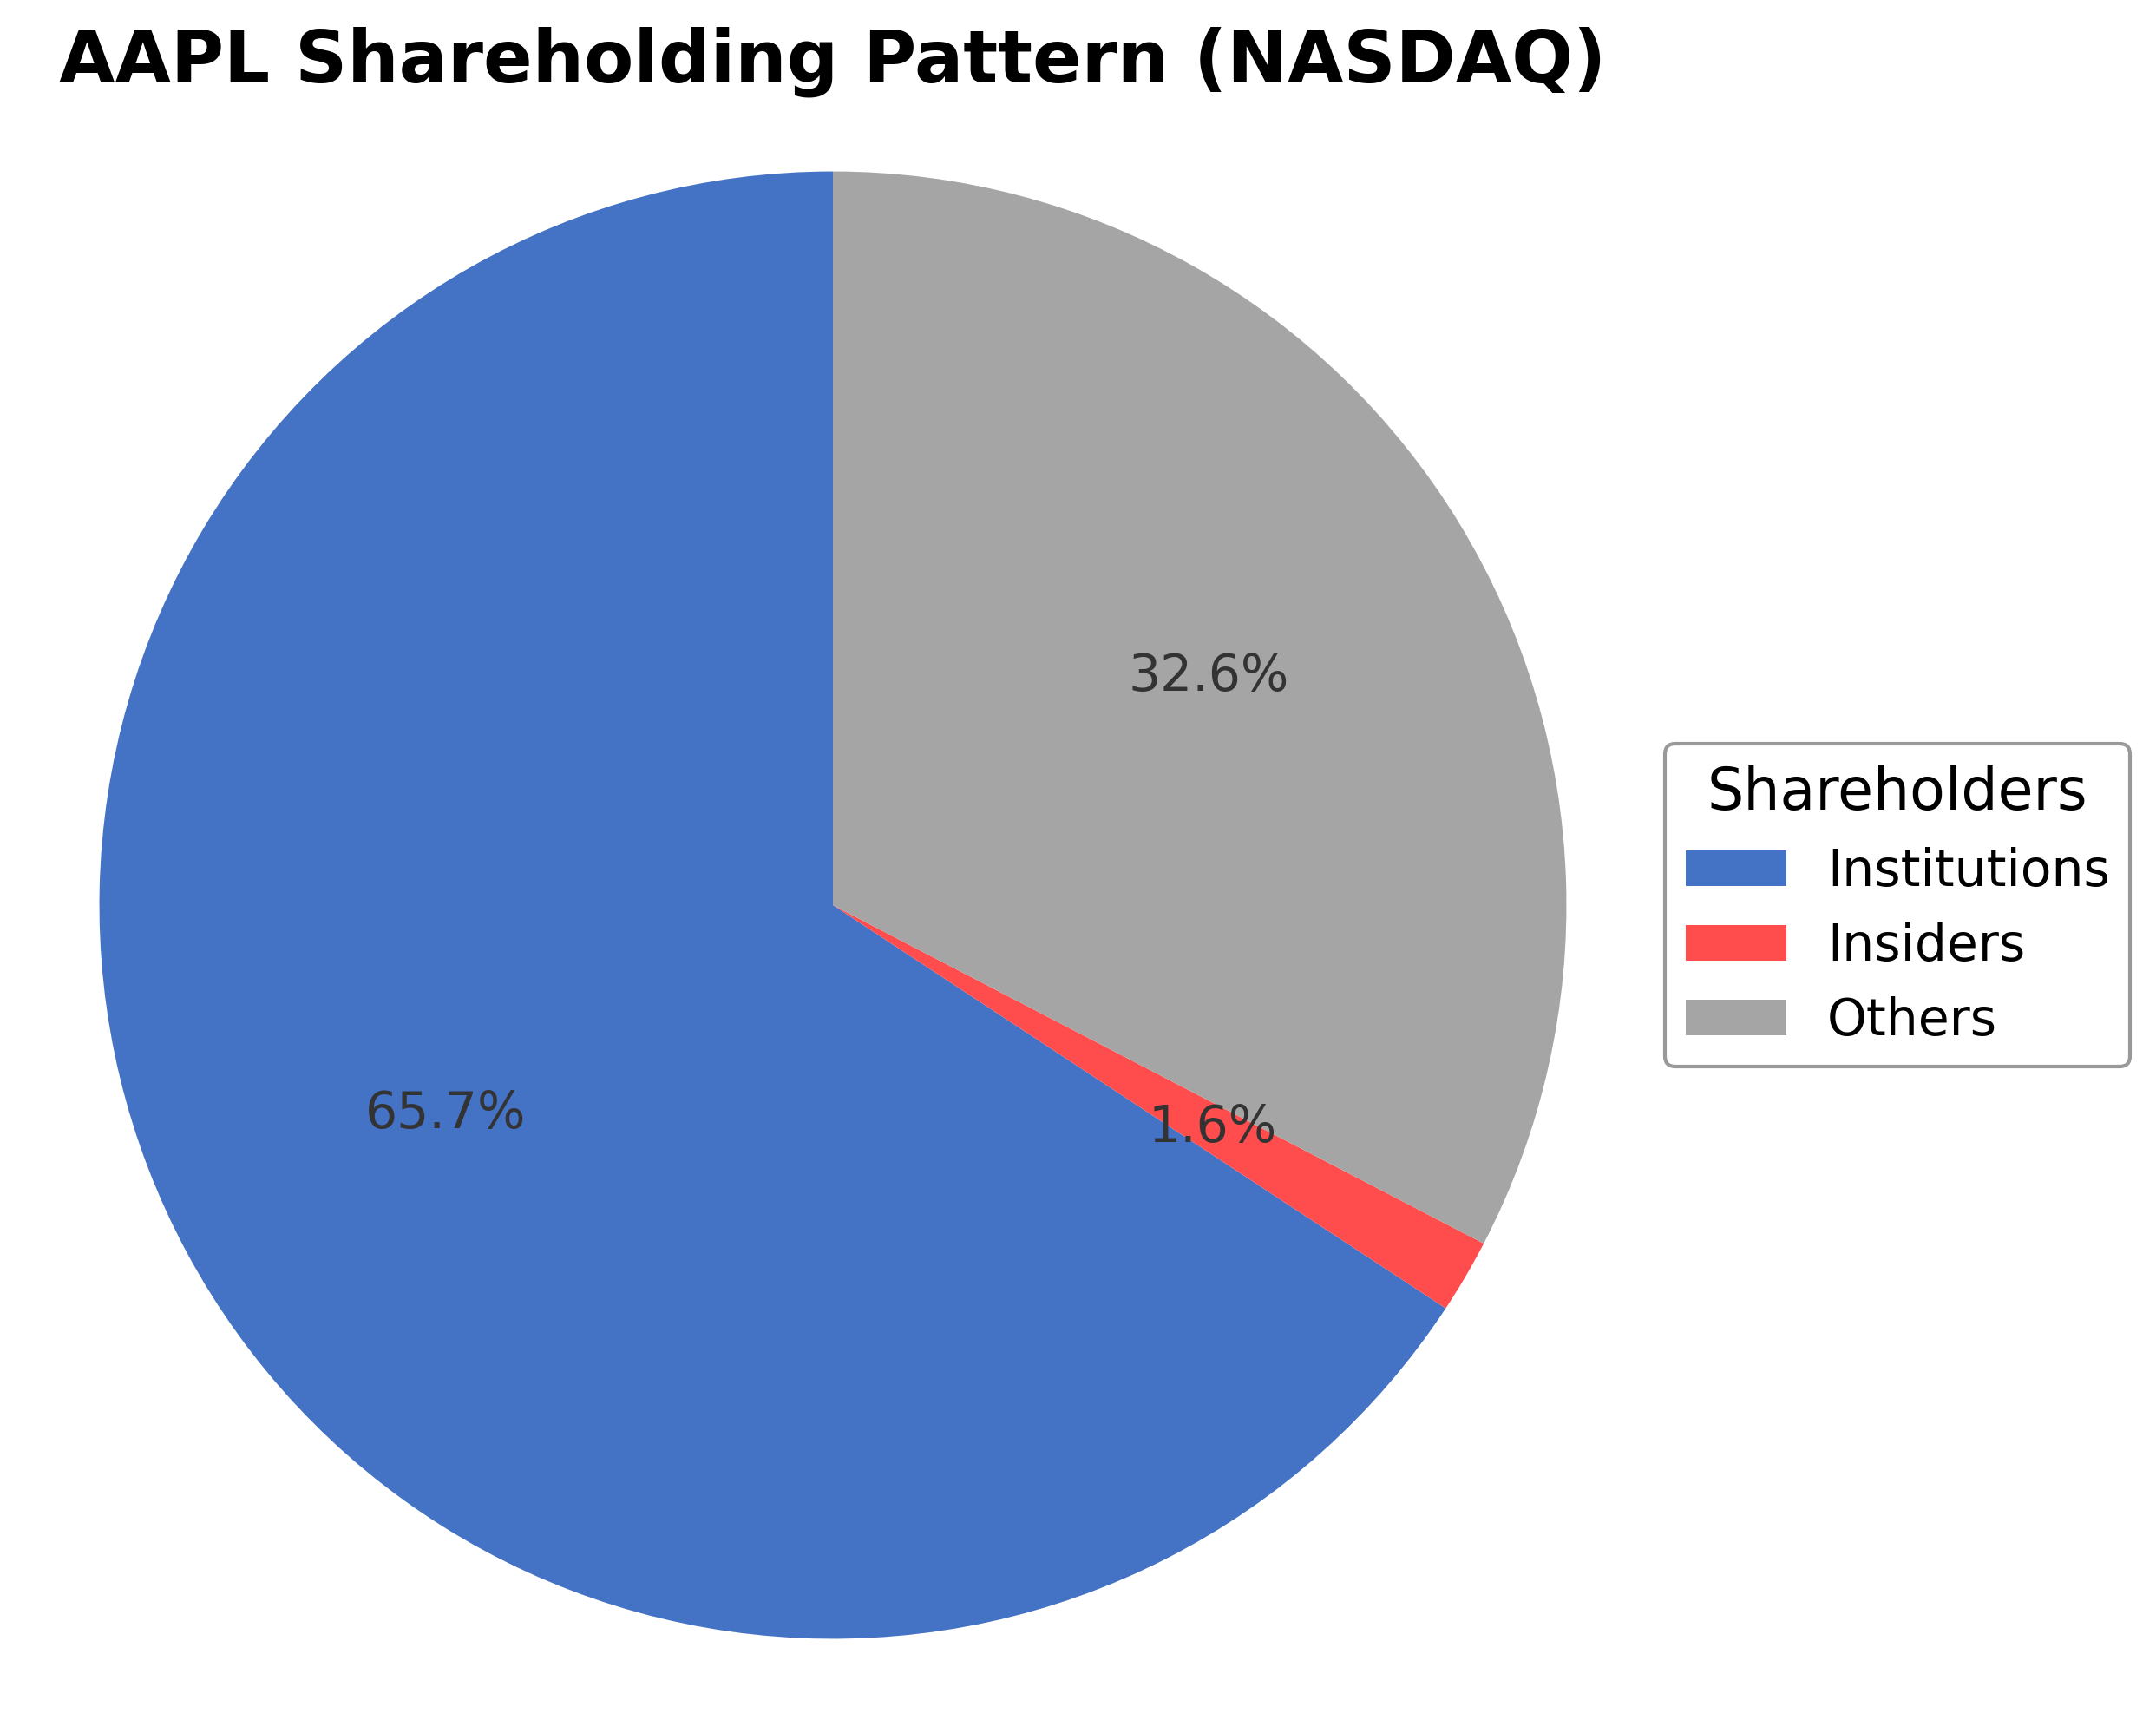
Apple Inc.'s ownership structure is characterized by a significant institutional investor presence at approximately 65.74%, reflecting strong interest from mutual funds, pension funds, and asset managers. Insider holdings are minimal at around 1.63%, indicating limited direct executive or board member share ownership. The remaining shares are held by public investors and other shareholders, comprising roughly 33.21% and 1.05% respectively. Over the past 12 to 24 months, institutional accumulation has remained steady with notable participation from large investment firms, suggesting confidence in the company’s strategic direction. This ownership distribution supports robust governance frameworks and aligns with Apple’s global market leadership in consumer electronics and technology services.
Sector and Industry Analysis
The global apple market is a significant segment within the broader agricultural sector, characterized by steady growth driven by rising health consciousness and increasing disposable incomes. The market encompasses a wide range of apple varieties and products, including fresh fruit and processed forms like juices and sauces. Major players include multinational agribusinesses and numerous local producers, with key regional markets in Asia, Europe, and North America contributing to overall expansion.
Emerging trends in the apple industry include a strong consumer shift toward organic and locally sourced produce, alongside innovations in packaging and storage technologies that extend shelf life. Competitive dynamics are shaped by technological advancements in cultivation and supply chain management, as well as intensified rivalry between global companies and smaller regional growers. Barriers to entry include climate-related production risks, stringent food safety standards, and fluctuating trade tariffs, which require significant investment in resilient farming practices and compliance.
The regulatory environment is increasingly focused on food safety, quality assurance, and sustainability, with stricter standards influencing production and distribution strategies. Policies related to carbon pricing and energy security also affect operational costs and supply chain logistics. Trade agreements and geopolitical tensions further impact export-import flows, necessitating adaptive market approaches and strategic partnerships to navigate evolving compliance and market access conditions.
Note: Analysis synthesized from industry research, market reports, and regulatory filings. Information is subject to change based on market conditions.
Financial Ratios Dashboard
Illustrative Scenario Analysis
DCF Assumptions:
Method: Two-Stage EPS-Priority Model
Financials
Peer Analysis
| Company Name | Market Cap | P/E Ratio | P/B Ratio | EV/EBITDA | Price to CFO |
|---|---|---|---|---|---|
| Apple Inc | $4.41T | 36.35 | 41.35 | 27.66 | 31.45 |
| Sony Group Corporation - Sponsored American Depositary Receipt | $131.81B | 20.47 | 2.55 | -0.01 | 10.75 |
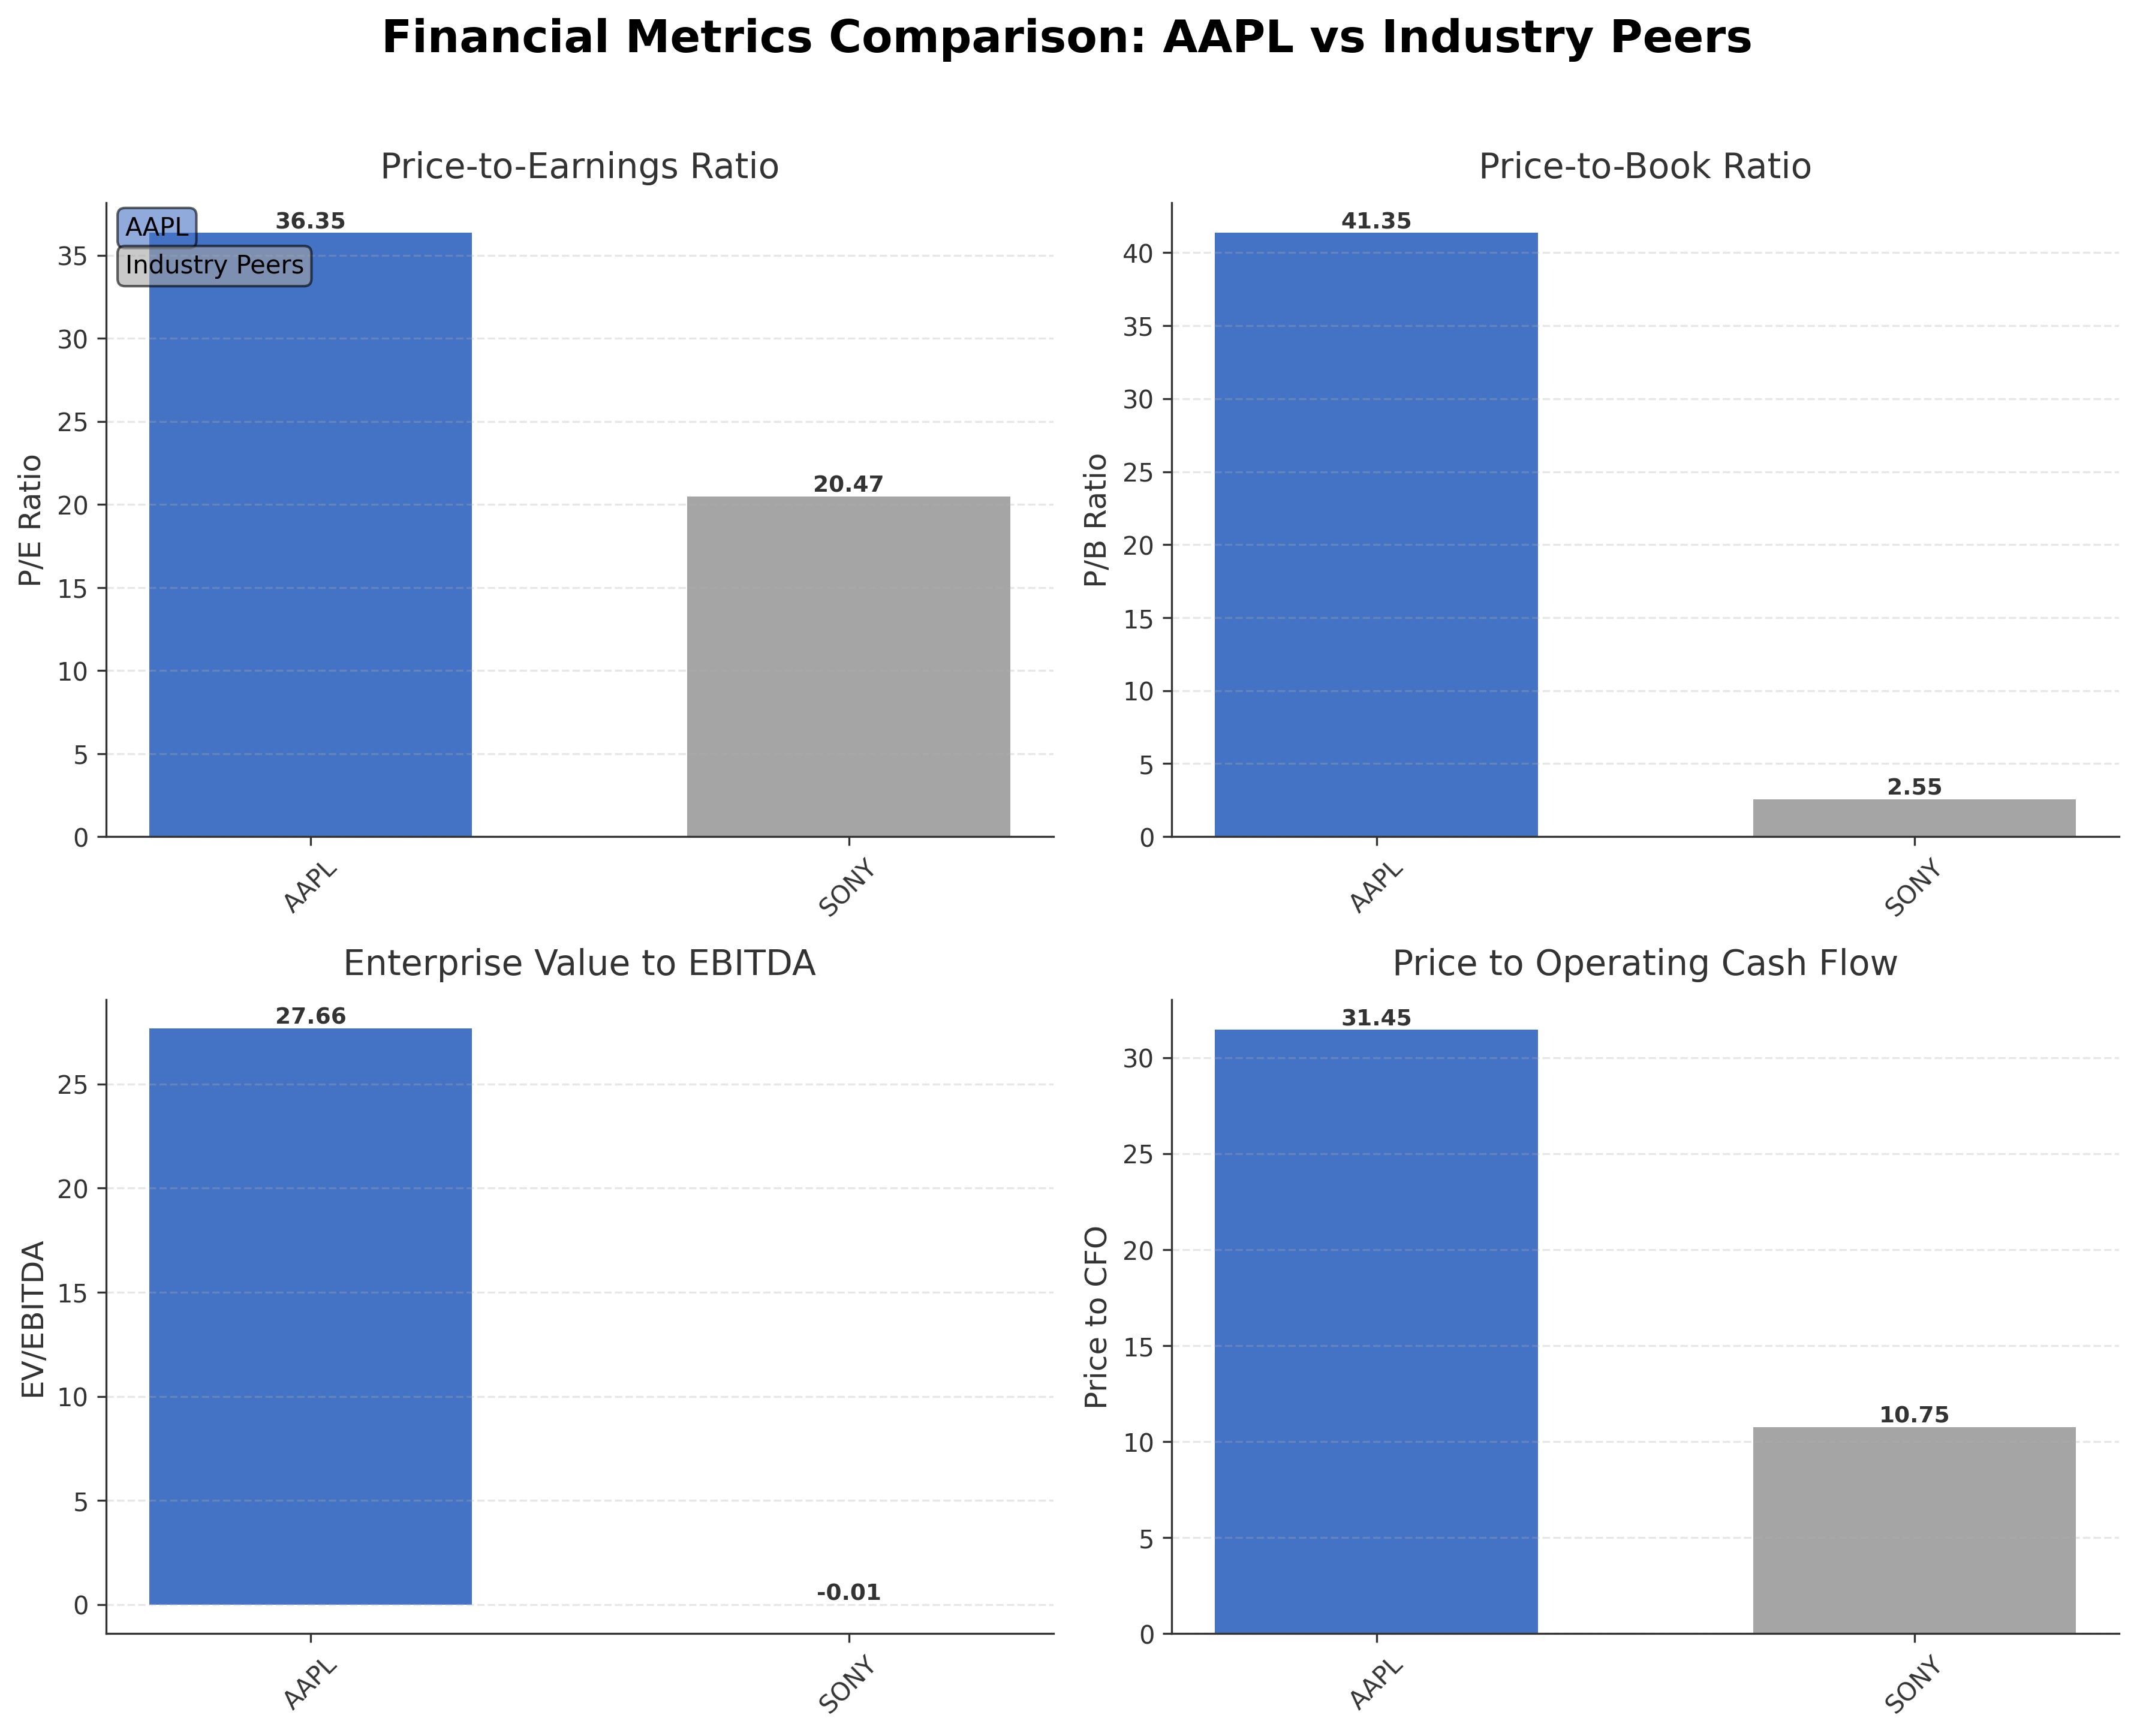
Comparison Analysis: Apple Inc. significantly outpaces its peer Sony Group Corporation in market capitalization, valuation multiples, and profitability metrics. Apple's P/E ratio of 36.35 and P/B ratio of 41.35 are substantially higher than Sony's 20.47 and 2.55 respectively, reflecting premium valuation consistent with its dominant market position and growth prospects. The return on equity for Apple at 141.47% far exceeds Sony's 0.12%, indicating superior efficiency in generating shareholder returns. Enterprise value to EBITDA also favors Apple, underscoring its earnings strength relative to enterprise value. Overall, Apple stands as a clear outlier with robust financial performance and elevated valuation compared to regional industry peers.
Financial Metrics Comparison with Peers
Financial Statements
Comprehensive financial data including income, balance sheet, and cash flow metrics
Income Statement
| fiscal_date | 2025-09-30 | 2024-09-30 | 2023-09-30 | 2022-09-30 | 2021-09-30 |
|---|---|---|---|---|---|
| Sales | 416.16B | 391.04B | 383.29B | 394.33B | 365.82B |
| Cost Of Goods | 220.96B | 210.35B | 214.14B | 223.55B | 212.98B |
| Gross Profit | 195.20B | 180.68B | 169.15B | 170.78B | 152.84B |
| Operating Expense Research And Development | 34.55B | 31.37B | 29.91B | 26.25B | 21.91B |
| Operating Expense Selling General And Administrative | 27.60B | 26.10B | 24.93B | 25.09B | 21.97B |
| Operating Income | 133.05B | 123.22B | 114.30B | 119.44B | 108.95B |
| Other Income Expense | -321.00M | 269.00M | -565.00M | -334.00M | 60.00M |
| Pretax Income | 132.73B | 123.48B | 113.74B | 119.10B | 109.21B |
| Income Tax | 20.72B | 29.75B | 16.74B | 19.30B | 14.53B |
| Net Income | 112.01B | 93.74B | 97.00B | 99.80B | 94.68B |
| Eps Basic | 7.49 | 6.11 | 6.16 | 6.15 | 5.67 |
| Eps Diluted | 7.46 | 6.08 | 6.13 | 6.11 | 5.61 |
| Basic Shares Outstanding | 14.95B | 15.34B | 15.74B | 16.22B | 16.70B |
| Diluted Shares Outstanding | 14.95B | 15.34B | 15.74B | 16.22B | 16.70B |
| Ebit | 133.05B | 123.22B | 114.30B | 119.44B | 111.85B |
| Ebitda | 144.75B | 134.66B | 125.82B | 130.54B | 123.14B |
| Net Income Continuous Operations | 112.01B | 93.74B | 97.00B | 99.80B | 94.68B |
| Non Operating Interest Income | N/A | N/A | 3.75B | 2.83B | 2.84B |
| Non Operating Interest Expense | N/A | N/A | 3.93B | 2.93B | 2.65B |
Source: Financial statements and regulatory filings
Balance Sheet
| fiscal_date | 2025-09-30 | 2024-09-30 | 2023-09-30 | 2022-09-30 | 2021-09-30 |
|---|---|---|---|---|---|
| Cash And Cash Equivalents | 35.93B | 29.94B | 29.96B | 23.65B | 34.94B |
| Accounts Receivable | 39.78B | 33.41B | 29.51B | 28.18B | 26.28B |
| Total Assets | 359.24B | 364.98B | 352.58B | 352.75B | 351.00B |
| Total Liabilities | 285.51B | 308.03B | 290.44B | 302.08B | 287.91B |
| Long Term Debt | 78.33B | 85.75B | 95.28B | 109.71B | 119.38B |
| Shareholders Equity | 73.73B | 56.95B | 62.15B | 50.67B | 63.09B |
Source: Financial statements and regulatory filings
Cash Flow Statement
| fiscal_date | 2025-09-30 | 2024-09-30 | 2023-09-30 | 2022-09-30 | 2021-09-30 |
|---|---|---|---|---|---|
| Operating Activities Net Income | 112.01B | 93.74B | 97.00B | 99.80B | 94.68B |
| Operating Activities Depreciation | 11.70B | 11.45B | 11.52B | 11.10B | 11.28B |
| Operating Activities Stock Based Compensation | 12.86B | 11.69B | 10.83B | 9.04B | 7.91B |
| Operating Activities Other Non Cash Items | -89.00M | -2.27B | -2.23B | 1.01B | -4.92B |
| Operating Activities Accounts Receivable | -7.03B | -5.14B | -417.00M | -9.34B | -14.03B |
| Operating Activities Accounts Payable | 902.00M | 6.02B | -1.89B | 9.45B | 12.33B |
| Operating Activities Other Assets Liabilities | -18.87B | 2.77B | -4.27B | 1.57B | -1.53B |
| Operating Activities Operating Cash Flow | 111.48B | 118.25B | 110.54B | 123.52B | 100.94B |
| Investing Activities Capital Expenditures | -12.71B | -9.45B | -10.96B | -10.71B | -11.09B |
| Investing Activities Purchase Of Investments | -24.41B | -48.66B | -29.51B | -76.92B | -109.56B |
| Investing Activities Sale Of Investments | 53.80B | 62.35B | 45.51B | 67.36B | 106.48B |
| Investing Activities Other Investing Activity | -1.48B | -1.31B | -1.34B | -2.09B | -385.00M |
| Investing Activities Investing Cash Flow | 15.20B | 2.94B | 3.71B | -22.66B | -14.58B |
| Financing Activities Long Term Debt Issuance | 4.48B | 0.00 | 5.23B | 5.46B | 20.39B |
| Financing Activities Long Term Debt Payments | -10.93B | -9.96B | -11.15B | -9.54B | -8.75B |
| Financing Activities Short Term Debt Issuance | -2.03B | 3.96B | -3.98B | 3.96B | 1.02B |
| Financing Activities Common Stock Repurchase | -90.71B | -94.95B | -77.55B | -89.40B | -85.97B |
| Financing Activities Common Dividends | -15.42B | -15.23B | -15.03B | -14.84B | -14.47B |
| Financing Activities Other Financing Charges | -6.07B | -5.80B | -6.01B | -6.38B | -5.58B |
| Financing Activities Financing Cash Flow | -120.69B | -121.98B | -108.49B | -110.75B | -92.25B |
| End Cash Position | 35.93B | 29.94B | 30.74B | 24.98B | 35.93B |
| Income Tax Paid | 43.37B | 26.10B | 18.68B | 19.57B | 25.39B |
| Free Cash Flow | 98.77B | 108.81B | 99.58B | 111.44B | 92.95B |
| Interest Paid | N/A | N/A | 3.80B | 2.87B | 2.69B |
| Operating Activities Deferred Taxes | N/A | N/A | N/A | 895.00M | -4.77B |
| Investing Activities Net Acquisitions | N/A | N/A | N/A | -306.00M | -33.00M |
| Financing Activities Common Stock Issuance | N/A | N/A | N/A | N/A | 1.10B |
Source: Financial statements and regulatory filings
Technical Analysis
Key Insights
- Apple's stock is currently in a strong uptrend, trading near its 52-week high with consistent higher highs and higher lows observed in recent price action.
- Key support levels are identified near $266.19 (50-day moving average) and $259.13 (200-day moving average), while resistance is close to the recent high around $303.20.
- The stock price is above the 10-day, 50-day, and 200-day moving averages, indicating bullish momentum across short, medium, and long-term timeframes.
- Momentum indicators show the Relative Strength Index (RSI) in the upper range, suggesting strong buying pressure; MACD remains positive, and stochastic oscillators confirm upward momentum.
- Multi-timeframe analysis reveals consistent strength on daily, weekly, and monthly charts, with no significant bearish divergences detected.
- Potential market scenarios include continuation of the upward trend supported by strong fundamentals, though legal and regulatory news could introduce volatility and short-term pullbacks.
Trending News
1. Headline: Long-Term Apple Deal Does Little Good for Intel Stock (NASDAQ:INTC) - TipRanks.com
Summary: Chip stock Intel ($INTC) was on top of the world recently as word emerged that Apple ($AAPL) was looking to team up with Intel to produce chips. New reports suggest...
Sentiment: positive
2. Headline: Viking Global Investors Lp Reports Share Stake Of 3.6 Million Shares In Apple - SEC Filing — TradingView News
Summary: Search · Get started · Viking Global Investors Lp Reports Share Stake Of 3.6 Million Shares In Apple - SEC Filing · RefinitivLess than 1 min read · AAPLMETATSLA · Login or create a forever free account to read this news · Let's go · Compare charts · Analyze on Supercharts · Latest news
Sentiment: neutral
3. Headline: Apple shares climbed to a record high as investors look past AI concerns
Summary: Apple's stock rally continued even though the company still hasn't fully released several major Apple Intelligence upgrades it previewed earlier in 2026. The delayed features include the more personalized Siri experience Apple demonstrated during its AI rollout.
Sentiment: positive
4. Headline: Cerebras IPO Stock Pop; Apple-OpenAI Drama — The Information
Summary: This was quite the day. OpenAI is jumping up and down about its unhappiness with Apple (it’s doubtful Tim Cook is shaking in his boots). Big telecom threw down the gauntlet to Elon Musk and Amazon (not that they should worry). We get to both news items lower down.
Sentiment: negative
5. Headline: Apple Stock Falls After $300 Test: Why AAPL’s OpenAI Risk Is Back
Summary: Apple shares fell 0.2% to $298.21 Thursday after news that OpenAI is considering legal action over a strained partnership, Reuters reported.
Sentiment: negative
Recent Updates
News Summary
As of 2026-05-15. Recent developments indicate that Apple faces potential legal challenges from OpenAI concerning the integration of ChatGPT into Apple's mobile ecosystem. Reports reveal that OpenAI's legal team is actively considering formal actions, which introduces uncertainty around Apple's AI strategy and partnerships. Despite this, Apple’s stock has remained near record highs, supported by strong financial performance and investor confidence in its broader growth prospects. The legal situation underscores complexities in technology collaborations involving AI, which may impact future product offerings and market perception.
News Sentiment
The overall sentiment from recent updates is mixed to neutral, with positive investor response to Apple's financial strength and AI initiatives tempered by concerns over potential legal disputes with OpenAI. While the stock has shown resilience, the legal uncertainties present a risk factor that could influence market sentiment and strategic partnerships. The balance of strong fundamentals against emerging legal challenges suggests cautious monitoring of developments is warranted.
Source List
- https://ts2.tech/en/apple-stock-falls-after-300-test-why-aapls-openai-risk-is-back/
- https://stocktwits.com/news-articles/markets/equity/aapl-stock-slips-from-record-highs-as-legal-action-threatens-open-ai-alliance-report/cZX16MNReSW
Analytical Overview
Analysis Summary
Apple’s valuation metrics, including a trailing P/E of 36.35 and forward P/E of 31.32, are elevated relative to industry averages but reflect the company’s premium market positioning and growth expectations. The PEG ratio of 1.62 indicates moderate valuation relative to earnings growth. Revenue growth of 16.6% year-over-year and strong operating cash flow trends demonstrate a solid growth trajectory supported by diversified product and service offerings. Financial health is robust, with a debt-to-equity ratio of 79.55% and substantial free cash flow exceeding $101 billion TTM, indicating strong liquidity and capacity for capital allocation. Sector-specific challenges include regulatory scrutiny and competitive pressures in AI and consumer electronics, while opportunities arise from expanding AI integration and service platforms. Market positioning and competitive advantages are significant given Apple’s ecosystem and brand strength.
Overall Business and Market Assessment
Supporting Factors: No data
Risk Factors: Apple’s investment appeal is supported by its strong profitability, substantial cash flow generation, and leadership in technology innovation. Key risks to monitor include potential legal disputes with AI partners such as OpenAI and regulatory challenges that may affect its operational flexibility. The appropriate investment timeframe is medium to long-term, considering the company’s stable fundamentals and evolving technology landscape. Overall, Apple presents a balanced profile with premium valuation justified by growth prospects, tempered by emerging partnership risks.
SWOT Analysis
Strengths
- Market leadership in consumer electronics and integrated ecosystem.
- Strong profitability with high gross and net margins.
- Robust free cash flow exceeding $101 billion TTM.
- Significant institutional investor ownership supporting governance.
Weaknesses
- High price-to-book ratio indicating premium valuation.
- Moderate debt-to-equity ratio of 79.55% requires monitoring.
- Limited insider ownership potentially reducing direct executive alignment.
- Dependence on continued innovation in competitive technology sectors.
Opportunities
- Expansion of AI capabilities and integration across products.
- Growth in digital services and subscription platforms.
- Strategic partnerships and supply chain diversification.
- Increasing demand for wearable and health monitoring devices.
Threats
- Potential legal disputes with AI partners such as OpenAI.
- Regulatory scrutiny in multiple jurisdictions.
- Intense competition from other technology and consumer electronics firms.
- Macroeconomic factors impacting consumer spending and supply chains.
Company Description
Apple Inc. designs, manufactures, and markets a wide range of technology products worldwide. These include the iPhone, a line of smartphones; Mac, a line of personal computers; iPad, a line of multi-purpose tablets; and wearables, home, and accessories such as AirPods, Apple Vision Pro, Apple TV, Apple Watch, Beats products, HomePod, as well as Apple branded and third-party accessories. The company operates service platforms including the App Store, Apple Music, and subscription models that provide curated content, cloud services, and digital offerings. Apple Inc. serves individual consumers, businesses, and government sectors through online stores, retail outlets, and partnerships with cellular carriers and resellers. Its products span the information technology sector, impacting mobile communication, personal computing, entertainment, and health monitoring. Founded in 1976 and headquartered in Cupertino, California, Apple Inc. plays a pivotal role in the global technology market by integrating hardware, software, and services into seamless ecosystems.