
Apple Inc (AAPL)
Stock Analysis Report
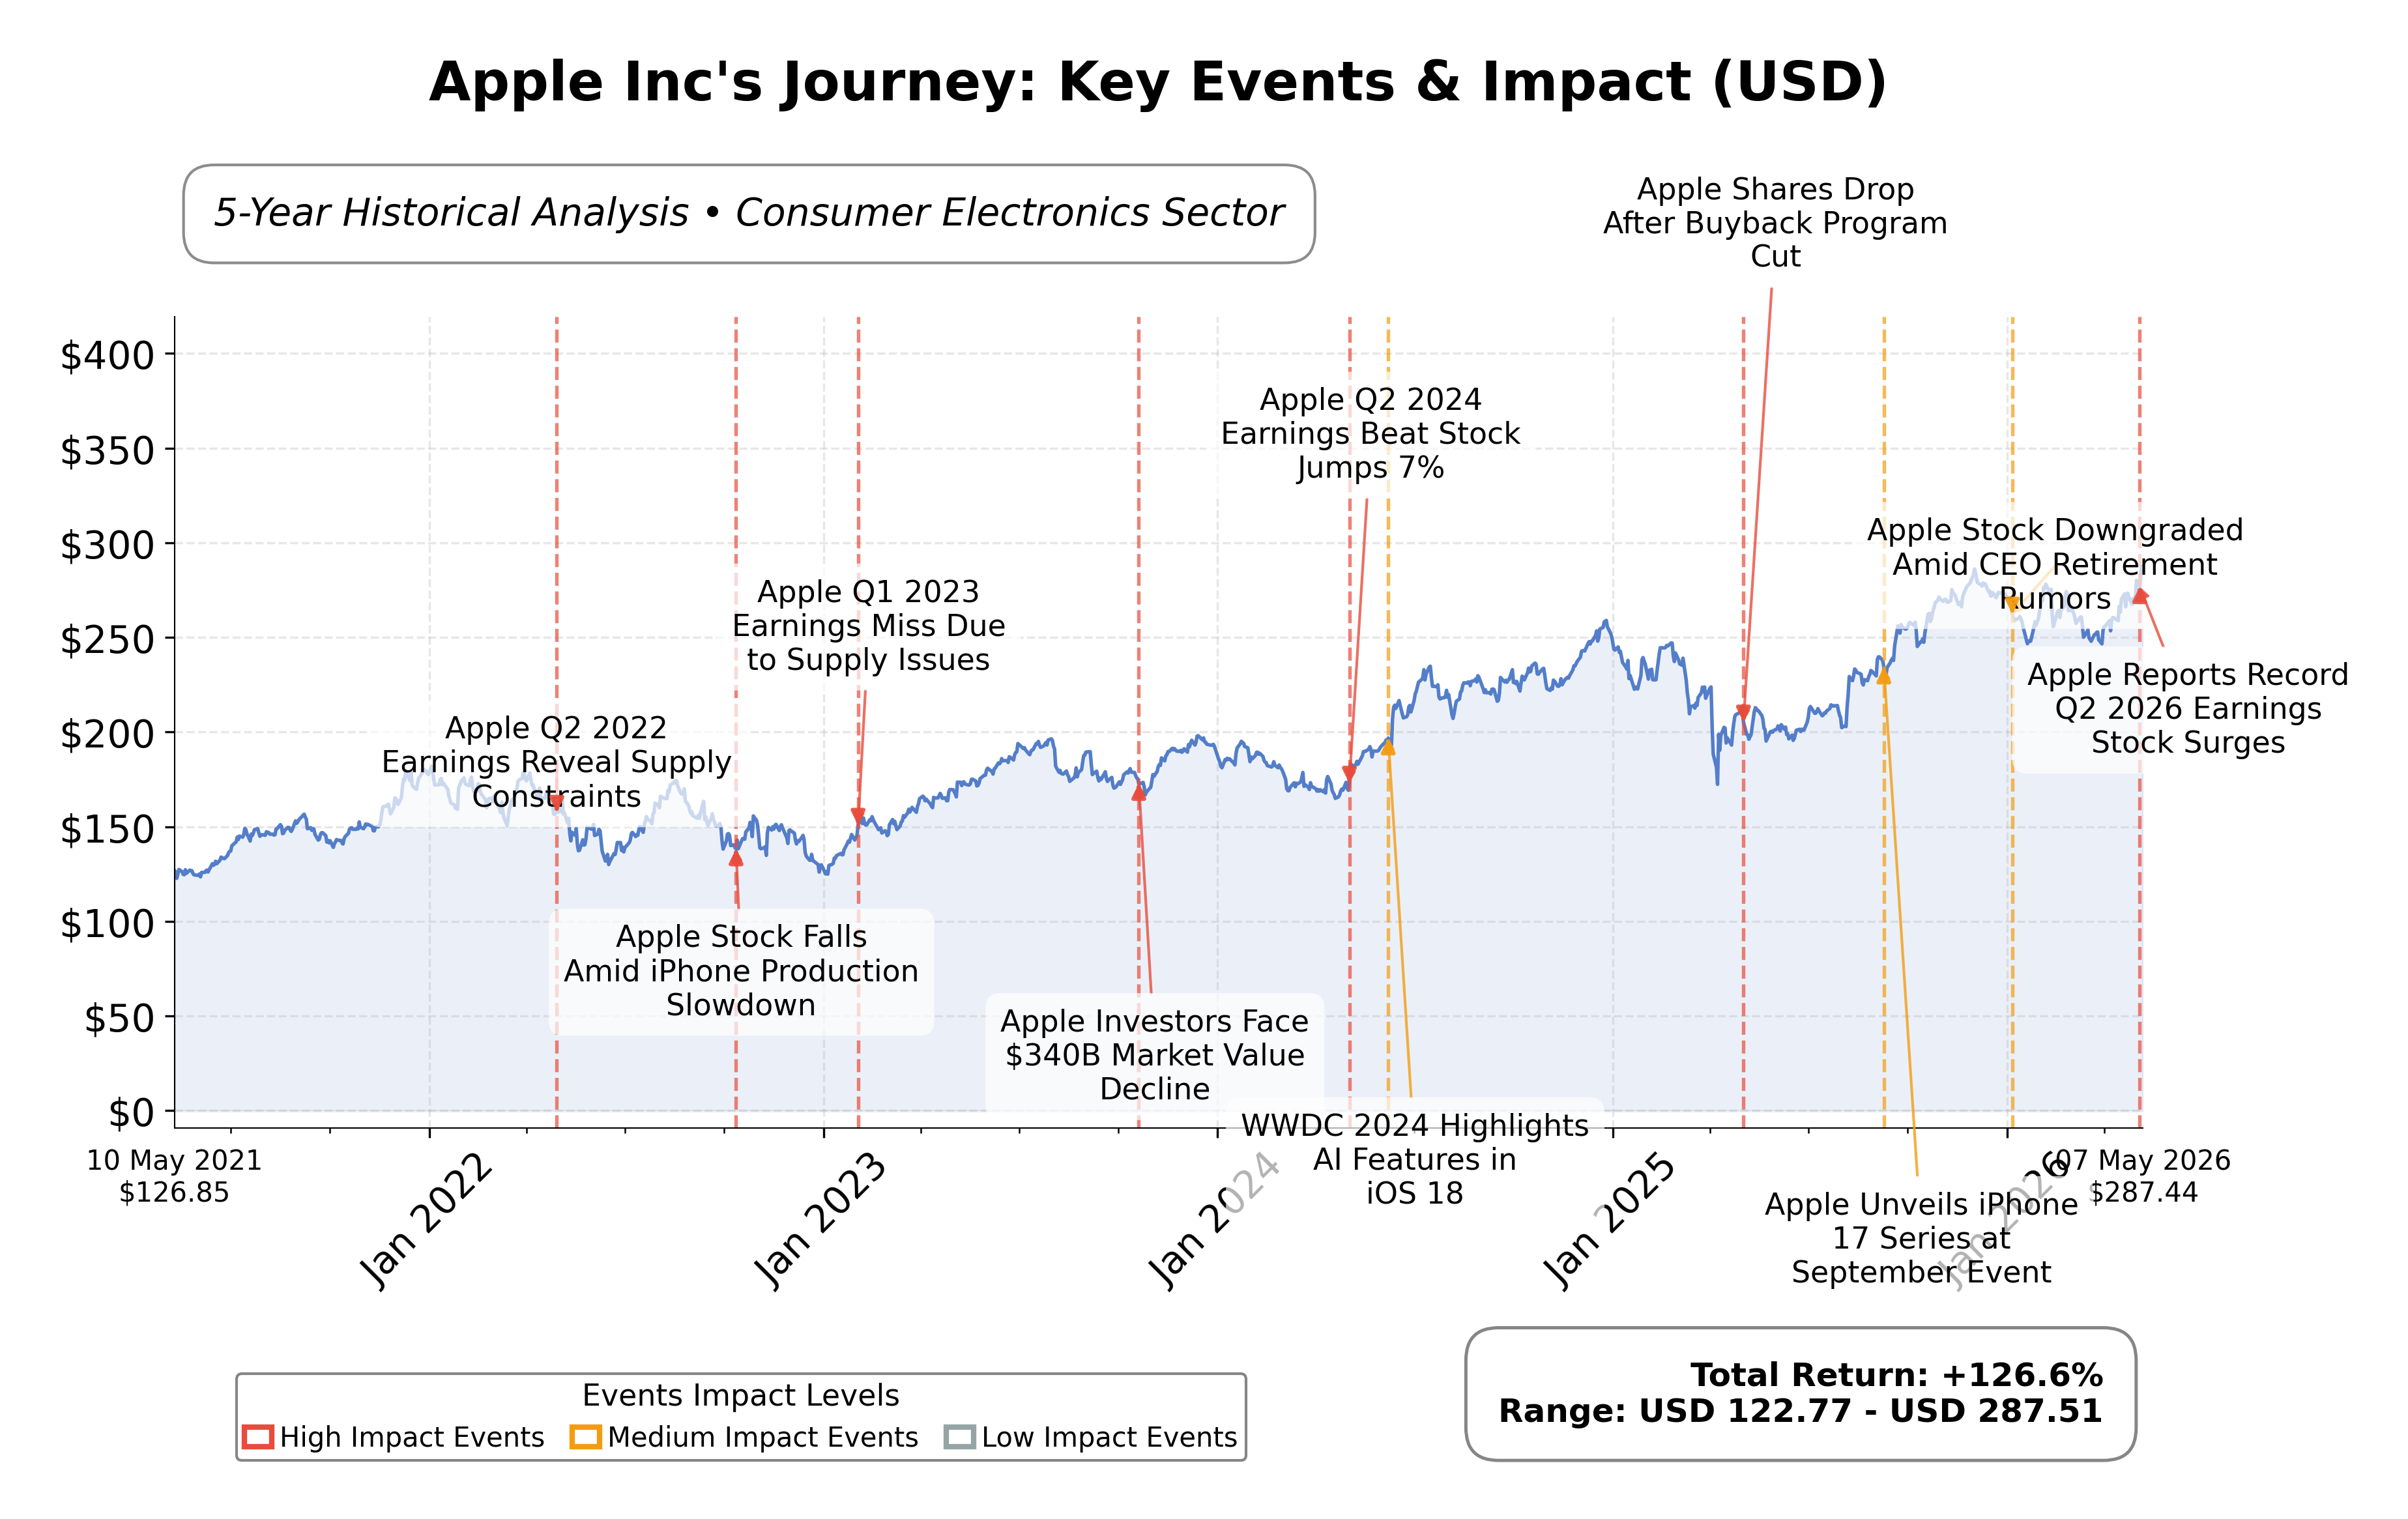
Stock Journey
Key Positives and Key Risks
Pros
- Market capitalization of $4.11 trillion underscores Apple’s scale and market dominance.
- Strong profitability with a net profit margin of 27.15% and ROE of 141.47% indicates efficient capital use.
- Robust cash flow generation with operating cash flow of $140.2 billion and free cash flow of $100.5 billion supports capital returns.
Cons
- High valuation multiples with a P/E ratio of 33.92 and P/B ratio of 46.71 may constrain further price appreciation.
- Dependence on iPhone sales for majority of revenue exposes the company to product cycle risks.
- Debt-to-equity ratio of 79.55% reflects leverage that could impact financial flexibility under adverse conditions.
Disclosure: This information is for general awareness and does not constitute investment advice
Report Summary
Apple Inc. operates as a leading technology company listed on NASDAQ under the symbol AAPL, specializing in consumer electronics and software services. The company is renowned for its flagship iPhone product line, which drives the majority of its revenue, complemented by Mac computers, iPads, Apple Watch, and a suite of digital services including the App Store and Apple Music. Positioned within the technology sector, Apple maintains a significant global presence through retail and online channels, serving a broad consumer and business market. Its innovative ecosystem and integrated product offerings underscore its market leadership in consumer electronics.
Financially, Apple reported trailing twelve months (TTM) revenue of approximately $451.4 billion with a net profit margin of 27.15%, indicating strong profitability. Operating margin stands at 32.28%, and return on equity (ROE) is notably high at 141.47%, reflecting efficient use of shareholder capital. Return on assets (ROA) is 26.23%, and return on invested capital (ROIC) is robust, supported by operating cash flow of $140.2 billion and free cash flow of $100.5 billion TTM. These metrics highlight Apple's operational efficiency and solid earnings generation capacity.
Valuation metrics show a trailing price-to-earnings (P/E) ratio of 33.92 and a forward P/E of 29.39, with a price-to-book (P/B) ratio of 46.71 and an enterprise value to EBITDA (EV/EBITDA) of 25.79. The market capitalization is approximately $4.11 trillion, positioning Apple as one of the largest companies globally. The stock price currently trades near $292.76, above its 52-week low of $193.25 and close to the 52-week high of $288.62, indicating a strong price recovery and premium valuation relative to fundamentals.
Apple's strengths include substantial cash reserves of $68.5 billion, manageable debt levels with a debt-to-equity ratio of 79.55%, and leadership in innovation with significant R&D investments. Risks encompass competitive pressures in technology markets, regulatory scrutiny, and supply chain challenges. Recent strategic actions include a $100 billion stock buyback program and a 4% dividend increase, alongside leadership transition plans with Tim Cook moving to Executive Chairman and John Ternus assuming CEO responsibilities.
Technically, Apple exhibits a positive trend with price action above key moving averages (50-day and 200-day), supported by momentum indicators signaling strength across multiple timeframes. Recent news highlights ongoing product innovation and robust earnings performance. The data suggests a market environment where accumulation and monitoring of developments remain prudent, reflecting balanced optimism tempered by valuation considerations.
Company and Industry Overview
Company Basics
Price Performance
Company Size
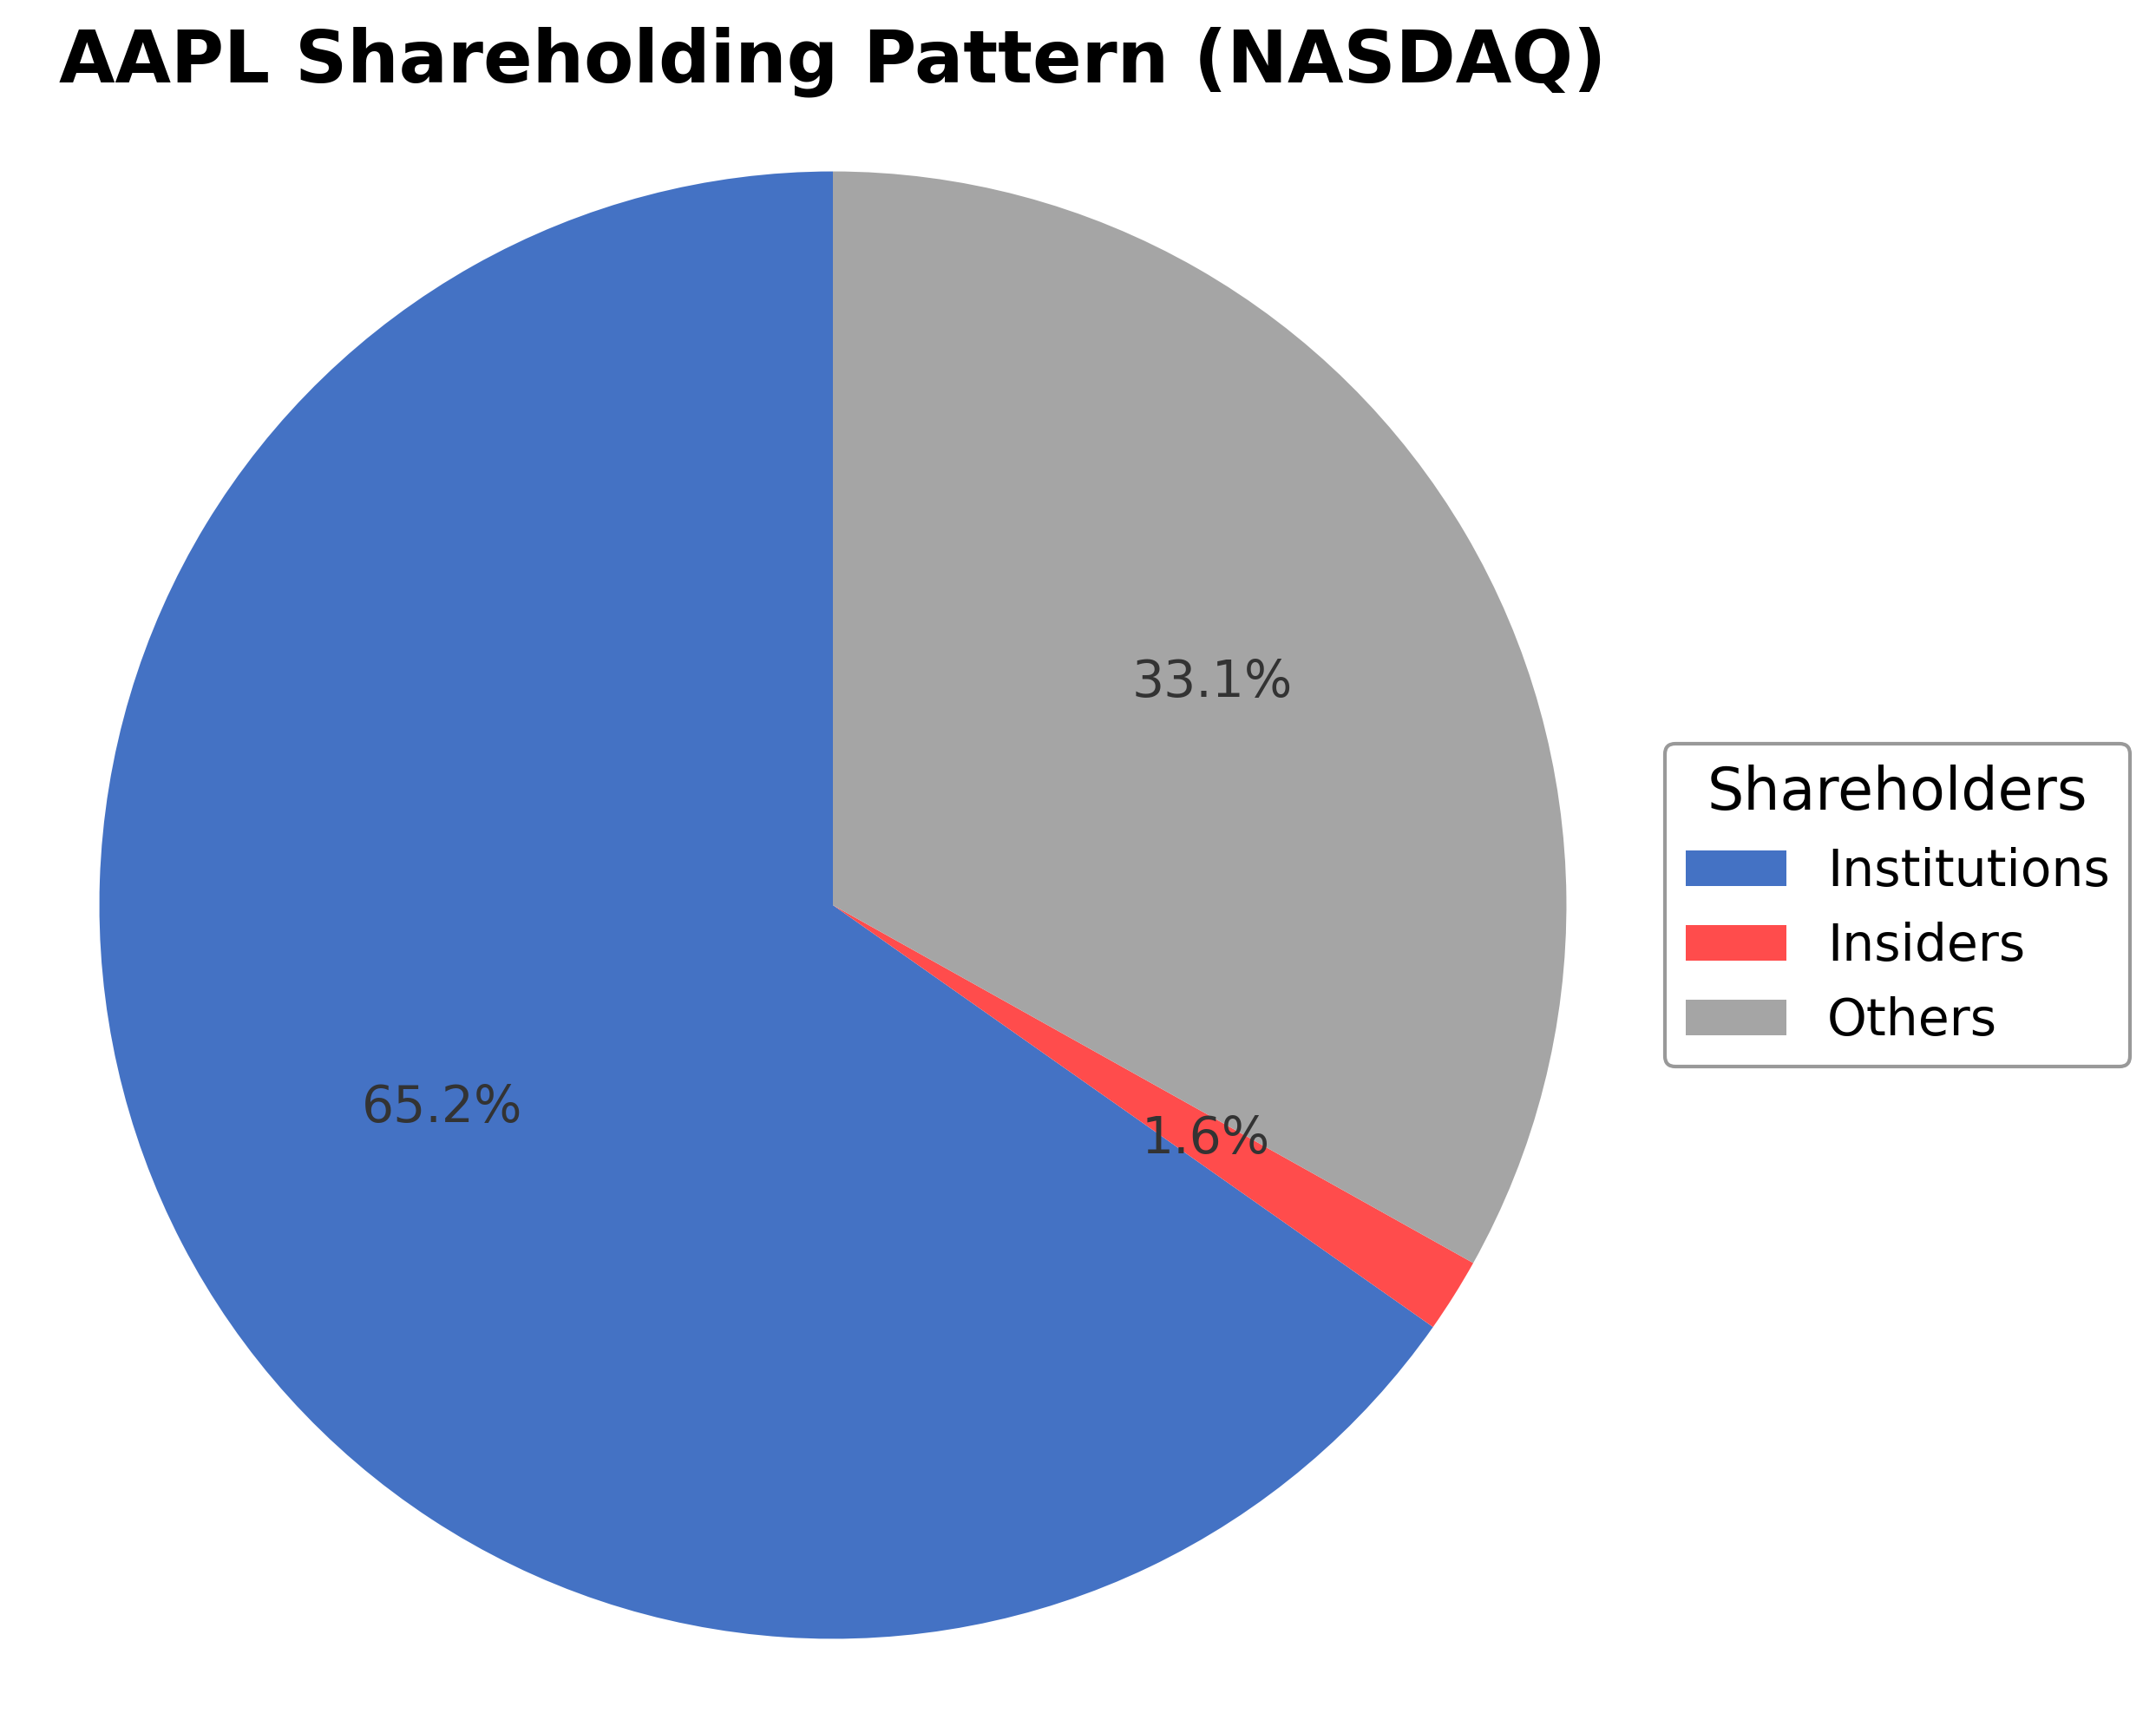
Shareholding Pattern
Sector and Industry Analysis
The global apple market is projected to grow by approximately USD 15.94 billion between 2024 and 2029, with a compound annual growth rate (CAGR) of 3.4%. This growth is supported by rising demand for superfoods and health-conscious consumption patterns. Leading vendors in the market include Auvil Fruit Co. Inc., Batlow Fruit Co. Pty Ltd, and Stemilt Growers LLC, among others, contributing to a competitive landscape with around 25 key players.
Industry trends highlight increasing urban farming and the expansion of retail channels, including private-label brands, as significant growth drivers. The market is segmented by apple type, such as red apples and Granny Smith/golden apples, and by distribution channel, both offline and online. Barriers to entry remain moderate due to established vendor presence and the need for differentiation through product variety and quality.
The regulatory environment focuses on food safety standards and agricultural practices, which influence production and distribution processes. Compliance with these regulations ensures market access and consumer trust but may increase operational costs. Overall, regulatory frameworks are expected to maintain stability, supporting steady market expansion through 2029.
Note: Analysis synthesized from industry research, market reports, and regulatory filings. Information is subject to change based on market conditions.
Financial Ratios Dashboard
Illustrative Scenario Analysis
DCF Assumptions:
Method: Two-Stage EPS-Priority Model
Financials
Peer Analysis
| Company Name | Market Cap | P/E Ratio | P/B Ratio | EV/EBITDA | Price to CFO |
|---|---|---|---|---|---|
| Apple Inc | $4.11T | 33.92 | 46.71 | 25.79 | 29.33 |
| Sony Group Corporation - Sponsored American Depositary Receipt | $116.85B | 15.33 | 2.31 | 0.02 | 8.92 |
Comparison Analysis: Apple Inc. significantly outpaces its peer Sony Group Corporation in market capitalization, with a $4.11 trillion valuation compared to Sony's $116.85 billion. Apple's P/E ratio of 33.92 is more than double Sony's 15.33, reflecting higher growth expectations or premium valuation. The P/B ratio disparity is notable, with Apple at 46.71 versus Sony's 2.31, indicating Apple's substantial intangible assets and brand value. EV/EBITDA and price to CFO ratios also highlight Apple's premium positioning. Return on equity for Apple at 1.41% exceeds Sony's 0.15%, demonstrating superior profitability. Overall, Apple commands a dominant market position with higher valuation multiples and profitability metrics relative to its regional industry peer.
Financial Metrics Comparison with Peers

Financial Statements
Comprehensive financial data including income, balance sheet, and cash flow metrics
Income Statement
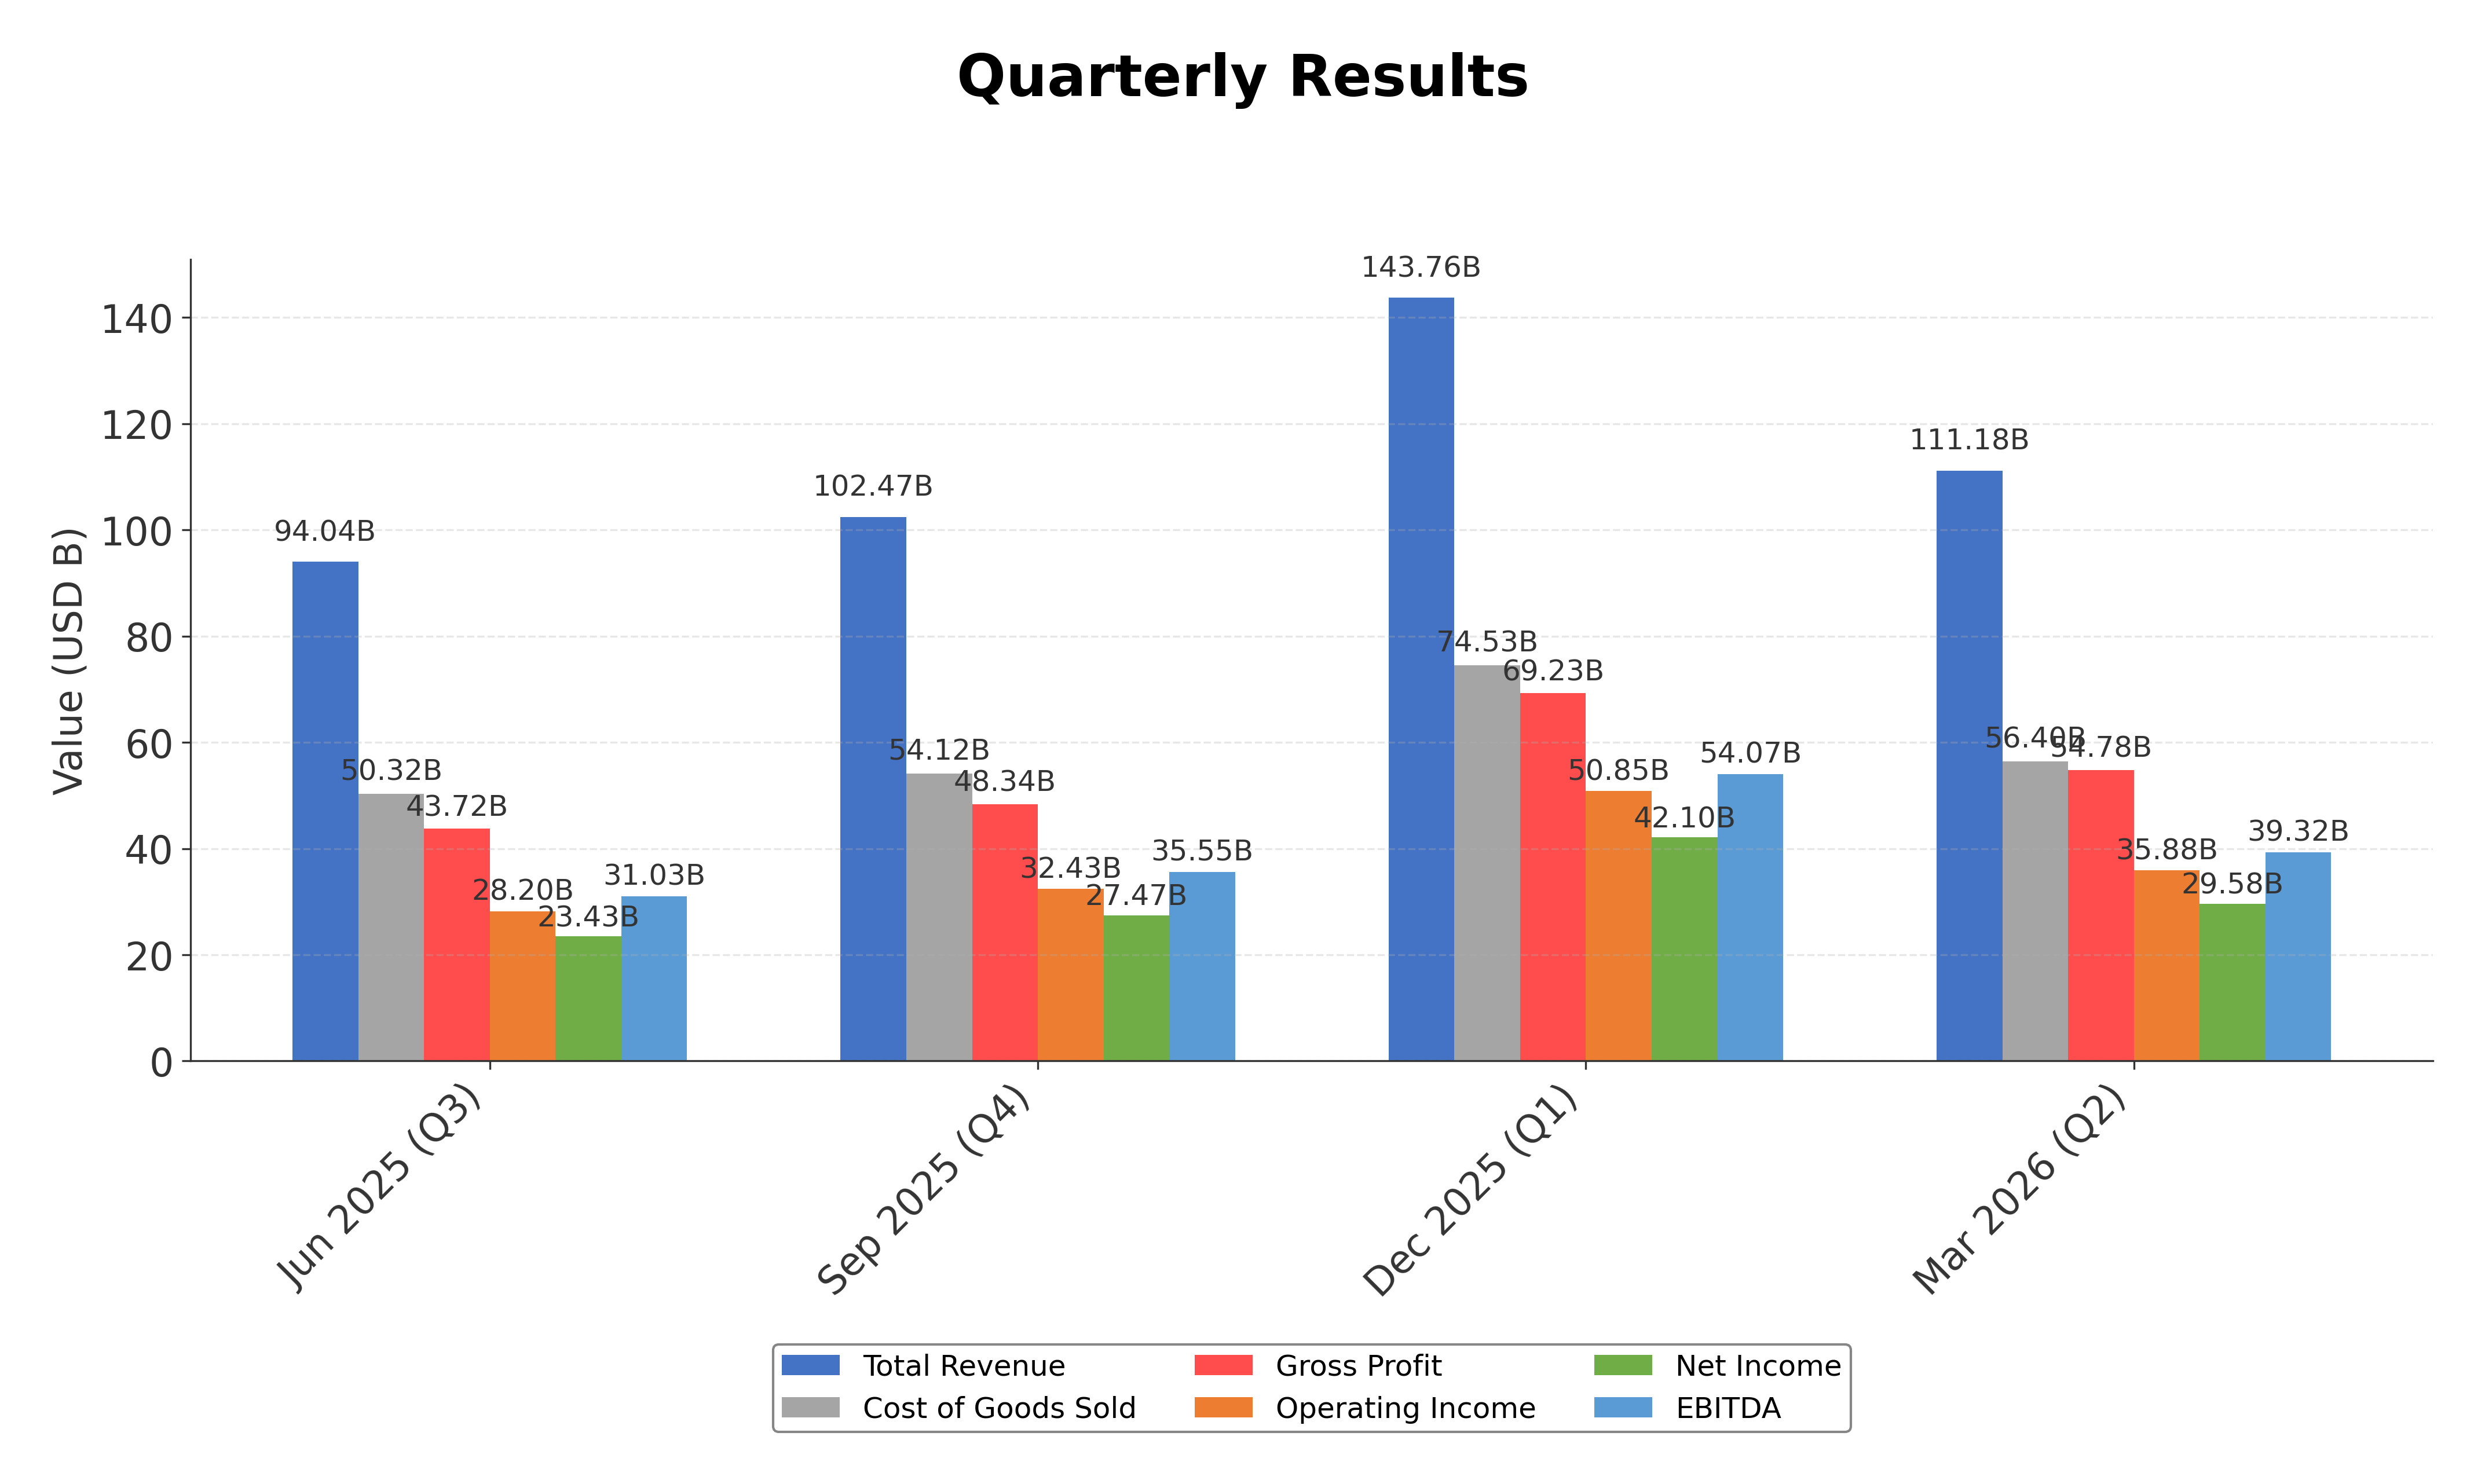
| fiscal_date | 2025-09-30 | 2024-09-30 | 2023-09-30 | 2022-09-30 | 2021-09-30 |
|---|---|---|---|---|---|
| Sales | 416.16B | 391.04B | 383.29B | 394.33B | 365.82B |
| Cost Of Goods | 220.96B | 210.35B | 214.14B | 223.55B | 212.98B |
| Gross Profit | 195.20B | 180.68B | 169.15B | 170.78B | 152.84B |
| Operating Expense Research And Development | 34.55B | 31.37B | 29.91B | 26.25B | 21.91B |
| Operating Expense Selling General And Administrative | 27.60B | 26.10B | 24.93B | 25.09B | 21.97B |
| Operating Income | 133.05B | 123.22B | 114.30B | 119.44B | 108.95B |
| Other Income Expense | -321.00M | 269.00M | -565.00M | -334.00M | 60.00M |
| Pretax Income | 132.73B | 123.48B | 113.74B | 119.10B | 109.21B |
| Income Tax | 20.72B | 29.75B | 16.74B | 19.30B | 14.53B |
| Net Income | 112.01B | 93.74B | 97.00B | 99.80B | 94.68B |
| Eps Basic | 7.49 | 6.11 | 6.16 | 6.15 | 5.67 |
| Eps Diluted | 7.46 | 6.08 | 6.13 | 6.11 | 5.61 |
| Basic Shares Outstanding | 14.95B | 15.34B | 15.74B | 16.22B | 16.70B |
| Diluted Shares Outstanding | 14.95B | 15.34B | 15.74B | 16.22B | 16.70B |
| Ebit | 133.05B | 123.22B | 114.30B | 119.44B | 111.85B |
| Ebitda | 144.75B | 134.66B | 125.82B | 130.54B | 123.14B |
| Net Income Continuous Operations | 112.01B | 93.74B | 97.00B | 99.80B | 94.68B |
| Non Operating Interest Income | N/A | N/A | 3.75B | 2.83B | 2.84B |
| Non Operating Interest Expense | N/A | N/A | 3.93B | 2.93B | 2.65B |
Source: Financial statements and regulatory filings
Balance Sheet
| fiscal_date | 2025-09-30 | 2024-09-30 | 2023-09-30 | 2022-09-30 | 2021-09-30 |
|---|---|---|---|---|---|
| Cash And Cash Equivalents | 35.93B | 29.94B | 29.96B | 23.65B | 34.94B |
| Accounts Receivable | 39.78B | 33.41B | 29.51B | 28.18B | 26.28B |
| Total Assets | 359.24B | 364.98B | 352.58B | 352.75B | 351.00B |
| Total Liabilities | 285.51B | 308.03B | 290.44B | 302.08B | 287.91B |
| Long Term Debt | 78.33B | 85.75B | 95.28B | 109.71B | 119.38B |
| Shareholders Equity | 73.73B | 56.95B | 62.15B | 50.67B | 63.09B |
Source: Financial statements and regulatory filings
Cash Flow Statement
| fiscal_date | 2025-09-30 | 2024-09-30 | 2023-09-30 | 2022-09-30 | 2021-09-30 |
|---|---|---|---|---|---|
| Operating Activities Net Income | 112.01B | 93.74B | 97.00B | 99.80B | 94.68B |
| Operating Activities Depreciation | 11.70B | 11.45B | 11.52B | 11.10B | 11.28B |
| Operating Activities Stock Based Compensation | 12.86B | 11.69B | 10.83B | 9.04B | 7.91B |
| Operating Activities Other Non Cash Items | -89.00M | -2.27B | -2.23B | 1.01B | -4.92B |
| Operating Activities Accounts Receivable | -7.03B | -5.14B | -417.00M | -9.34B | -14.03B |
| Operating Activities Accounts Payable | 902.00M | 6.02B | -1.89B | 9.45B | 12.33B |
| Operating Activities Other Assets Liabilities | -18.87B | 2.77B | -4.27B | 1.57B | -1.53B |
| Operating Activities Operating Cash Flow | 111.48B | 118.25B | 110.54B | 123.52B | 100.94B |
| Investing Activities Capital Expenditures | -12.71B | -9.45B | -10.96B | -10.71B | -11.09B |
| Investing Activities Purchase Of Investments | -24.41B | -48.66B | -29.51B | -76.92B | -109.56B |
| Investing Activities Sale Of Investments | 53.80B | 62.35B | 45.51B | 67.36B | 106.48B |
| Investing Activities Other Investing Activity | -1.48B | -1.31B | -1.34B | -2.09B | -385.00M |
| Investing Activities Investing Cash Flow | 15.20B | 2.94B | 3.71B | -22.66B | -14.58B |
| Financing Activities Long Term Debt Issuance | 4.48B | 0.00 | 5.23B | 5.46B | 20.39B |
| Financing Activities Long Term Debt Payments | -10.93B | -9.96B | -11.15B | -9.54B | -8.75B |
| Financing Activities Short Term Debt Issuance | -2.03B | 3.96B | -3.98B | 3.96B | 1.02B |
| Financing Activities Common Stock Repurchase | -90.71B | -94.95B | -77.55B | -89.40B | -85.97B |
| Financing Activities Common Dividends | -15.42B | -15.23B | -15.03B | -14.84B | -14.47B |
| Financing Activities Other Financing Charges | -6.07B | -5.80B | -6.01B | -6.38B | -5.58B |
| Financing Activities Financing Cash Flow | -120.69B | -121.98B | -108.49B | -110.75B | -92.25B |
| End Cash Position | 35.93B | 29.94B | 30.74B | 24.98B | 35.93B |
| Income Tax Paid | 43.37B | 26.10B | 18.68B | 19.57B | 25.39B |
| Free Cash Flow | 98.77B | 108.81B | 99.58B | 111.44B | 92.95B |
| Interest Paid | N/A | N/A | 3.80B | 2.87B | 2.69B |
| Operating Activities Deferred Taxes | N/A | N/A | N/A | 895.00M | -4.77B |
| Investing Activities Net Acquisitions | N/A | N/A | N/A | -306.00M | -33.00M |
| Financing Activities Common Stock Issuance | N/A | N/A | N/A | N/A | 1.10B |
Source: Financial statements and regulatory filings
Technical Analysis
Key Insights
- Apple's current trend is upward, with price action exhibiting higher highs and higher lows, indicating bullish momentum.
- Key support levels are identified near $260 and $255, corresponding to the 50-day and 200-day moving averages respectively, while resistance is near the recent high of $288.62.
- The stock price is trading above the 10-day, 50-day, and 200-day moving averages, suggesting sustained positive momentum across short to long-term horizons.
- Momentum indicators show the RSI in the mid-60s range, MACD above its signal line, and stochastic oscillators indicating strength but nearing overbought conditions.
- Multi-timeframe analysis reveals consistent bullish signals on daily, weekly, and monthly charts, with no significant reversal patterns detected.
- Potential market scenarios include continuation of the uptrend if support levels hold, while a break below $255 could signal consolidation or correction phases.
Trending News
1. Headline: San Luis Wealth Advisors LLC Cuts Stock Holdings in Apple Inc. $AAPL
Summary: San Luis Wealth Advisors LLC reduced its stake in Apple Inc. (NASDAQ:AAPL - Free Report) by 1.9% during the 4th quarter, according to its most recent 13F filing with the Securities and Exchange Commission. The institutional investor owned 126,455 shares of the iPhone maker's stock after selling 2,
Sentiment: negative
2. Headline: A $100 Billion Reason to Buy Apple Stock Here
Summary: This indicates the tech giant's ... The company also increased its dividend by 4% to $0.27 per share (translating to an annual dividend rate of $1.08 that yields 0.38% on current prices), payable to shareholders on May 14. Therefore, Apple’s stock might be the one to watch ...
Sentiment: positive
3. Headline: Thursday Wall Street stocks by analysts include Nvidia, Apple, Uber
Summary: Here are the biggest calls on Wall Street on Thursday.
Sentiment: neutral
4. Headline: Are you eligible for a share of Apple's $250M new Siri settlement? - 9to5Mac
Summary: We reported earlier this week that Apple had reached a $250 million settlement over delays to the introduction of the...
Sentiment: positive
5. Headline: Dear Apple Stock Fans, Mark Your Calendars for May 11
Summary: Despite this, Apple reported solid Q2 FY26 earnings and increased its cash dividend by 4% to $0.27 per share (translating to an annual dividend rate of $1.08 and yielding 0.38% on current prices). Shareholders of record at the close of business on May 11 will receive the dividend payable on May 14. Further, the company declared an additional program to repurchase up to $100 billion of its common stock...
Sentiment: positive
Recent Updates
News Summary
As of May 8, 2026. Apple announced a $100 billion stock buyback program alongside a 4% increase in its quarterly dividend to $0.27 per share, reflecting strong cash flow and a commitment to shareholder value. The company reported record Q2 FY26 earnings with revenue of $111.2 billion, a 17% year-over-year increase, and diluted EPS of $2.01, up 22%. Growth was driven by robust iPhone sales, including the iPhone 17 lineup, and record Services revenue. Leadership transition plans were disclosed, with Tim Cook moving to Executive Chairman and John Ternus becoming CEO. The company also highlighted ongoing product innovation, including new iPads and MacBooks, and provided guidance for continued revenue growth in the upcoming quarter.
News Sentiment
The overall sentiment from recent updates is predominantly positive, driven by strong financial performance, record revenues, and strategic capital return initiatives such as the large stock buyback and dividend increase. Positive investor sentiment is supported by product innovation and leadership continuity. Neutral tones arise from standard investor relations communications and cautious institutional selling by some shareholders. Negative sentiment is minimal and mainly related to minor stake reductions by specific investors. The balance of news suggests confidence in Apple's operational and financial trajectory, tempered by typical market dynamics.
Source List
Analytical Overview
Analysis Summary
Apple’s valuation metrics, including a trailing P/E of 33.92 and forward P/E of 29.39, are elevated relative to the consumer electronics industry average P/E of 33.92, reflecting premium pricing supported by growth prospects. The company’s revenue growth of 16.6% year-over-year and strong cash flow trends, with operating cash flow of $140.2 billion and free cash flow of $100.5 billion, indicate a robust growth trajectory. Financial health is solid, with a debt-to-equity ratio of 79.55% balanced by substantial cash reserves of $68.5 billion, supporting liquidity and capital allocation flexibility. Sector-specific challenges include supply chain constraints and competitive pressures, while opportunities arise from expanding services and AI investments. Market positioning and competitive advantages are underscored by Apple’s brand strength, innovation pipeline, and integrated ecosystem.
Overall Business and Market Assessment
Supporting Factors: Apple’s record revenue and earnings growth, strong cash flow generation, and strategic capital return programs such as the $100 billion buyback and dividend increase
Risk Factors: No data
SWOT Analysis
Strengths
- Market leadership with a strong global brand and ecosystem integration.
- Robust profitability with high operating and net margins.
- Significant cash flow generation supporting capital returns and innovation.
- Strong balance sheet with substantial cash reserves and manageable debt.
Weaknesses
- High valuation multiples may limit upside potential.
- Dependence on iPhone sales for a large portion of revenue.
- Relatively low dividend yield compared to some peers.
- Complex supply chain susceptible to disruptions.
Opportunities
- Expansion of services and subscription-based revenue streams.
- Increased investment in AI and emerging technologies.
- Growth potential in emerging markets and new product categories.
- Strategic acquisitions and partnerships to enhance innovation.
Threats
- Intense competition in consumer electronics and technology sectors.
- Regulatory challenges and potential antitrust scrutiny.
- Global economic uncertainties affecting consumer spending.
- Supply chain constraints and rising component costs.
Company Description
Apple Inc. is a leading technology company renowned for designing, manufacturing, and marketing innovative hardware and software products for consumers and businesses worldwide. Its flagship product, the iPhone, accounts for the majority of sales, serving as the central hub of an expansive ecosystem that includes Mac computers, iPad tablets, Apple Watch wearables, and accessories like AirPods. Apple Inc. also offers a suite of services such as the App Store, Apple Music, iCloud, Apple TV+, and Apple Fitness+, providing digital content, cloud storage, and subscription-based platforms. Operating in the consumer electronics industry within the technology sector, the company employs approximately 166,000 people and maintains a broad global presence through online stores, retail outlets, and partnerships with carriers and resellers. With a substantial market capitalization reflecting its scale, Apple Inc. plays a pivotal role in shaping consumer technology trends, emphasizing seamless integration across devices and services to enhance user experience and productivity.