
Apple Inc (AAPL)
Stock Analysis Report
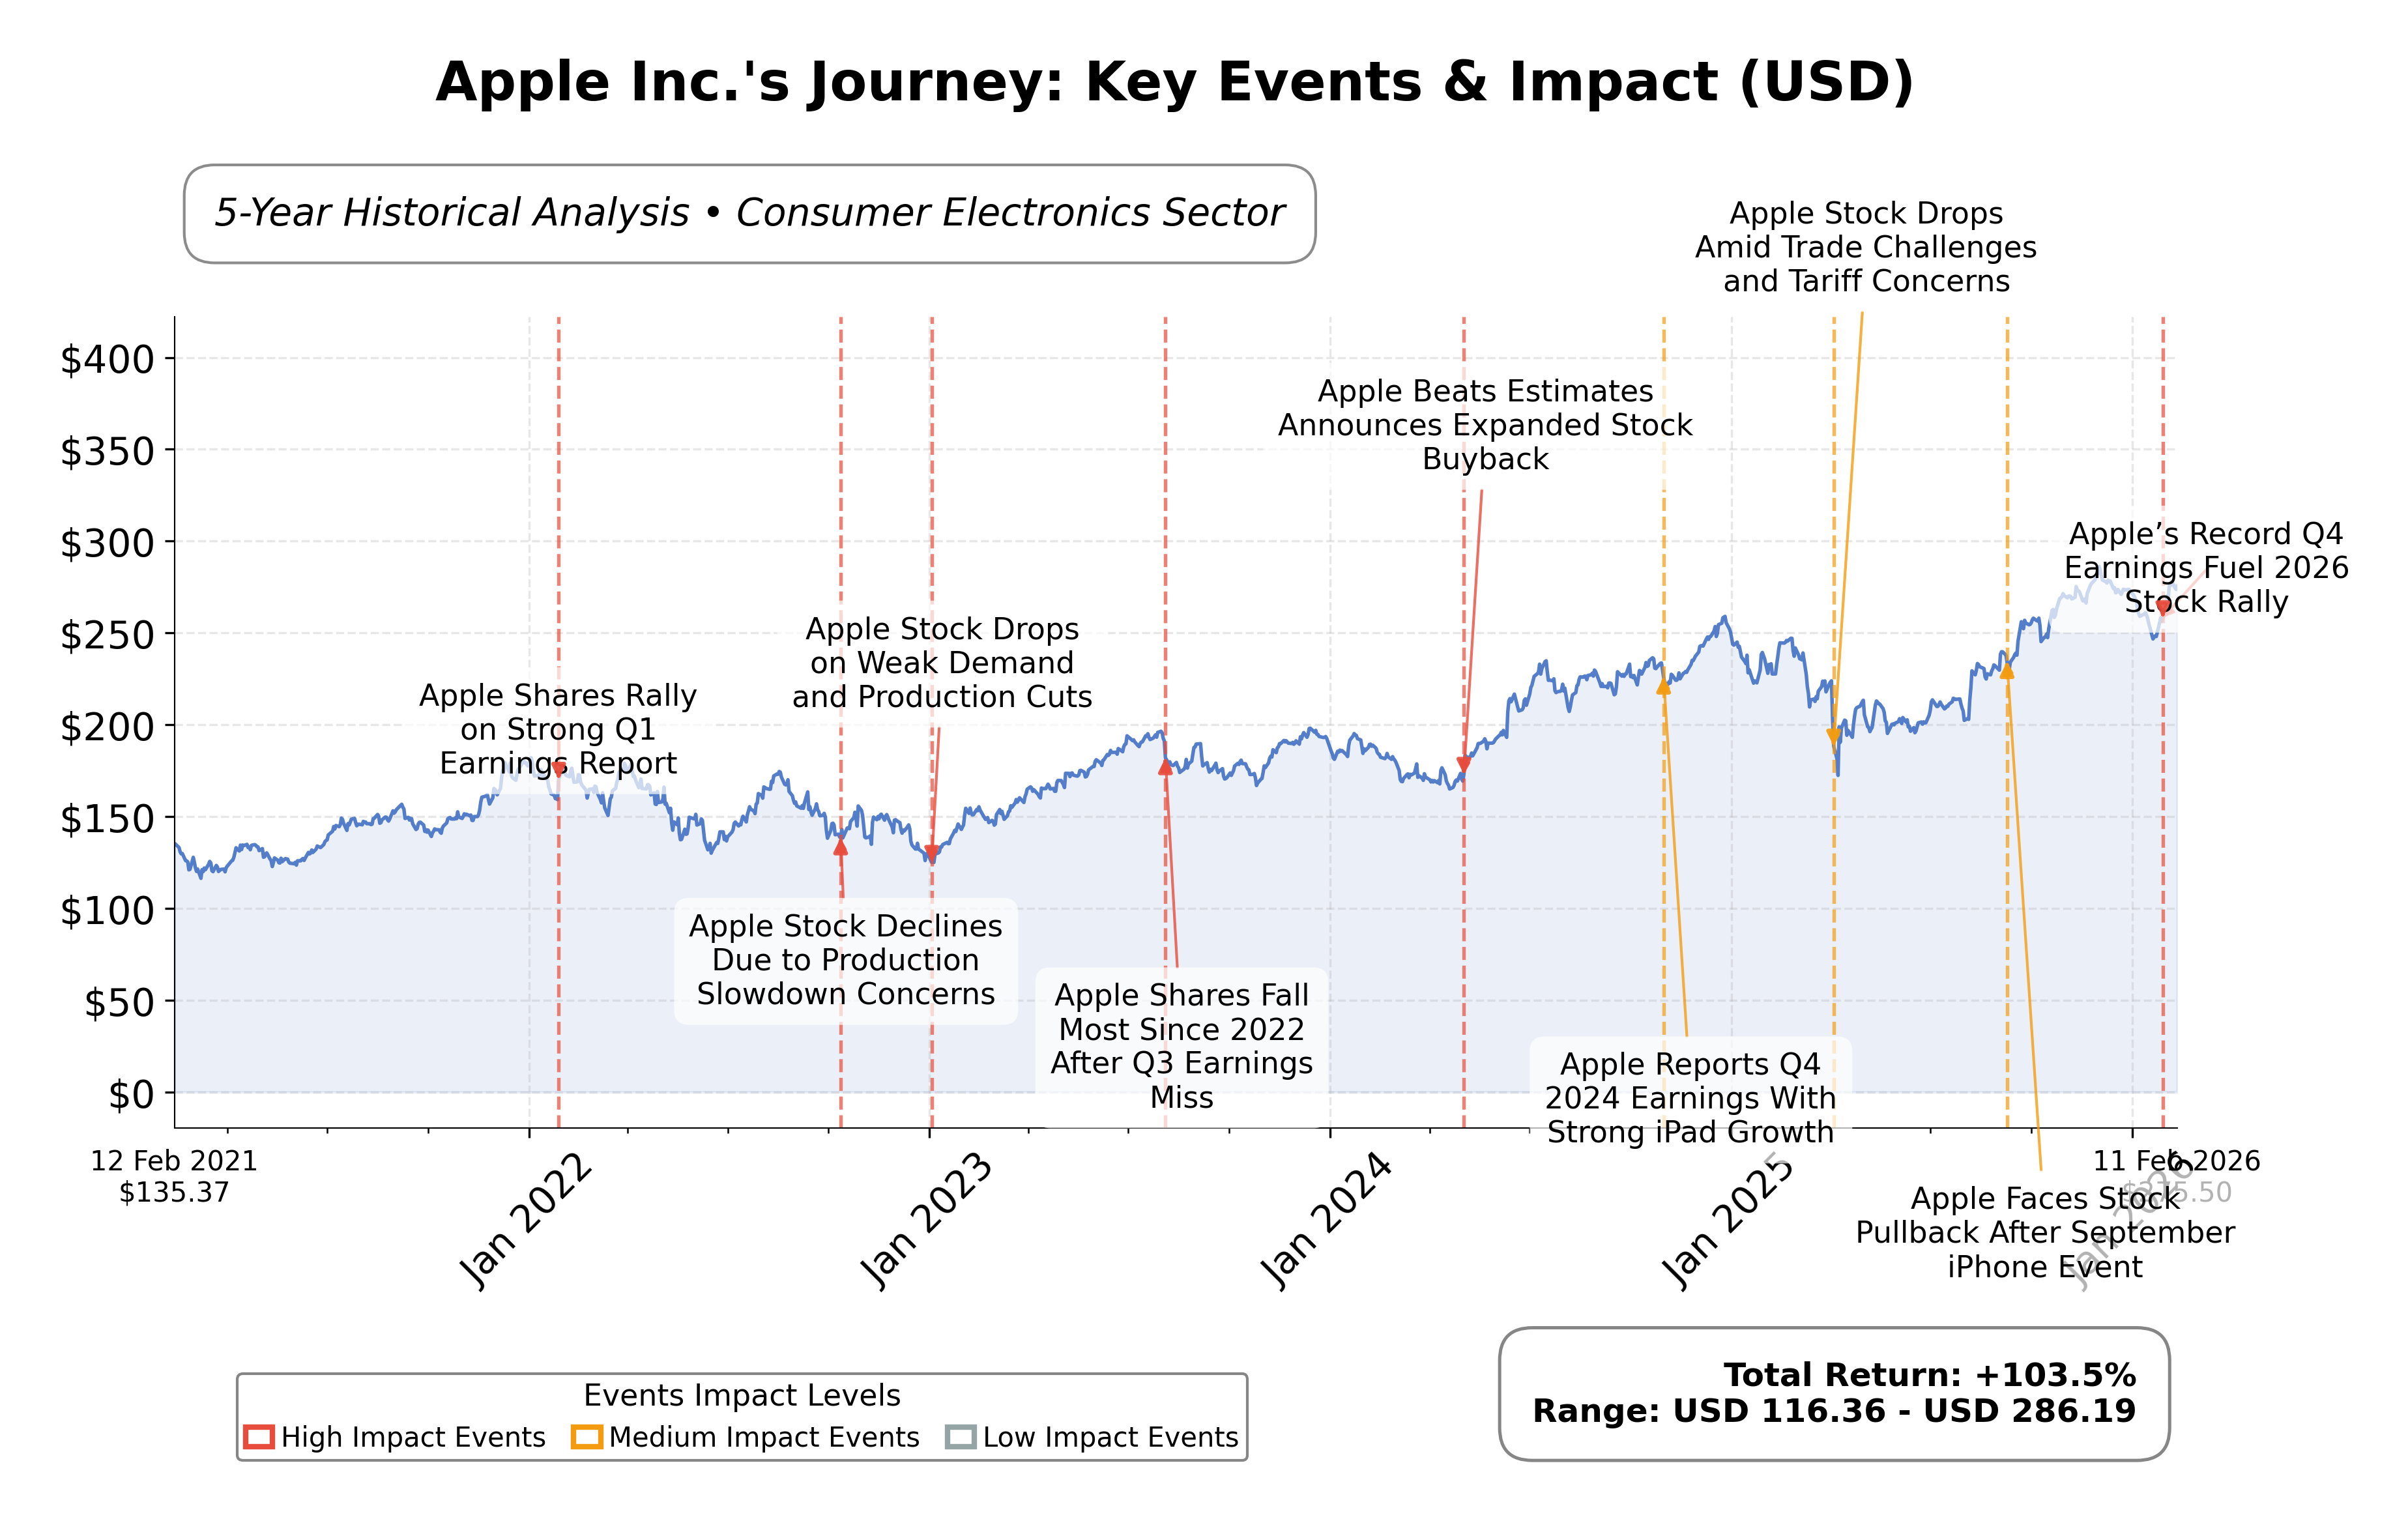
Stock Journey
Key Positives and Key Risks
Pros
- Strong revenue growth of 15.7% quarterly and earnings growth of 15.9% year-over-year indicate robust financial momentum.
- Substantial cash reserves of approximately $66.9 billion and free cash flow exceeding $106 billion support financial flexibility.
- High institutional ownership at nearly 65% reflects confidence from major investment entities.
Cons
- Premium valuation multiples with a trailing P/E of 34.97 and price-to-book ratio of 46.00 may limit upside potential.
- Regulatory scrutiny by the U.S. Federal Trade Commission introduces operational and reputational risks.
- Delays in AI Siri feature rollouts could impact innovation perception and competitive positioning.
Disclosure: This information is for general awareness and does not constitute investment advice
Report Summary
Apple Inc. is a leading technology company operating in the Consumer Electronics industry, specializing in hardware, software, and digital services. Headquartered in Cupertino, California, Apple designs and markets products such as iPhone, Mac, iPad, and wearables, alongside services like the App Store and Apple Music. The company holds a prominent market position globally, serving a diverse customer base through multiple channels.
Financially, Apple demonstrates robust performance with a trailing twelve-month revenue of approximately $435.6 billion and a net income of $117.8 billion. Key valuation metrics include a trailing P/E ratio of 34.97, forward P/E of 29.74, and a price-to-book ratio of 46.00, reflecting premium market valuation. The company maintains strong profitability with a gross margin near 48.16% and operating margin of 35.37%, supported by substantial operating cash flow and free cash flow exceeding $135 billion and $106 billion respectively.
Technically, Appleâs stock price is currently positioned above its 50-day and 200-day moving averages, indicating a sustained upward trend. Recent strategic initiatives include enhancements in AI integration and service offerings, although some delays in AI Siri features have been reported. Leadership remains stable, with ongoing institutional accumulation suggesting confidence, balanced by regulatory scrutiny and competitive risks inherent to the technology sector.
In peer comparison within the Consumer Electronics industry in the United States, Appleâs market capitalization of over $4 trillion significantly exceeds peers such as Sony Group Corporation, which has a market cap of approximately $132.7 billion. Appleâs valuation multiples, including P/E and EV/EBITDA ratios, are notably higher, reflecting its dominant market position and growth expectations relative to regional competitors.
Apple navigates a complex industry landscape marked by rapid innovation, regulatory challenges, and evolving consumer preferences. Recent achievements in revenue growth and service expansion underscore its market leadership, while delays in AI product features and FTC scrutiny present ongoing challenges. The company stands at a pivotal moment where execution of current strategies will influence its competitive standing and financial outcomes. Given the data, a balanced perspective that monitors developments and market conditions may be appropriate for those assessing the stock.
Company and Industry Overview
Company Basics
Price Performance
Company Size
Shareholding Pattern
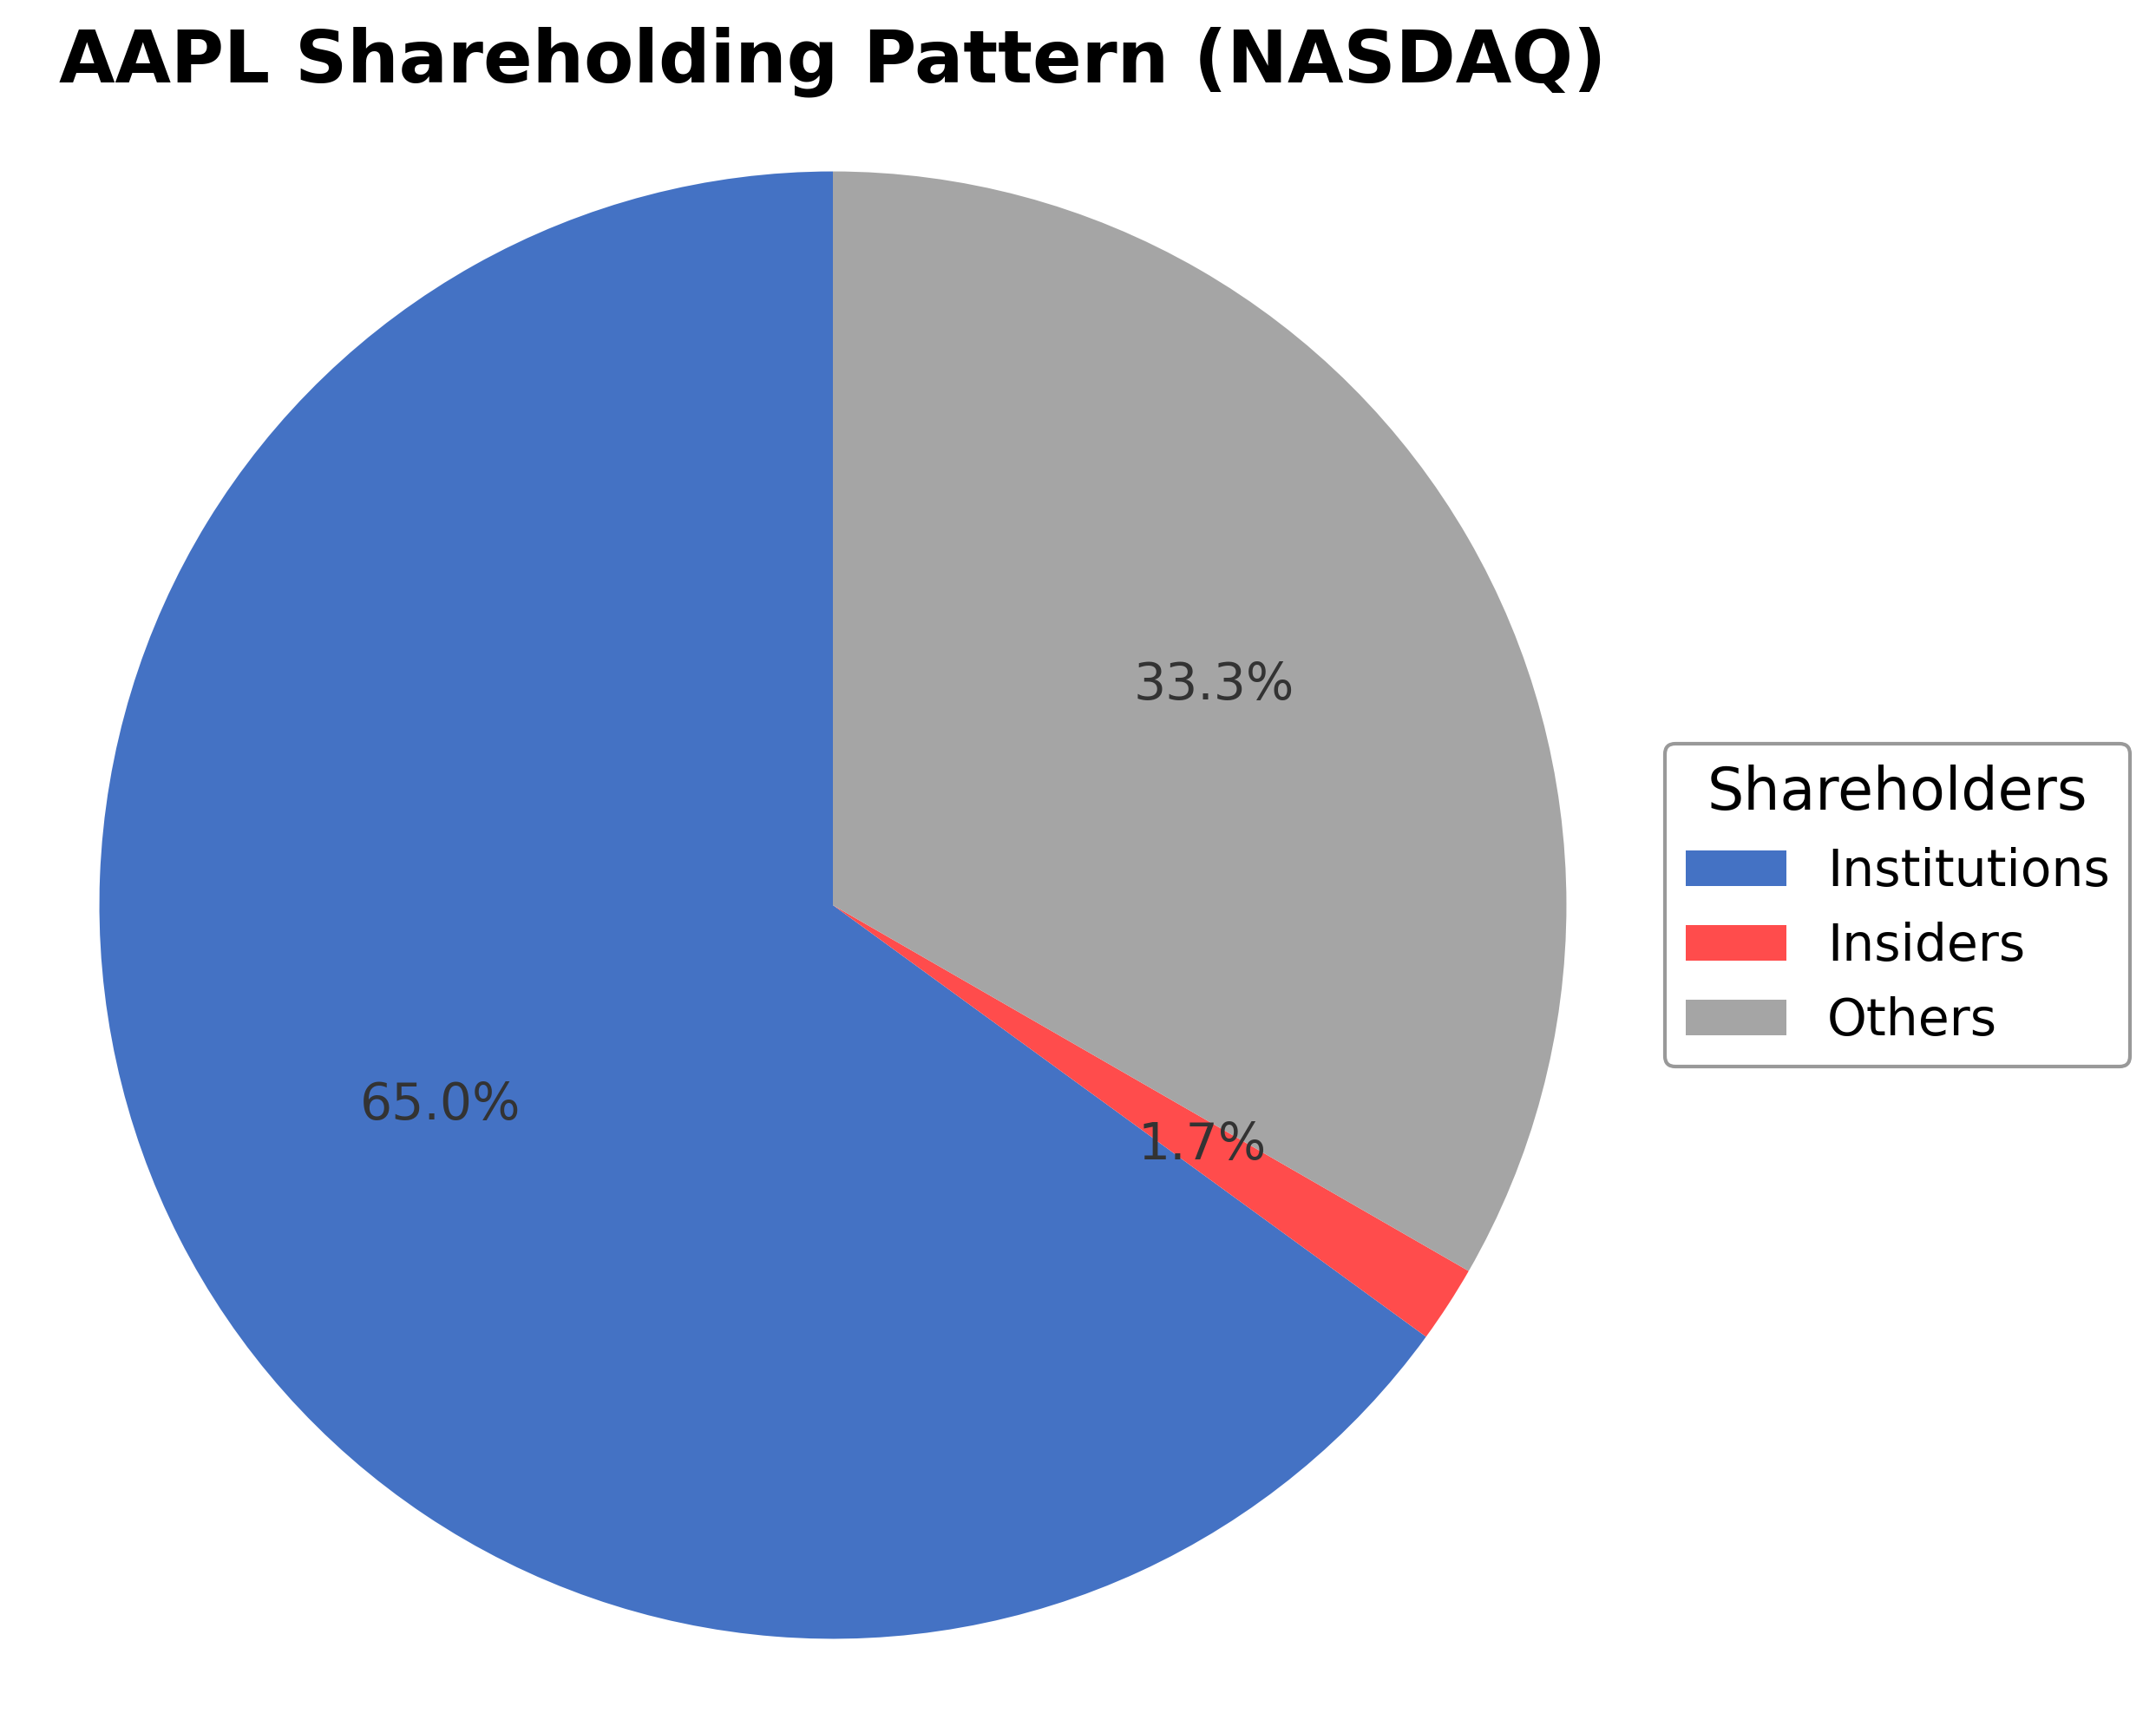
Apple Inc.'s ownership structure is characterized by a significant institutional investor presence at 64.99%, reflecting strong engagement from mutual funds, pension funds, and asset managers. Insider holdings, including executives and board members, represent approximately 1.70%, while public and other shareholders account for about 34.48%. Recent filings indicate increased institutional accumulation by entities such as Rather & Kittrell Inc. and Howland Capital Management LLC, contrasted by reductions from Kuhn & Co Investment Counsel and Csenge Advisory Group. These shareholding trends suggest a generally positive market sentiment with active portfolio adjustments. The substantial institutional ownership supports governance stability and strategic continuity, while the diverse shareholder base underpins broad market participation. This ownership profile may influence future corporate actions and strategic decisions within the competitive Consumer Electronics industry.
Sector and Industry Analysis
Apple Inc. (AAPL) operates primarily within the Information Technology sector, specifically in the consumer electronics and software industry. This sector is characterized by rapid innovation, significant capital investment, and a global market size that is measured in trillions of dollars. The growth trajectory remains robust, driven by continuous advancements in hardware capabilities, software ecosystems, and expanding digital services. Key players alongside Apple include Samsung, Microsoft, Google (Alphabet), and Amazon, each competing across overlapping product and service categories such as smartphones, personal computing, cloud services, and digital content distribution. The sector’s growth is underpinned by increasing consumer and enterprise demand for connected devices, cloud computing, and integrated software platforms.
Within the consumer electronics and software industry, several trends are shaping the competitive landscape. Technology shifts such as the integration of artificial intelligence, augmented reality (AR), and custom silicon chips (e.g., Apple’s in-house designed processors) are redefining product capabilities and user experiences. Consumer behavior is evolving with a preference for seamless ecosystems, privacy-centric features, and subscription-based services, which Apple leverages through its tightly integrated hardware-software model and expanding services portfolio (streaming, cloud storage, and app subscriptions). Emerging opportunities include AR/VR applications, health and wellness technologies embedded in wearables, and expansion into automotive and smart home sectors, all of which align with Apple’s strategic investments and product roadmap.
The regulatory environment for Apple and its peers is increasingly complex, encompassing data privacy laws (e.g., GDPR in Europe, CCPA in California), antitrust scrutiny, and trade policies affecting global supply chains. Compliance with these regulations requires significant operational adjustments, particularly in data handling, user consent, and transparency. Additionally, intellectual property rights and standards compliance remain critical due to the sector’s innovation intensity. Policy impacts also extend to tariffs and export controls, especially given reliance on international manufacturing partners like Foxconn and TSMC. Regulatory pressures may influence product design, market access, and competitive practices, necessitating proactive governance and legal strategies.
Competitive dynamics in this sector are defined by high barriers to entry, including substantial R&D expenditure, brand equity, and established distribution networks. Apple’s competitive positioning benefits from its vertically integrated model, strong brand loyalty, and ecosystem lock-in, which create switching costs for consumers. The market structure is oligopolistic with a few dominant firms controlling significant market share, yet innovation cycles and consumer preferences can rapidly shift competitive advantages. New entrants face challenges in scale, technology development, and regulatory compliance, while incumbents continuously invest in innovation and strategic partnerships to sustain market leadership. Overall, the sector demands agility, deep technological expertise, and robust intellectual property portfolios to maintain competitive differentiation.
Note: Analysis synthesized from industry research, market reports, and regulatory filings. Information is subject to change based on market conditions.
Illustrative Scenario Analysis
DCF Assumptions:
Method: Two-Stage EPS-Priority Model
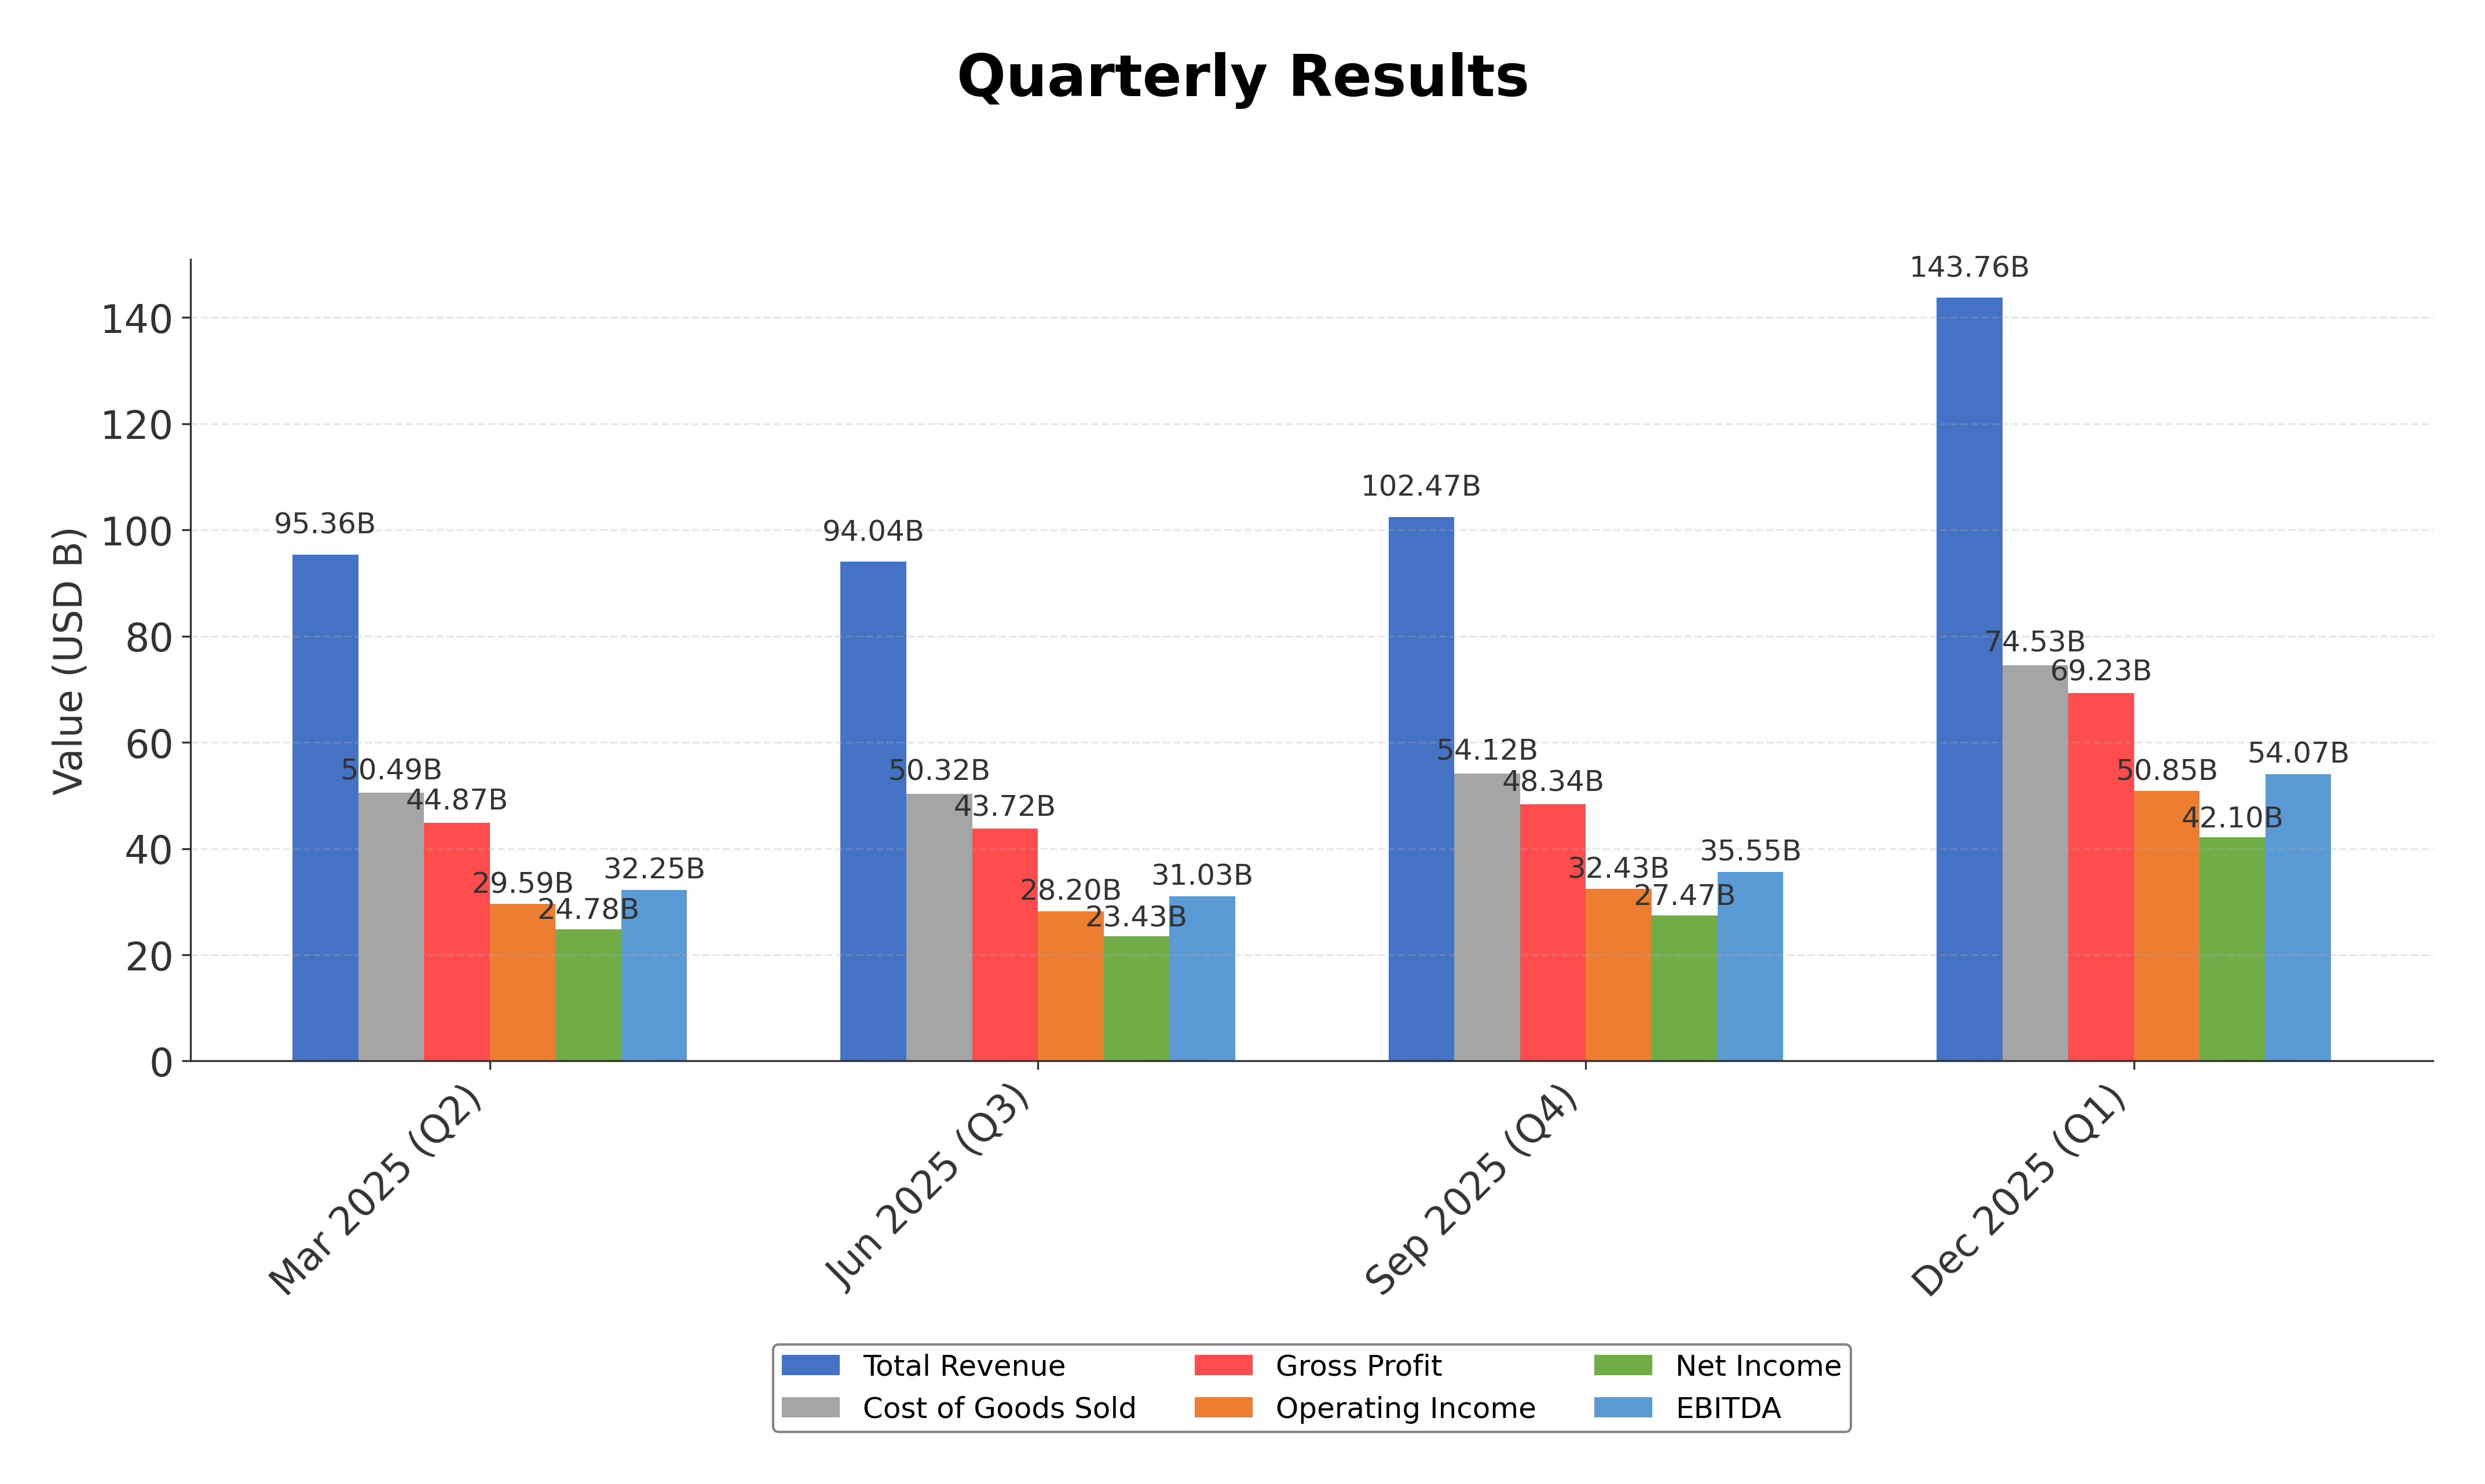
Financials
Peer Analysis
| Company Name | Market Cap | P/E Ratio | P/B Ratio | EV/EBITDA | Price to CFO |
|---|---|---|---|---|---|
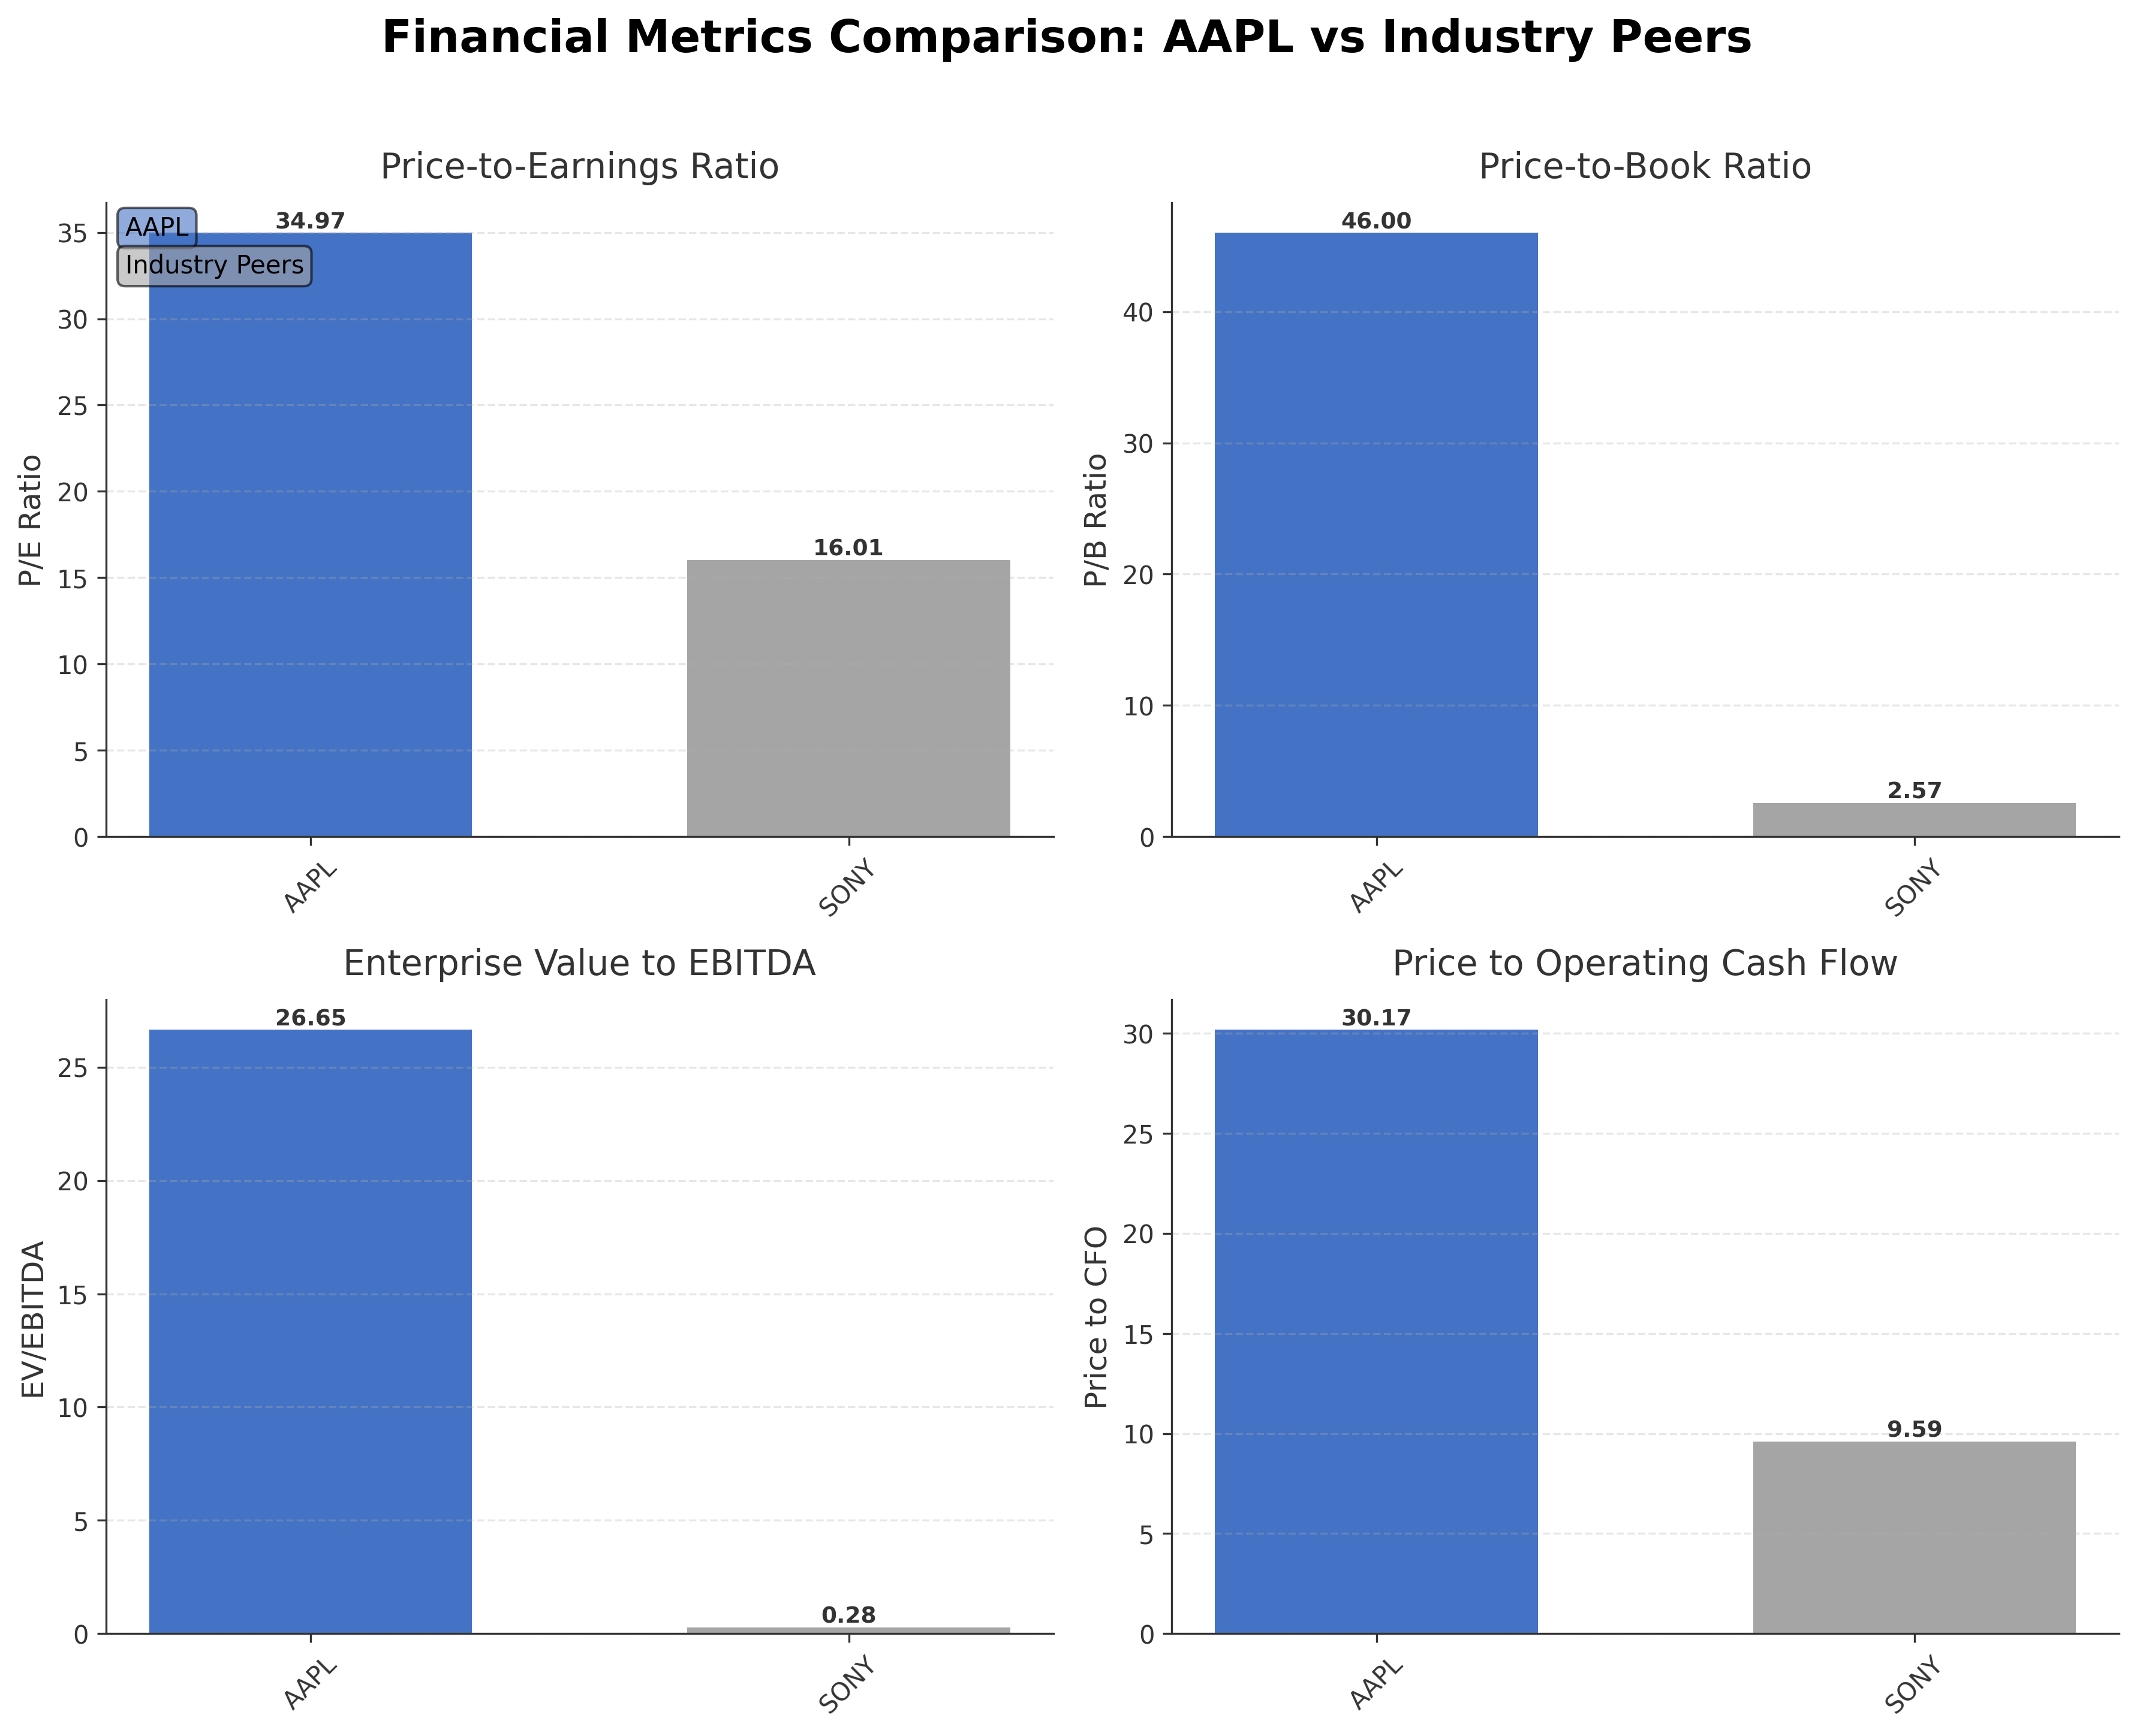
| Apple Inc. | $4.09T | 34.97 | 46.00 | 26.65 | 30.17 |
| Sony Group Corporation - Sponsored American Depositary Receipt | $132.74B | 16.01 | 2.57 | 0.28 | 9.59 |
Comparison Analysis: Apple Inc. significantly outpaces its regional peer Sony Group Corporation in market capitalization, reflecting its dominant industry position. Apple's valuation multiples, including P/E and price-to-book ratios, are substantially higher, indicating market expectations of sustained growth and profitability. The EV/EBITDA and price-to-CFO ratios further highlight Apple's premium valuation relative to Sony, which trades at more conservative multiples. This disparity underscores Apple's leadership in innovation and market influence within the Consumer Electronics sector.
Financial Metrics Comparison with Peers
Financial Statements
Comprehensive financial data including income, balance sheet, and cash flow metrics
Income Statement
| fiscal_date | 2025-09-30 | 2024-09-30 | 2023-09-30 | 2022-09-30 | 2021-09-30 |
|---|---|---|---|---|---|
| Sales | 416.16B | 391.04B | 383.29B | 394.33B | 365.82B |
| Cost Of Goods | 220.96B | 210.35B | 214.14B | 223.55B | 212.98B |
| Gross Profit | 195.20B | 180.68B | 169.15B | 170.78B | 152.84B |
| Operating Expense Research And Development | 34.55B | 31.37B | 29.91B | 26.25B | 21.91B |
| Operating Expense Selling General And Administrative | 27.60B | 26.10B | 24.93B | 25.09B | 21.97B |
| Operating Income | 133.05B | 123.22B | 114.30B | 119.44B | 108.95B |
| Other Income Expense | -321.00M | 269.00M | -565.00M | -334.00M | 60.00M |
| Pretax Income | 132.73B | 123.48B | 113.74B | 119.10B | 109.21B |
| Income Tax | 20.72B | 29.75B | 16.74B | 19.30B | 14.53B |
| Net Income | 112.01B | 93.74B | 97.00B | 99.80B | 94.68B |
| Eps Basic | 7.49 | 6.11 | 6.16 | 6.15 | 5.67 |
| Eps Diluted | 7.46 | 6.08 | 6.13 | 6.11 | 5.61 |
| Basic Shares Outstanding | 14.95B | 15.34B | 15.74B | 16.22B | 16.70B |
| Diluted Shares Outstanding | 14.95B | 15.34B | 15.74B | 16.22B | 16.70B |
| Ebit | 133.05B | 123.22B | 114.30B | 119.44B | 111.85B |
| Ebitda | 144.75B | 134.66B | 125.82B | 130.54B | 123.14B |
| Net Income Continuous Operations | 112.01B | 93.74B | 97.00B | 99.80B | 94.68B |
| Non Operating Interest Income | N/A | N/A | 3.75B | 2.83B | 2.84B |
| Non Operating Interest Expense | N/A | N/A | 3.93B | 2.93B | 2.65B |
Source: Financial statements and regulatory filings
Balance Sheet
| fiscal_date | 2025-12-31 | 2025-09-30 | 2025-06-30 | 2025-03-31 | 2024-12-31 |
|---|---|---|---|---|---|
| Cash And Cash Equivalents | 45.32B | 35.93B | 36.27B | 28.16B | 30.30B |
| Accounts Receivable | 39.92B | 39.78B | 27.56B | 26.14B | 29.64B |
| Total Assets | 379.30B | 359.24B | 331.50B | 331.23B | 344.08B |
| Total Liabilities | 291.11B | 285.51B | 265.67B | 264.44B | 277.33B |
| Long Term Debt | 76.69B | 78.33B | 82.43B | 78.57B | 83.96B |
| Shareholders Equity | 88.19B | 73.73B | 65.83B | 66.80B | 66.76B |
Source: Financial statements and regulatory filings
Cash Flow Statement
| fiscal_date | 2025-09-30 | 2024-09-30 | 2023-09-30 | 2022-09-30 | 2021-09-30 |
|---|---|---|---|---|---|
| Operating Activities Net Income | 112.01B | 93.74B | 97.00B | 99.80B | 94.68B |
| Operating Activities Depreciation | 11.70B | 11.45B | 11.52B | 11.10B | 11.28B |
| Operating Activities Stock Based Compensation | 12.86B | 11.69B | 10.83B | 9.04B | 7.91B |
| Operating Activities Other Non Cash Items | -89.00M | -2.27B | -2.23B | 1.01B | -4.92B |
| Operating Activities Accounts Receivable | -7.03B | -5.14B | -417.00M | -9.34B | -14.03B |
| Operating Activities Accounts Payable | 902.00M | 6.02B | -1.89B | 9.45B | 12.33B |
| Operating Activities Other Assets Liabilities | -18.87B | 2.77B | -4.27B | 1.57B | -1.53B |
| Operating Activities Operating Cash Flow | 111.48B | 118.25B | 110.54B | 123.52B | 100.94B |
| Investing Activities Capital Expenditures | -12.71B | -9.45B | -10.96B | -10.71B | -11.09B |
| Investing Activities Purchase Of Investments | -24.41B | -48.66B | -29.51B | -76.92B | -109.56B |
| Investing Activities Sale Of Investments | 53.80B | 62.35B | 45.51B | 67.36B | 106.48B |
| Investing Activities Other Investing Activity | -1.48B | -1.31B | -1.34B | -2.09B | -385.00M |
| Investing Activities Investing Cash Flow | 15.20B | 2.94B | 3.71B | -22.66B | -14.58B |
| Financing Activities Long Term Debt Issuance | 4.48B | 0.00 | 5.23B | 5.46B | 20.39B |
| Financing Activities Long Term Debt Payments | -10.93B | -9.96B | -11.15B | -9.54B | -8.75B |
| Financing Activities Short Term Debt Issuance | -2.03B | 3.96B | -3.98B | 3.96B | 1.02B |
| Financing Activities Common Stock Repurchase | -90.71B | -94.95B | -77.55B | -89.40B | -85.97B |
| Financing Activities Common Dividends | -15.42B | -15.23B | -15.03B | -14.84B | -14.47B |
| Financing Activities Other Financing Charges | -6.07B | -5.80B | -6.01B | -6.38B | -5.58B |
| Financing Activities Financing Cash Flow | -120.69B | -121.98B | -108.49B | -110.75B | -92.25B |
| End Cash Position | 35.93B | 29.94B | 30.74B | 24.98B | 35.93B |
| Income Tax Paid | 43.37B | 26.10B | 18.68B | 19.57B | 25.39B |
| Free Cash Flow | 98.77B | 108.81B | 99.58B | 111.44B | 92.95B |
| Interest Paid | N/A | N/A | 3.80B | 2.87B | 2.69B |
| Operating Activities Deferred Taxes | N/A | N/A | N/A | 895.00M | -4.77B |
| Investing Activities Net Acquisitions | N/A | N/A | N/A | -306.00M | -33.00M |
| Financing Activities Common Stock Issuance | N/A | N/A | N/A | N/A | 1.10B |
Source: Financial statements and regulatory filings
Technical Analysis
Key Insights
- The current trend direction for Apple Inc. is upward, with price action maintaining above key moving averages, indicating bullish momentum.
- Key support levels are observed near $237.76 (200-day moving average) and $268.57 (50-day moving average), while resistance is near the 52-week high of $288.62.
- The stock price currently trades above the 10-day, 50-day, and 200-day moving averages, suggesting sustained strength across short, medium, and long-term timeframes.
- Momentum indicators show a moderately strong RSI, positive MACD crossover, and stochastic readings consistent with continued upward momentum without overbought extremes.
- Multi-timeframe analysis reveals consistent bullish signals on daily, weekly, and monthly charts, supporting a stable upward trend.
- Potential market scenarios include continuation of the upward trend if support levels hold, with possible consolidation near resistance zones before further advances.
Trending News
1. Headline: AAPL: Apple Inc Latest Stock Price, Analysis, News and Trading Ideas
Summary: Real-time updates on Apple Inc's stock price, financials, and market insights are available, attracting over 10 million users tracking the company's market activity on Stocktwits.
Sentiment: Neutral
2. Headline: Rather & Kittrell Inc. Grows Stock Holdings in Apple Inc. $AAPL
Summary: Rather & Kittrell Inc. increased its holdings in Apple Inc. by 22.7% during the third quarter, reflecting institutional confidence as disclosed in recent SEC filings.
Sentiment: Positive
3. Headline: Apple Inc. $AAPL Shares Acquired by Howland Capital Management LLC
Summary: Howland Capital Management LLC increased its Apple Inc. stock holdings by 5.8% in the third quarter, signaling continued institutional interest as per SEC disclosures.
Sentiment: Positive
4. Headline: Apple Stock: Bernstein Downplays Memory Costs, Ups Price Target | AAPL - TheStreet
Summary: Analyst Mark Newman adjusts Apple's price target, noting that while rising memory costs may pressure iPhone pricing, Apple's ecosystem and execution provide resilience against inflationary impacts.
Sentiment: Positive
5. Headline: Apple stock takes a hit on report it’s pushing back AI Siri features — again - Sherwood News
Summary: Reports indicate Apple is delaying AI Siri feature upgrades initially planned for a March update, potentially impacting customer expectations and product rollout timelines.
Sentiment: Negative
Recent Updates
News Summary
Recent news highlights regulatory scrutiny by the U.S. Federal Trade Commission concerning Apple News content bias and delays in the rollout of AI-enhanced Siri features. These developments have contributed to volatility in Apple's stock performance, including its worst trading day since April 2025. Despite these challenges, some institutional investors have increased their holdings, reflecting mixed market sentiment. The regulatory concerns and product delays contrast with ongoing strategic efforts to enhance Apple's AI capabilities and service offerings, underscoring a dynamic environment. The interplay between regulatory pressures and innovation initiatives is shaping Apple's near-term operational landscape.
News Sentiment
Sentiment analysis reveals a balanced mix of neutral, positive, and negative tones across sources. Regulatory issues and product delays contribute to negative sentiment, while institutional buying and strategic AI partnerships provide positive counterpoints. Overall, the sentiment landscape suggests cautious optimism tempered by operational and regulatory risks.
Analytical Overview
Analysis Summary
Valuation Metrics: Apple's P/E ratio of 34.97 and forward P/E of 29.74 are above the industry average of 34.97, indicating a premium valuation consistent with its market leadership and growth prospects.
Growth Trajectory: The company exhibits strong growth with quarterly revenue growth of 15.7% and quarterly earnings growth of 15.9%, supported by robust operating and free cash flow generation.
Financial Health: Apple maintains a manageable debt-to-equity ratio of approximately 0.95 and substantial cash reserves exceeding $66.9 billion, reflecting solid financial health and liquidity.
Sector Specific Factors: The Consumer Electronics sector faces challenges including supply chain constraints and regulatory scrutiny, while opportunities arise from expanding digital services and AI integration.
Market Positioning: Apple's dominant market position, diverse product portfolio, and expanding services ecosystem provide competitive advantages in a rapidly evolving technology landscape.
Investment Conclusion
Supporting Factors: Strong revenue and earnings growth with expanding service revenues.
Risk Factors: Regulatory scrutiny from the U.S. Federal Trade Commission.
SWOT Analysis
Strengths
- Market leader with a diversified product and services portfolio.
- Strong brand recognition and loyal customer base.
- Robust financial position with high cash reserves and cash flow.
- Significant institutional ownership supporting governance stability.
Weaknesses
- High valuation multiples relative to industry peers.
- Dependence on iPhone sales for a substantial portion of revenue.
- Current delays in AI feature deployment impacting innovation perception.
- Relatively low current ratio indicating tight short-term liquidity.
Opportunities
- Expansion of digital services and subscription offerings.
- Integration of advanced AI technologies to enhance product ecosystem.
- Growth potential in emerging markets and new product categories.
- Strategic partnerships leveraging external AI platforms.
Threats
- Regulatory scrutiny and potential legal challenges in key markets.
- Intense competition in technology hardware and services sectors.
- Supply chain disruptions affecting product availability.
- Market volatility influenced by macroeconomic and geopolitical factors.
Company Description
Apple Inc. is a leading technology company specializing in hardware, software, and services. Founded in 1976 and headquartered at One Apple Park Way in Cupertino, California, it designs, manufactures, and markets innovative products including the iPhone smartphones, Mac computers, iPad tablets, and wearables such as AirPods and Apple Watch. Apple Inc. also provides digital services like the App Store, Apple Music, iCloud, and subscription offerings including Apple Fitness+ and Apple TV+. Operating in the **Technology Hardware, Storage and Peripherals** industry within the broader Tech sector, the company serves consumers, businesses, and governments worldwide through online platforms, retail stores, and carrier partnerships. With approximately 164,000 employees and a substantial market presence evidenced by shares outstanding of 15.02 billion, Apple Inc. maintains strong financials, including trailing twelve-month revenue of $400.37 billion and high gross margins around 46.91%. Its global stock listings and enduring influence underscore its pivotal role in driving technological advancement and consumer electronics markets.