
Apple Inc (AAPL)
Stock Analysis Report
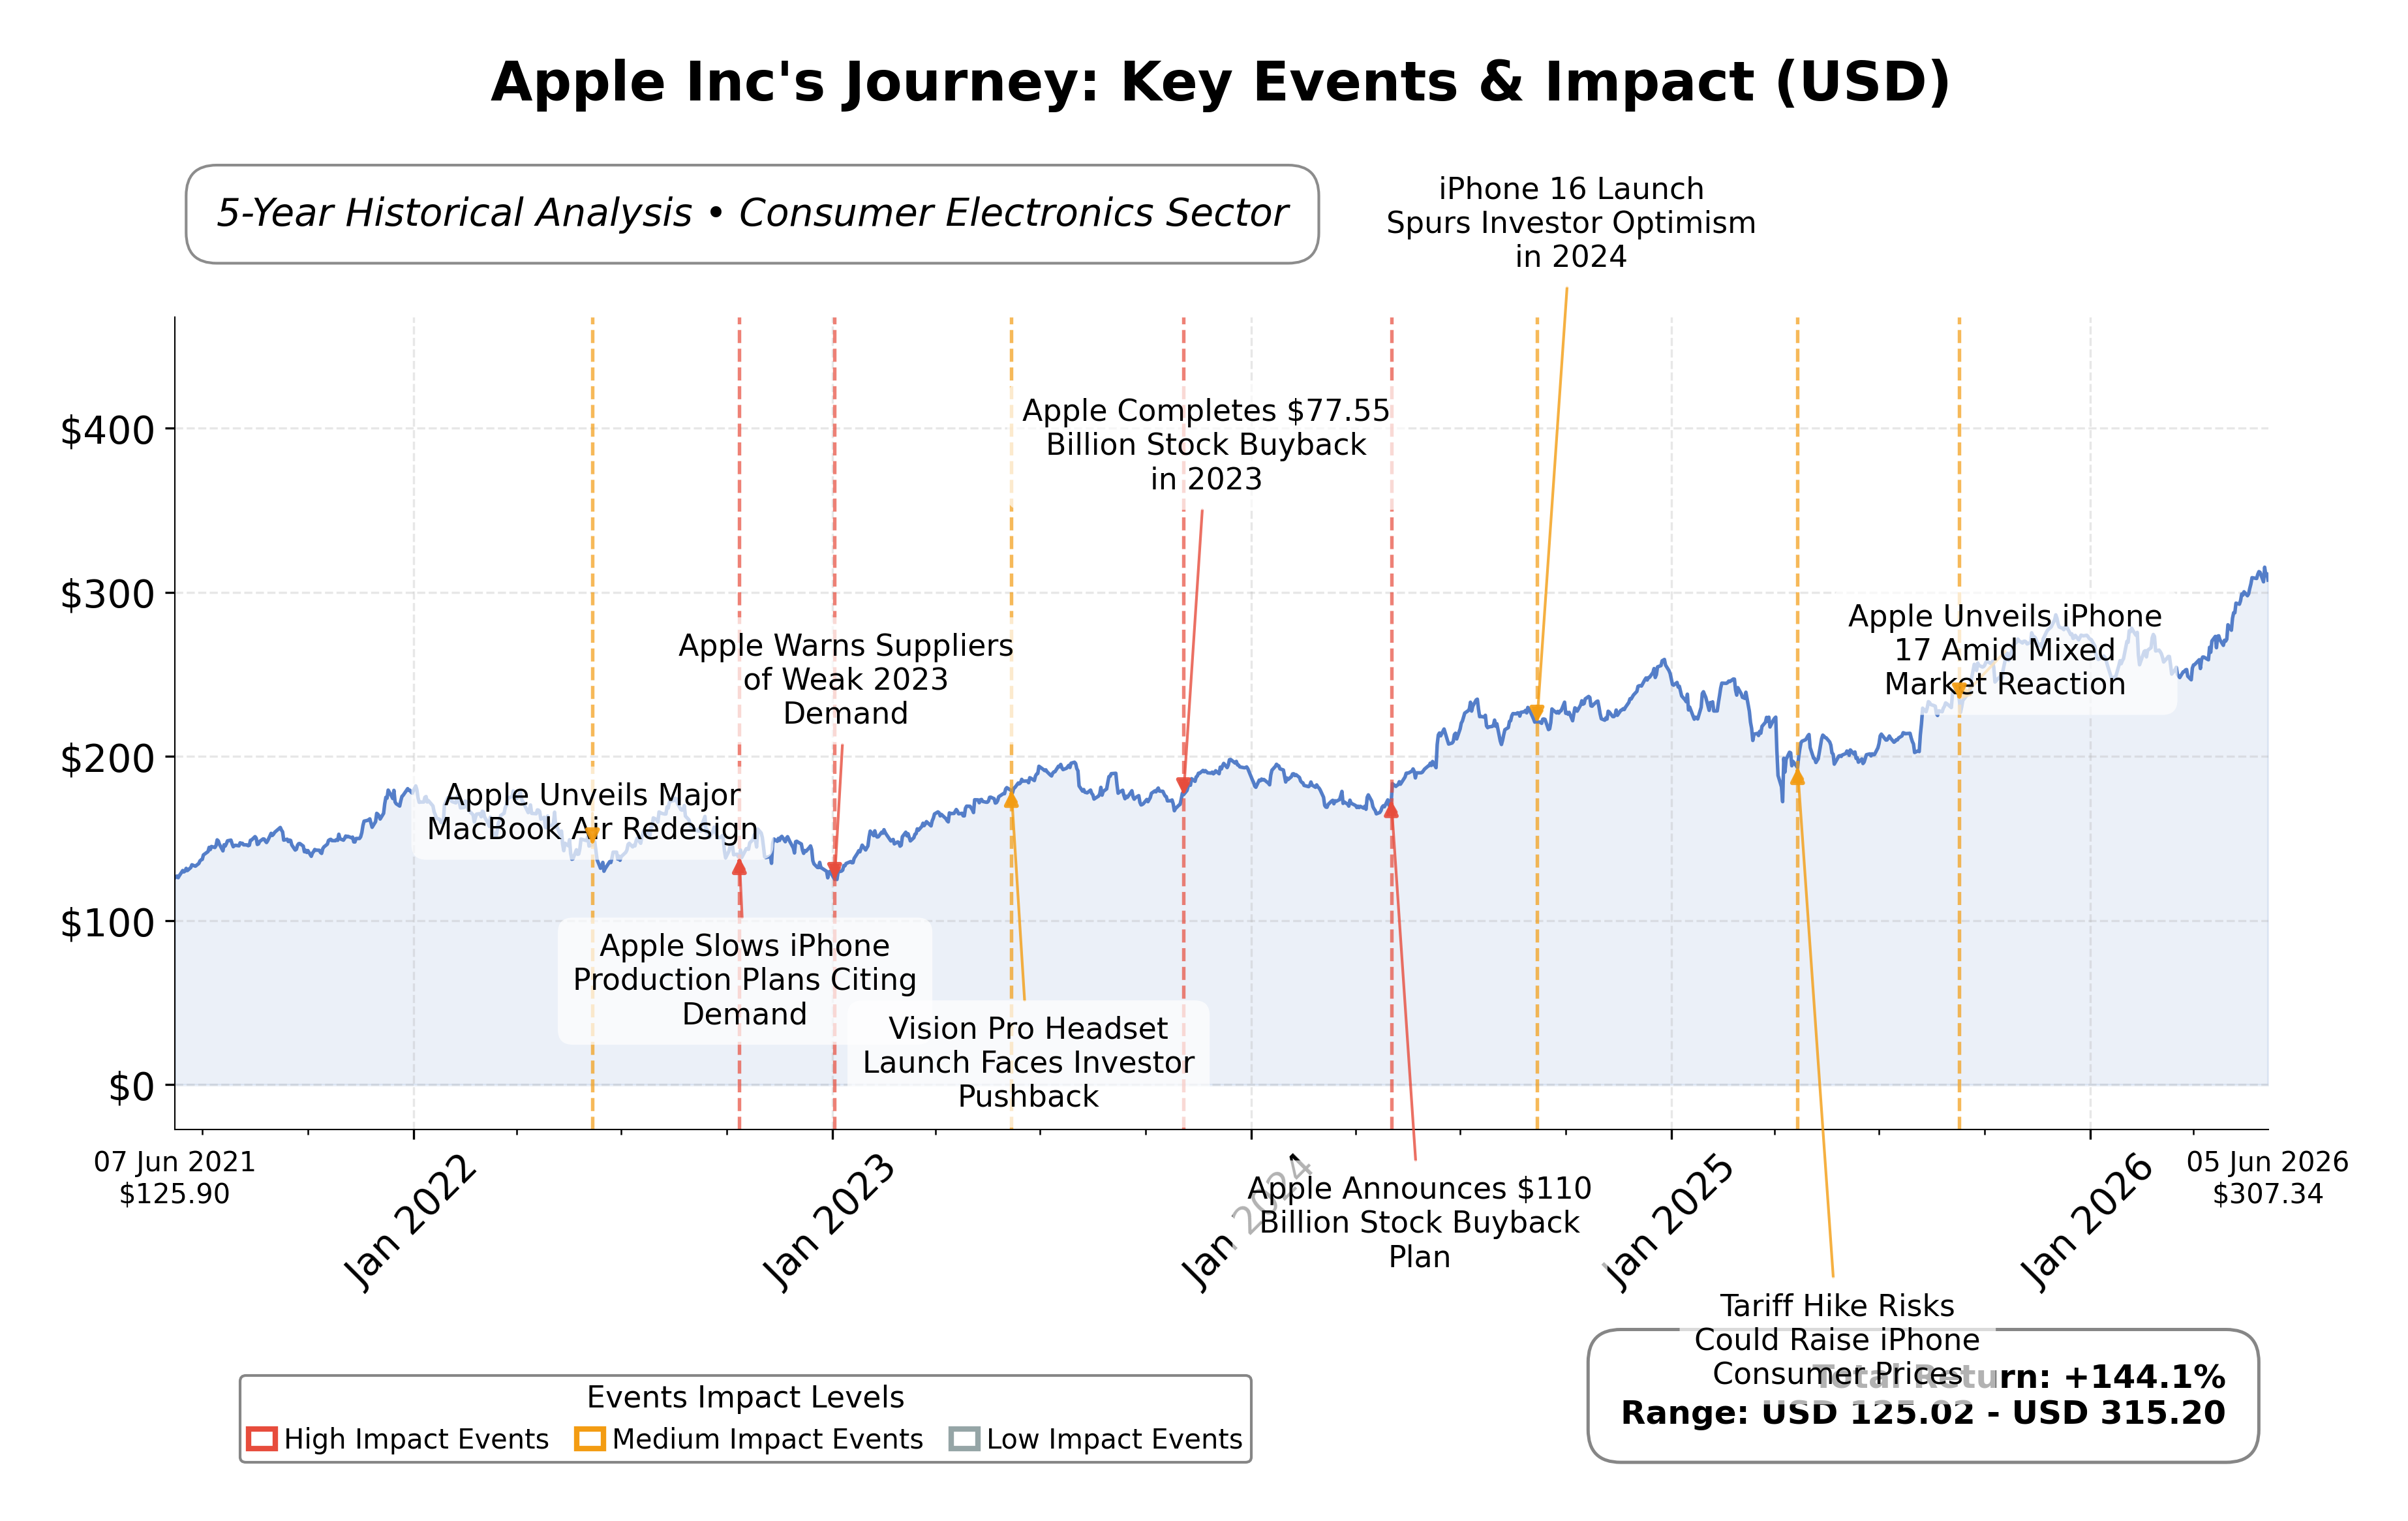
Stock Journey
Key Positives and Key Risks
Pros
- Revenue growth of 16.6% year-over-year demonstrates strong demand and expansion.
- Free cash flow of $101.1 billion supports capital returns and strategic investments.
- Return on equity at 141.5% indicates exceptional capital efficiency.
Cons
- High trailing P/E ratio of 37.58 reflects elevated valuation and market expectations.
- Debt-to-equity ratio of 79.5% indicates moderate leverage that requires monitoring.
- Regulatory risks in key markets such as India could impact future operations.
Disclosure: This information is for general awareness and does not constitute investment advice
Report Summary
Apple Inc. is a leading global technology company listed on the NASDAQ exchange under the symbol AAPL, operating primarily in the Consumer Electronics sector within the Technology industry. The company designs, manufactures, and markets a broad range of products including the iPhone, Mac computers, iPad tablets, wearables such as Apple Watch and AirPods, and various services like the App Store and Apple Music. Apple’s integrated hardware, software, and services ecosystem positions it as a dominant player in mobile communication, personal computing, entertainment, and health monitoring markets worldwide.
Financially, Apple reported trailing twelve months (TTM) revenue of approximately $451.4 billion with a gross margin of 49.3%, an operating margin of 32.3%, and a net profit margin of 27.2%, indicating robust profitability and operational efficiency. The company’s return on equity (ROE) stands at 141.5% and return on assets (ROA) at 26.2%, reflecting strong capital utilization and asset productivity. Operating cash flow for the TTM period was $140.2 billion, with free cash flow of $101.1 billion, underscoring solid cash generation capabilities.
From a valuation perspective, Apple’s market capitalization is approximately $4.58 trillion, with a trailing P/E ratio of 37.58 and a forward P/E of 32.35, suggesting a premium valuation relative to earnings expectations. The price-to-book ratio is notably high at 42.81, and the enterprise value to EBITDA ratio is 28.64, indicating the market prices Apple at a significant premium to book value and operating earnings. The stock price currently trades near $307.39, within a 52-week range of $195.07 to $315, reflecting a 35.4% increase over the past year.
Apple’s key strengths include its massive cash reserves of $68.5 billion, moderate debt levels with a total debt-to-equity ratio of 79.5%, and leadership in innovation and market share across multiple product categories. Risks include regulatory scrutiny, particularly in India where Apple has agreed to disclose financial data amid antitrust investigations, competitive pressures in technology and services, and macroeconomic factors affecting supply chains and consumer demand. Recent strategic moves include new product launches such as the iPhone 17 series and MacBook Neo, a $100 billion share repurchase authorization, and a leadership transition with Tim Cook moving to Executive Chairman and John Ternus assuming the CEO role.
Technically, Apple’s stock is trading above its 50-day and 200-day moving averages, indicating a sustained upward trend, with momentum indicators reflecting positive sentiment across daily and weekly timeframes. Market participants are closely watching upcoming events like the Worldwide Developers Conference (WWDC) for catalysts related to artificial intelligence integration. Overall, the data suggests a market environment that favors continued interest and accumulation, balanced by vigilance around regulatory developments and valuation levels.
Company and Industry Overview
Company Basics
Price Performance
Company Size
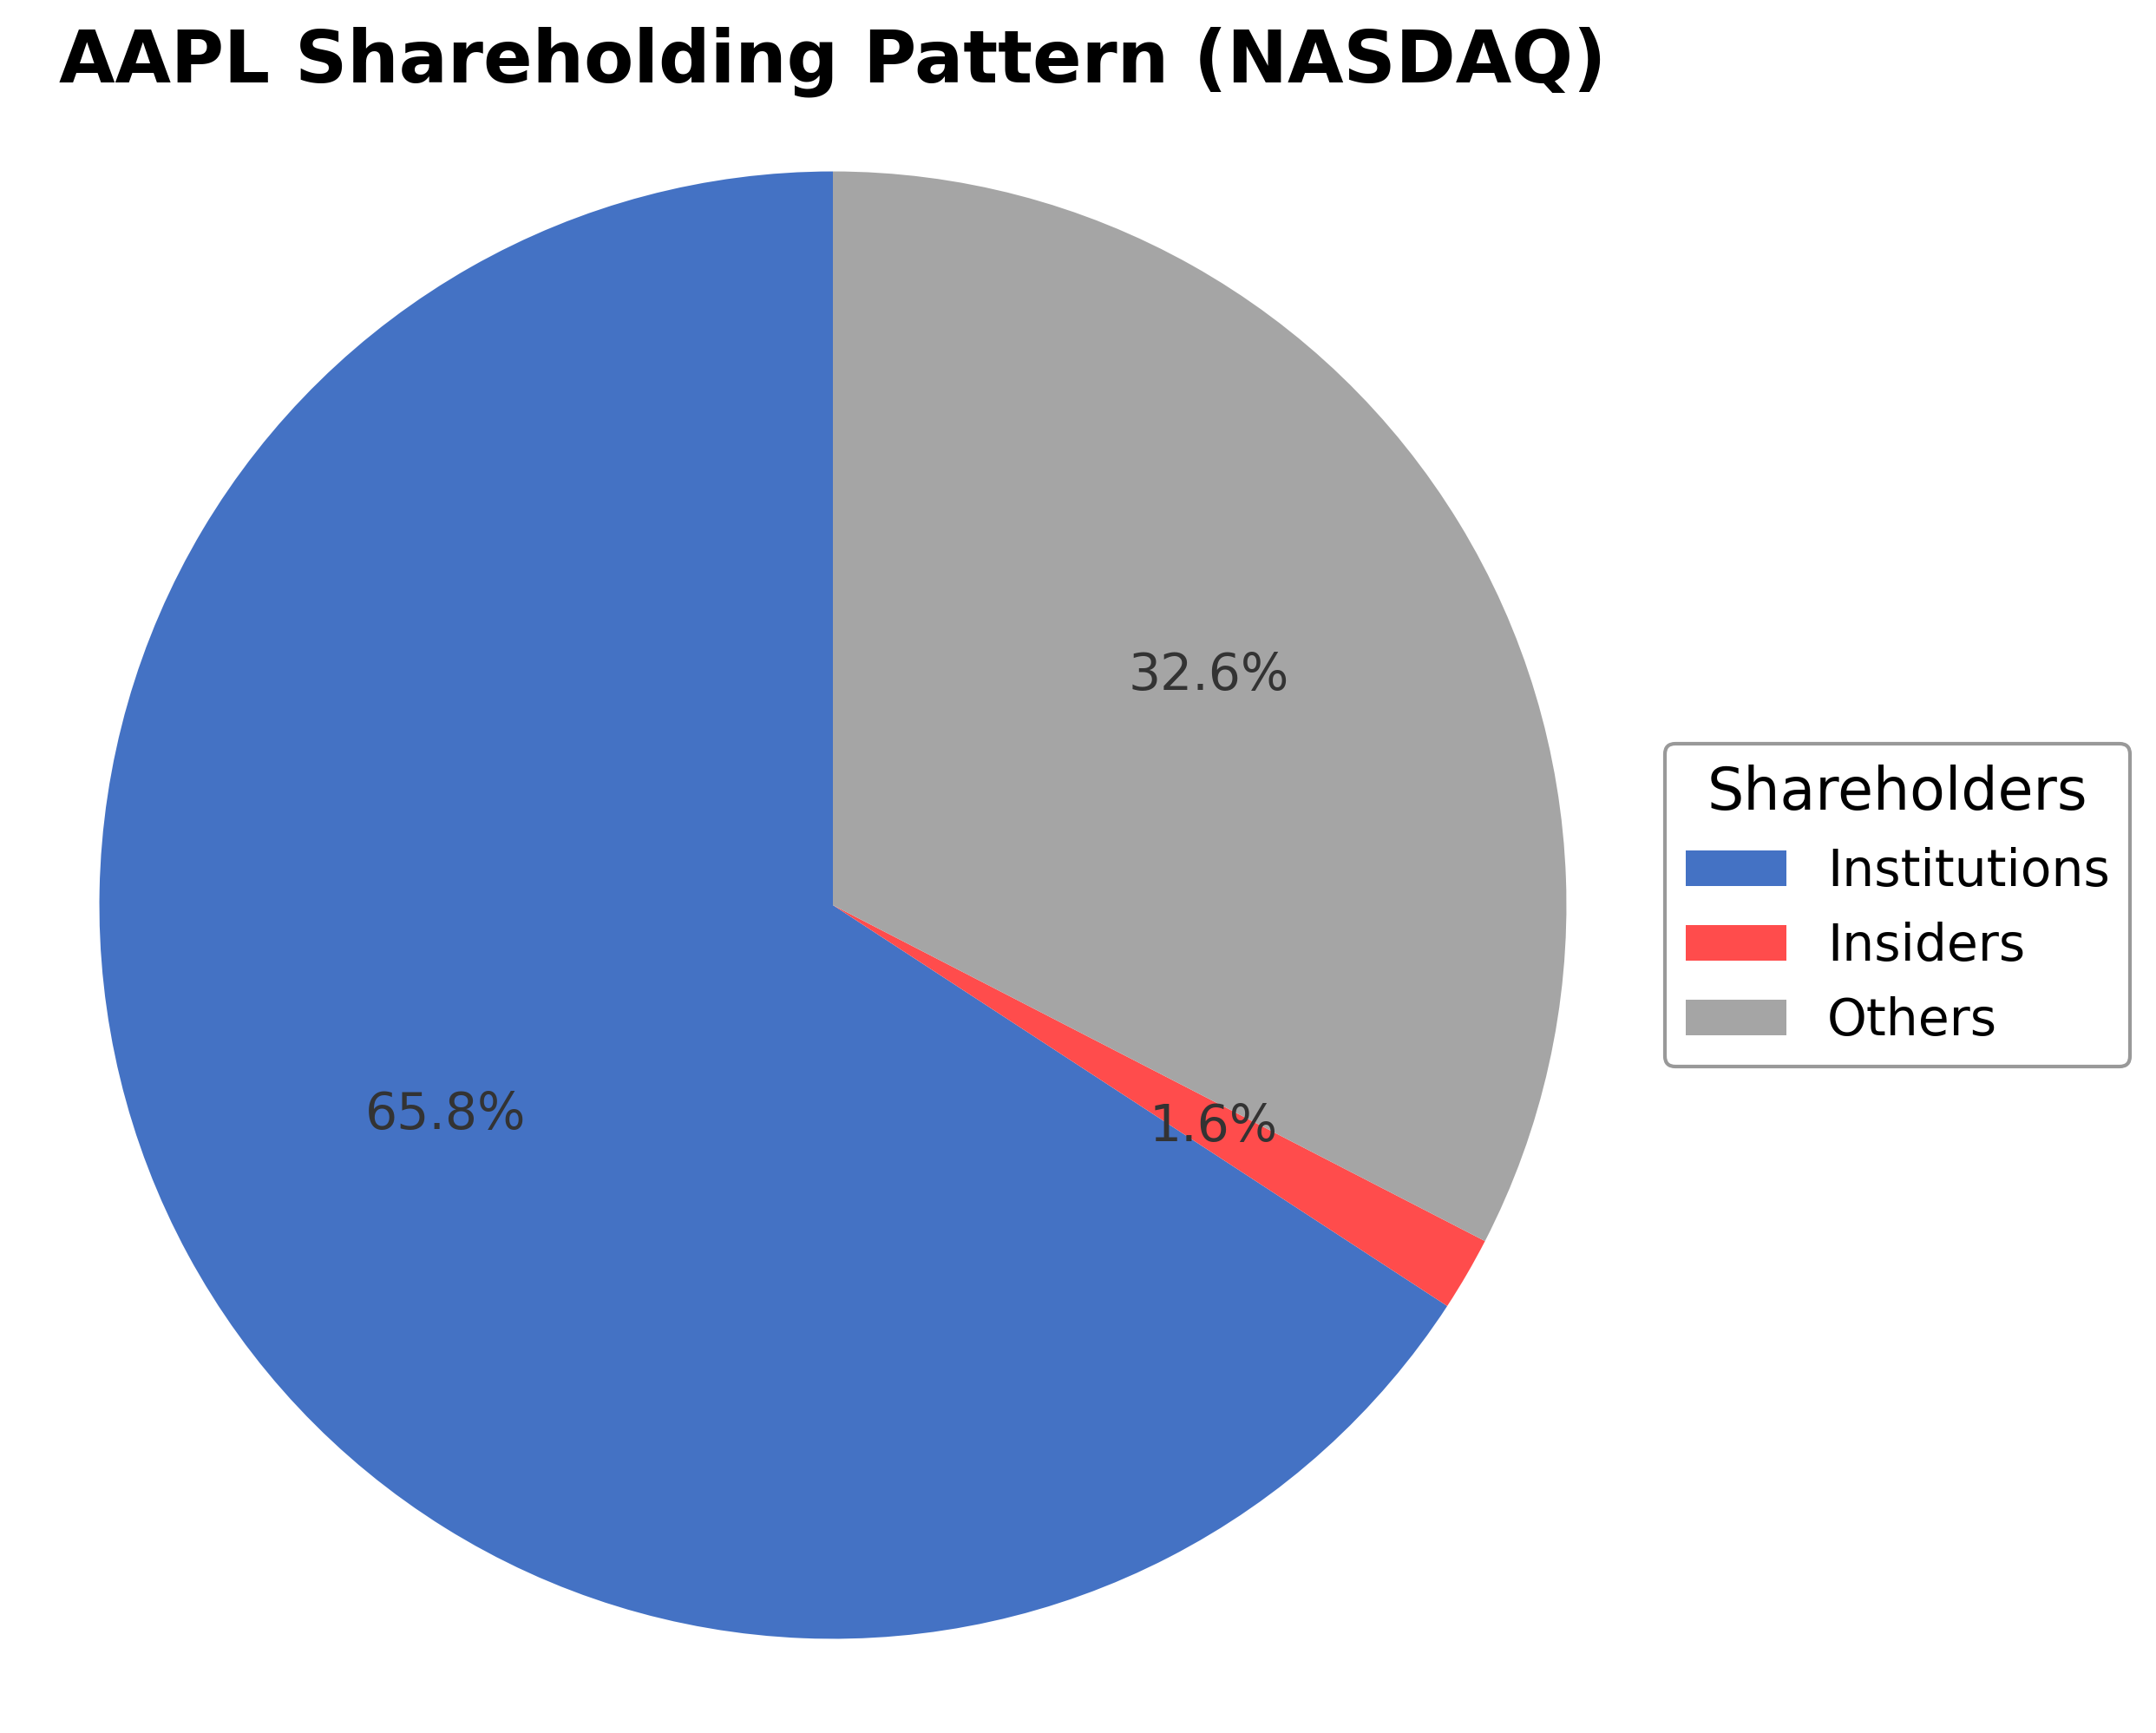
Shareholding Pattern
Sector and Industry Analysis
The global apple sector is a significant segment within the broader agricultural industry, encompassing cultivation, harvesting, distribution, and retail of various apple varieties. The market is sizable and projected to grow steadily through 2034, driven by rising health awareness and demand for organic produce. Key players include multinational corporations and numerous local producers competing across major regions such as North America, Europe, and Asia-Pacific.
Current industry trends highlight increased consumer preference for organic and locally sourced apples, alongside innovations in packaging and storage that extend shelf life. Technological advances in smart farming and supply chain optimization are enhancing productivity and reducing losses. Competitive dynamics are shaped by intensified rivalry among international and regional players, with barriers including climate variability, stringent food safety standards, and fluctuating trade tariffs.
The regulatory environment is increasingly focused on food safety, quality standards, and sustainability, influencing production and market strategies. Policies related to carbon pricing and energy security also affect operational costs and supply chains. Ongoing geopolitical tensions and trade agreements further impact export-import flows, requiring adaptive approaches to compliance and market access.
Note: Analysis synthesized from industry research, market reports, and regulatory filings. Information is subject to change based on market conditions.
Financial Ratios Dashboard
Illustrative Scenario Analysis
DCF Assumptions:
Method: Two-Stage EPS-Priority Model
Financials
Peer Analysis
| Company Name | Market Cap | P/E Ratio | P/B Ratio | EV/EBITDA | Price to CFO |
|---|---|---|---|---|---|
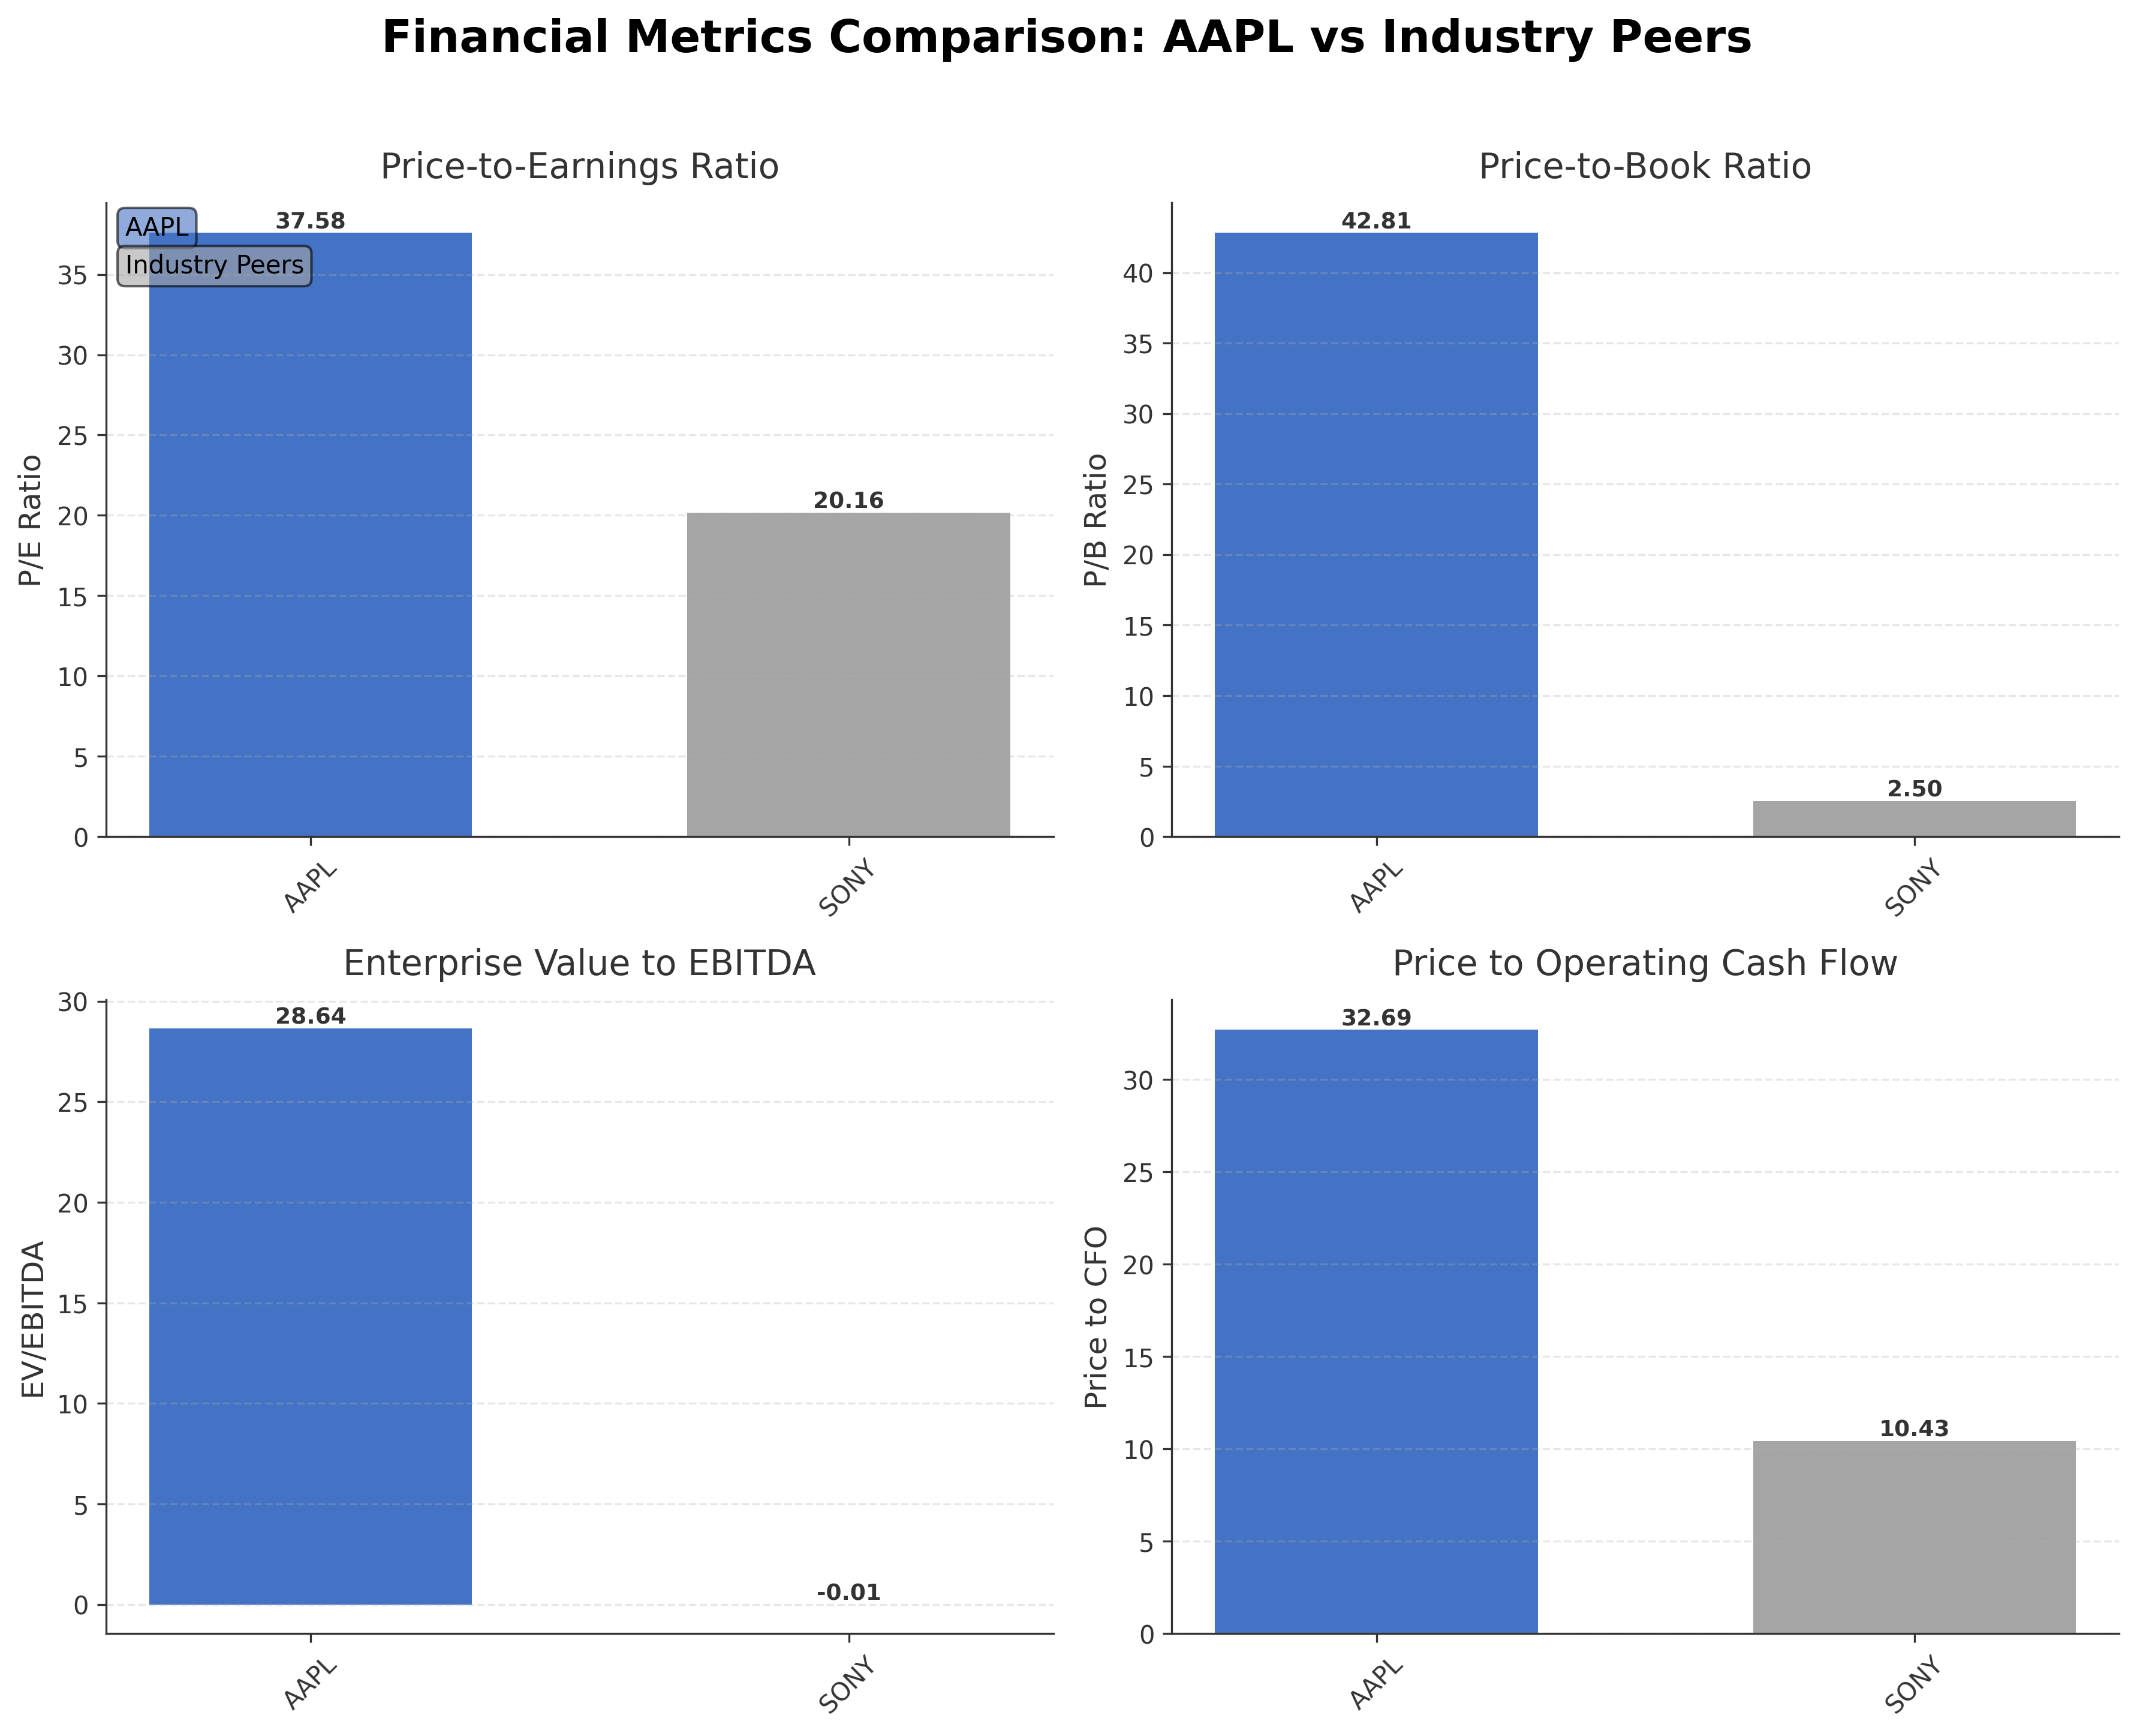
| Apple Inc | $4.58T | 37.58 | 42.81 | 28.64 | 32.69 |
| Sony Group Corporation | $127.44B | 20.16 | 2.50 | -0.01 | 10.43 |
Comparison Analysis: Apple Inc. significantly outpaces its peer Sony Group Corporation in market capitalization, with a valuation exceeding $4.5 trillion compared to Sony’s $127 billion. Apple’s P/E ratio of 37.58 is nearly double Sony’s 20.16, reflecting higher growth expectations and premium market positioning. The price-to-book ratio for Apple is markedly higher at 42.81 versus Sony’s 2.50, indicating substantial intangible assets and brand value. Apple’s enterprise value to EBITDA ratio of 28.64 contrasts with Sony’s negative figure, underscoring Apple’s superior profitability and operational efficiency. Additionally, Apple’s return on equity at 141.47% dwarfs Sony’s 0.12%, highlighting exceptional capital returns. Overall, Apple demonstrates dominant financial metrics and valuation multiples relative to its regional industry peer.
Financial Metrics Comparison with Peers
Financial Statements
Comprehensive financial data including income, balance sheet, and cash flow metrics
Income Statement
| fiscal_date | 2025-09-30 | 2024-09-30 | 2023-09-30 | 2022-09-30 | 2021-09-30 |
|---|---|---|---|---|---|
| Sales | 416.16B | 391.04B | 383.29B | 394.33B | 365.82B |
| Cost Of Goods | 220.96B | 210.35B | 214.14B | 223.55B | 212.98B |
| Gross Profit | 195.20B | 180.68B | 169.15B | 170.78B | 152.84B |
| Operating Expense Research And Development | 34.55B | 31.37B | 29.91B | 26.25B | 21.91B |
| Operating Expense Selling General And Administrative | 27.60B | 26.10B | 24.93B | 25.09B | 21.97B |
| Operating Income | 133.05B | 123.22B | 114.30B | 119.44B | 108.95B |
| Other Income Expense | -321.00M | 269.00M | -565.00M | -334.00M | 60.00M |
| Pretax Income | 132.73B | 123.48B | 113.74B | 119.10B | 109.21B |
| Income Tax | 20.72B | 29.75B | 16.74B | 19.30B | 14.53B |
| Net Income | 112.01B | 93.74B | 97.00B | 99.80B | 94.68B |
| Eps Basic | 7.49 | 6.11 | 6.16 | 6.15 | 5.67 |
| Eps Diluted | 7.46 | 6.08 | 6.13 | 6.11 | 5.61 |
| Basic Shares Outstanding | 14.95B | 15.34B | 15.74B | 16.22B | 16.70B |
| Diluted Shares Outstanding | 14.95B | 15.34B | 15.74B | 16.22B | 16.70B |
| Ebit | 133.05B | 123.22B | 114.30B | 119.44B | 111.85B |
| Ebitda | 144.75B | 134.66B | 125.82B | 130.54B | 123.14B |
| Net Income Continuous Operations | 112.01B | 93.74B | 97.00B | 99.80B | 94.68B |
| Non Operating Interest Income | N/A | N/A | 3.75B | 2.83B | 2.84B |
| Non Operating Interest Expense | N/A | N/A | 3.93B | 2.93B | 2.65B |
Data provided by Twelve Data
Balance Sheet
| fiscal_date | 2025-09-30 | 2024-09-30 | 2023-09-30 | 2022-09-30 | 2021-09-30 |
|---|---|---|---|---|---|
| Cash And Cash Equivalents | 35.93B | 29.94B | 29.96B | 23.65B | 34.94B |
| Accounts Receivable | 39.78B | 33.41B | 29.51B | 28.18B | 26.28B |
| Total Assets | 359.24B | 364.98B | 352.58B | 352.75B | 351.00B |
| Total Liabilities | 285.51B | 308.03B | 290.44B | 302.08B | 287.91B |
| Long Term Debt | 78.33B | 85.75B | 95.28B | 109.71B | 119.38B |
| Shareholders Equity | 73.73B | 56.95B | 62.15B | 50.67B | 63.09B |
Data provided by Twelve Data
Cash Flow Statement
| fiscal_date | 2025-09-30 | 2024-09-30 | 2023-09-30 | 2022-09-30 | 2021-09-30 |
|---|---|---|---|---|---|
| Operating Activities Net Income | 112.01B | 93.74B | 97.00B | 99.80B | 94.68B |
| Operating Activities Depreciation | 11.70B | 11.45B | 11.52B | 11.10B | 11.28B |
| Operating Activities Stock Based Compensation | 12.86B | 11.69B | 10.83B | 9.04B | 7.91B |
| Operating Activities Other Non Cash Items | -89.00M | -2.27B | -2.23B | 1.01B | -4.92B |
| Operating Activities Accounts Receivable | -7.03B | -5.14B | -417.00M | -9.34B | -14.03B |
| Operating Activities Accounts Payable | 902.00M | 6.02B | -1.89B | 9.45B | 12.33B |
| Operating Activities Other Assets Liabilities | -18.87B | 2.77B | -4.27B | 1.57B | -1.53B |
| Operating Activities Operating Cash Flow | 111.48B | 118.25B | 110.54B | 123.52B | 100.94B |
| Investing Activities Capital Expenditures | -12.71B | -9.45B | -10.96B | -10.71B | -11.09B |
| Investing Activities Purchase Of Investments | -24.41B | -48.66B | -29.51B | -76.92B | -109.56B |
| Investing Activities Sale Of Investments | 53.80B | 62.35B | 45.51B | 67.36B | 106.48B |
| Investing Activities Other Investing Activity | -1.48B | -1.31B | -1.34B | -2.09B | -385.00M |
| Investing Activities Investing Cash Flow | 15.20B | 2.94B | 3.71B | -22.66B | -14.58B |
| Financing Activities Long Term Debt Issuance | 4.48B | 0.00 | 5.23B | 5.46B | 20.39B |
| Financing Activities Long Term Debt Payments | -10.93B | -9.96B | -11.15B | -9.54B | -8.75B |
| Financing Activities Short Term Debt Issuance | -2.03B | 3.96B | -3.98B | 3.96B | 1.02B |
| Financing Activities Common Stock Repurchase | -90.71B | -94.95B | -77.55B | -89.40B | -85.97B |
| Financing Activities Common Dividends | -15.42B | -15.23B | -15.03B | -14.84B | -14.47B |
| Financing Activities Other Financing Charges | -6.07B | -5.80B | -6.01B | -6.38B | -5.58B |
| Financing Activities Financing Cash Flow | -120.69B | -121.98B | -108.49B | -110.75B | -92.25B |
| End Cash Position | 35.93B | 29.94B | 30.74B | 24.98B | 35.93B |
| Income Tax Paid | 43.37B | 26.10B | 18.68B | 19.57B | 25.39B |
| Free Cash Flow | 98.77B | 108.81B | 99.58B | 111.44B | 92.95B |
| Interest Paid | N/A | N/A | 3.80B | 2.87B | 2.69B |
| Operating Activities Deferred Taxes | N/A | N/A | N/A | 895.00M | -4.77B |
| Investing Activities Net Acquisitions | N/A | N/A | N/A | -306.00M | -33.00M |
| Financing Activities Common Stock Issuance | N/A | N/A | N/A | N/A | 1.10B |
Data provided by Twelve Data
Technical Analysis
Key Insights
- Apple’s stock exhibits a strong upward trend, trading near its 52-week high with consistent higher highs and higher lows in recent price action.
- Key support levels are identified near $270 and $260, while resistance is observed close to the 52-week high around $315.
- The current price is above the 10-day, 50-day ($272.88), and 200-day ($262.40) moving averages, indicating sustained bullish momentum.
- Momentum indicators show the RSI in the mid-60s range, MACD above its signal line, and Stochastic oscillators confirming positive momentum without overbought conditions.
- Multi-timeframe analysis across daily, weekly, and monthly charts confirms a stable bullish trend with no significant reversal signals.
- Potential market scenarios include continuation of the uptrend supported by strong technicals, with caution warranted near resistance levels where profit-taking may occur.
Trending News
Summary: Apple Inc. stock could see a significant surge following the Worldwide Developers Conference (WWDC), scheduled from June 8 to June 12, said Morgan Stanley. The bank suggested that the “AI winner” narrative has been a key turning point for numerous...
Sentiment: positive
2. Headline: Apple stock is coming hot into next week's WWDC. How the company can meet the moment
Summary: Should this new Siri not only wow ... Apple will benefit by monetizing it on its devices and services. Richer AI features could also catalyze a quicker pace of upgrades, or a change in the sales mix toward higher-end devices with more computing power, which is becoming increasingly valuable in the era of artificial intelligence. (Jim Cramer's Charitable Trust is long AAPL, GOOGL. See here for a full list of the stocks....
Sentiment: positive
3. Headline: Chinese satellite company releases images of Nvidia, Apple HQs | South China Morning Post
Summary: Photos offering bird’s-eye view of the campuses are ‘routine satellite news’ according to the firm, which has been sanctioned by the US.
Sentiment: neutral
4. Headline: Huge News For Apple and Nvidia Stock Investors
Summary: Homepage Membership Levels About ... Complete Stock List The book Membership Data Coverage Founder's Message 10-Year Letter 20-Year Letter Free Trial Referral Program Partner Program Newsletters Signup Advertise ... GuruFocus Screeners All-In-One Screener Bond Screener ETF Screener Strategies Created by Users Ben Graham Lost Formula Canadian Faster Growers CEO Buys CEO Buys after Price Drop > 20% Dividend Kings 2026 Dividend Aristocrats 2026 Dividend Growth Portfolio Dividend Income Portfolio ...
Sentiment: neutral
5. Headline: Apple's App Store generated $1.4 trillion in sales last year
Summary: Apple is also expected to announce updates to its various operating systems including iOS and macOS. Email Daniel Howley at dhowley@yahoofinance.com. Follow him on Twitter at @DanielHowley. Click here for the latest technology news that will impact the stock market
Sentiment: neutral
Powered by Brave
Recent Updates
News Summary
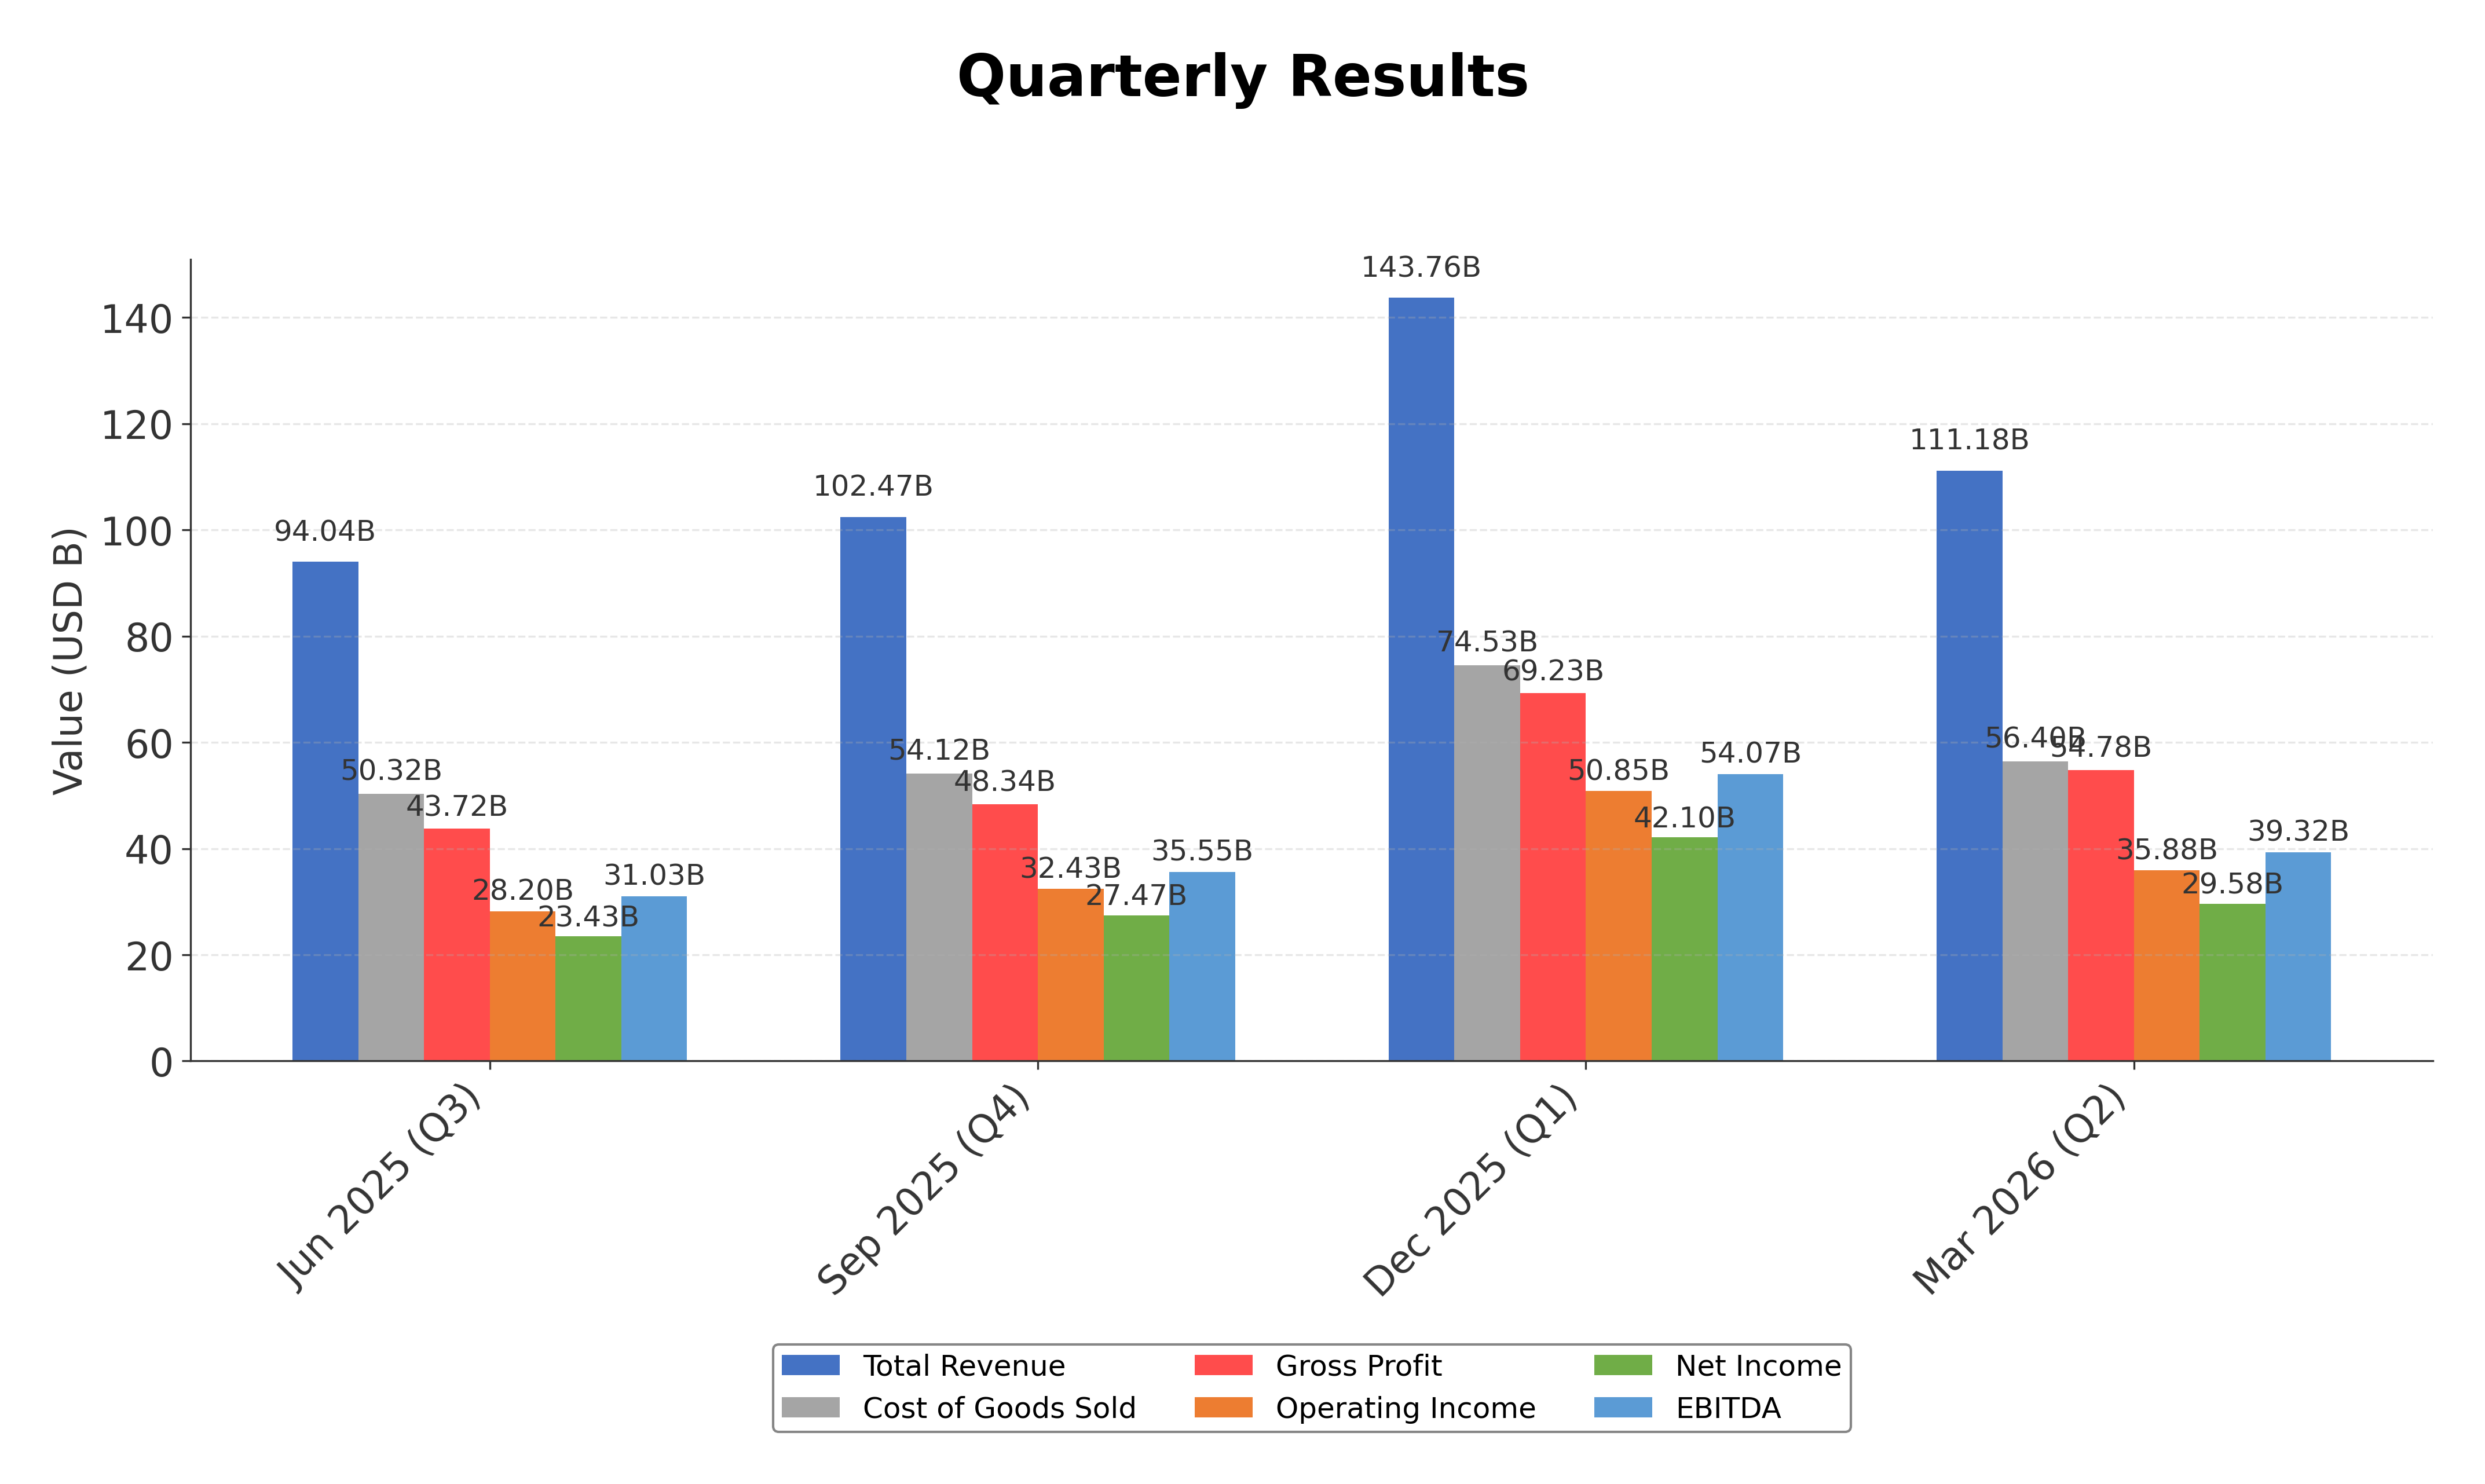
As of June 3, 2026. Apple has agreed to provide its financial data to India's Competition Commission, advancing a prolonged antitrust investigation closer to a potential penalty decision with significant financial implications in the Indian market. The company reported record-breaking quarterly revenues of $111.2 billion for Q2 2026, a 17% year-over-year increase, driven by strong iPhone 17 lineup sales and all-time high Services revenue. Diluted EPS rose 22% to $2.01, supported by robust operating cash flow exceeding $28 billion. The board declared a 4% increase in quarterly dividends to $0.27 per share and authorized a $100 billion share repurchase program. Additionally, a leadership transition was announced with Tim Cook moving to Executive Chairman and John Ternus becoming CEO, marking a significant governance change.
News Sentiment
The overall sentiment from recent updates is predominantly positive, driven by strong financial performance with record revenues and earnings growth, successful product launches, and strategic capital return initiatives. Positive regulatory cooperation in India mitigates uncertainty around antitrust risks, contributing to a constructive outlook. Neutral tones accompany investor relations communications and routine corporate disclosures. The leadership transition introduces a new phase for the company, with market reactions remaining cautiously optimistic. Collectively, the news reflects solid operational momentum tempered by ongoing regulatory considerations.
Source List
Analytical Overview
Analysis Summary
Apple’s valuation metrics show a trailing P/E of 37.58 and forward P/E of 32.35, which are elevated compared to the Consumer Electronics industry average P/E of approximately 37.58, indicating the market’s premium pricing of growth and profitability. The company’s revenue growth of 16.6% year-over-year and strong operating cash flow trends demonstrate a healthy growth trajectory supported by robust product demand and expanding services. Financial health is solid with a total debt-to-equity ratio near 79.5%, manageable given substantial cash reserves of $68.5 billion and strong free cash flow generation exceeding $101 billion. Sector-specific opportunities include AI integration and ecosystem expansion, while challenges encompass regulatory scrutiny and supply chain pressures. Market positioning and competitive advantages are reinforced by Apple’s brand strength, innovation pipeline, and diversified revenue streams.
Overall Business and Market Assessment
Supporting Factors: No data
Risk Factors: regulatory developments in major markets such as India, competitive dynamics in technology and services, and valuation levels that reflect high market expectations
SWOT Analysis
Strengths
- Market leadership with a diversified product and services ecosystem.
- Strong profitability with high gross and net profit margins.
- Robust cash flow generation and substantial cash reserves.
- High return on equity and asset efficiency.
Weaknesses
- High price-to-book ratio indicating premium valuation.
- Moderate debt levels relative to equity.
- Limited insider ownership potentially reducing direct executive alignment.
- Dependence on iPhone sales for a significant portion of revenue.
Opportunities
- Expansion of AI capabilities and integration across devices.
- Growth in Services segment with record revenue achievements.
- New product launches enhancing market penetration.
- Potential market expansion in emerging economies.
Threats
- Regulatory scrutiny and antitrust investigations, especially in India.
- Intense competition in technology and consumer electronics sectors.
- Supply chain disruptions and rising component costs.
- Geopolitical tensions affecting global operations.
Company Description
Apple Inc. designs, manufactures, and markets a wide range of technology products worldwide. These include the iPhone, a line of smartphones; Mac, a line of personal computers; iPad, a line of multi-purpose tablets; and wearables, home, and accessories such as AirPods, Apple Vision Pro, Apple TV, Apple Watch, Beats products, HomePod, as well as Apple branded and third-party accessories. The company operates service platforms including the App Store, Apple Music, and subscription models that provide curated content, cloud services, and digital offerings. Apple Inc. serves individual consumers, businesses, and government sectors through online stores, retail outlets, and partnerships with cellular carriers and resellers. Its products span the information technology sector, impacting mobile communication, personal computing, entertainment, and health monitoring. Founded in 1976 and headquartered in Cupertino, California, Apple Inc. plays a pivotal role in the global technology market by integrating hardware, software, and services into seamless ecosystems.