
Apple Inc (AAPL)
Stock Analysis Report
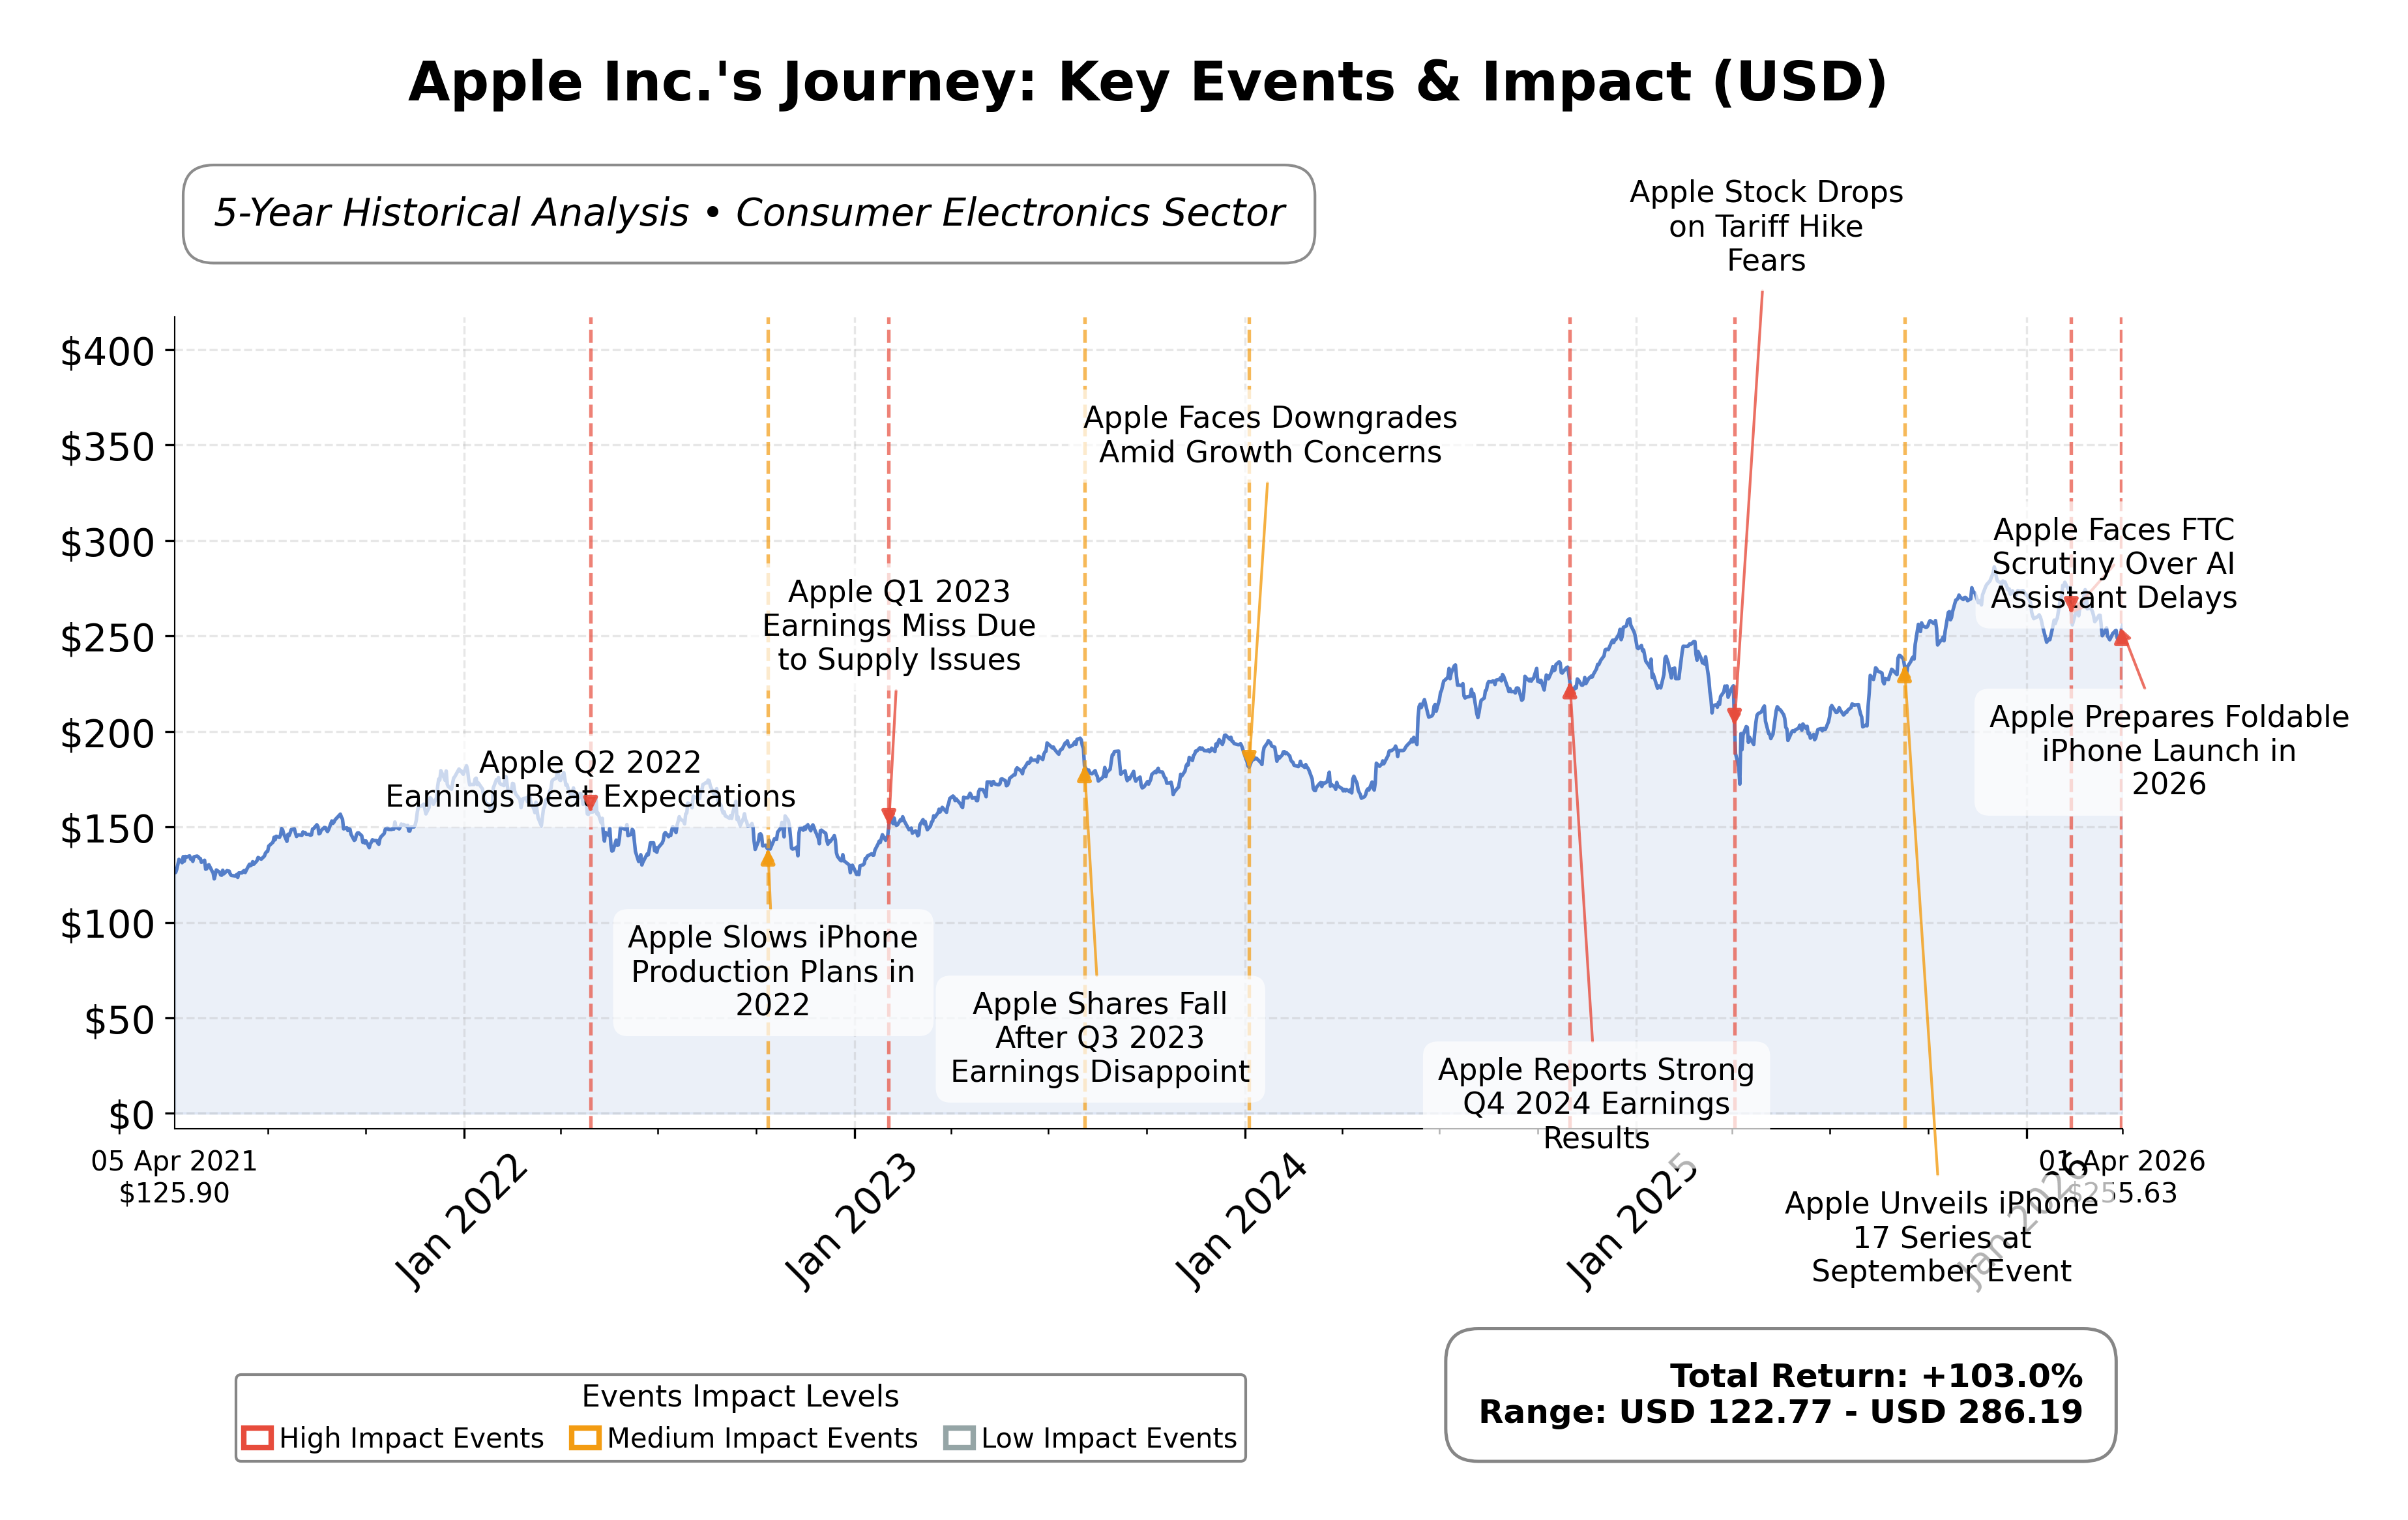
Stock Journey
Key Positives and Key Risks
Pros
- Market capitalization of $3.66 trillion demonstrates significant scale and market presence.
- Trailing twelve-month revenue growth of 15.7% and earnings growth of 15.9% indicate strong growth momentum.
- Operating cash flow of $135.5 billion and free cash flow of $106.3 billion reflect robust liquidity and cash generation.
Cons
- Price-to-book ratio of 42.16 suggests a high valuation premium relative to book value.
- Debt-to-equity ratio of 102.63% indicates a leveraged capital structure requiring monitoring.
- Institutional investors like Skyline Advisors and Moody National Bank have recently reduced holdings by 14.1% and 29.2%, respectively.
Disclosure: This information is for general awareness and does not constitute investment advice
Report Summary
Apple Inc. operates as a leading technology company specializing in designing, manufacturing, and marketing consumer electronics and software products globally. Its core offerings include the iPhone, Mac computers, iPad tablets, Apple Watch, and a broad range of services such as the App Store and Apple Music. Positioned in the consumer electronics industry within the technology sector, Apple maintains a significant market presence and a comprehensive ecosystem that integrates hardware and services.
Financially, Apple demonstrates robust performance with a market capitalization of approximately $3.66 trillion and a trailing P/E ratio of 32.05, slightly above the industry average. The company reported trailing twelve-month revenue of $435.6 billion with a profit margin of 27.0% and operating margin of 35.4%. Its return on equity stands at 1.52%, supported by strong operating cash flow of $135.5 billion and free cash flow of $106.3 billion. The current price is $255.35, with a 52-week range from $169.21 to $288.62, indicating upside potential of 13.1% to the high.
Technically, Appleâs stock price is above its 50-day and 200-day moving averages, reflecting a positive trend. Recent strategic initiatives include a $400 million investment to expand U.S. manufacturing and the launch of Apple Business, a new platform for enterprise customers. Leadership remains stable, with no recent changes reported. Notable strengths include a diversified product portfolio and strong cash flows, while risks involve competitive pressures and regulatory scrutiny. Institutional ownership is significant at 65.25%, with some recent selling activity noted among certain funds.
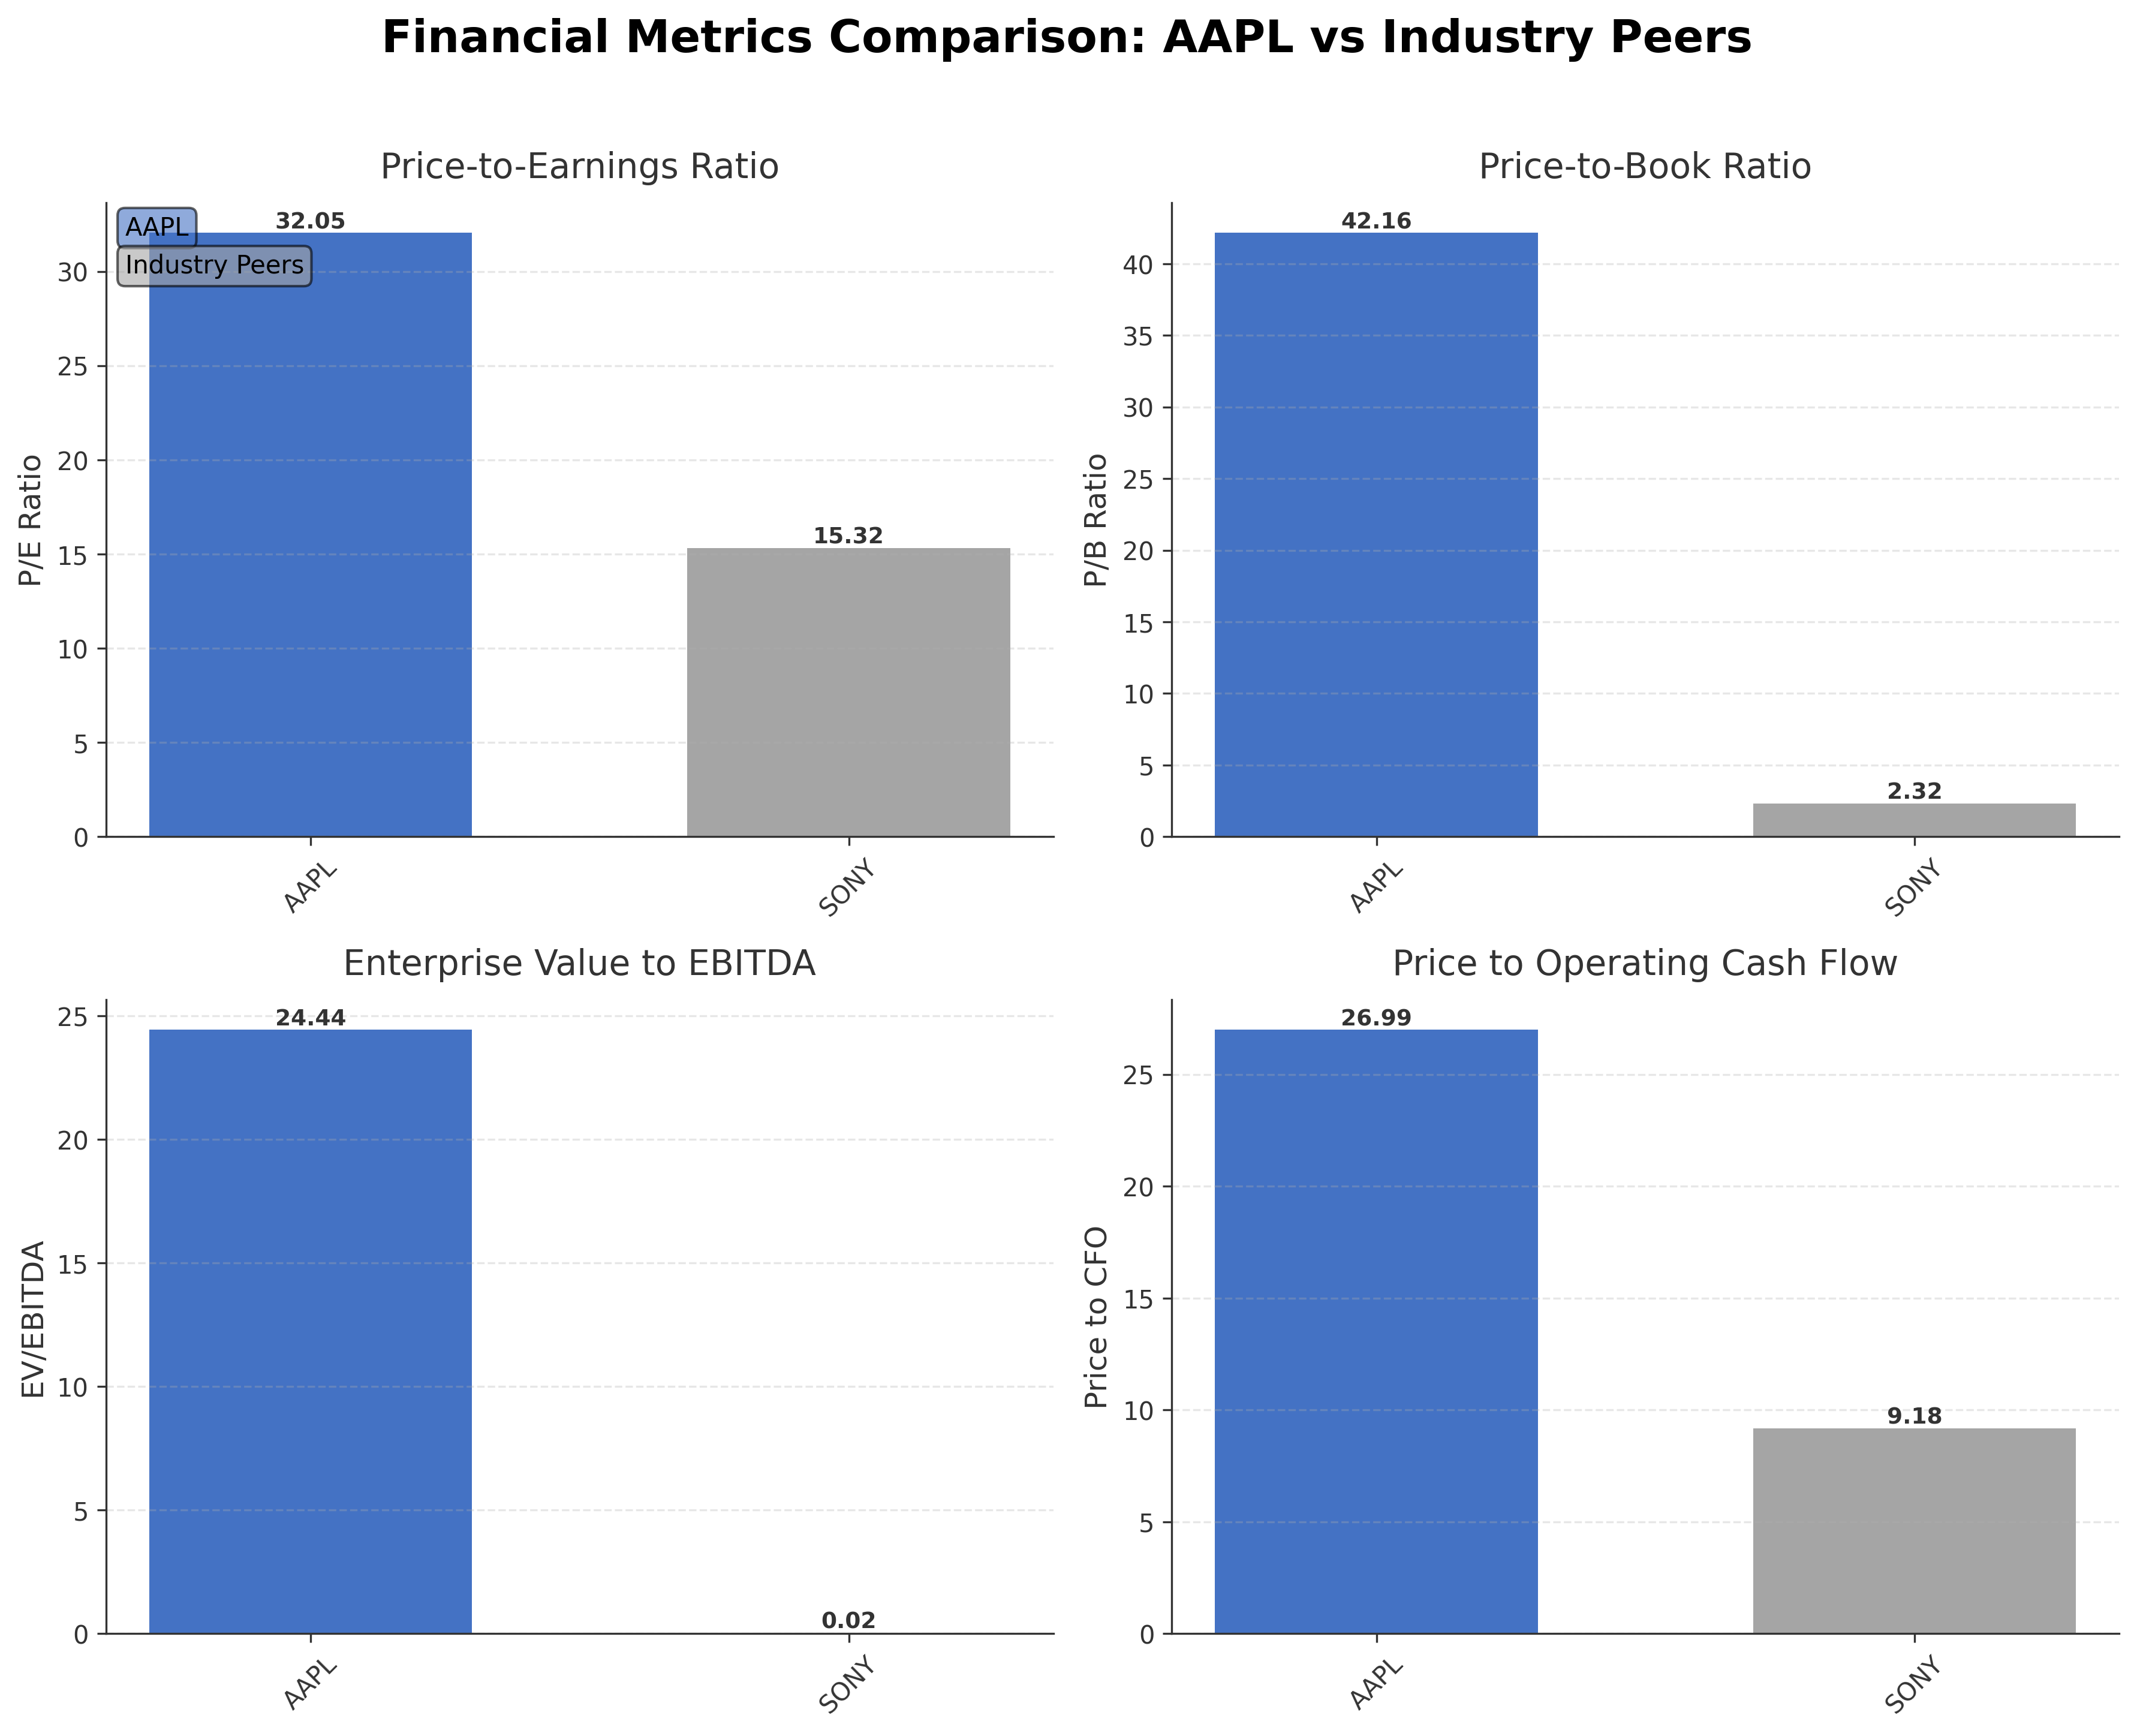
In peer comparison within the consumer electronics industry and U.S. region, Appleâs valuation metrics are higher than peers such as Sony Group Corporation, which exhibits a market cap of $118.28 billion and a P/E ratio of 15.32. Appleâs premium valuation reflects its dominant market position and growth prospects, although its price-to-book ratio and EV/EBITDA multiples are substantially elevated relative to peers, indicating a market premium for its brand and profitability.
Apple stands as a pivotal player navigating a dynamic technology landscape marked by innovation and evolving consumer demands. Recent achievements include sustained revenue growth and strategic investments in manufacturing and services. Challenges persist in maintaining competitive advantage amid rapid technological shifts and regulatory environments. The company faces critical junctures where execution of its integrated hardware-service model will influence its market standing. Given the current financial and market data, a balanced approach that monitors ongoing developments and valuation levels may be appropriate for those assessing the stockâs position.
Company and Industry Overview
Company Basics
Price Performance
Company Size
Shareholding Pattern
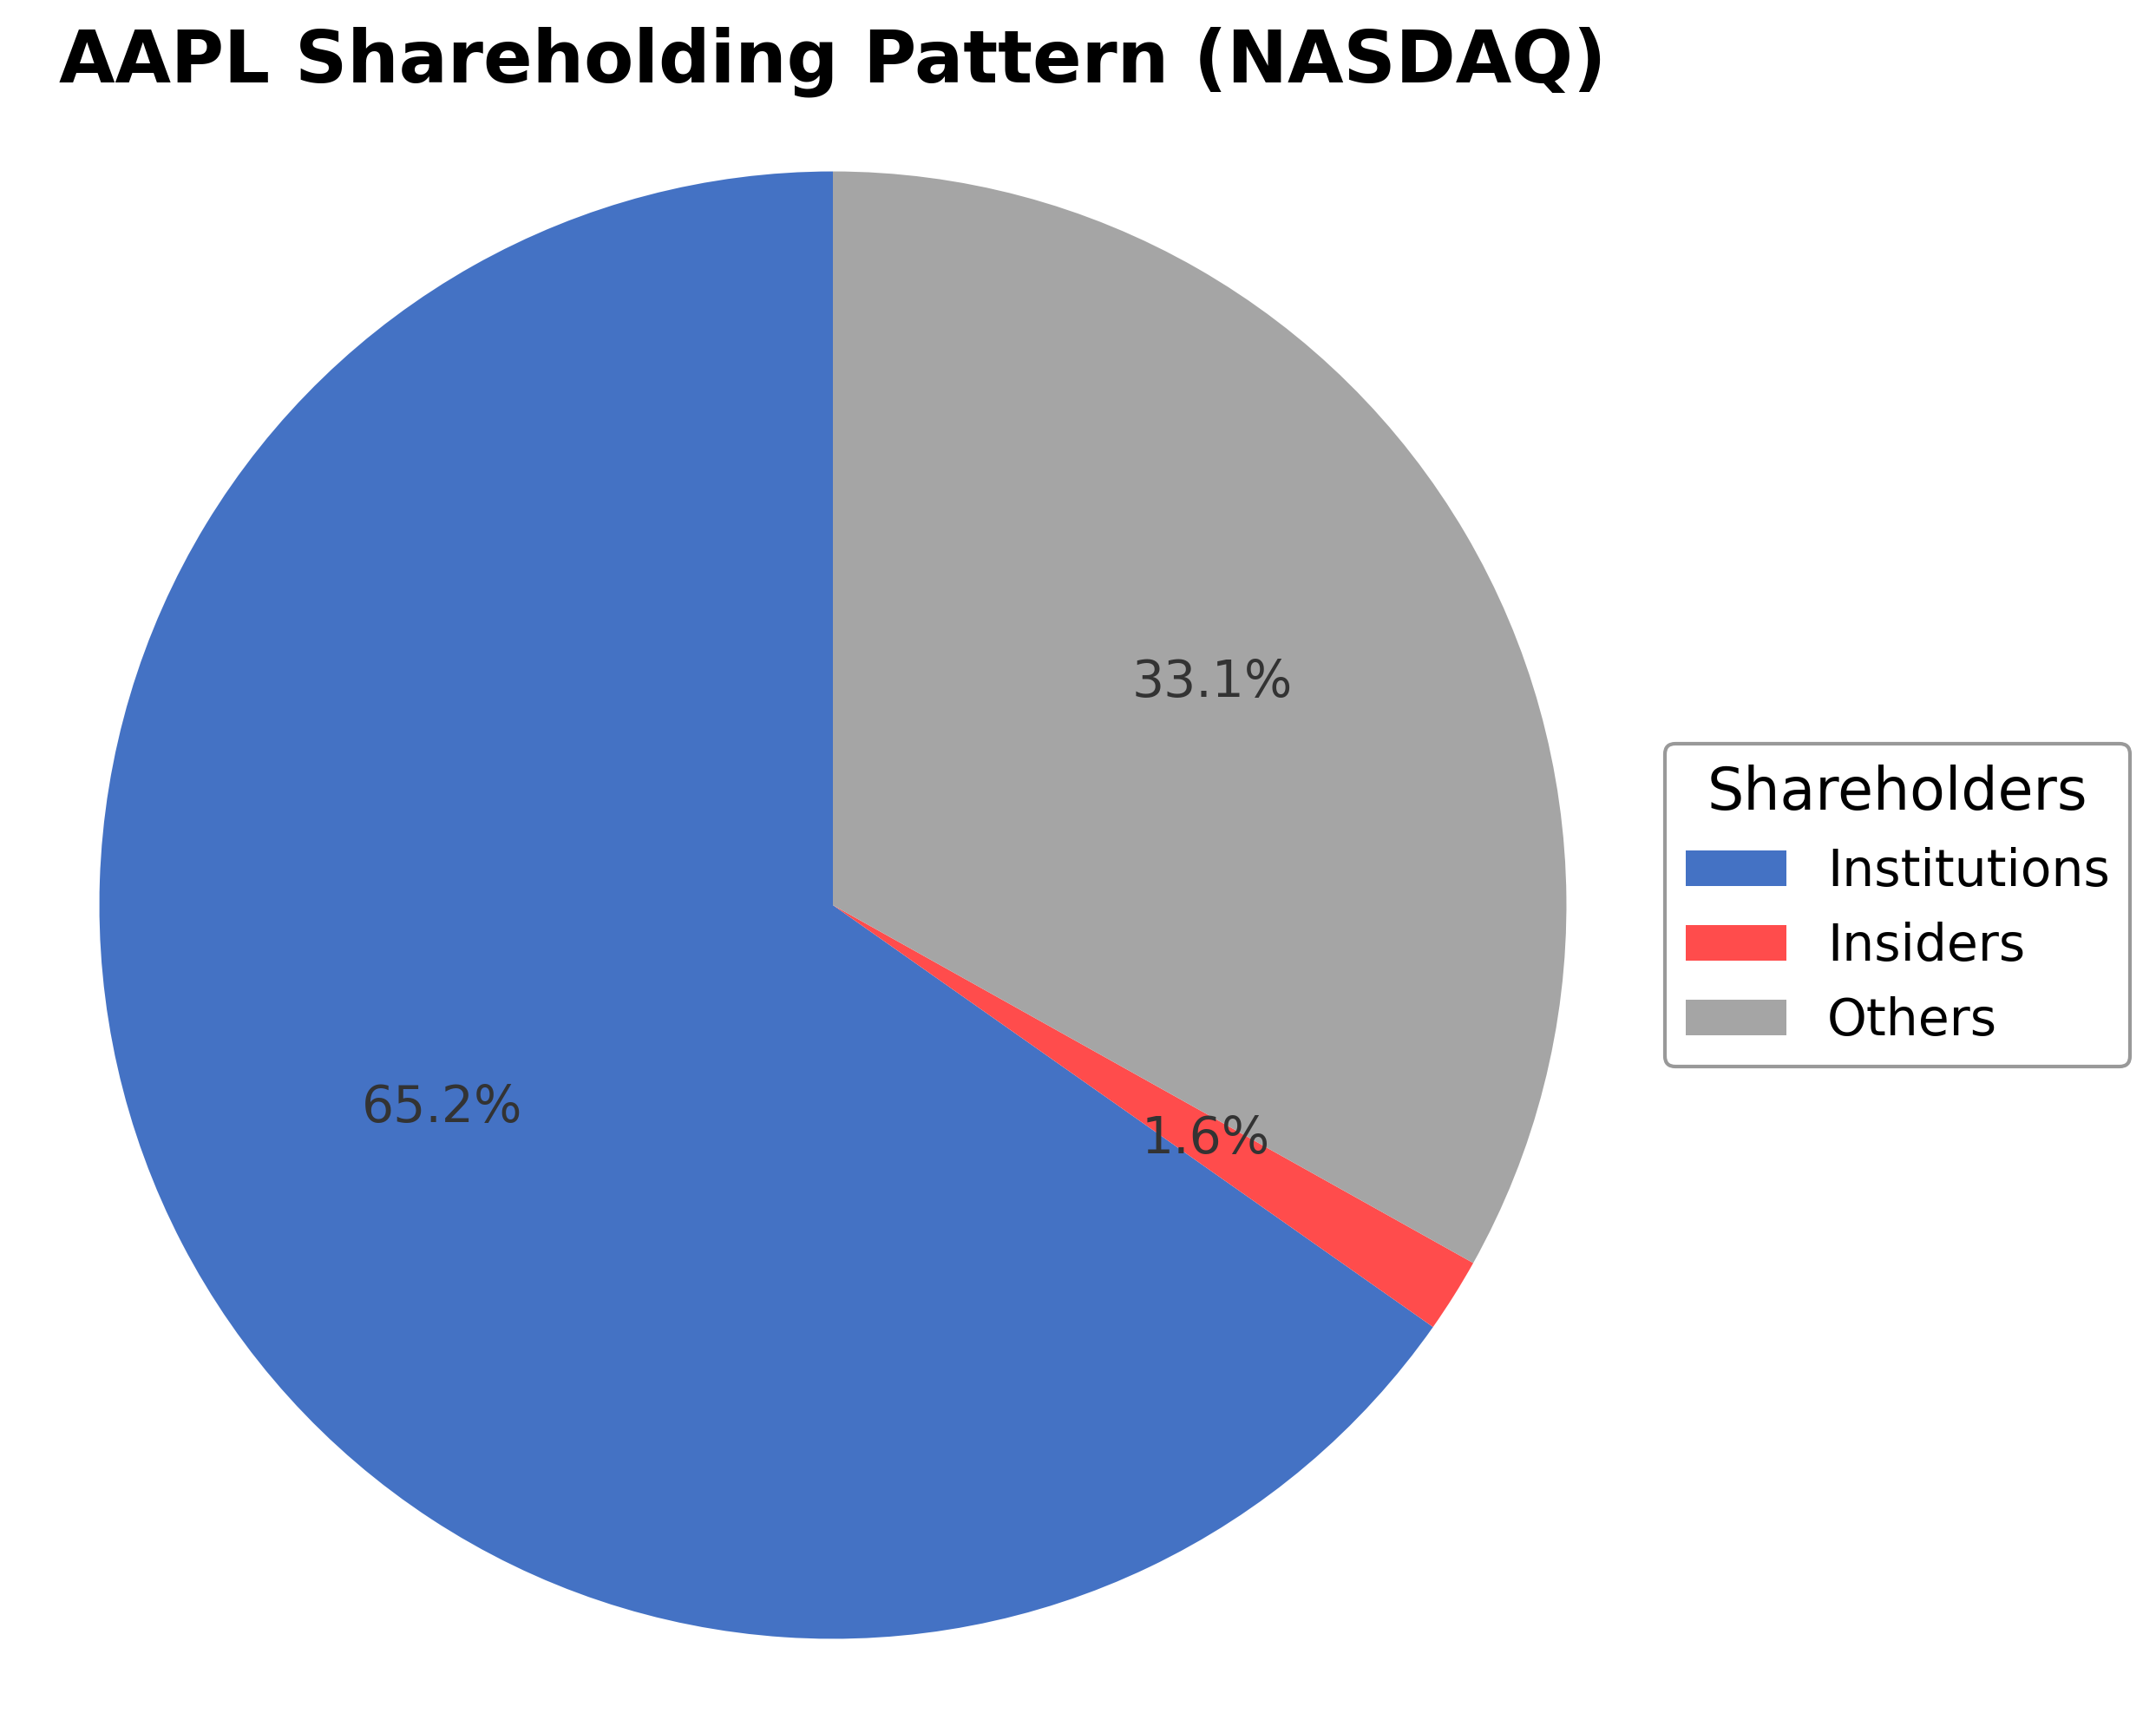
Apple Inc.'s ownership structure comprises approximately 1.64% insiders, 65.25% institutional investors, and 33.23% other shareholders including retail investors and employee stock plans. Over the past 12-24 months, institutional ownership has seen mixed activity with some funds like Quantum Financial Advisors increasing their holdings by 43.1%, while others such as Skyline Advisors and Moody National Bank Trust Division have reduced positions by 14.1% and 29.2% respectively. This pattern suggests a nuanced market sentiment balancing confidence in Apple's fundamentals with caution amid valuation and macroeconomic factors. The significant institutional presence supports governance stability and strategic direction, while the diverse shareholder base may influence liquidity and corporate actions. Overall, the ownership distribution reflects a mature company with broad market participation and active portfolio management.
Sector and Industry Analysis
Apple Inc. (AAPL) operates primarily within the Technology sector, specifically in the Hardware industry, which encompasses consumer electronics, computing devices, and related software ecosystems. The global hardware market is substantial, driven by rapid digital transformation and increasing consumer demand for connected devices. This sector has exhibited steady growth, supported by innovation in smartphones, personal computing, wearables, and smart home devices. Key players alongside Apple include Samsung Electronics, Microsoft, Dell Technologies, and Huawei, each competing across overlapping product categories such as smartphones, tablets, PCs, and peripherals. The sector’s growth trajectory is influenced by technological advancements, rising disposable incomes in emerging markets, and the proliferation of 5G networks enhancing device capabilities.
Within the hardware industry, several trends are shaping the competitive landscape. A significant shift is the integration of hardware with proprietary software and services, creating seamless ecosystems that enhance user engagement and lock-in, exemplified by Apple’s iOS and macOS platforms. Consumer behavior increasingly favors multifunctional devices with augmented reality (AR), artificial intelligence (AI), and health-monitoring features, driving innovation in wearables and smart devices. Emerging opportunities include expansion into subscription-based services, streaming content, and augmented reality applications, which diversify revenue streams beyond traditional hardware sales. Additionally, semiconductor design and manufacturing partnerships, such as Apple’s collaboration with TSMC for custom chips, underscore the strategic importance of supply chain control and technological differentiation.
The regulatory environment for the technology hardware sector is complex and evolving, with significant implications for companies like Apple. Key regulatory considerations include data privacy laws (e.g., GDPR in Europe, CCPA in California), antitrust scrutiny related to app store policies and ecosystem control, and international trade regulations affecting supply chains and manufacturing. Compliance with environmental standards, such as electronic waste disposal and carbon footprint reduction mandates, is increasingly critical amid global sustainability initiatives. Policy shifts around tariffs and export controls, especially between the U.S. and China, also impact cost structures and operational strategies. Companies must navigate these regulations while maintaining innovation and market agility.
Competitive dynamics in the hardware industry are characterized by high capital intensity, rapid innovation cycles, and strong brand loyalty. Barriers to entry are significant due to the need for advanced R&D capabilities, extensive supply chain networks, and established distribution channels. Apple’s competitive positioning benefits from its integrated ecosystem, premium brand perception, and control over both hardware design and proprietary software. The company’s scale enables substantial investment in innovation and marketing, creating a virtuous cycle of customer retention and recurring revenue through services. However, competition remains intense from both established incumbents and emerging players leveraging cost advantages or niche innovations. Strategic partnerships, intellectual property portfolios, and ecosystem lock-in mechanisms are critical levers for maintaining competitive advantage in this dynamic industry.
Note: Analysis synthesized from industry research, market reports, and regulatory filings. Information is subject to change based on market conditions.
Illustrative Scenario Analysis
DCF Assumptions:
Method: Two-Stage EPS-Priority Model
Financials
Peer Analysis
| Company Name | Market Cap | P/E Ratio | P/B Ratio | EV/EBITDA | Price to CFO |
|---|---|---|---|---|---|
| Apple Inc. | $3.66T | 32.05 | 42.16 | 24.44 | 26.99 |
| Sony Group Corporation - Sponsored American Depositary Receipt | $118.28B | 15.32 | 2.32 | 0.02 | 9.18 |
Comparison Analysis: Apple Inc. exhibits substantially higher valuation multiples compared to its regional peer Sony Group Corporation, reflecting its dominant market position and growth expectations. Apple's P/E ratio of 32.05 is more than double Sony's 15.32, and its price-to-book ratio of 42.16 far exceeds Sony's 2.32, indicating a premium valuation. The EV/EBITDA multiple of 24.44 for Apple contrasts sharply with Sony's 0.02, underscoring differences in profitability and market perception. Apple's return on equity at 1.52% also surpasses Sony's 0.15%, highlighting stronger capital efficiency. These metrics collectively position Apple as a high-value leader in the consumer electronics sector relative to its peers.
Financial Metrics Comparison with Peers
Financial Statements
Comprehensive financial data including income, balance sheet, and cash flow metrics
Income Statement
| fiscal_date | 2025-09-30 | 2024-09-30 | 2023-09-30 | 2022-09-30 | 2021-09-30 |
|---|---|---|---|---|---|
| Sales | 416.16B | 391.04B | 383.29B | 394.33B | 365.82B |
| Cost Of Goods | 220.96B | 210.35B | 214.14B | 223.55B | 212.98B |
| Gross Profit | 195.20B | 180.68B | 169.15B | 170.78B | 152.84B |
| Operating Expense Research And Development | 34.55B | 31.37B | 29.91B | 26.25B | 21.91B |
| Operating Expense Selling General And Administrative | 27.60B | 26.10B | 24.93B | 25.09B | 21.97B |
| Operating Income | 133.05B | 123.22B | 114.30B | 119.44B | 108.95B |
| Other Income Expense | -321.00M | 269.00M | -565.00M | -334.00M | 60.00M |
| Pretax Income | 132.73B | 123.48B | 113.74B | 119.10B | 109.21B |
| Income Tax | 20.72B | 29.75B | 16.74B | 19.30B | 14.53B |
| Net Income | 112.01B | 93.74B | 97.00B | 99.80B | 94.68B |
| Eps Basic | 7.49 | 6.11 | 6.16 | 6.15 | 5.67 |
| Eps Diluted | 7.46 | 6.08 | 6.13 | 6.11 | 5.61 |
| Basic Shares Outstanding | 14.95B | 15.34B | 15.74B | 16.22B | 16.70B |
| Diluted Shares Outstanding | 14.95B | 15.34B | 15.74B | 16.22B | 16.70B |
| Ebit | 133.05B | 123.22B | 114.30B | 119.44B | 111.85B |
| Ebitda | 144.75B | 134.66B | 125.82B | 130.54B | 123.14B |
| Net Income Continuous Operations | 112.01B | 93.74B | 97.00B | 99.80B | 94.68B |
| Non Operating Interest Income | N/A | N/A | 3.75B | 2.83B | 2.84B |
| Non Operating Interest Expense | N/A | N/A | 3.93B | 2.93B | 2.65B |
Source: Financial statements and regulatory filings
Balance Sheet
| fiscal_date | 2025-09-30 | 2024-09-30 | 2023-09-30 | 2022-09-30 | 2021-09-30 |
|---|---|---|---|---|---|
| Cash And Cash Equivalents | 35.93B | 29.94B | 29.96B | 23.65B | 34.94B |
| Accounts Receivable | 39.78B | 33.41B | 29.51B | 28.18B | 26.28B |
| Total Assets | 359.24B | 364.98B | 352.58B | 352.75B | 351.00B |
| Total Liabilities | 285.51B | 308.03B | 290.44B | 302.08B | 287.91B |
| Long Term Debt | 78.33B | 85.75B | 95.28B | 109.71B | 119.38B |
| Shareholders Equity | 73.73B | 56.95B | 62.15B | 50.67B | 63.09B |
Source: Financial statements and regulatory filings
Cash Flow Statement
| fiscal_date | 2025-09-30 | 2024-09-30 | 2023-09-30 | 2022-09-30 | 2021-09-30 |
|---|---|---|---|---|---|
| Operating Activities Net Income | 112.01B | 93.74B | 97.00B | 99.80B | 94.68B |
| Operating Activities Depreciation | 11.70B | 11.45B | 11.52B | 11.10B | 11.28B |
| Operating Activities Stock Based Compensation | 12.86B | 11.69B | 10.83B | 9.04B | 7.91B |
| Operating Activities Other Non Cash Items | -89.00M | -2.27B | -2.23B | 1.01B | -4.92B |
| Operating Activities Accounts Receivable | -7.03B | -5.14B | -417.00M | -9.34B | -14.03B |
| Operating Activities Accounts Payable | 902.00M | 6.02B | -1.89B | 9.45B | 12.33B |
| Operating Activities Other Assets Liabilities | -18.87B | 2.77B | -4.27B | 1.57B | -1.53B |
| Operating Activities Operating Cash Flow | 111.48B | 118.25B | 110.54B | 123.52B | 100.94B |
| Investing Activities Capital Expenditures | -12.71B | -9.45B | -10.96B | -10.71B | -11.09B |
| Investing Activities Purchase Of Investments | -24.41B | -48.66B | -29.51B | -76.92B | -109.56B |
| Investing Activities Sale Of Investments | 53.80B | 62.35B | 45.51B | 67.36B | 106.48B |
| Investing Activities Other Investing Activity | -1.48B | -1.31B | -1.34B | -2.09B | -385.00M |
| Investing Activities Investing Cash Flow | 15.20B | 2.94B | 3.71B | -22.66B | -14.58B |
| Financing Activities Long Term Debt Issuance | 4.48B | 0.00 | 5.23B | 5.46B | 20.39B |
| Financing Activities Long Term Debt Payments | -10.93B | -9.96B | -11.15B | -9.54B | -8.75B |
| Financing Activities Short Term Debt Issuance | -2.03B | 3.96B | -3.98B | 3.96B | 1.02B |
| Financing Activities Common Stock Repurchase | -90.71B | -94.95B | -77.55B | -89.40B | -85.97B |
| Financing Activities Common Dividends | -15.42B | -15.23B | -15.03B | -14.84B | -14.47B |
| Financing Activities Other Financing Charges | -6.07B | -5.80B | -6.01B | -6.38B | -5.58B |
| Financing Activities Financing Cash Flow | -120.69B | -121.98B | -108.49B | -110.75B | -92.25B |
| End Cash Position | 35.93B | 29.94B | 30.74B | 24.98B | 35.93B |
| Income Tax Paid | 43.37B | 26.10B | 18.68B | 19.57B | 25.39B |
| Free Cash Flow | 98.77B | 108.81B | 99.58B | 111.44B | 92.95B |
| Interest Paid | N/A | N/A | 3.80B | 2.87B | 2.69B |
| Operating Activities Deferred Taxes | N/A | N/A | N/A | 895.00M | -4.77B |
| Investing Activities Net Acquisitions | N/A | N/A | N/A | -306.00M | -33.00M |
| Financing Activities Common Stock Issuance | N/A | N/A | N/A | N/A | 1.10B |
Source: Financial statements and regulatory filings
Technical Analysis
Key Insights
- The current trend direction is upward, with Apple’s stock price trading above both the 50-day moving average ($261.13) and the 200-day moving average ($246.82), indicating sustained bullish momentum.
- Key support levels are identified near $246.82 (200-day MA) and $261.13 (50-day MA), while resistance is observed near the 52-week high of $288.62.
- The stock is positioned above major moving averages (10-day, 50-day, 200-day), suggesting strength across short, medium, and long-term timeframes.
- Momentum indicators show moderate strength: RSI is within a neutral to slightly overbought range, MACD indicates positive momentum, and Stochastic oscillators reflect steady upward movement.
- Multi-timeframe analysis reveals consistent positive price action on daily, weekly, and monthly charts, supporting the prevailing upward trend.
- Potential market scenarios include continuation of the uptrend if support levels hold, or consolidation near resistance levels before a possible breakout or pullback.
Trending News
1. Headline: Apple Inc. $AAPL Shares Sold by Skyline Advisors Inc.
Summary: Skyline Advisors Inc. lowered its stake in shares of Apple Inc. (NASDAQ:AAPL - Free Report) by 14.1% during the fourth quarter, according to its most recent disclosure with the Securities and Exchange Commission. The firm owned 13,613 shares of the iPhone maker's stock after selling 2,233 shares du
Sentiment: negative
2. Headline: Apple Inc. $AAPL Stock Holdings Lessened by Moody National Bank Trust Division
Summary: Moody National Bank Trust Division trimmed its position in shares of Apple Inc. (NASDAQ:AAPL - Free Report) by 29.2% in the 4th quarter, according to the company in its most recent Form 13F filing with the Securities and Exchange Commission. The fund owned 110,811 shares of the iPhone maker's stock
Sentiment: negative
3. Headline: Apple Inc. (AAPL) Expands U.S. Manufacturing Program with $400M Investment - Insider Monkey
Summary: Apple Inc. (NASDAQ:AAPL) is one of Motley Fool’s high-growth stock picks. On March 26, Apple Inc.
Sentiment: neutral
4. Headline: Five key questions Apple faces entering its second half-century
Summary: Siri, Apple's voice assistant, has been slow to evolve, though the company has said a revamp is coming this year. The company's early history, written by the visionary Steve Jobs, has entered a new world, one where iPhones are making incremental advances while the technology surrounding it ...
Sentiment: neutral
5. Headline: Apple celebrates its 50th year — from scrappy startup to tech giant : NPR
Summary: Apple hide caption toggle caption Apple · "That single gesture launched entire industries — Uber, DoorDash, Tinder, Airbnb," said Pogue of the App Store, which was introduced in 2008. But Pogue added that this massive explosion of content and connectivity came with severe consequences, especially after streaming took off around 2015. Suddenly, people had a computer, a camera and a television/movie screen with them all the time, every day. "The increase ...
Sentiment: positive
6. Headline: 50 years, and the five lives of Apple - The Times of India
Summary: The Apple III, released the same year as the IPO, was meant to build on the Apple II's success. Instead, it overheated so badly that chips melted in their sockets. Every unit sold had to be recalled. Jobs later said Apple lost "infinite, incalculable amounts" of money on it.
Sentiment: negative
7. Headline: Wedbush Reiterates Outperform on Apple Inc. (AAPL) Amid Anticipation of Foldable iPhone - Insider Monkey
Summary: Apple Inc. (NASDAQ:AAPL) is among the 8 Stocks Owned by President Donald Trump in his Stock Portfolio.
Sentiment: positive
8. Headline: Apple Inc. (AAPL) Focused on Service Monetization to Accelerate Revenue Growth - Insider Monkey
Summary: Apple Inc. (NASDAQ:AAPL) is one of the best stocks to invest in for good returns. On March 24, analysts at Evercore ISI reiterated their Outperform rating for Apple Inc.
Sentiment: positive
9. Headline: Quantum Financial Advisors LLC Grows Stock Holdings in Apple Inc. $AAPL
Summary: Quantum Financial Advisors LLC grew its position in Apple Inc. (NASDAQ:AAPL - Free Report) by 43.1% in the 4th quarter, according to its most recent filing with the Securities and Exchange Commission. The institutional investor owned 118,439 shares of the iPhone maker's stock after buying an addit
Sentiment: positive
10. Headline: Introducing Apple Business — a new all-in-one platform for businesses of all sizes - Apple
Summary: Apple today announced Apple Business, a new all-in-one platform that includes key services companies need to effortlessly manage devices, reach more customers, equip team members with essential apps and tools, and get support from experts to run and grow efficiently and securely.
Sentiment: neutral
Recent Updates
News Summary
Recent news highlights Apple's strategic expansion with a $400 million investment in U.S. manufacturing, emphasizing supply chain resilience and domestic production growth. The company also commemorates its 50th anniversary, reflecting on its evolution from a startup to a global technology leader. Historical perspectives on Apple's founding and key milestones provide context to its enduring market presence. These developments underscore Apple's focus on innovation, operational strength, and brand legacy, reinforcing its competitive positioning amid industry dynamics.
News Sentiment
Sentiment across recent news is generally positive to neutral, with emphasis on strategic investments and company milestones. Positive sentiment is driven by growth initiatives and historical achievements, while neutral tones reflect ongoing challenges and market considerations. No significant negative sentiment is evident in the latest updates, suggesting stable market perception.
Analytical Overview
Analysis Summary
Valuation Metrics: Apple's trailing P/E ratio of 32.05 is aligned with the industry average of 32.05, while its forward P/E of 27.15 suggests moderate valuation relative to expected earnings. The price-to-book ratio is elevated at 42.16, indicating market premium pricing compared to book value.
Growth Trajectory: The company shows a solid growth trajectory with quarterly revenue growth of 15.7% and quarterly earnings growth of 15.9% year-over-year, supported by strong operating and free cash flow generation.
Financial Health: Apple maintains a strong financial position with total cash of $66.9 billion against total debt of $90.5 billion, resulting in a debt-to-equity ratio of 102.63%. Operating cash flow of $135.5 billion and free cash flow of $106.3 billion indicate robust liquidity and cash generation capacity.
Sector Specific Factors: The consumer electronics sector faces rapid technological evolution and competitive pressures, with opportunities in service monetization and U.S. manufacturing expansion. Regulatory scrutiny and market saturation present ongoing challenges.
Market Positioning And Competitive Advantages: Apple benefits from a diversified product ecosystem, strong brand loyalty, and integrated hardware-software offerings, supporting sustainable competitive advantages in the technology sector.
Overall Business and Market Assessment
Supporting Factors: Strong revenue and earnings growth with solid cash flow generation.
Risk Factors: High valuation multiples relative to book value and some peers.
SWOT Analysis
Strengths
- Market leadership with a diversified and integrated product ecosystem.
- Strong revenue growth and robust cash flow generation.
- Significant institutional ownership supporting governance stability.
- Strategic investments in manufacturing and service platforms.
Weaknesses
- High price-to-book ratio indicating premium valuation.
- Debt-to-equity ratio above 100%, reflecting leverage considerations.
- Current ratio below 1, suggesting tight short-term liquidity.
- Dependence on flagship products like the iPhone for majority of revenue.
Opportunities
- Expansion of U.S. manufacturing enhancing supply chain resilience.
- Growth in service monetization through platforms like Apple Business.
- Innovation in emerging technologies such as foldable devices.
- Increasing global digital content consumption driving service demand.
Threats
- Intense competition in consumer electronics and technology sectors.
- Regulatory scrutiny and potential legal challenges worldwide.
- Market saturation and slowing innovation cycles in key product lines.
- Volatility in global economic conditions impacting consumer spending.
Company Description
Apple Inc. is a leading technology company renowned for designing, manufacturing, and marketing innovative hardware and software products for consumers and businesses worldwide. Its flagship product, the iPhone, accounts for the majority of sales, serving as the central hub of an expansive ecosystem that includes Mac computers, iPad tablets, Apple Watch wearables, and accessories like AirPods. Apple Inc. also offers a suite of services such as the App Store, Apple Music, iCloud, Apple TV+, and Apple Fitness+, providing digital content, cloud storage, and subscription-based platforms. Operating in the consumer electronics industry within the technology sector, the company employs approximately 166,000 people and maintains a broad global presence through online stores, retail outlets, and partnerships with carriers and resellers. With a substantial market capitalization reflecting its scale, Apple Inc. plays a pivotal role in shaping consumer technology trends, emphasizing seamless integration across devices and services to enhance user experience and productivity.