
Apple Inc (AAPL)
Stock Analysis Report
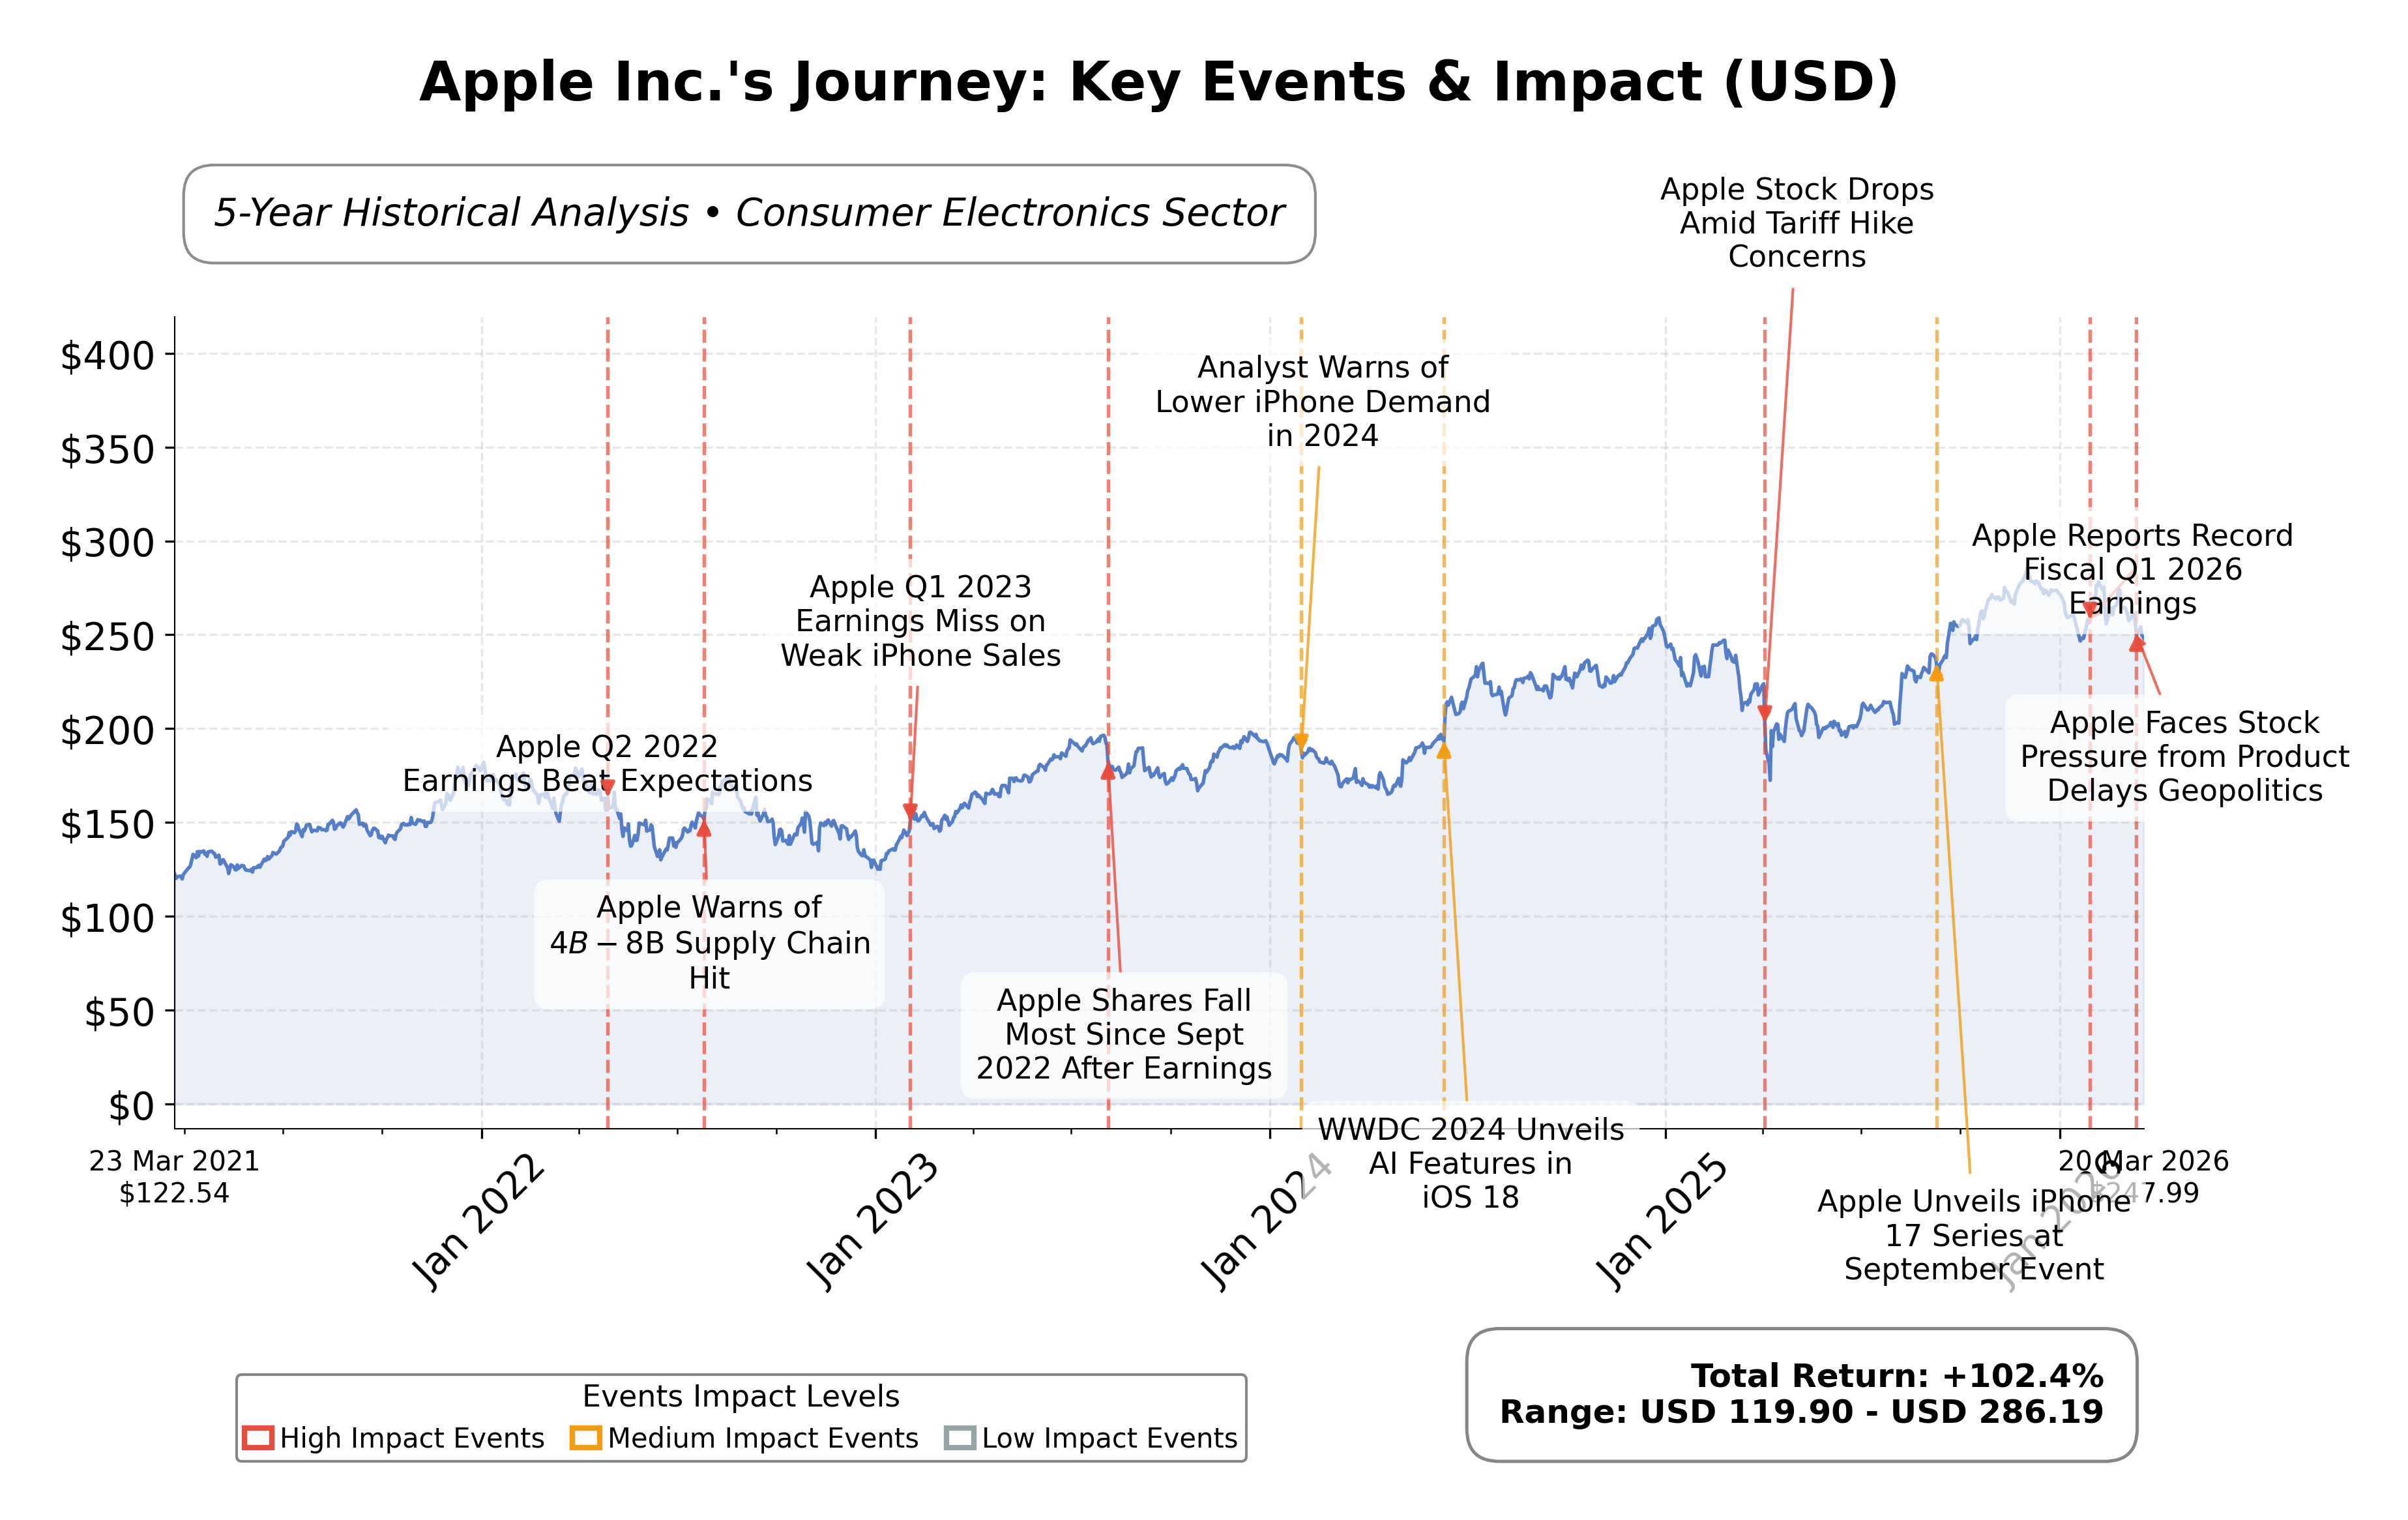
Stock Journey
Key Positives and Key Risks
Pros
- Market capitalization of $3.64 trillion reflects dominant industry position and scale.
- Revenue growth of 15.7% year-over-year indicates strong top-line momentum.
- Free cash flow of $106.3 billion supports operational flexibility and shareholder returns.
Cons
- Trailing P/E ratio of 31.5 is relatively high compared to industry peers, suggesting premium valuation.
- Debt-to-equity ratio of 102.6% indicates significant leverage that may impact financial flexibility.
Disclosure: This information is for general awareness and does not constitute investment advice
Report Summary
Apple Inc. operates as a leading technology company specializing in the design, manufacture, and marketing of consumer electronics and software products globally. Its core offerings include the iPhone, Mac computers, iPad tablets, Apple Watch, and a suite of digital services such as the App Store and Apple Music. Positioned in the consumer electronics industry within the technology sector, Apple maintains a broad global presence supported by a large workforce and extensive retail and online distribution channels.
Financially, Apple exhibits robust metrics with a market capitalization exceeding $3.64 trillion and a trailing P/E ratio of approximately 31.5, slightly above the industry average. The company reported trailing twelve months revenue of $435.6 billion with a profit margin of 27.0% and operating margin of 35.4%. Cash flow remains strong, with operating cash flow around $135.5 billion and free cash flow of $106.3 billion. The balance sheet shows total assets of $359.2 billion and a total debt of $90.5 billion, with a current ratio just below 1.0, indicating tight short-term liquidity.
From a technical and strategic perspective, Appleâs stock price currently trades near $252, below its 52-week high of $288.62, reflecting an upside potential of approximately 14.4%. The company continues to innovate with recent product launches such as the MacBook Neo and maintains leadership stability with a potential CEO succession underway. Institutional ownership remains significant at 65.3%, though some recent share sales by certain investment firms suggest mixed sentiment. Key risks include high valuation multiples and competitive pressures in consumer electronics, balanced by strengths in brand loyalty and ecosystem integration.
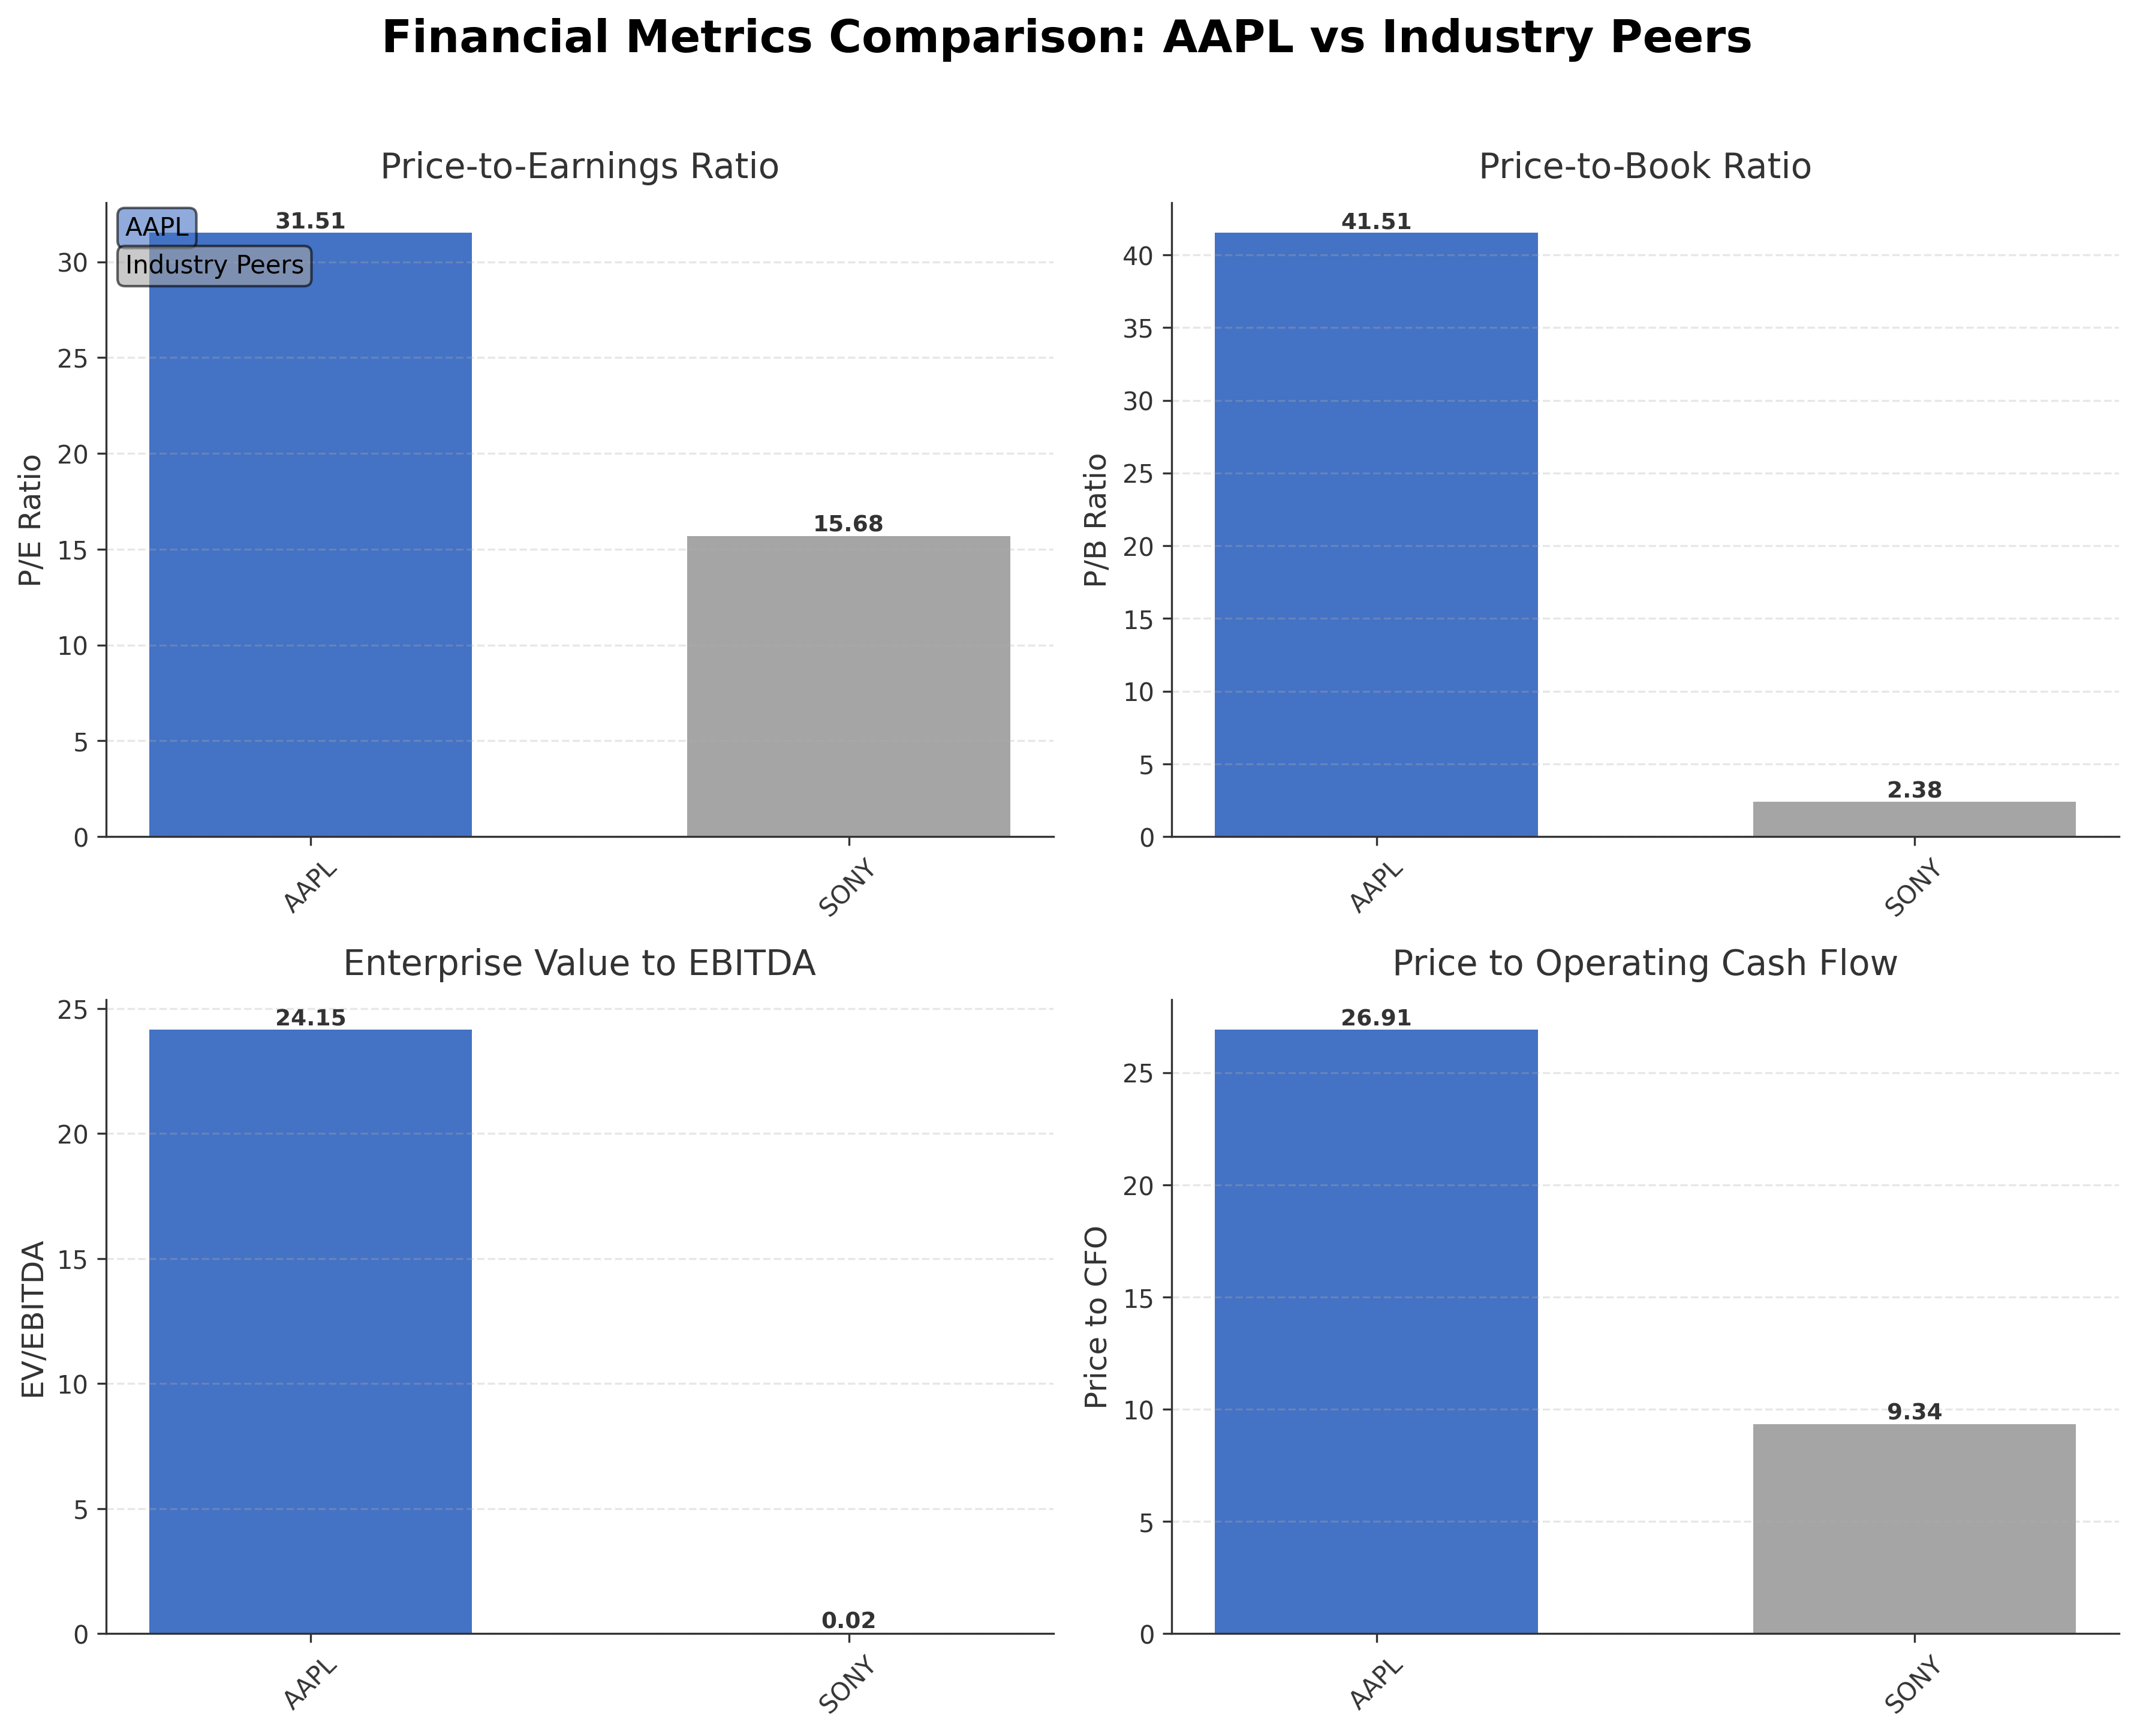
When compared to regional industry peers such as Sony Group Corporation, Appleâs valuation multiples are notably higher, with a P/E ratio of 31.5 versus Sonyâs 15.7 and a P/B ratio of 41.5 compared to Sonyâs 2.4. Appleâs market capitalization dwarfs peers at $3.64 trillion relative to Sonyâs $120 billion, reflecting its dominant market position. However, Appleâs return on equity at 1.52% is modest, albeit higher than Sonyâs 0.15%, indicating efficient capital use relative to some competitors.
Apple stands at a pivotal juncture within the consumer electronics landscape, balancing its legacy of innovation and strong financial performance against evolving market dynamics and valuation scrutiny. Recent product introductions and leadership developments underscore ongoing efforts to sustain growth and market relevance. The company faces the challenge of maintaining its competitive edge amid intensifying global competition and shifting consumer preferences. Given the current financial and market data, a measured approach that monitors valuation trends and operational execution may be appropriate for those assessing the stockâs trajectory.
Company and Industry Overview
Company Basics
Price Performance
Company Size
Shareholding Pattern
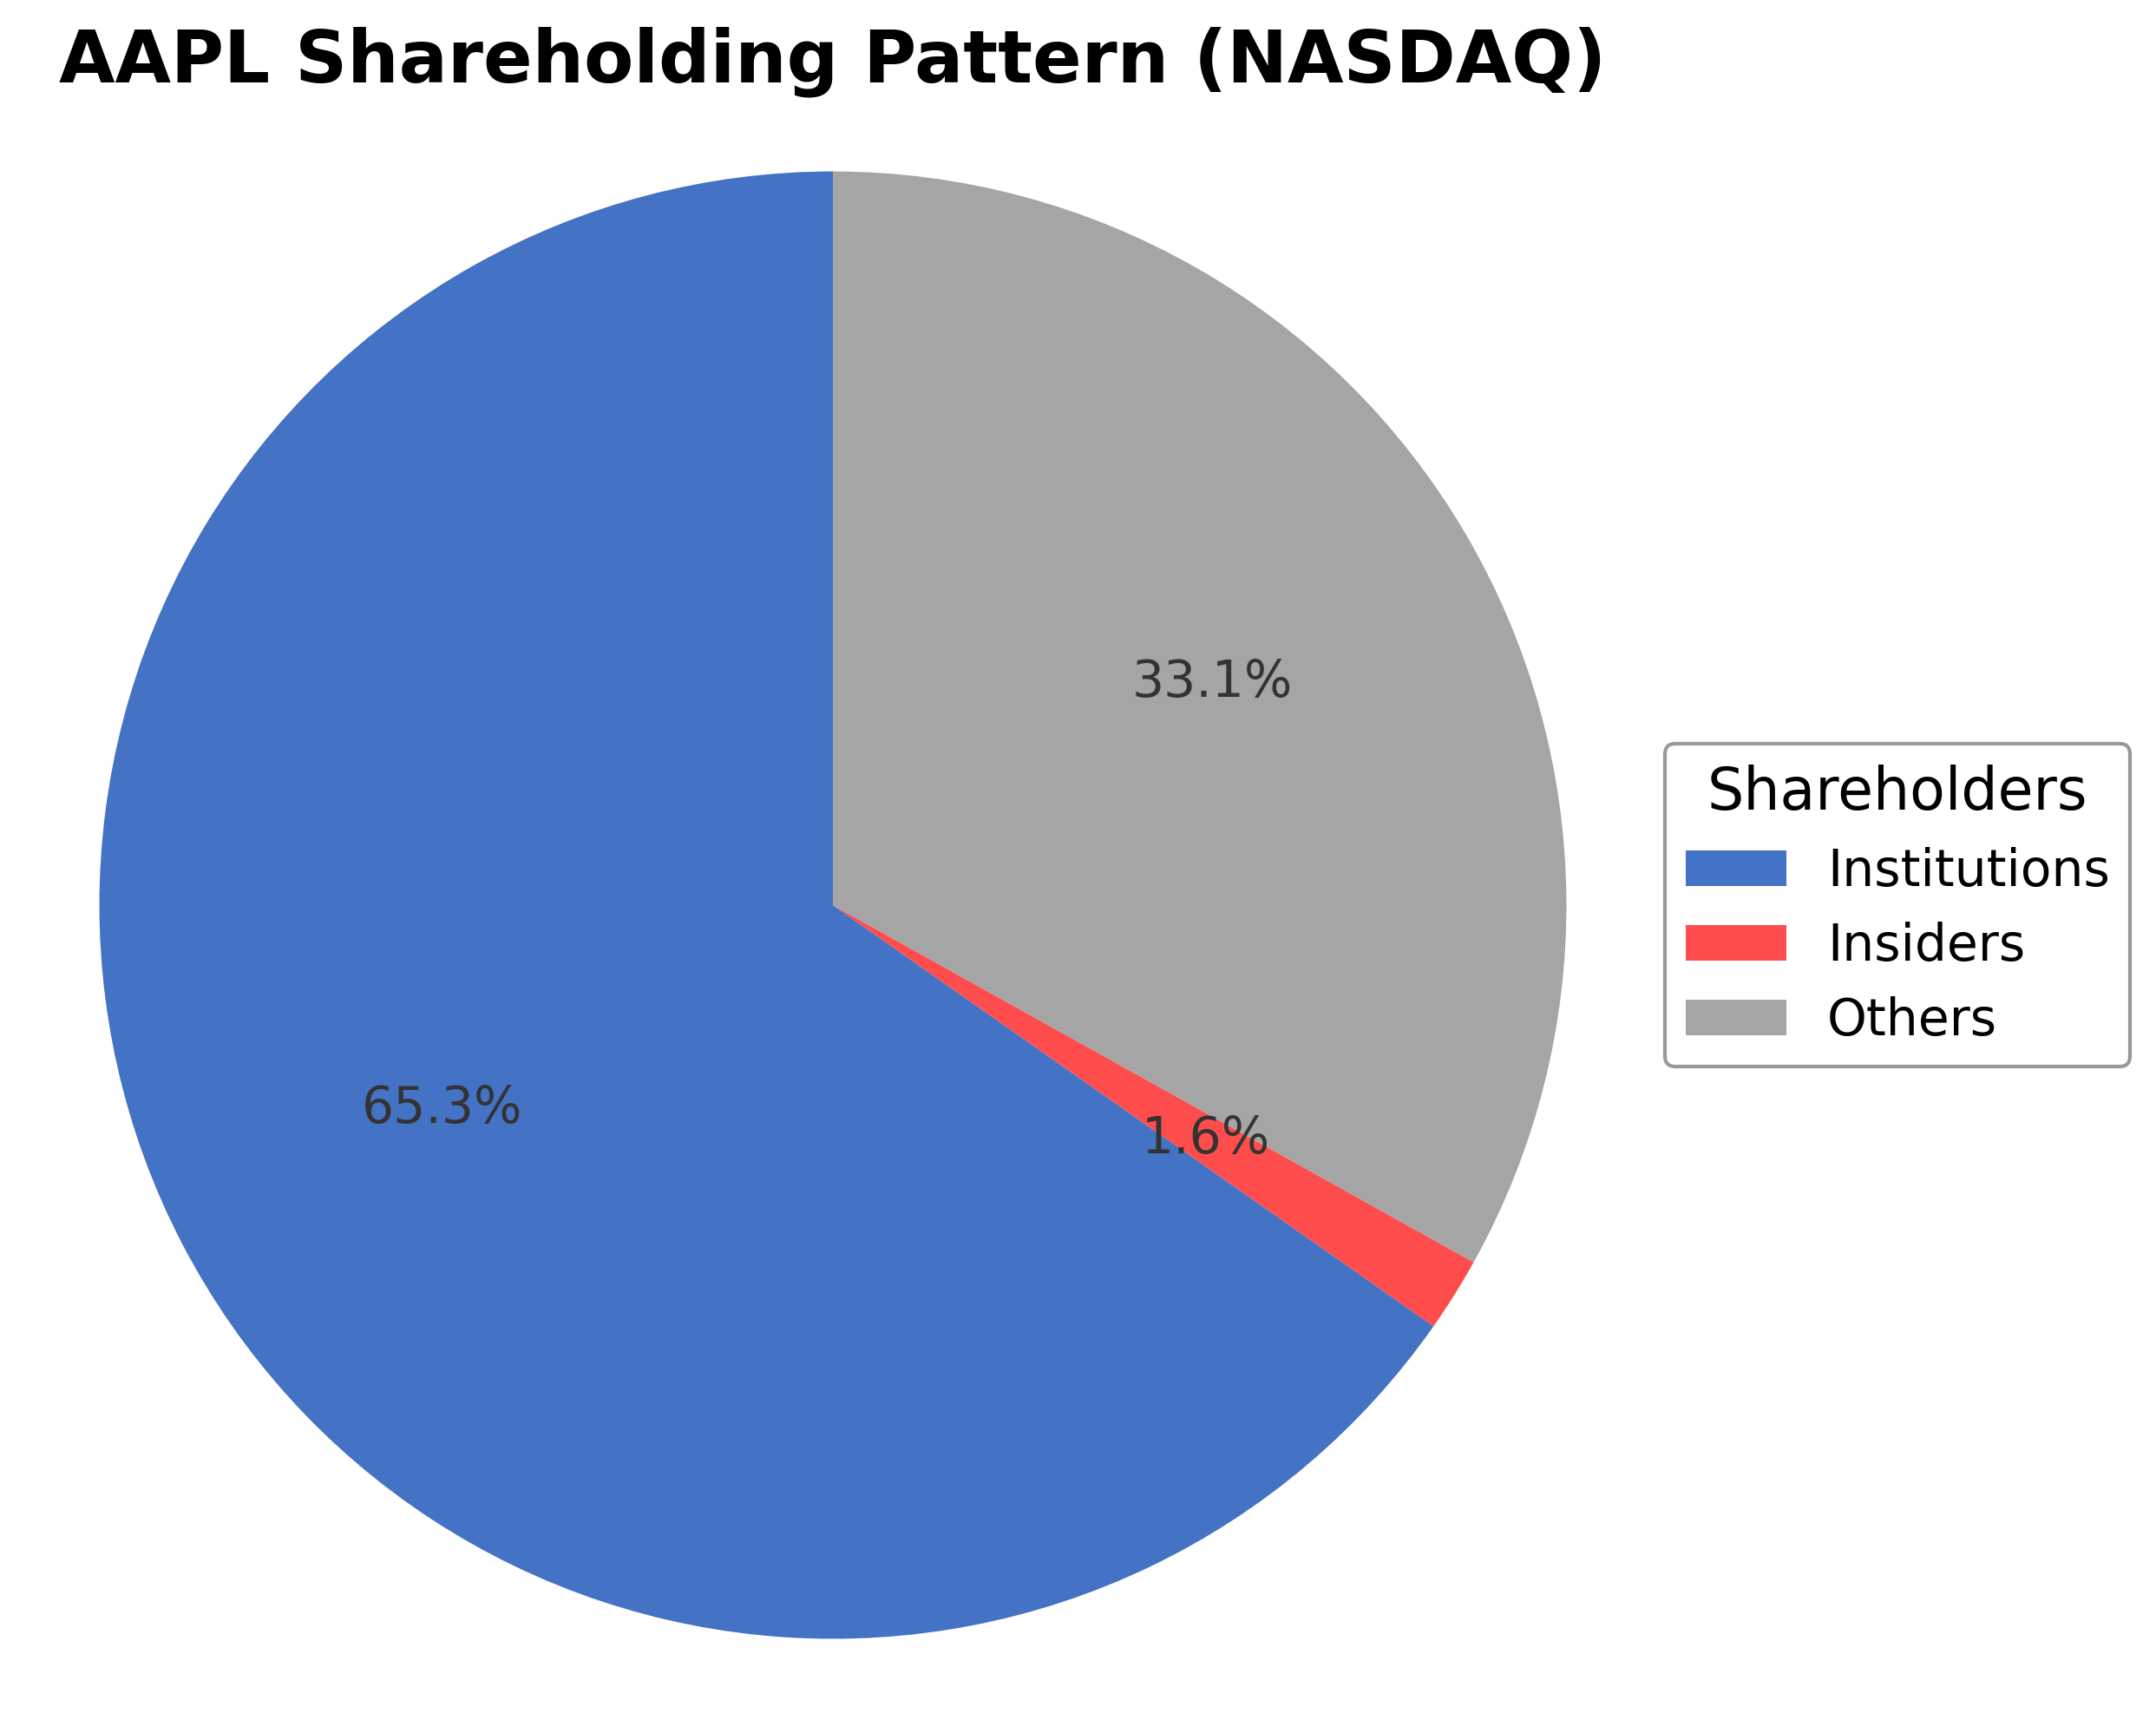
Apple Inc.'s ownership structure is characterized by a significant institutional investor presence at approximately 65.27%, reflecting strong participation from mutual funds, pension funds, and asset managers. Insider holdings, including executives and board members, represent around 1.64%, while other shareholders, encompassing retail investors and employee stock plans, account for about 34.71%. Recent filings indicate some institutional investors have moderately reduced positions, while others have increased stakes, suggesting a nuanced market sentiment. This ownership distribution supports robust governance frameworks and strategic continuity, positioning Apple to navigate competitive pressures and capitalize on growth opportunities within the consumer electronics industry.
Sector and Industry Analysis
Apple Inc. (AAPL) operates primarily within the Technology sector, specifically in the hardware and consumer electronics industry. This sector is characterized by rapid innovation, large market size, and significant global demand. The global consumer electronics market, valued in the trillions of USD, continues to grow steadily, driven by increasing smartphone penetration, demand for connected devices, and expanding digital ecosystems. Key players alongside Apple include Samsung, Microsoft, Google, and emerging Chinese manufacturers like Xiaomi and Huawei, each competing across hardware, software, and services. Apple’s integrated ecosystem—anchored by the iPhone and complemented by Mac, iPad, Apple Watch, and services such as streaming and subscription bundles—positions it strongly within this competitive landscape.
Industry trends highlight a shift toward seamless integration of hardware and software, with consumer preferences evolving toward multifunctional devices that support augmented reality (AR), artificial intelligence (AI), and Internet of Things (IoT) capabilities. Apple’s strategic investments in proprietary semiconductor design and software development reflect this trend, enabling optimized performance and user experience. Additionally, the rise of subscription services and digital content consumption presents new revenue streams beyond traditional hardware sales. Sustainability and environmental considerations are increasingly influencing product design and supply chain management, with companies adopting greener manufacturing processes and materials to meet consumer and regulatory expectations.
The regulatory environment for the technology and hardware industry is complex and multifaceted, involving data privacy laws (e.g., GDPR in Europe, CCPA in California), antitrust scrutiny, and trade policies affecting global supply chains. Apple must navigate compliance with these regulations while managing geopolitical risks, such as tariffs and export controls, particularly given its reliance on international manufacturing partners like Foxconn and TSMC. Intellectual property protection remains critical, as patent disputes and technology licensing shape competitive advantages. Additionally, evolving standards around digital content, app marketplaces, and consumer rights impact Apple’s services ecosystem and revenue models.
Competitive dynamics in the hardware and consumer electronics industry are defined by high capital intensity, rapid innovation cycles, and strong brand loyalty. Barriers to entry are significant due to the need for advanced R&D capabilities, extensive supply chain networks, and ecosystem lock-in effects. Apple’s competitive positioning benefits from its vertically integrated model, controlling design, software, and distribution channels, including its flagship retail stores. This integration facilitates premium pricing and customer retention. However, competition from lower-cost manufacturers and platform-based rivals in software and services requires continuous innovation and ecosystem expansion. The industry’s oligopolistic nature, with a few dominant players, fosters intense rivalry but also drives collaborative standards and interoperability efforts.
Note: Analysis synthesized from industry research, market reports, and regulatory filings. Information is subject to change based on market conditions.
Illustrative Scenario Analysis
DCF Assumptions:
Method: Two-Stage EPS-Priority Model
Financials
Peer Analysis
| Company Name | Market Cap | P/E Ratio | P/B Ratio | EV/EBITDA | Price to CFO |
|---|---|---|---|---|---|
| Apple Inc. | $3.64T | 31.51 | 41.51 | 24.15 | 26.91 |
| Sony Group Corporation - Sponsored American Depositary Receipt | $120.12B | 15.68 | 2.38 | 0.02 | 9.34 |
Comparison Analysis: Apple Inc. significantly outscales its regional peer Sony Group Corporation in market capitalization, reflecting its dominant industry position. Apple’s valuation multiples, including P/E and P/B ratios, are substantially higher, indicating market expectations of premium growth and profitability. The company’s EV/EBITDA and price to CFO ratios also exceed those of Sony, highlighting a higher valuation relative to cash flow and earnings. Return on equity for Apple is notably stronger, suggesting more effective capital utilization compared to its peer. These metrics collectively underscore Apple's leadership in financial scale and market valuation within the consumer electronics sector.
Financial Metrics Comparison with Peers
Financial Statements
Comprehensive financial data including income, balance sheet, and cash flow metrics
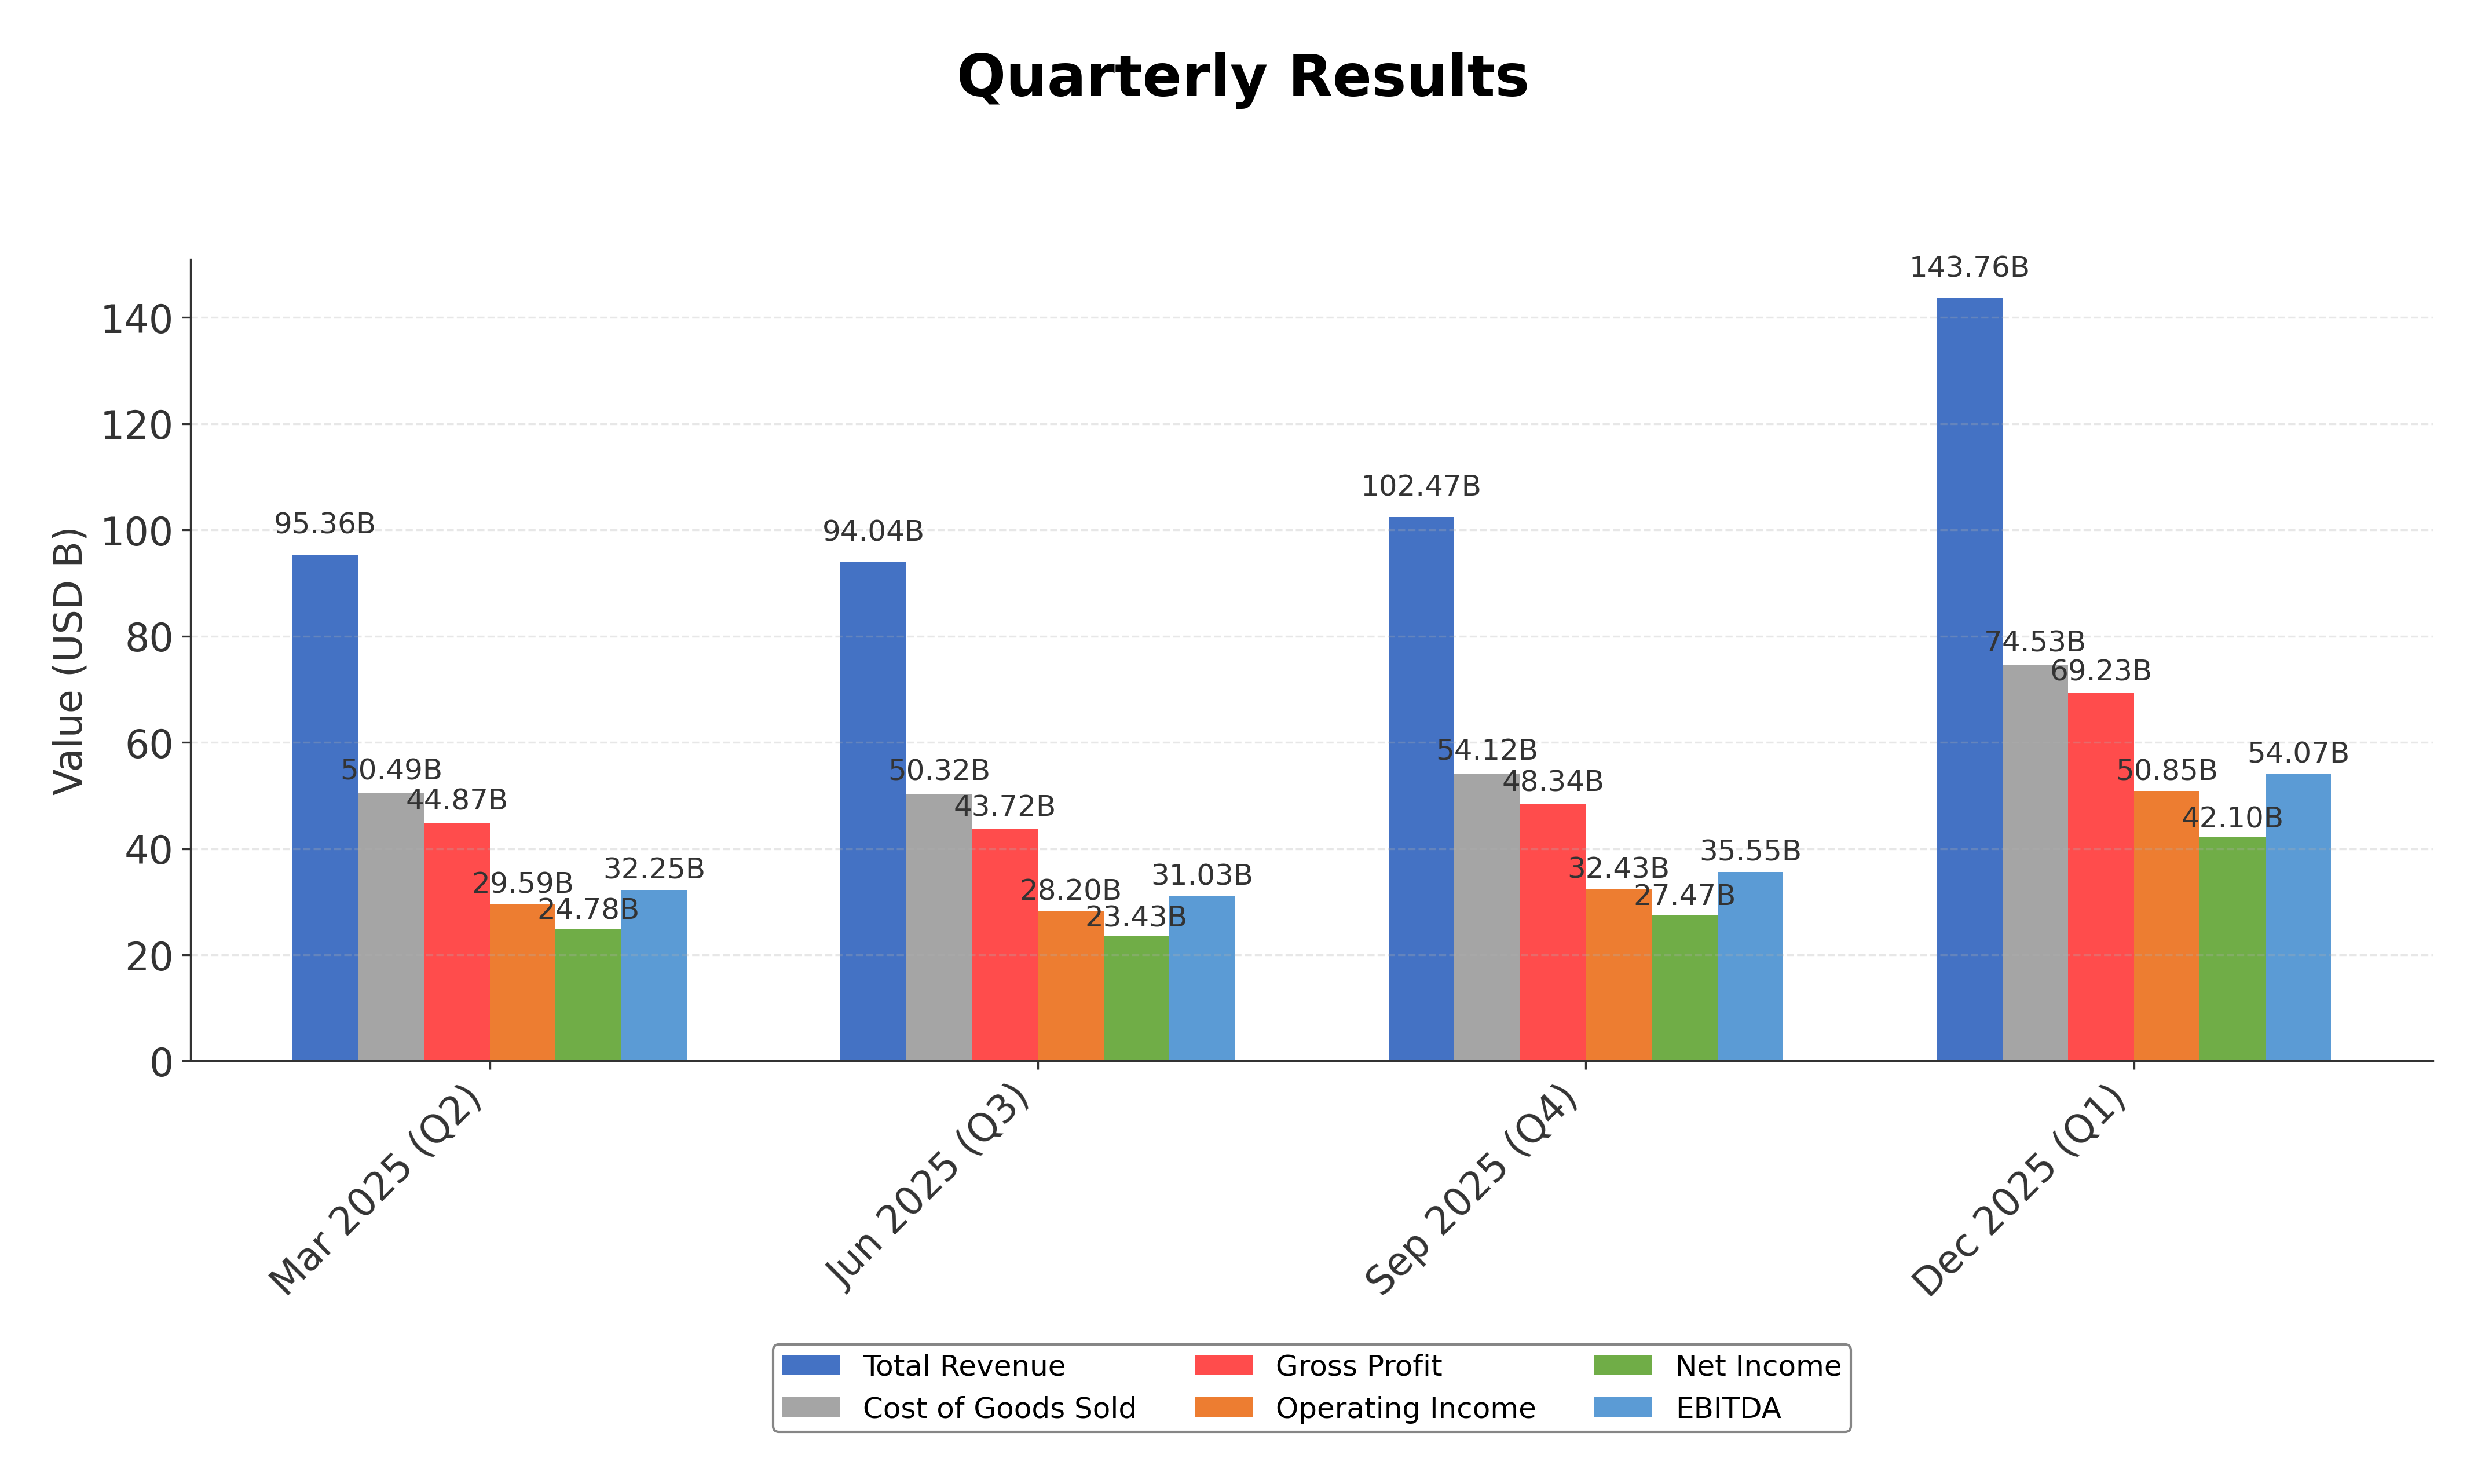
Income Statement
| fiscal_date | 2025-09-30 | 2024-09-30 | 2023-09-30 | 2022-09-30 | 2021-09-30 |
|---|---|---|---|---|---|
| Sales | 416.16B | 391.04B | 383.29B | 394.33B | 365.82B |
| Cost Of Goods | 220.96B | 210.35B | 214.14B | 223.55B | 212.98B |
| Gross Profit | 195.20B | 180.68B | 169.15B | 170.78B | 152.84B |
| Operating Expense Research And Development | 34.55B | 31.37B | 29.91B | 26.25B | 21.91B |
| Operating Expense Selling General And Administrative | 27.60B | 26.10B | 24.93B | 25.09B | 21.97B |
| Operating Income | 133.05B | 123.22B | 114.30B | 119.44B | 108.95B |
| Other Income Expense | -321.00M | 269.00M | -565.00M | -334.00M | 60.00M |
| Pretax Income | 132.73B | 123.48B | 113.74B | 119.10B | 109.21B |
| Income Tax | 20.72B | 29.75B | 16.74B | 19.30B | 14.53B |
| Net Income | 112.01B | 93.74B | 97.00B | 99.80B | 94.68B |
| Eps Basic | 7.49 | 6.11 | 6.16 | 6.15 | 5.67 |
| Eps Diluted | 7.46 | 6.08 | 6.13 | 6.11 | 5.61 |
| Basic Shares Outstanding | 14.95B | 15.34B | 15.74B | 16.22B | 16.70B |
| Diluted Shares Outstanding | 14.95B | 15.34B | 15.74B | 16.22B | 16.70B |
| Ebit | 133.05B | 123.22B | 114.30B | 119.44B | 111.85B |
| Ebitda | 144.75B | 134.66B | 125.82B | 130.54B | 123.14B |
| Net Income Continuous Operations | 112.01B | 93.74B | 97.00B | 99.80B | 94.68B |
| Non Operating Interest Income | N/A | N/A | 3.75B | 2.83B | 2.84B |
| Non Operating Interest Expense | N/A | N/A | 3.93B | 2.93B | 2.65B |
Source: Financial statements and regulatory filings
Balance Sheet
| fiscal_date | 2025-09-30 | 2024-09-30 | 2023-09-30 | 2022-09-30 | 2021-09-30 |
|---|---|---|---|---|---|
| Cash And Cash Equivalents | 35.93B | 29.94B | 29.96B | 23.65B | 34.94B |
| Accounts Receivable | 39.78B | 33.41B | 29.51B | 28.18B | 26.28B |
| Total Assets | 359.24B | 364.98B | 352.58B | 352.75B | 351.00B |
| Total Liabilities | 285.51B | 308.03B | 290.44B | 302.08B | 287.91B |
| Long Term Debt | 78.33B | 85.75B | 95.28B | 109.71B | 119.38B |
| Shareholders Equity | 73.73B | 56.95B | 62.15B | 50.67B | 63.09B |
Source: Financial statements and regulatory filings
Cash Flow Statement
| fiscal_date | 2025-09-30 | 2024-09-30 | 2023-09-30 | 2022-09-30 | 2021-09-30 |
|---|---|---|---|---|---|
| Operating Activities Net Income | 112.01B | 93.74B | 97.00B | 99.80B | 94.68B |
| Operating Activities Depreciation | 11.70B | 11.45B | 11.52B | 11.10B | 11.28B |
| Operating Activities Stock Based Compensation | 12.86B | 11.69B | 10.83B | 9.04B | 7.91B |
| Operating Activities Other Non Cash Items | -89.00M | -2.27B | -2.23B | 1.01B | -4.92B |
| Operating Activities Accounts Receivable | -7.03B | -5.14B | -417.00M | -9.34B | -14.03B |
| Operating Activities Accounts Payable | 902.00M | 6.02B | -1.89B | 9.45B | 12.33B |
| Operating Activities Other Assets Liabilities | -18.87B | 2.77B | -4.27B | 1.57B | -1.53B |
| Operating Activities Operating Cash Flow | 111.48B | 118.25B | 110.54B | 123.52B | 100.94B |
| Investing Activities Capital Expenditures | -12.71B | -9.45B | -10.96B | -10.71B | -11.09B |
| Investing Activities Purchase Of Investments | -24.41B | -48.66B | -29.51B | -76.92B | -109.56B |
| Investing Activities Sale Of Investments | 53.80B | 62.35B | 45.51B | 67.36B | 106.48B |
| Investing Activities Other Investing Activity | -1.48B | -1.31B | -1.34B | -2.09B | -385.00M |
| Investing Activities Investing Cash Flow | 15.20B | 2.94B | 3.71B | -22.66B | -14.58B |
| Financing Activities Long Term Debt Issuance | 4.48B | 0.00 | 5.23B | 5.46B | 20.39B |
| Financing Activities Long Term Debt Payments | -10.93B | -9.96B | -11.15B | -9.54B | -8.75B |
| Financing Activities Short Term Debt Issuance | -2.03B | 3.96B | -3.98B | 3.96B | 1.02B |
| Financing Activities Common Stock Repurchase | -90.71B | -94.95B | -77.55B | -89.40B | -85.97B |
| Financing Activities Common Dividends | -15.42B | -15.23B | -15.03B | -14.84B | -14.47B |
| Financing Activities Other Financing Charges | -6.07B | -5.80B | -6.01B | -6.38B | -5.58B |
| Financing Activities Financing Cash Flow | -120.69B | -121.98B | -108.49B | -110.75B | -92.25B |
| End Cash Position | 35.93B | 29.94B | 30.74B | 24.98B | 35.93B |
| Income Tax Paid | 43.37B | 26.10B | 18.68B | 19.57B | 25.39B |
| Free Cash Flow | 98.77B | 108.81B | 99.58B | 111.44B | 92.95B |
| Interest Paid | N/A | N/A | 3.80B | 2.87B | 2.69B |
| Operating Activities Deferred Taxes | N/A | N/A | N/A | 895.00M | -4.77B |
| Investing Activities Net Acquisitions | N/A | N/A | N/A | -306.00M | -33.00M |
| Financing Activities Common Stock Issuance | N/A | N/A | N/A | N/A | 1.10B |
Source: Financial statements and regulatory filings
Technical Analysis
Key Insights
- The current trend shows Apple’s stock trading below its 52-week high, indicating a consolidation phase with potential for upward movement.
- Key support levels are observed near $169.21 (52-week low) and around the 200-day moving average at approximately $246.36; resistance is near the 52-week high at $288.62.
- The stock price is above the 200-day moving average ($246.36) and 50-day moving average ($261.64), but below the 10-day moving average, suggesting mixed short-term momentum.
- Momentum indicators show a moderate RSI, MACD near the signal line, and stochastic oscillators indicating neither overbought nor oversold conditions.
- Across daily, weekly, and monthly timeframes, the stock exhibits a stable to slightly bullish pattern with no extreme volatility.
- Current technical setup suggests a market scenario where the stock may test resistance levels while maintaining support, pending broader market influences.
Trending News
1. Headline: Apple Stock Is Doing Something It Hasn't Done Since 2022. Should You Buy or Run? | The Motley Fool
Summary: Apple ended the quarter with $45.3 billion in cash and cash equivalents, up from $30.3 billion a year ago. The company reported $54 billion in operating cash flow, and returned nearly $32 billion to shareholders through dividends and stock repurchases. It issued guidance for the second quarter for revenue to continue to grow at a rate of 13% to 16%. The company is continuing to roll out new products, including ...
Sentiment: positive
2. Headline: Apple Inc. $AAPL Shares Sold by Strategic Investment Advisors MI
Summary: Strategic Investment Advisors MI lessened its stake in Apple Inc. (NASDAQ:AAPL - Free Report) by 5.0% in the third quarter, according to the company in its most recent 13F filing with the Securities & Exchange Commission. The firm owned 75,335 shares of the iPhone maker's stock after selling 3,
Sentiment: positive
3. Headline: Apple Inc. $AAPL is Narus Financial Partners LLC's 5th Largest Position
Summary: Narus Financial Partners LLC reduced its stake in Apple Inc. (NASDAQ:AAPL - Free Report) by 43.4% during the third quarter, according to the company in its most recent Form 13F filing with the Securities and Exchange Commission. The fund owned 10,532 shares of the iPhone maker's stock after selling
Sentiment: negative
4. Headline: Lindenwold Advisors INC Has $7.90 Million Stock Holdings in Apple Inc. $AAPL
Summary: Lindenwold Advisors INC lessened its stake in shares of Apple Inc. (NASDAQ:AAPL - Free Report) by 20.4% in the third quarter, according to the company in its most recent Form 13F filing with the SEC. The firm owned 31,023 shares of the iPhone maker's stock after selling 7,935 shares during the quar
Sentiment: positive
5. Headline: Apple Inc. $AAPL is Mirabella Financial Services LLP's 9th Largest Position
Summary: Mirabella Financial Services LLP boosted its holdings in shares of Apple Inc. (NASDAQ:AAPL - Free Report) by 118.6% during the third quarter, according to the company in its most recent disclosure with the Securities & Exchange Commission. The institutional investor owned 92,027 shares of the
Sentiment: positive
6. Headline: GAMMA Investing LLC Acquires 38,760 Shares of Apple Inc. $AAPL
Summary: GAMMA Investing LLC boosted its holdings in Apple Inc. (NASDAQ:AAPL - Free Report) by 12.2% in the 4th quarter, according to the company in its most recent 13F filing with the Securities and Exchange Commission (SEC). The fund owned 356,266 shares of the iPhone maker's stock after purchasing an add
Sentiment: positive
7. Headline: Cape Investment Advisory Inc. Sells 15,615 Shares of Apple Inc. $AAPL
Summary: Cape Investment Advisory Inc. reduced its holdings in Apple Inc. (NASDAQ:AAPL - Free Report) by 79.6% in the 3rd quarter, according to the company in its most recent filing with the SEC. The firm owned 4,002 shares of the iPhone maker's stock after selling 15,615 shares during the quarter. Apple ma
Sentiment: negative
8. Headline: Apple Inc. $AAPL Shares Bought by AIA Group Ltd
Summary: AIA Group Ltd lifted its holdings in Apple Inc. (NASDAQ:AAPL - Free Report) by 80.0% during the third quarter, according to the company in its most recent filing with the SEC. The fund owned 296,426 shares of the iPhone maker's stock after buying an additional 131,738 shares during the quarter. App
Sentiment: positive
9. Headline: Is Apple Stock Going to $500? Here's What Has to Happen. | The Motley Fool
Summary: Apple's (AAPL 0.38%) past is defined by its winning performance. Shares have skyrocketed a jaw-dropping 953%, including dividends, in the last decade (as of March 17). This is impressive given the scale of the business.
Sentiment: positive
10. Headline: Halide co-founder is suing former partner Sebastiaan de With for taking source code to Apple
Summary: Sebastiaan de With was allegedly fired for financial misconduct before joining Apple. ... Halide running on an iPhone. Photo: Allison Johnson / The Verge ... See All by Terrence O'Brien is the Verge’s weekend editor. He has over 18 years of experience, including 10 years as managing editor ...
Sentiment: neutral
Recent Updates
News Summary
Recent news highlights Apple's strategic product expansion with the launch of the MacBook Neo, positioned as an affordable AI-capable computer targeting the low-end laptop market and challenging Windows PCs and Chromebooks. Institutional activity shows mixed movements with some firms decreasing holdings while others increase stakes, reflecting nuanced market engagement. Leadership transition is underway with John Ternus identified as the likely next CEO, marking a significant succession phase as the company approaches its 50th anniversary. These developments collectively emphasize Apple's focus on innovation, market penetration, and governance continuity amid evolving competitive dynamics.
News Sentiment
The overall sentiment across recent updates is moderately positive to neutral, with product launches and leadership news contributing positively, while shareholding adjustments by some institutional investors introduce a balanced tone. Sentiment trends suggest cautious optimism about Apple's growth prospects and strategic direction, tempered by typical market fluctuations and governance transitions.
Analytical Overview
Analysis Summary
Valuation Metrics: Apple's trailing P/E ratio of 31.5 slightly exceeds the consumer electronics industry average of 31.5, while the forward P/E of 26.7 suggests expectations of moderated earnings growth relative to peers.
Growth Trajectory: Revenue growth stands at 15.7% year-over-year, supported by strong operating cash flow of $135.5 billion and free cash flow exceeding $106 billion, indicating a healthy growth trajectory.
Financial Health: The company maintains a total debt of approximately $90.5 billion against cash reserves of $66.9 billion, with a debt-to-equity ratio of 102.6%, reflecting a leveraged but manageable financial position supported by robust cash flows.
Sector Specific Factors: Apple faces sector challenges including intense competition and rapid technological change, balanced by opportunities in AI integration and expanding digital services.
Market Positioning: The company’s dominant market position, extensive ecosystem, and strong brand equity provide competitive advantages in the global consumer electronics market.
Investment Conclusion
Supporting Factors: Robust revenue and cash flow growth underpinning operational strength.
Risk Factors: High valuation multiples relative to industry peers.
SWOT Analysis
Strengths
- Market leadership with a diversified product and services ecosystem.
- Strong brand recognition and customer loyalty worldwide.
- Robust cash flow generation supporting investment and shareholder returns.
- Extensive global distribution and retail presence.
Weaknesses
- High valuation multiples may limit near-term price appreciation.
- Relatively high debt-to-equity ratio compared to some peers.
- Current ratio below 1.0 indicating tight short-term liquidity.
- Dependence on flagship products like the iPhone for majority of revenue.
Opportunities
- Expansion into AI-enabled devices and services.
- Growth potential in emerging markets and low-end laptop segments.
- Increasing subscription services and digital content offerings.
- Potential benefits from leadership succession and strategic initiatives.
Threats
- Intense competition from global consumer electronics manufacturers.
- Rapid technological changes requiring continuous innovation.
- Regulatory and geopolitical risks impacting global operations.
- Market sensitivity to valuation and macroeconomic conditions.
Company Description
Apple Inc. is a leading technology company renowned for designing, manufacturing, and marketing innovative hardware and software products for consumers and businesses worldwide. Its flagship product, the iPhone, accounts for the majority of sales, serving as the central hub of an expansive ecosystem that includes Mac computers, iPad tablets, Apple Watch wearables, and accessories like AirPods. Apple Inc. also offers a suite of services such as the App Store, Apple Music, iCloud, Apple TV+, and Apple Fitness+, providing digital content, cloud storage, and subscription-based platforms. Operating in the consumer electronics industry within the technology sector, the company employs approximately 166,000 people and maintains a broad global presence through online stores, retail outlets, and partnerships with carriers and resellers. With a substantial market capitalization reflecting its scale, Apple Inc. plays a pivotal role in shaping consumer technology trends, emphasizing seamless integration across devices and services to enhance user experience and productivity.