
Apple Inc (AAPL)
Stock Analysis Report
Stock Journey
Key Positives and Key Risks
Pros
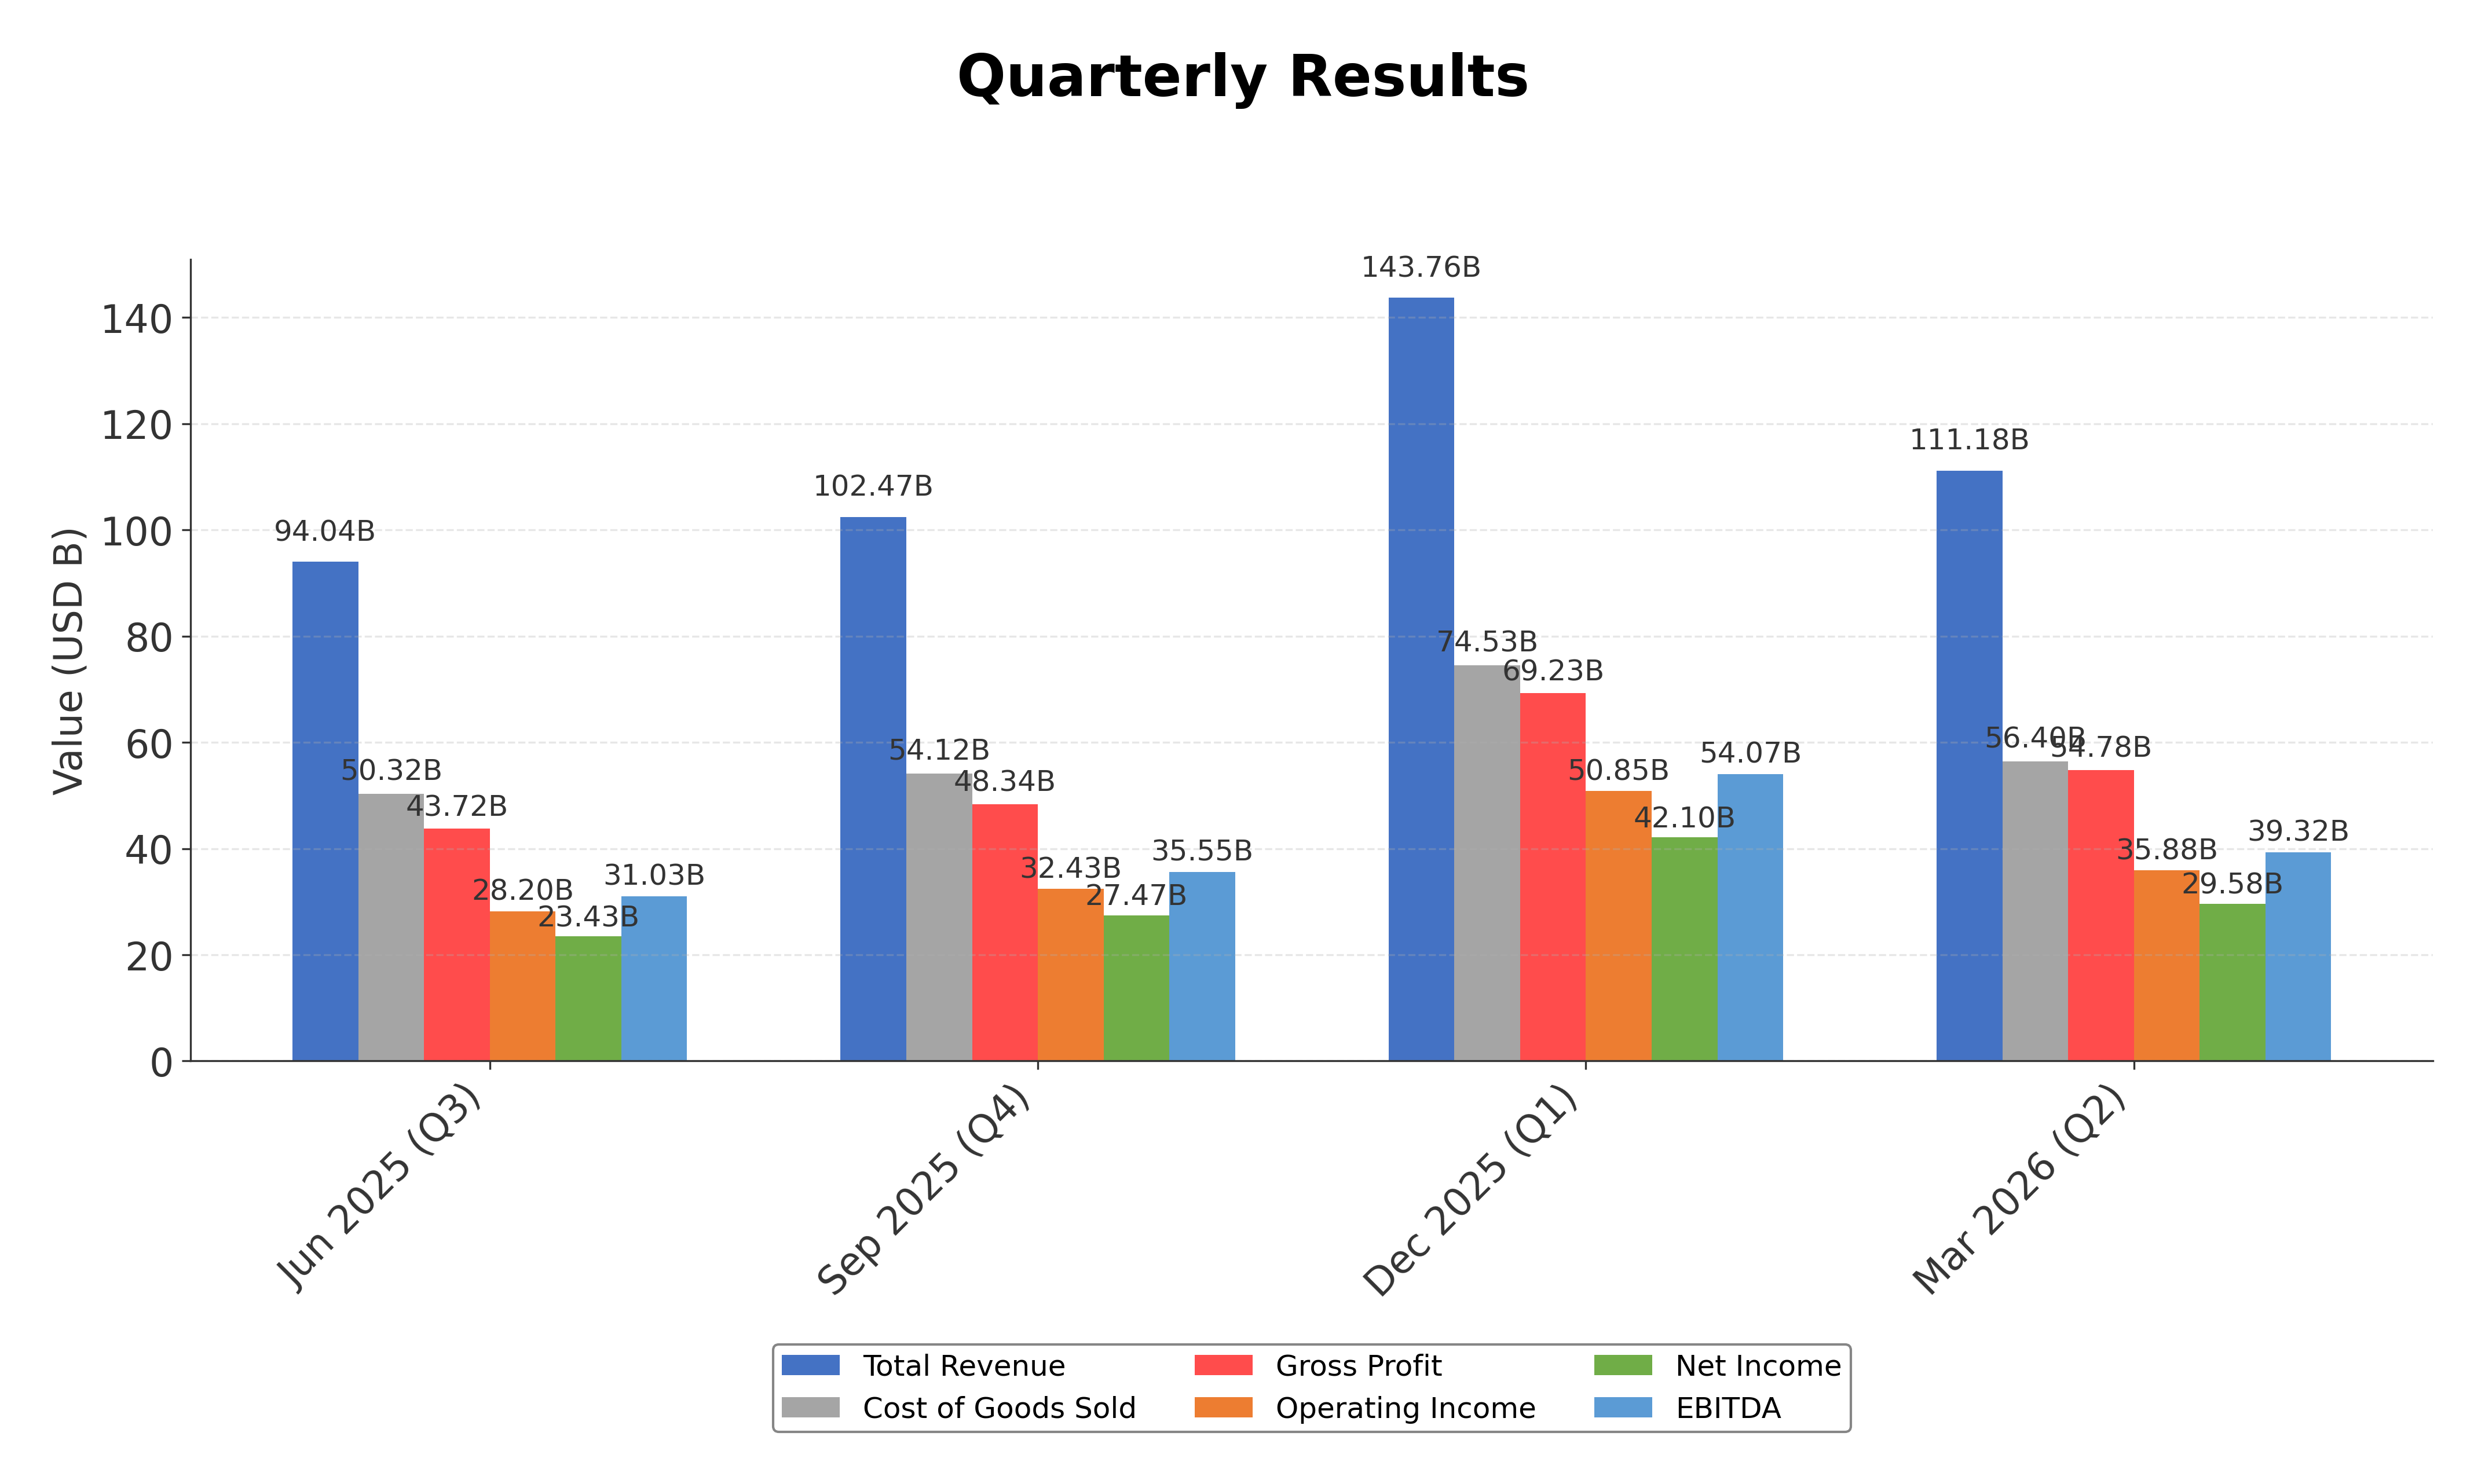
- Strong revenue growth of 16.6% quarterly and 17% year-over-year sales increase driven by iPhone demand.
- Robust free cash flow generation of approximately $101.1 billion supporting strategic investments and innovation.
- Dominant market capitalization of $4.31 trillion reflecting scale and investor confidence.
Cons
- High trailing P/E ratio of 35.47 and P/B ratio of 40.40 indicating premium valuation levels.
- Total debt to equity ratio near 79.55% reflecting moderate leverage.
- Potential margin pressure from rising memory costs and regulatory risks impacting profitability.
Disclosure: This information is for general awareness and does not constitute investment advice
Report Summary
Apple Inc. is a leading technology company listed on NASDAQ under the symbol AAPL, operating primarily in the consumer electronics sector within the technology industry. The company designs, manufactures, and markets a broad range of innovative hardware and software products including the iPhone, Mac computers, iPad tablets, Apple Watch, and various accessories. Additionally, Apple provides digital services such as the App Store, Apple Music, iCloud, and Apple TV+, positioning itself as a dominant player in the global consumer technology market with a significant ecosystem that integrates hardware and services.
Financially, Apple reported trailing twelve months (TTM) revenue of approximately $451.4 billion with a gross margin of 49.3%, operating margin of 32.3%, and net profit margin of 27.2%, reflecting strong profitability and operational efficiency. The company’s return on equity (ROE) stands at 141.47%, and return on assets (ROA) at 26.23%, indicating exceptional capital utilization and asset efficiency. Operating cash flow for the TTM period was $140.2 billion, with free cash flow of $101.1 billion, underscoring robust cash generation capacity.
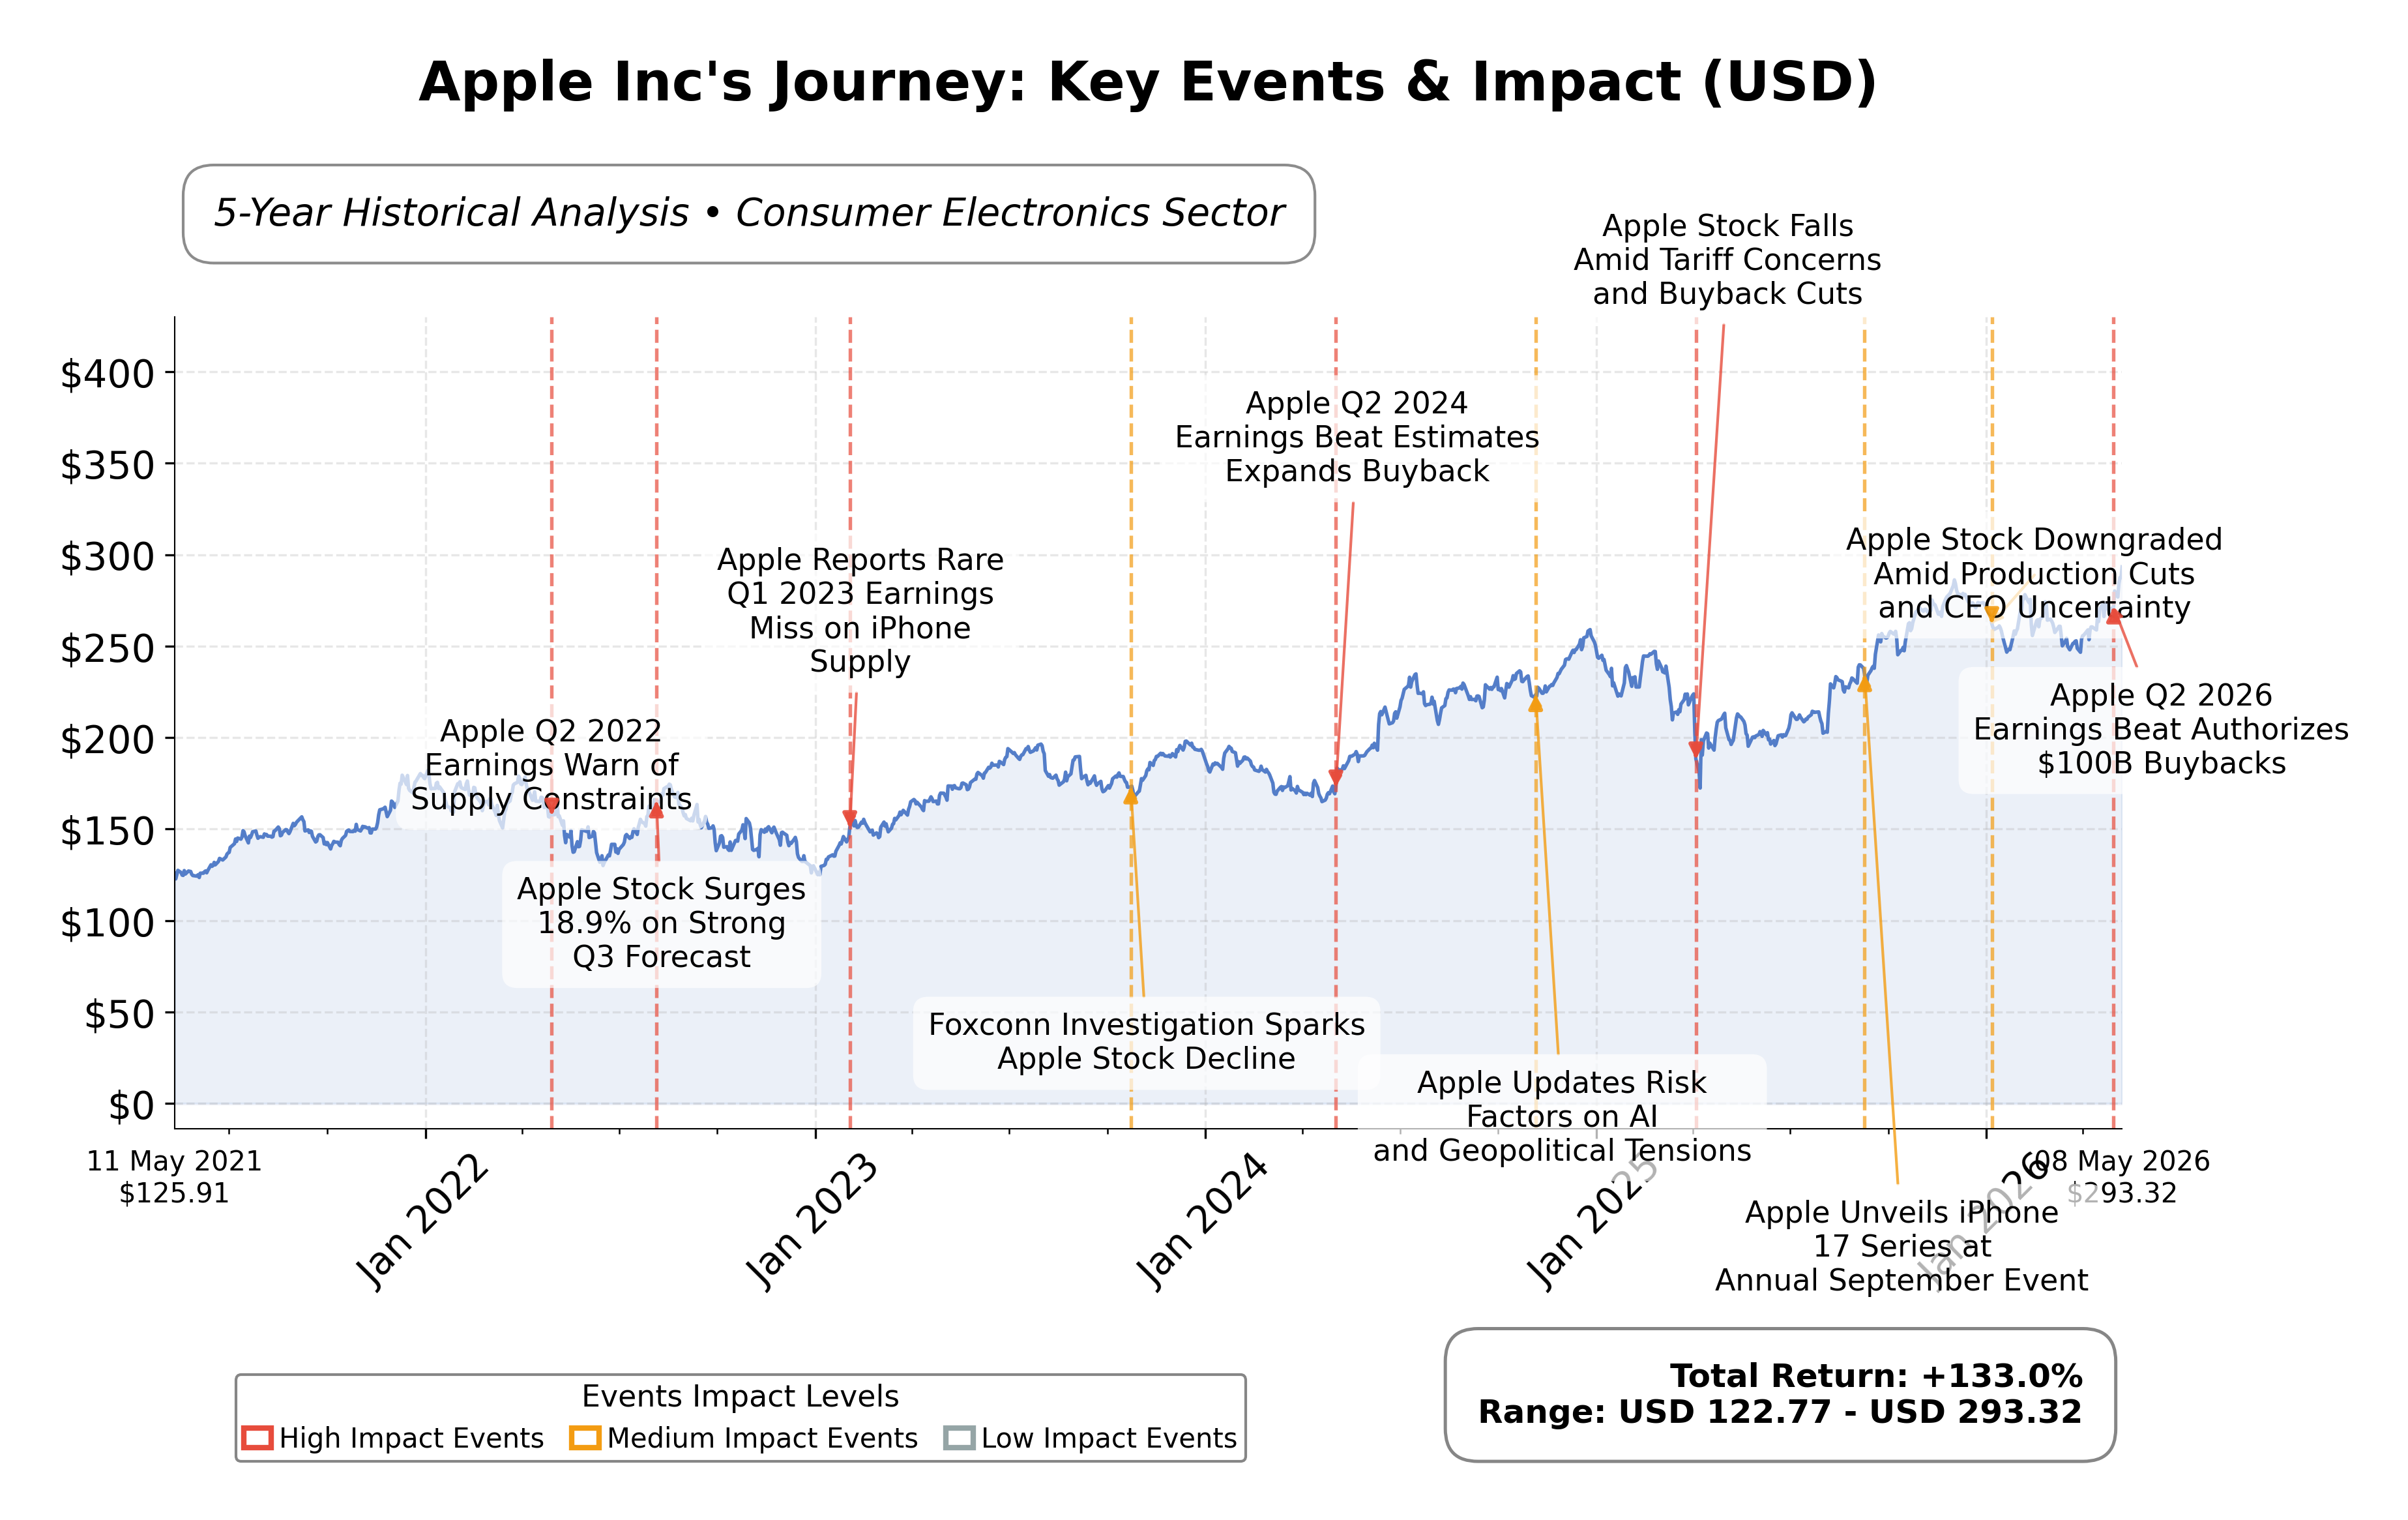
Apple’s valuation metrics show a trailing price-to-earnings (P/E) ratio of 35.47 and a forward P/E of 30.68, with a price-to-book (P/B) ratio of 40.40 and enterprise value to EBITDA (EV/EBITDA) of 27.03. The company’s market capitalization is approximately $4.31 trillion, reflecting its status as one of the largest publicly traded companies globally. The stock price currently trades near $292.75, close to its 52-week high of $294.76, well above the 52-week low of $193.46, indicating strong market confidence.
Key strengths include Apple’s dominant market position, strong cash flow generation, and a relatively manageable debt level with a total debt to equity ratio of 79.55%. The company’s strategic initiatives such as potential chip supply partnerships with Intel and leadership continuity under CEO Tim Cook contribute to its competitive edge. Risks include regulatory scrutiny, competitive pressures in technology and semiconductor sectors, and margin pressures from rising memory costs as noted in recent earnings commentary.
Technically, Apple’s stock is exhibiting an upward trend, trading above its 50-day and 200-day moving averages, with momentum indicators suggesting sustained strength across multiple timeframes. Recent news highlights optimism around AI integration and strategic partnerships, although some caution remains due to valuation levels and external risks. Overall, the data suggests a market environment where stakeholders may consider monitoring developments closely while recognizing the company’s strong fundamentals and innovation-driven growth trajectory.
Company and Industry Overview
Company Basics
Price Performance
Company Size
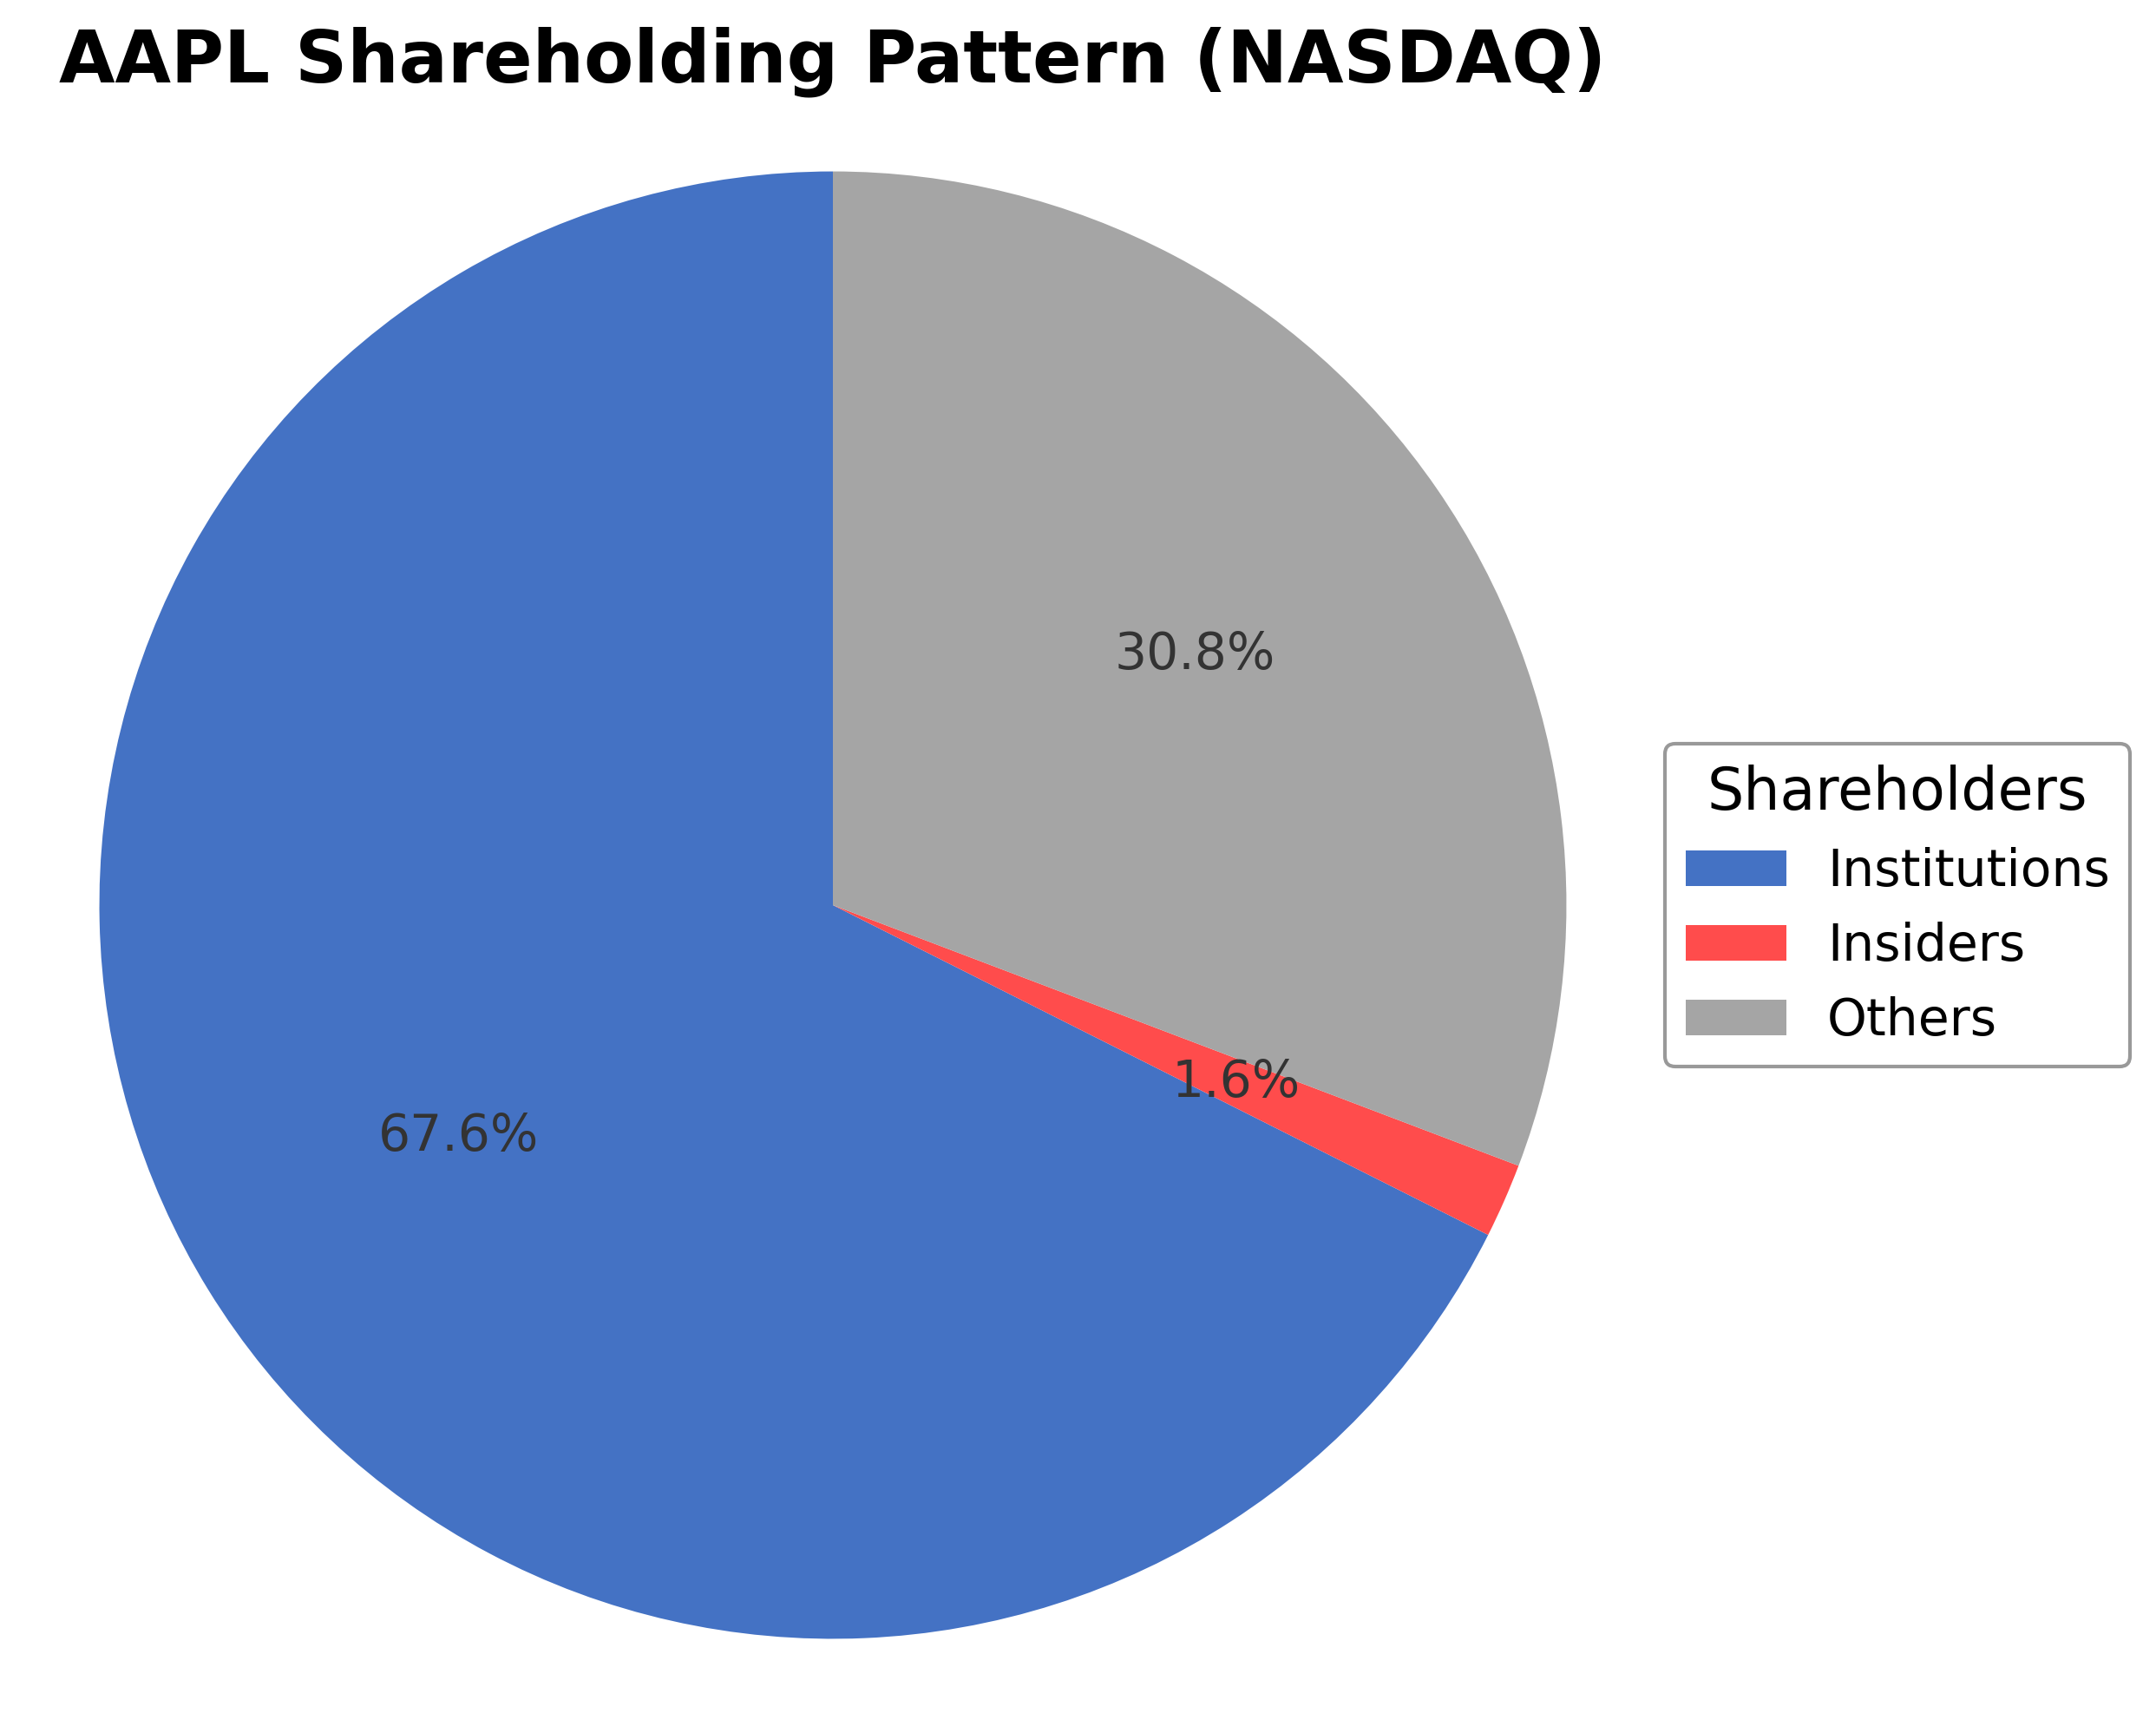
Shareholding Pattern
Sector and Industry Analysis
The global apple market is projected to grow by approximately USD 15.94 billion between 2024 and 2029, with a compound annual growth rate (CAGR) of 3.4%. This growth is supported by increasing consumer demand for superfoods and health-conscious products. Key players in the market include Auvil Fruit Co. Inc., Batlow Fruit Co. Pty Ltd, and Stemilt Growers LLC, among others, which collectively shape the competitive landscape.
Industry trends highlight the rising popularity of urban farming and the expansion of retail sectors, including private-label brands, which are driving demand. The market faces moderate barriers to entry due to established vendor presence and supply chain complexities. Competitive dynamics are influenced by product differentiation, pricing strategies, and distribution channels, with offline and online sales both playing significant roles.
The regulatory environment governing the apple market emphasizes food safety, quality standards, and import-export controls, which vary by region. Compliance with these regulations is critical for market participants to maintain access to key geographic markets such as North America, Europe, and APAC. Ongoing regulatory scrutiny is expected to influence operational practices and product offerings, shaping the market outlook through 2029.
Note: Analysis synthesized from industry research, market reports, and regulatory filings. Information is subject to change based on market conditions.
Financial Ratios Dashboard
Illustrative Scenario Analysis
DCF Assumptions:
Method: Two-Stage EPS-Priority Model
Financials
Peer Analysis
| Company Name | Market Cap | P/E Ratio | P/B Ratio | EV/EBITDA | Price to CFO |
|---|---|---|---|---|---|
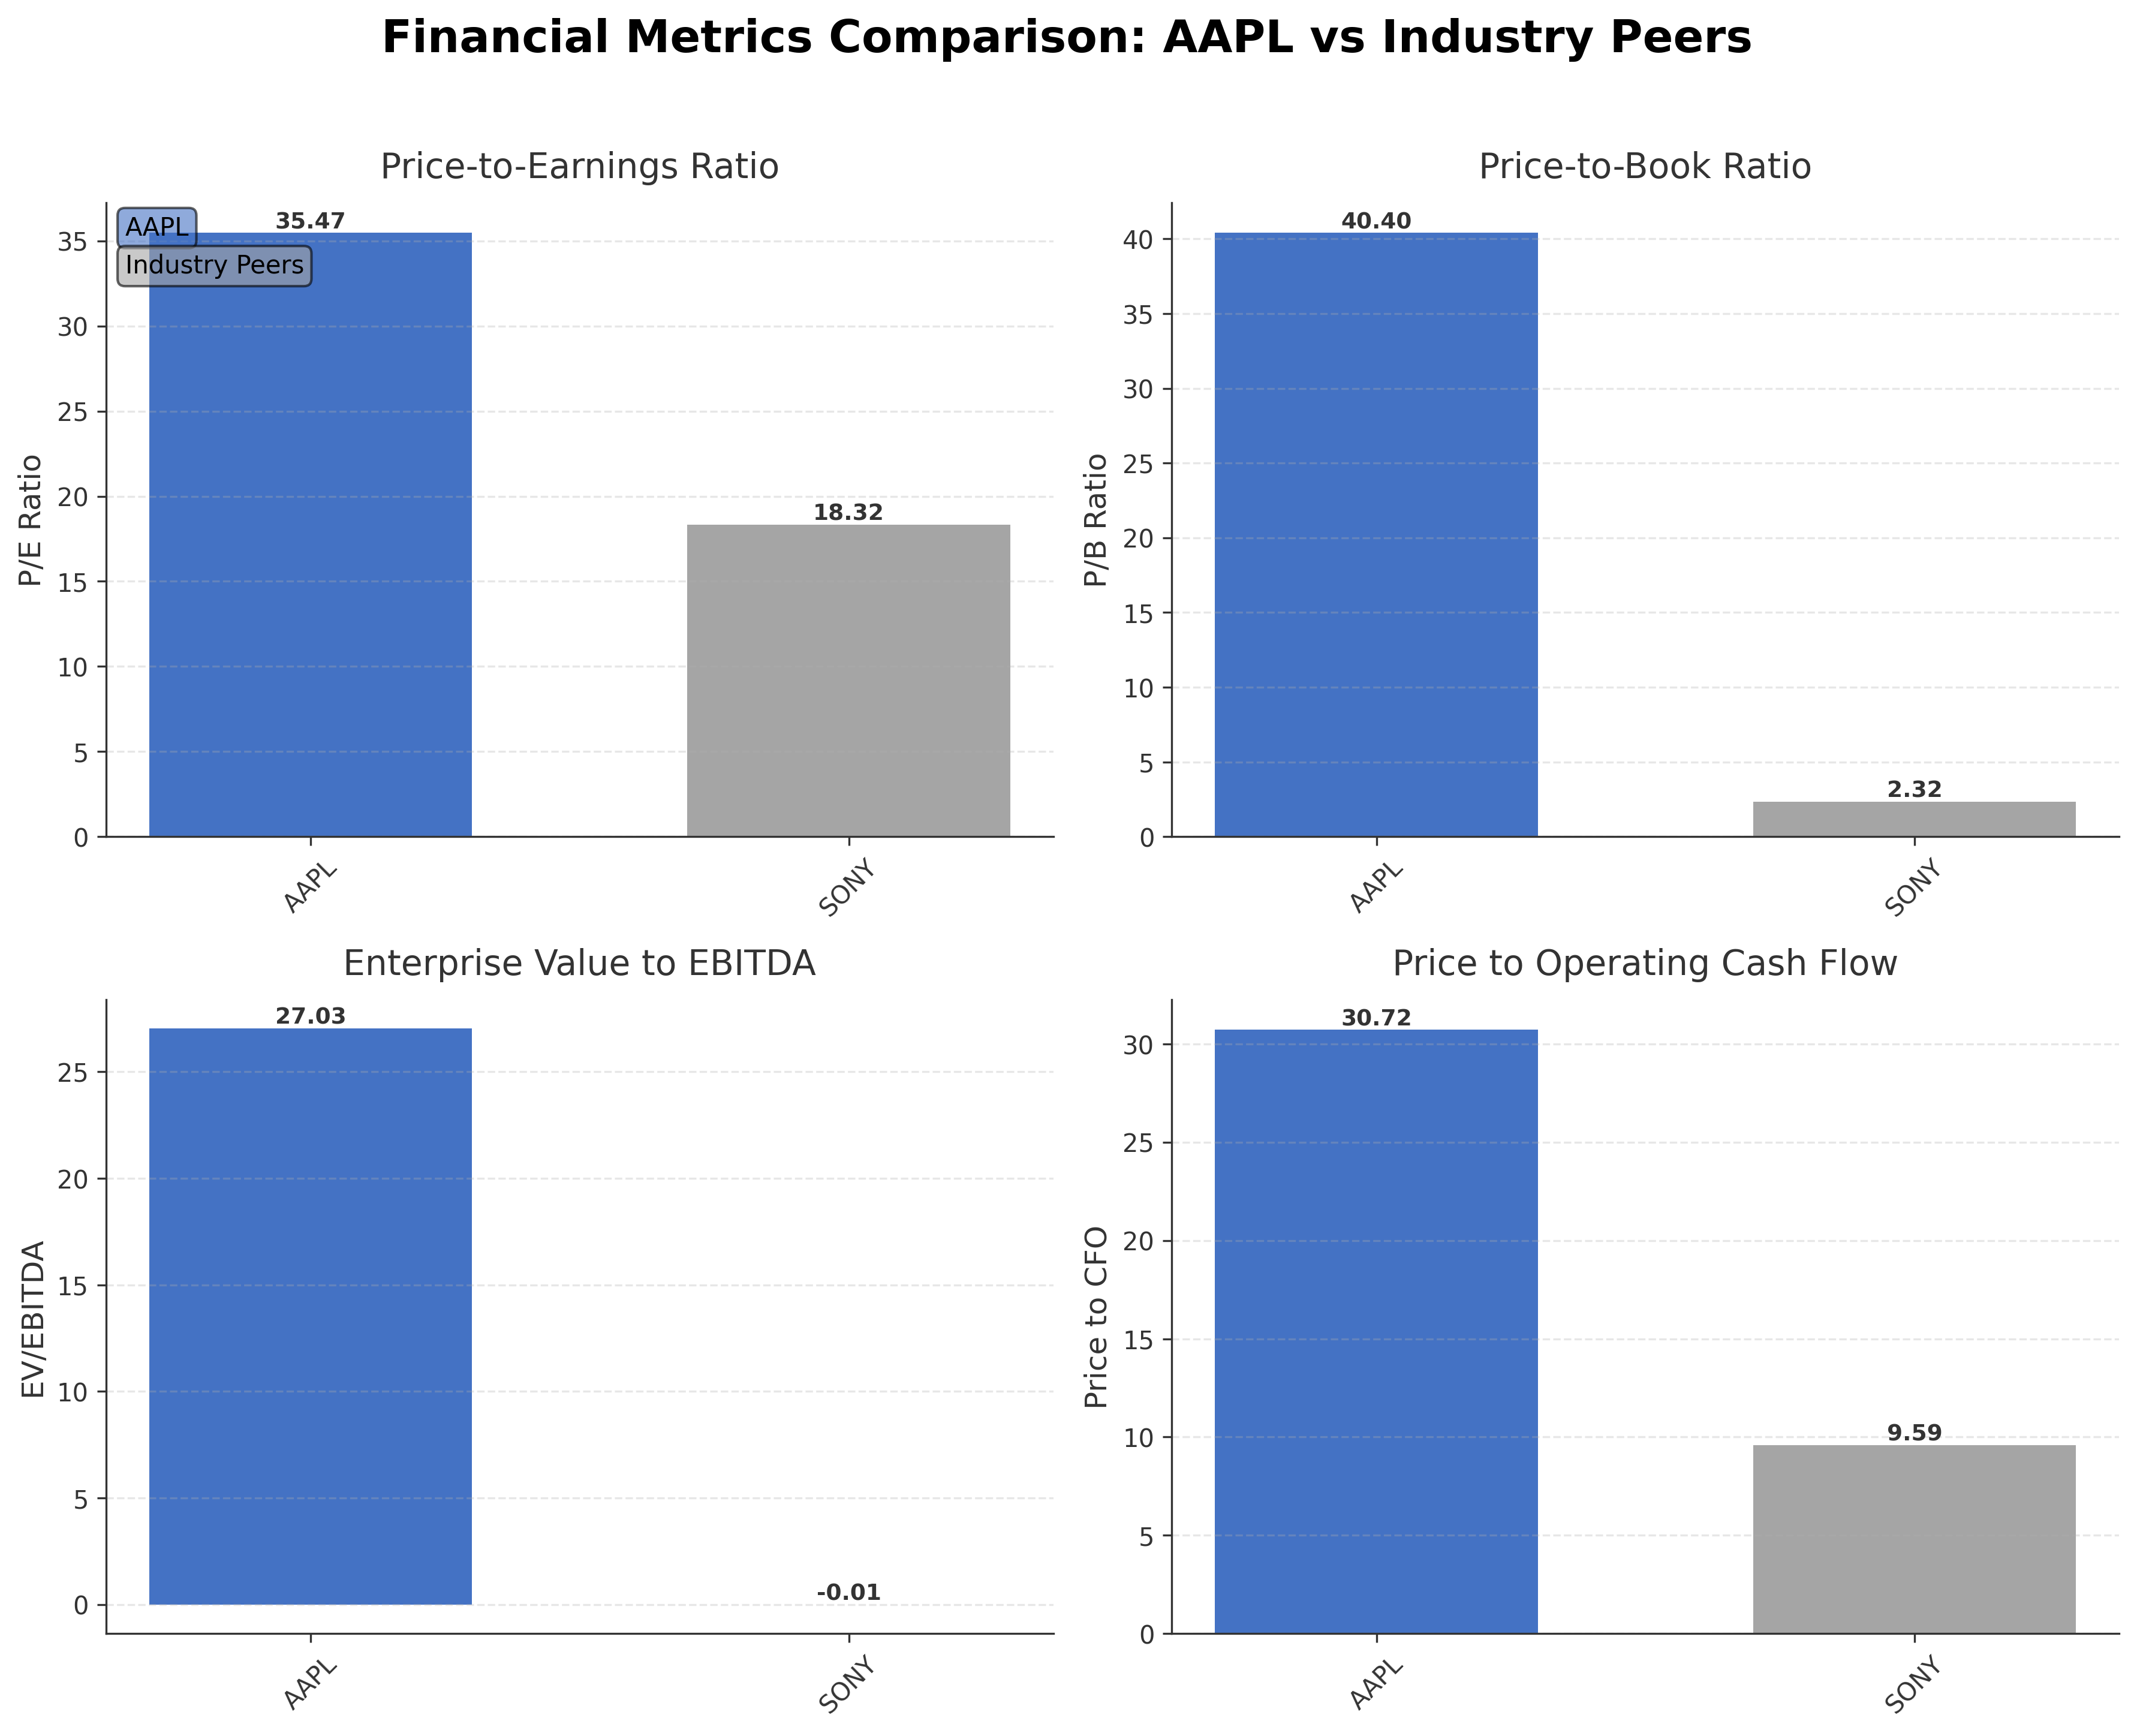
| Apple Inc | $4.31T | 35.47 | 40.40 | 27.03 | 30.72 |
| Sony Group Corporation - Sponsored American Depositary Receipt | $119.04B | 18.32 | 2.32 | -0.01 | 9.59 |
Comparison Analysis: Apple Inc. significantly outpaces its peer Sony Group Corporation in market capitalization, reflecting its dominant industry position. Apple's valuation multiples, including P/E of 35.47 and P/B of 40.40, are substantially higher than Sony's 18.32 and 2.32 respectively, indicating a premium valuation likely driven by superior profitability and growth prospects. Apple also demonstrates a stronger return on equity at 1.41% compared to Sony's 0.12%, highlighting more efficient capital use. The enterprise value to EBITDA ratio of 27.03 for Apple versus a negative value for Sony suggests better earnings quality and operational performance. Overall, Apple stands as a market leader with robust financial metrics relative to its regional industry peers.
Financial Metrics Comparison with Peers
Financial Statements
Comprehensive financial data including income, balance sheet, and cash flow metrics
Income Statement
| fiscal_date | 2025-09-30 | 2024-09-30 | 2023-09-30 | 2022-09-30 | 2021-09-30 |
|---|---|---|---|---|---|
| Sales | 416.16B | 391.04B | 383.29B | 394.33B | 365.82B |
| Cost Of Goods | 220.96B | 210.35B | 214.14B | 223.55B | 212.98B |
| Gross Profit | 195.20B | 180.68B | 169.15B | 170.78B | 152.84B |
| Operating Expense Research And Development | 34.55B | 31.37B | 29.91B | 26.25B | 21.91B |
| Operating Expense Selling General And Administrative | 27.60B | 26.10B | 24.93B | 25.09B | 21.97B |
| Operating Income | 133.05B | 123.22B | 114.30B | 119.44B | 108.95B |
| Other Income Expense | -321.00M | 269.00M | -565.00M | -334.00M | 60.00M |
| Pretax Income | 132.73B | 123.48B | 113.74B | 119.10B | 109.21B |
| Income Tax | 20.72B | 29.75B | 16.74B | 19.30B | 14.53B |
| Net Income | 112.01B | 93.74B | 97.00B | 99.80B | 94.68B |
| Eps Basic | 7.49 | 6.11 | 6.16 | 6.15 | 5.67 |
| Eps Diluted | 7.46 | 6.08 | 6.13 | 6.11 | 5.61 |
| Basic Shares Outstanding | 14.95B | 15.34B | 15.74B | 16.22B | 16.70B |
| Diluted Shares Outstanding | 14.95B | 15.34B | 15.74B | 16.22B | 16.70B |
| Ebit | 133.05B | 123.22B | 114.30B | 119.44B | 111.85B |
| Ebitda | 144.75B | 134.66B | 125.82B | 130.54B | 123.14B |
| Net Income Continuous Operations | 112.01B | 93.74B | 97.00B | 99.80B | 94.68B |
| Non Operating Interest Income | N/A | N/A | 3.75B | 2.83B | 2.84B |
| Non Operating Interest Expense | N/A | N/A | 3.93B | 2.93B | 2.65B |
Source: Financial statements and regulatory filings
Balance Sheet
| fiscal_date | 2025-09-30 | 2024-09-30 | 2023-09-30 | 2022-09-30 | 2021-09-30 |
|---|---|---|---|---|---|
| Cash And Cash Equivalents | 35.93B | 29.94B | 29.96B | 23.65B | 34.94B |
| Accounts Receivable | 39.78B | 33.41B | 29.51B | 28.18B | 26.28B |
| Total Assets | 359.24B | 364.98B | 352.58B | 352.75B | 351.00B |
| Total Liabilities | 285.51B | 308.03B | 290.44B | 302.08B | 287.91B |
| Long Term Debt | 78.33B | 85.75B | 95.28B | 109.71B | 119.38B |
| Shareholders Equity | 73.73B | 56.95B | 62.15B | 50.67B | 63.09B |
Source: Financial statements and regulatory filings
Cash Flow Statement
| fiscal_date | 2025-09-30 | 2024-09-30 | 2023-09-30 | 2022-09-30 | 2021-09-30 |
|---|---|---|---|---|---|
| Operating Activities Net Income | 112.01B | 93.74B | 97.00B | 99.80B | 94.68B |
| Operating Activities Depreciation | 11.70B | 11.45B | 11.52B | 11.10B | 11.28B |
| Operating Activities Stock Based Compensation | 12.86B | 11.69B | 10.83B | 9.04B | 7.91B |
| Operating Activities Other Non Cash Items | -89.00M | -2.27B | -2.23B | 1.01B | -4.92B |
| Operating Activities Accounts Receivable | -7.03B | -5.14B | -417.00M | -9.34B | -14.03B |
| Operating Activities Accounts Payable | 902.00M | 6.02B | -1.89B | 9.45B | 12.33B |
| Operating Activities Other Assets Liabilities | -18.87B | 2.77B | -4.27B | 1.57B | -1.53B |
| Operating Activities Operating Cash Flow | 111.48B | 118.25B | 110.54B | 123.52B | 100.94B |
| Investing Activities Capital Expenditures | -12.71B | -9.45B | -10.96B | -10.71B | -11.09B |
| Investing Activities Purchase Of Investments | -24.41B | -48.66B | -29.51B | -76.92B | -109.56B |
| Investing Activities Sale Of Investments | 53.80B | 62.35B | 45.51B | 67.36B | 106.48B |
| Investing Activities Other Investing Activity | -1.48B | -1.31B | -1.34B | -2.09B | -385.00M |
| Investing Activities Investing Cash Flow | 15.20B | 2.94B | 3.71B | -22.66B | -14.58B |
| Financing Activities Long Term Debt Issuance | 4.48B | 0.00 | 5.23B | 5.46B | 20.39B |
| Financing Activities Long Term Debt Payments | -10.93B | -9.96B | -11.15B | -9.54B | -8.75B |
| Financing Activities Short Term Debt Issuance | -2.03B | 3.96B | -3.98B | 3.96B | 1.02B |
| Financing Activities Common Stock Repurchase | -90.71B | -94.95B | -77.55B | -89.40B | -85.97B |
| Financing Activities Common Dividends | -15.42B | -15.23B | -15.03B | -14.84B | -14.47B |
| Financing Activities Other Financing Charges | -6.07B | -5.80B | -6.01B | -6.38B | -5.58B |
| Financing Activities Financing Cash Flow | -120.69B | -121.98B | -108.49B | -110.75B | -92.25B |
| End Cash Position | 35.93B | 29.94B | 30.74B | 24.98B | 35.93B |
| Income Tax Paid | 43.37B | 26.10B | 18.68B | 19.57B | 25.39B |
| Free Cash Flow | 98.77B | 108.81B | 99.58B | 111.44B | 92.95B |
| Interest Paid | N/A | N/A | 3.80B | 2.87B | 2.69B |
| Operating Activities Deferred Taxes | N/A | N/A | N/A | 895.00M | -4.77B |
| Investing Activities Net Acquisitions | N/A | N/A | N/A | -306.00M | -33.00M |
| Financing Activities Common Stock Issuance | N/A | N/A | N/A | N/A | 1.10B |
Source: Financial statements and regulatory filings
Technical Analysis
Key Insights
- Apple's stock is currently in a sustained upward trend, trading near its 52-week high with consistent higher highs and higher lows in recent price action.
- Key support levels are identified near $260 and $250, while resistance is observed at the recent high around $295.
- The stock price is trading above its 10-day, 50-day (approximately $262.80), and 200-day (approximately $257.02) moving averages, indicating bullish momentum.
- Momentum indicators show the RSI in the upper range, suggesting strong buying interest, MACD remains positive with a bullish crossover, and the stochastic oscillator confirms upward momentum.
- Analysis across daily, weekly, and monthly timeframes consistently reflects strength, with no significant reversal signals detected.
- Current technical setup supports scenarios of continued upward movement with potential consolidation near resistance levels before further advances.
Trending News
1. Headline: Tim Cook Got His Share Of Advice From Steve Jobs On How To Be Successful At Apple, Now He's Asking John T - Benzinga
Summary: Apple CEO Tim Cook advises incoming CEO John Ternus to prioritize company's North Star and focus on making the best products.
Sentiment: neutral
2. Headline: Apple Stock Week Ahead: AAPL Rally Faces CPI, AI and Intel Chip Deal Test
Summary: Apple shares traded at $293.32 Monday, near record highs, valuing the company at $4.32 trillion. Investors are watching for U.S.
Sentiment: positive
3. Headline: 1 Reason You'll Regret Not Buying Apple Stock Now | The Motley Fool
Summary: If you haven't bought Apple stock yet, now's the time. Here's why. Image source: Apple. Apple reported 17% year-over-year sales growth in the 2026 fiscal second quarter (ended March 28), fueled by another quarter of incredible iPhone sales -- they were up 22% over last year in the quarter.
Sentiment: positive
4. Headline: Top Wedbush Analyst Lifts Apple Stock Price Target, Calls AAPL the ‘Consumer Hub of AI’ - TipRanks.com
Summary: Top Wedbush analyst Daniel Ives raised his price target on Apple ($AAPL) to a Street-high $400 from $350 while maintaining an Outperform rating, indicating 36% upsi...
Sentiment: positive
5. Headline: XY Planning Network Inc. Raises Stock Holdings in Apple Inc. $AAPL
Summary: XY Planning Network Inc. raised its stake in Apple Inc. (NASDAQ:AAPL - Free Report) by 49.8% during the fourth quarter, according to the company in its most recent Form 13F filing with the Securities and Exchange Commission. The fund owned 25,550 shares of the iPhone maker's stock after acquiring a
Sentiment: positive
Recent Updates
News Summary
As of 2026-05-09. Apple Inc. reported a 17% year-over-year sales growth in its fiscal second quarter ending March 28, 2026, driven primarily by a 22% increase in iPhone sales, underscoring strong product demand and market leadership. Wedbush analyst Daniel Ives raised Apple's price target to $400, highlighting the company's emerging role as a consumer hub for artificial intelligence, reflecting optimism about future revenue growth from AI integration. Additionally, reports of a potential chip supply deal with Intel indicate a strategic shift aimed at diversifying Apple's supply chain and enhancing its AI hardware capabilities, reinforcing its technological leadership. These developments collectively demonstrate Apple's robust financial performance, innovation-driven growth, and strategic positioning in key technology segments.
News Sentiment
The overall sentiment from recent updates is predominantly positive, driven by strong quarterly sales growth and favorable analyst outlooks emphasizing AI-related opportunities. Institutional accumulation, as evidenced by increased holdings from asset managers, further supports confidence in Apple's prospects. The potential Intel chip deal adds a strategic dimension that may enhance future product innovation. However, some neutral tones are present regarding valuation levels and external market factors. The balanced yet optimistic sentiment reflects a solid foundation for continued growth while acknowledging ongoing competitive and macroeconomic considerations.
Source List
- https://www.tipranks.com/news/apple-stock-aapl-hits-fresh-high-daniel-ives-lifts-price-target-to-street-high-400-on-ai-opportunity
Analytical Overview
Analysis Summary
Apple's valuation metrics, including a trailing P/E of 35.47 and forward P/E of 30.68, are elevated relative to the consumer electronics industry average P/E of 35.47, reflecting a premium valuation supported by strong profitability and growth expectations. The company exhibits a robust growth trajectory with 16.6% quarterly revenue growth and 19.4% year-over-year earnings growth, complemented by substantial operating cash flow of $140.2 billion and free cash flow of $101.1 billion, indicating healthy cash generation trends. Financial health is solid with a total debt to equity ratio of 79.55% and a current ratio of 1.07, suggesting manageable leverage and adequate liquidity to support operations and strategic investments. Sector-specific opportunities include expanding AI integration and potential chip supply diversification through Intel, while challenges encompass regulatory scrutiny and competitive pressures in technology and semiconductor markets. Market positioning and competitive advantages are reinforced by Apple's dominant ecosystem, strong brand loyalty, and innovation pipeline, which support resilience amid evolving industry dynamics.
Overall Business and Market Assessment
Supporting Factors: Apple's strong revenue and earnings growth driven by robust iPhone sales, significant free cash flow generation enabling strategic investments, and emerging opportunities in AI integration and semiconductor partnerships
Risk Factors: No data
SWOT Analysis
Strengths
- Market leadership with a strong global brand and loyal customer base.
- Robust profitability with high gross and net profit margins.
- Significant free cash flow supporting innovation and strategic initiatives.
- Diverse product ecosystem integrating hardware and services.
Weaknesses
- High valuation multiples relative to industry peers.
- Dependence on iPhone sales for a large portion of revenue.
- Moderate debt levels with a total debt to equity ratio near 80%.
- Potential margin pressures from increasing component costs.
Opportunities
- Expansion of artificial intelligence capabilities across products.
- Strategic partnerships such as potential chip supply deal with Intel.
- Growing services segment providing recurring revenue streams.
- Increasing adoption of wearable and subscription-based offerings.
Threats
- Regulatory scrutiny and potential legal challenges in multiple jurisdictions.
- Intense competition in consumer electronics and semiconductor industries.
- Geopolitical tensions affecting supply chains and market access.
- Economic uncertainties impacting consumer spending patterns.
Company Description
Apple Inc. is a leading technology company renowned for designing, manufacturing, and marketing innovative hardware and software products for consumers and businesses worldwide. Its flagship product, the iPhone, accounts for the majority of sales, serving as the central hub of an expansive ecosystem that includes Mac computers, iPad tablets, Apple Watch wearables, and accessories like AirPods. Apple Inc. also offers a suite of services such as the App Store, Apple Music, iCloud, Apple TV+, and Apple Fitness+, providing digital content, cloud storage, and subscription-based platforms. Operating in the consumer electronics industry within the technology sector, the company employs approximately 166,000 people and maintains a broad global presence through online stores, retail outlets, and partnerships with carriers and resellers. With a substantial market capitalization reflecting its scale, Apple Inc. plays a pivotal role in shaping consumer technology trends, emphasizing seamless integration across devices and services to enhance user experience and productivity.