
Apple Inc (AAPL)
Stock Analysis Report
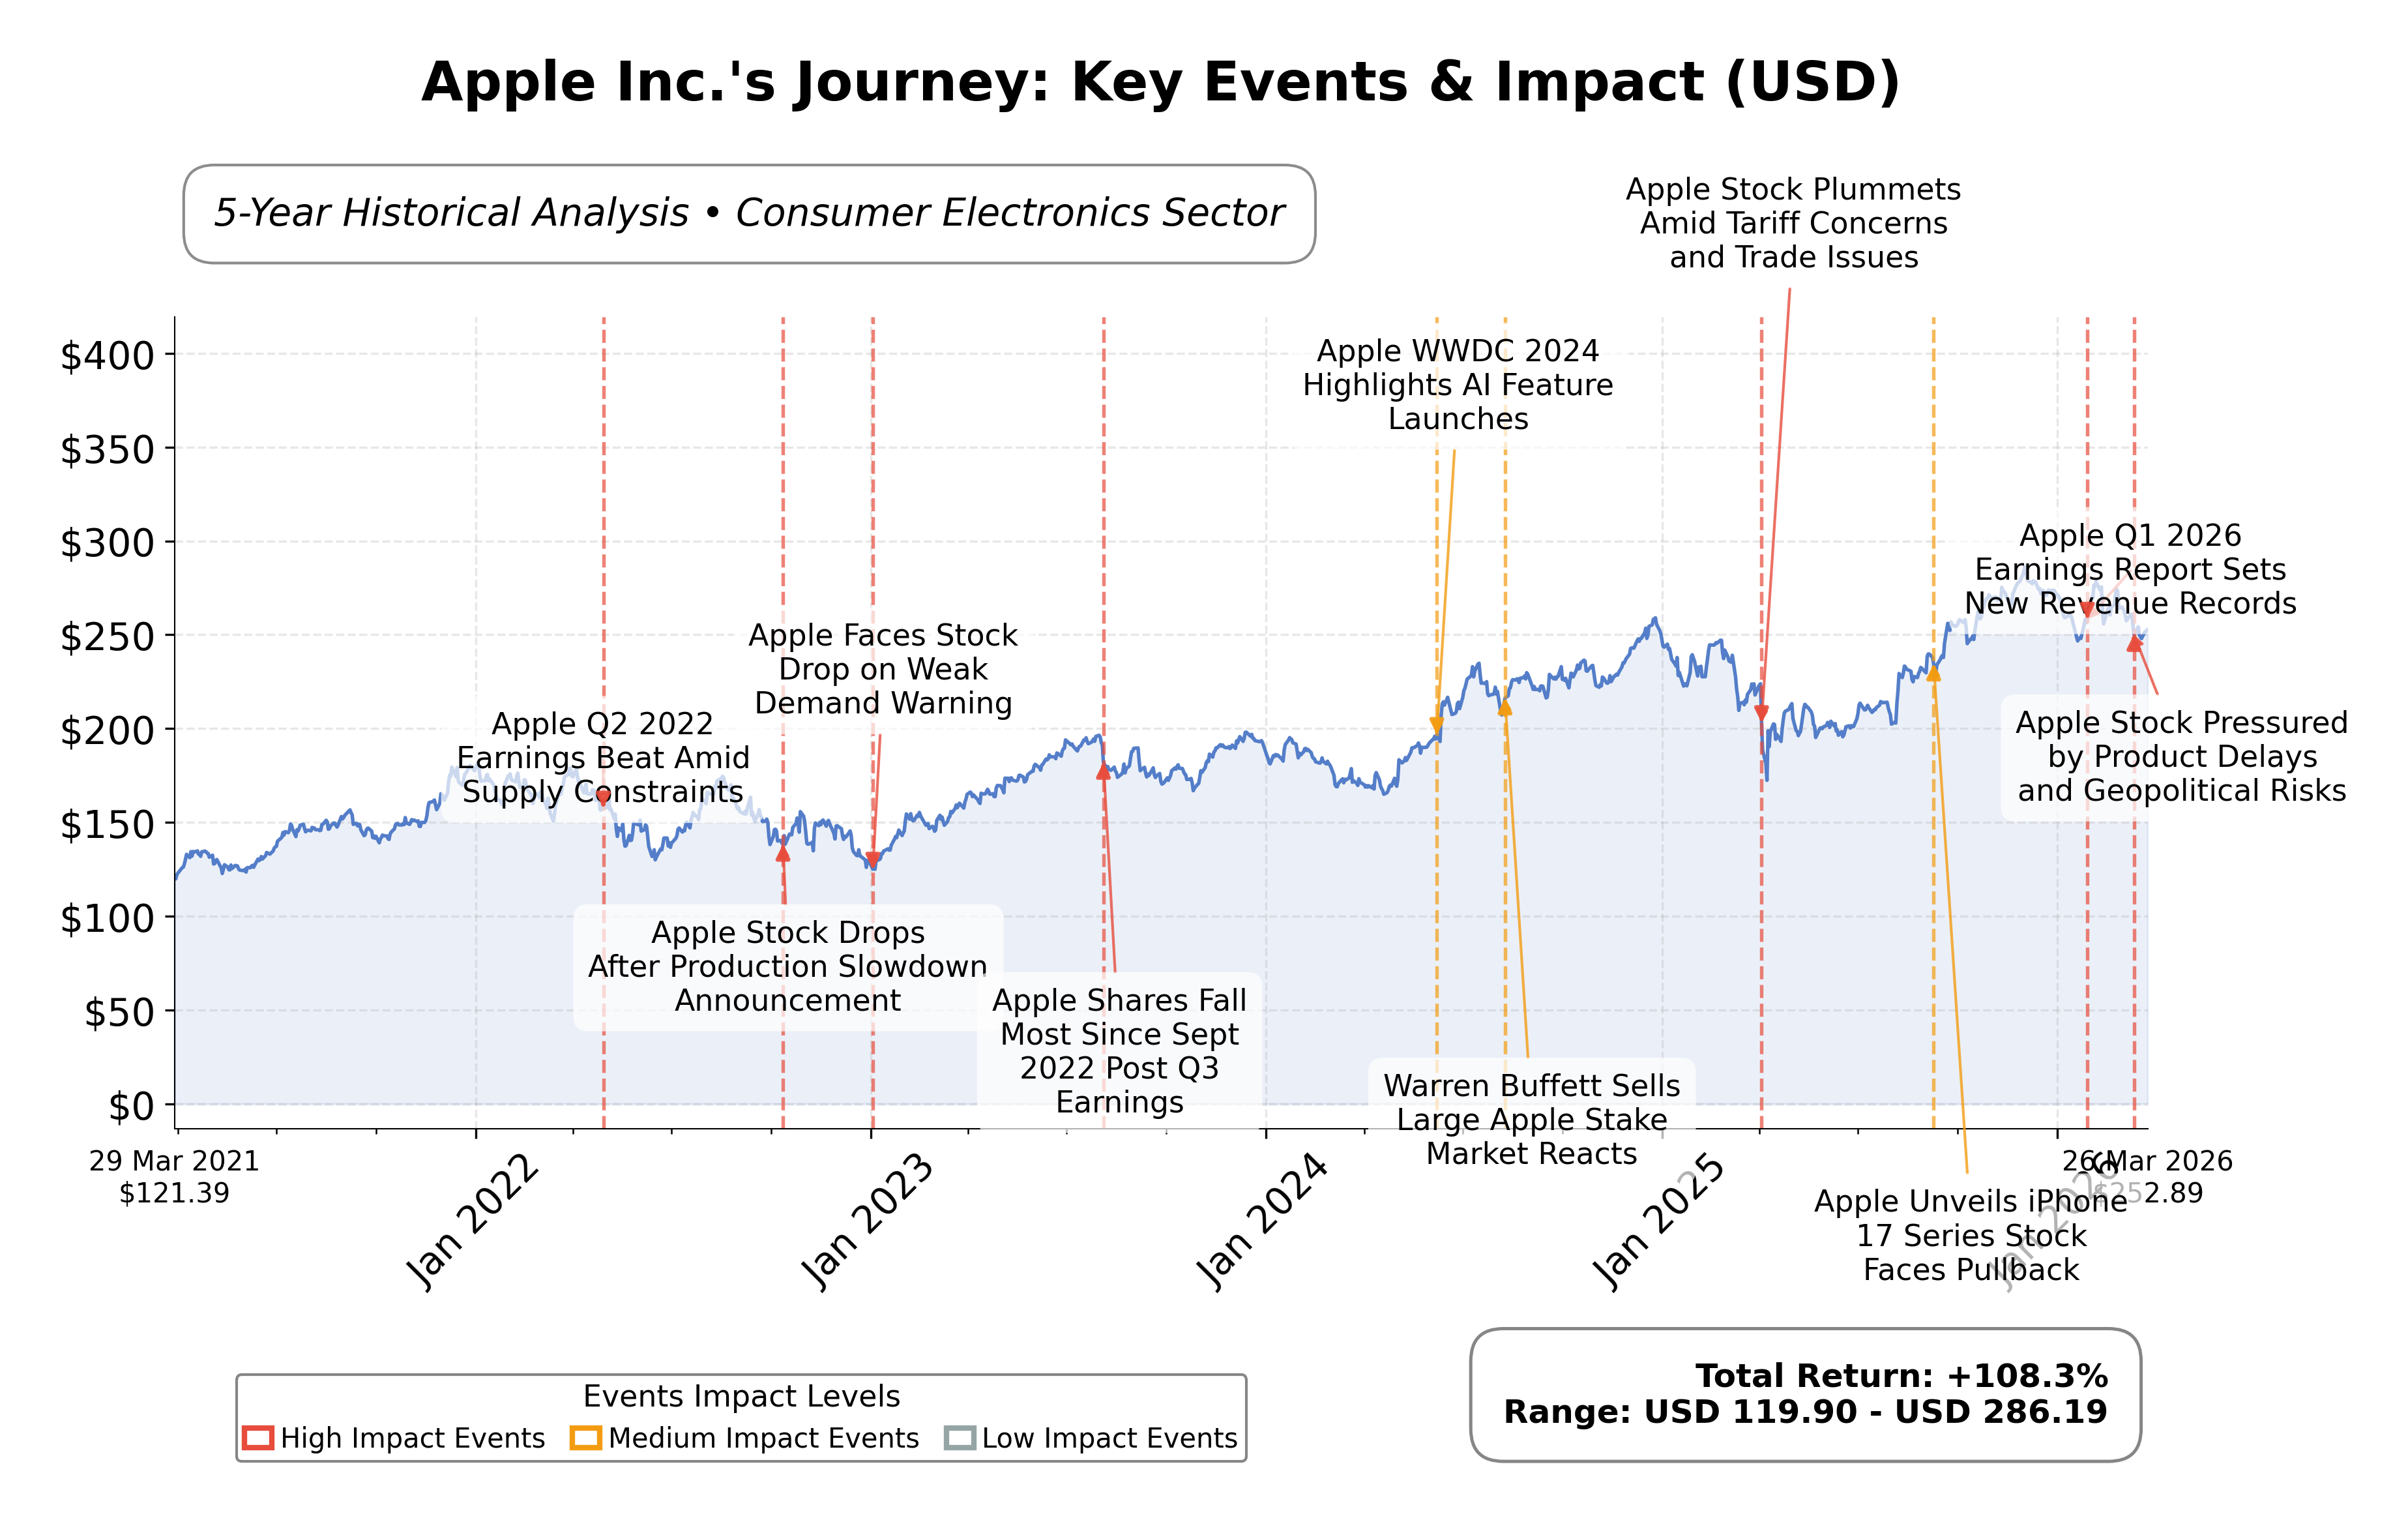
Stock Journey
Key Positives and Key Risks
Pros
- Revenue growth of 15.7% year-over-year demonstrates strong business expansion.
- Operating cash flow of $135.47 billion and free cash flow of $106.31 billion indicate robust cash generation.
- Institutional ownership at 65.27% reflects significant market confidence and governance stability.
Cons
- High price-to-book ratio of 41.51 suggests elevated valuation levels.
- Debt-to-equity ratio of 102.63% indicates relatively high leverage compared to cash reserves.
- Recent product development delays in AI-powered devices may impact innovation momentum.
Disclosure: This information is for general awareness and does not constitute investment advice
Report Summary
Apple Inc. is a leading technology company specializing in the design, manufacture, and marketing of consumer electronics and software products. Operating primarily in the consumer electronics industry within the technology sector, Apple is globally recognized for its flagship iPhone, alongside a diverse ecosystem including Mac computers, iPads, Apple Watch, and various digital services. The company maintains a significant market presence through extensive retail and online channels, positioning itself as a dominant innovator in integrated hardware and software solutions.
Financially, Apple demonstrates robust performance with a trailing twelve-month revenue of approximately $435.6 billion and a net income of $117.8 billion. The companyâs valuation metrics include a trailing P/E ratio of 31.51 and a forward P/E of 26.71, reflecting market expectations of continued earnings growth. Appleâs price-to-book ratio stands notably high at 41.51, indicative of strong investor confidence in its intangible assets and growth prospects. The firm maintains a dividend yield of 0.42% with a quarterly payout, supported by substantial operating and free cash flows exceeding $135 billion and $106 billion respectively.
From a technical and strategic perspective, Appleâs stock trades above its 50-day and 200-day moving averages, suggesting a prevailing upward trend. Recent institutional activity shows mixed positioning with some asset managers increasing holdings while others have reduced exposure. The company continues to innovate with initiatives such as the Apple Business platform and expansion of its American manufacturing program. However, challenges include delays in AI-driven product launches and competitive pressures in wearable technology. These factors contribute to a nuanced risk profile encompassing both operational execution and market dynamics.
In peer comparison within the consumer electronics sector in the United States, Appleâs market capitalization of approximately $3.64 trillion significantly exceeds that of peers like Sony Group Corporation, which has a market cap near $120 billion. Appleâs valuation multiples, including P/E and EV/EBITDA ratios, are higher relative to Sony, reflecting its dominant market position and growth expectations. Return on equity for Apple is also notably higher, underscoring efficient capital utilization compared to regional competitors. This disparity highlights Appleâs scale and premium valuation within its industry cohort.
Apple Inc. navigates a complex and rapidly evolving technology landscape marked by innovation, competitive intensity, and regulatory scrutiny. Recent achievements include strong revenue growth, strategic platform launches, and manufacturing commitments, while ongoing challenges involve product development delays and market competition. The stakes for Apple involve sustaining its innovation leadership and financial performance amid shifting consumer preferences and technological advancements. Evaluating the current data suggests a balanced perspective may be appropriate, recognizing both the companyâs strengths and areas requiring vigilance in the context of broader market conditions.
Company and Industry Overview
Company Basics
Price Performance
Company Size
Shareholding Pattern
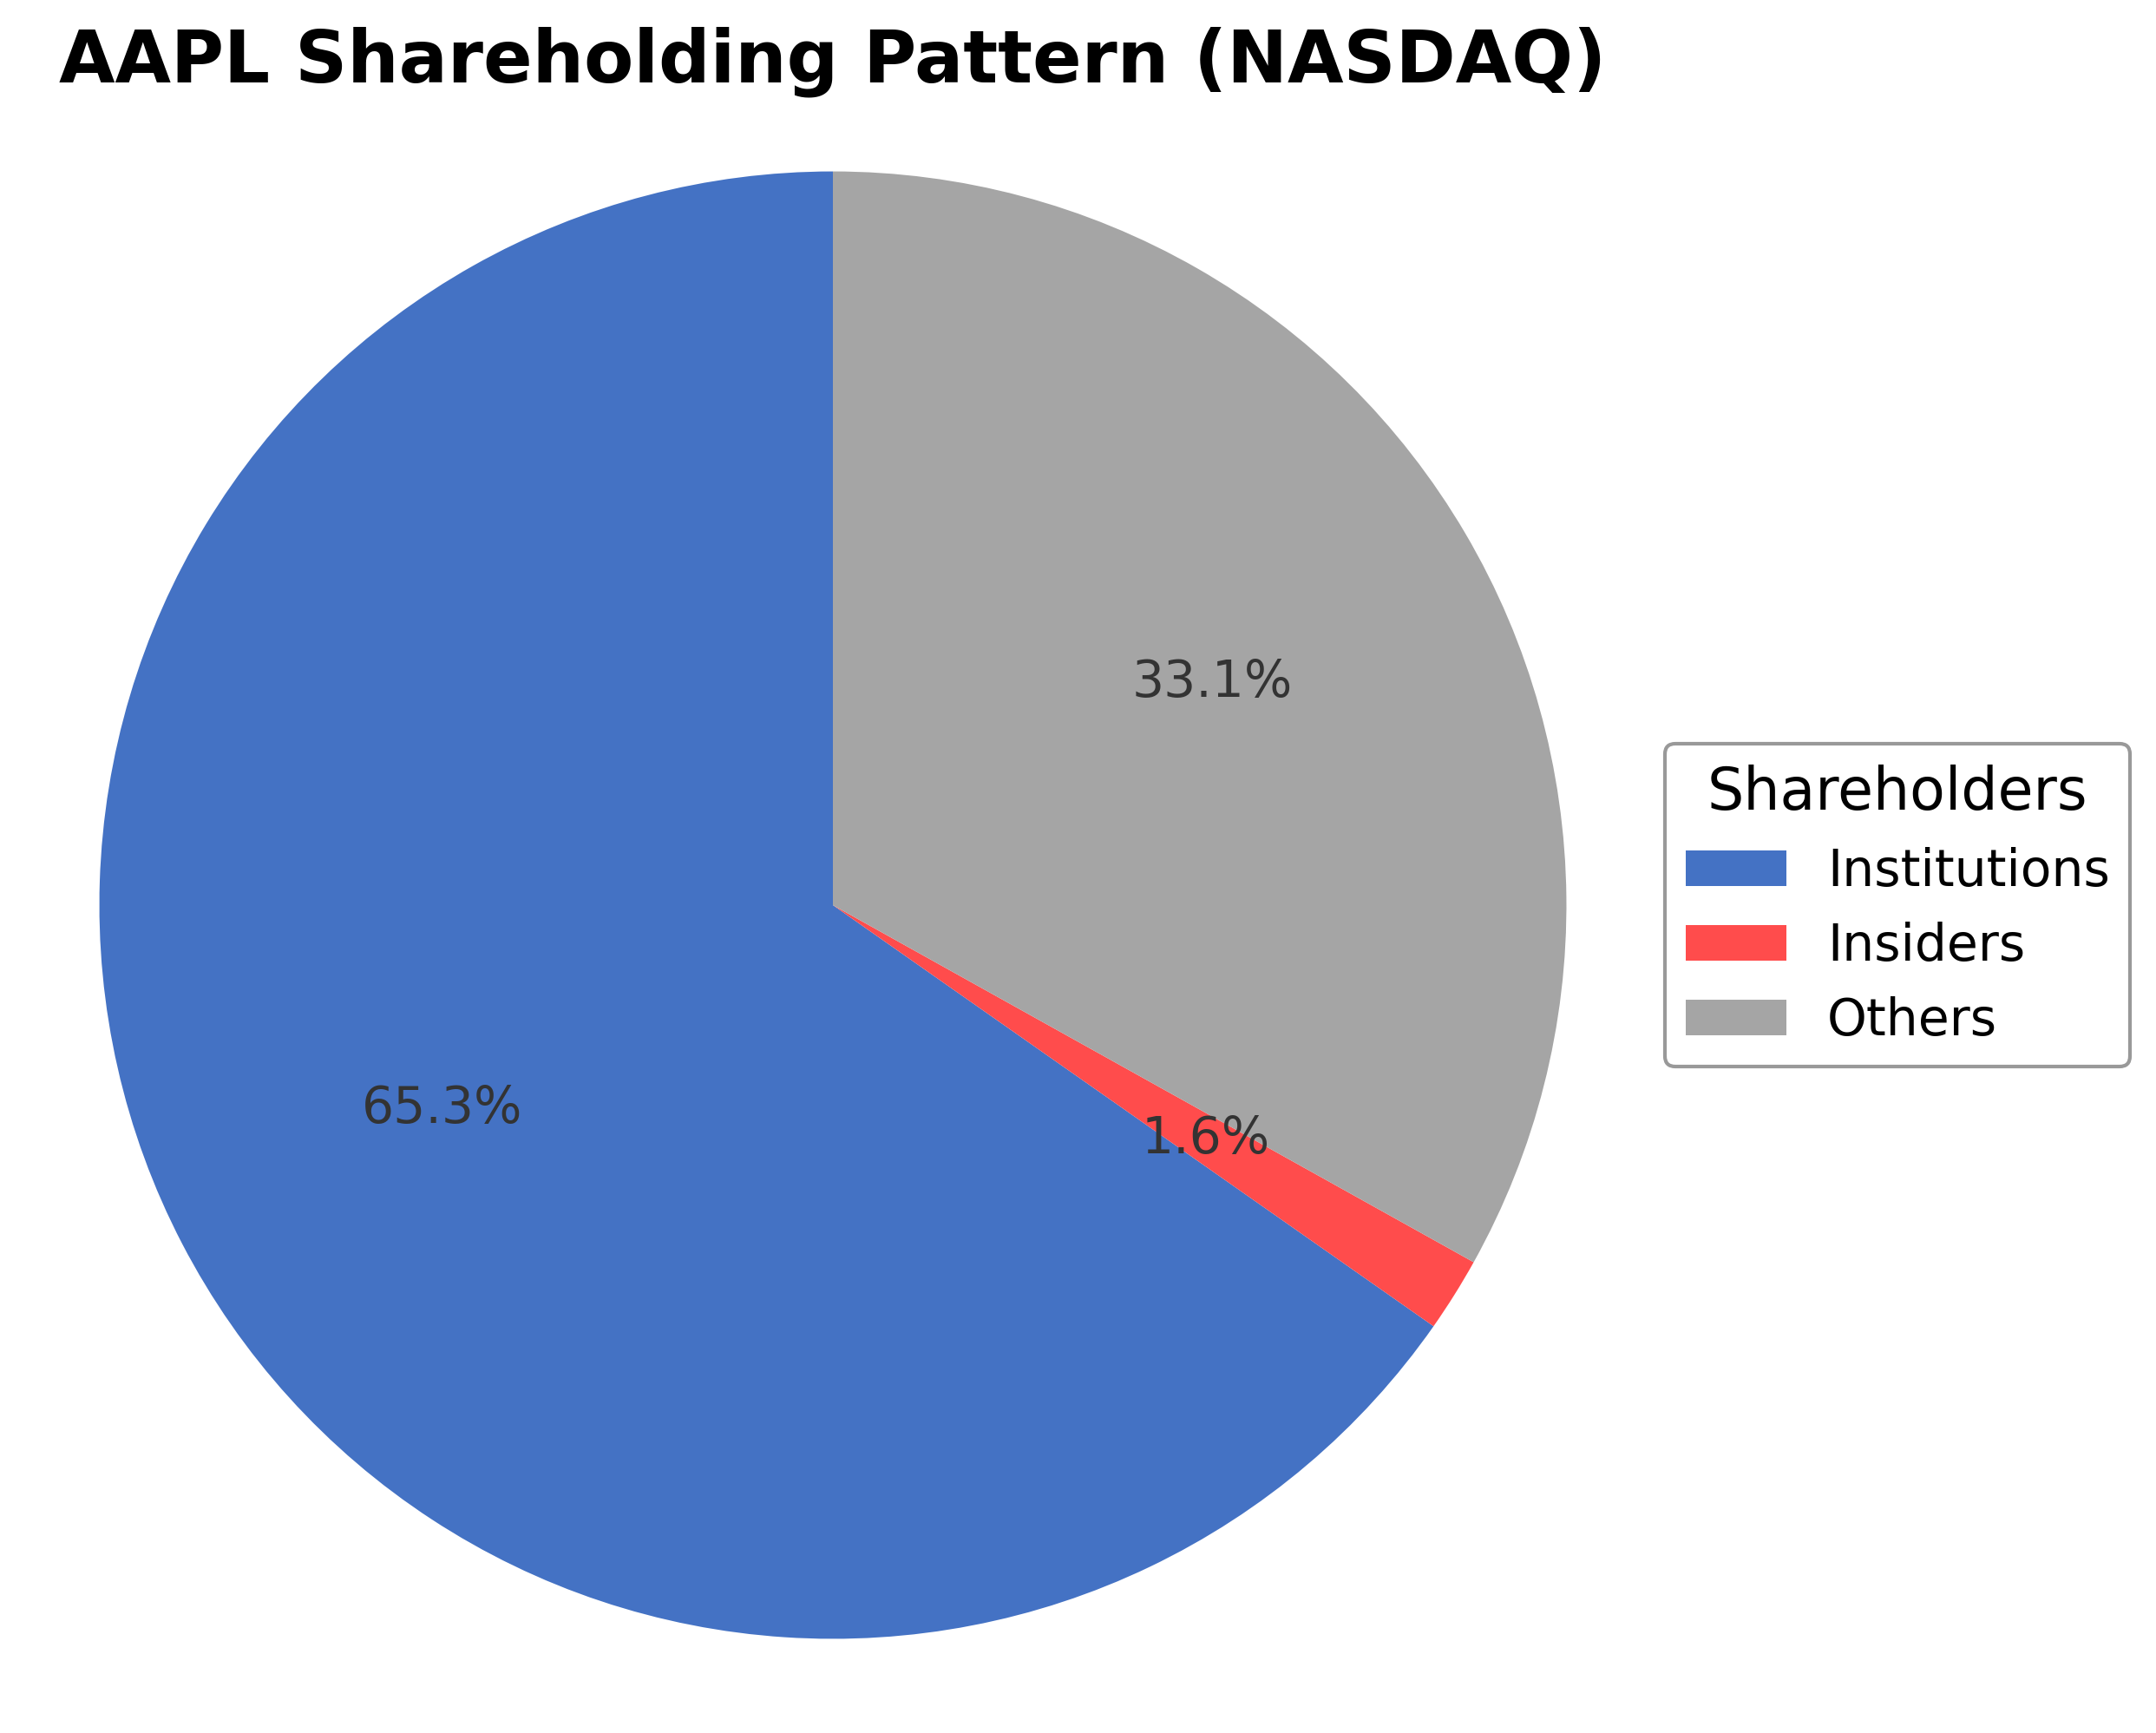
Apple Inc.'s ownership structure features approximately 1.64% held by insiders, including executives and board members, while institutional investors control about 65.27% of shares, reflecting significant institutional confidence. The remaining 34.73% is held by public shareholders, encompassing retail investors and employee stock plans. Recent disclosures indicate notable institutional accumulation by firms such as Nordea Investment Management AB and Occidental Asset Management LLC, contrasted by reductions from others like Northside Capital Management LLC and Tealwood Asset Management Inc. These patterns suggest a dynamic market sentiment with active portfolio adjustments. The substantial institutional ownership underscores governance stability and strategic alignment, potentially influencing future corporate decisions and market perceptions within the consumer electronics industry.
Sector and Industry Analysis
Apple Inc. (AAPL) operates primarily within the Technology sector, specifically in the Hardware industry, which encompasses consumer electronics, computing devices, and related software ecosystems. The global hardware market is substantial, driven by continuous demand for smartphones, personal computing devices, wearables, and related peripherals. Apple is a dominant player with a market capitalization exceeding $3.6 trillion as of early 2026, reflecting its significant scale and influence. The company’s flagship product, the iPhone, remains the largest revenue contributor, supported by complementary products such as Mac computers, iPads, and Apple Watch, all integrated within a proprietary software ecosystem. The sector’s growth trajectory is sustained by innovation cycles, increasing digital adoption, and expanding consumer and enterprise demand for connected devices.
Industry trends highlight a shift towards tighter hardware-software integration and ecosystem lock-in, where companies like Apple leverage proprietary operating systems and services to enhance user experience and drive recurring revenue streams. Emerging technologies such as augmented reality (AR), artificial intelligence (AI), and 5G connectivity are pivotal growth drivers, enabling new applications and services. Consumer behavior is evolving with increased preference for subscription-based models, streaming content, and health-related wearables, areas where Apple has strategically expanded its offerings. Additionally, the semiconductor supply chain, including partnerships with foundries like TSMC, remains critical in shaping product innovation and cost structures within the hardware industry.
The regulatory landscape for the hardware and technology sector is complex and multifaceted, encompassing data privacy laws, antitrust scrutiny, import/export controls, and environmental regulations. Apple faces regulatory attention globally, particularly regarding app store policies, user data protection, and competition law. Compliance with standards such as the EU’s GDPR, U.S. Federal Trade Commission guidelines, and emerging digital market regulations shapes operational practices and product design. Moreover, supply chain transparency and sustainability requirements are increasingly mandated, influencing sourcing and manufacturing strategies. Policy shifts, especially in U.S.-China trade relations, also impact component sourcing and market access.
Competitive dynamics in the hardware industry are characterized by high capital intensity, rapid innovation cycles, and significant economies of scale. Barriers to entry are substantial due to the need for advanced R&D capabilities, global supply chains, and brand equity. Apple’s competitive positioning is reinforced by its integrated ecosystem, premium brand perception, and control over both hardware and software development. The market structure includes a mix of large multinational corporations and specialized component suppliers, with Apple maintaining a leadership role through continuous product innovation and service expansion. While competition from firms like Samsung, Microsoft, and emerging Chinese manufacturers persists, Apple’s focus on ecosystem integration and user experience differentiation sustains its competitive moat.
Note: Analysis synthesized from industry research, market reports, and regulatory filings. Information is subject to change based on market conditions.
Illustrative Scenario Analysis
DCF Assumptions:
Method: Two-Stage EPS-Priority Model
Financials
Peer Analysis
| Company Name | Market Cap | P/E Ratio | P/B Ratio | EV/EBITDA | Price to CFO |
|---|---|---|---|---|---|
| Apple Inc. | $3.64T | 31.51 | 41.51 | 24.15 | 26.91 |
| Sony Group Corporation - Sponsored American Depositary Receipt | $120.12B | 15.68 | 2.38 | 0.02 | 9.34 |
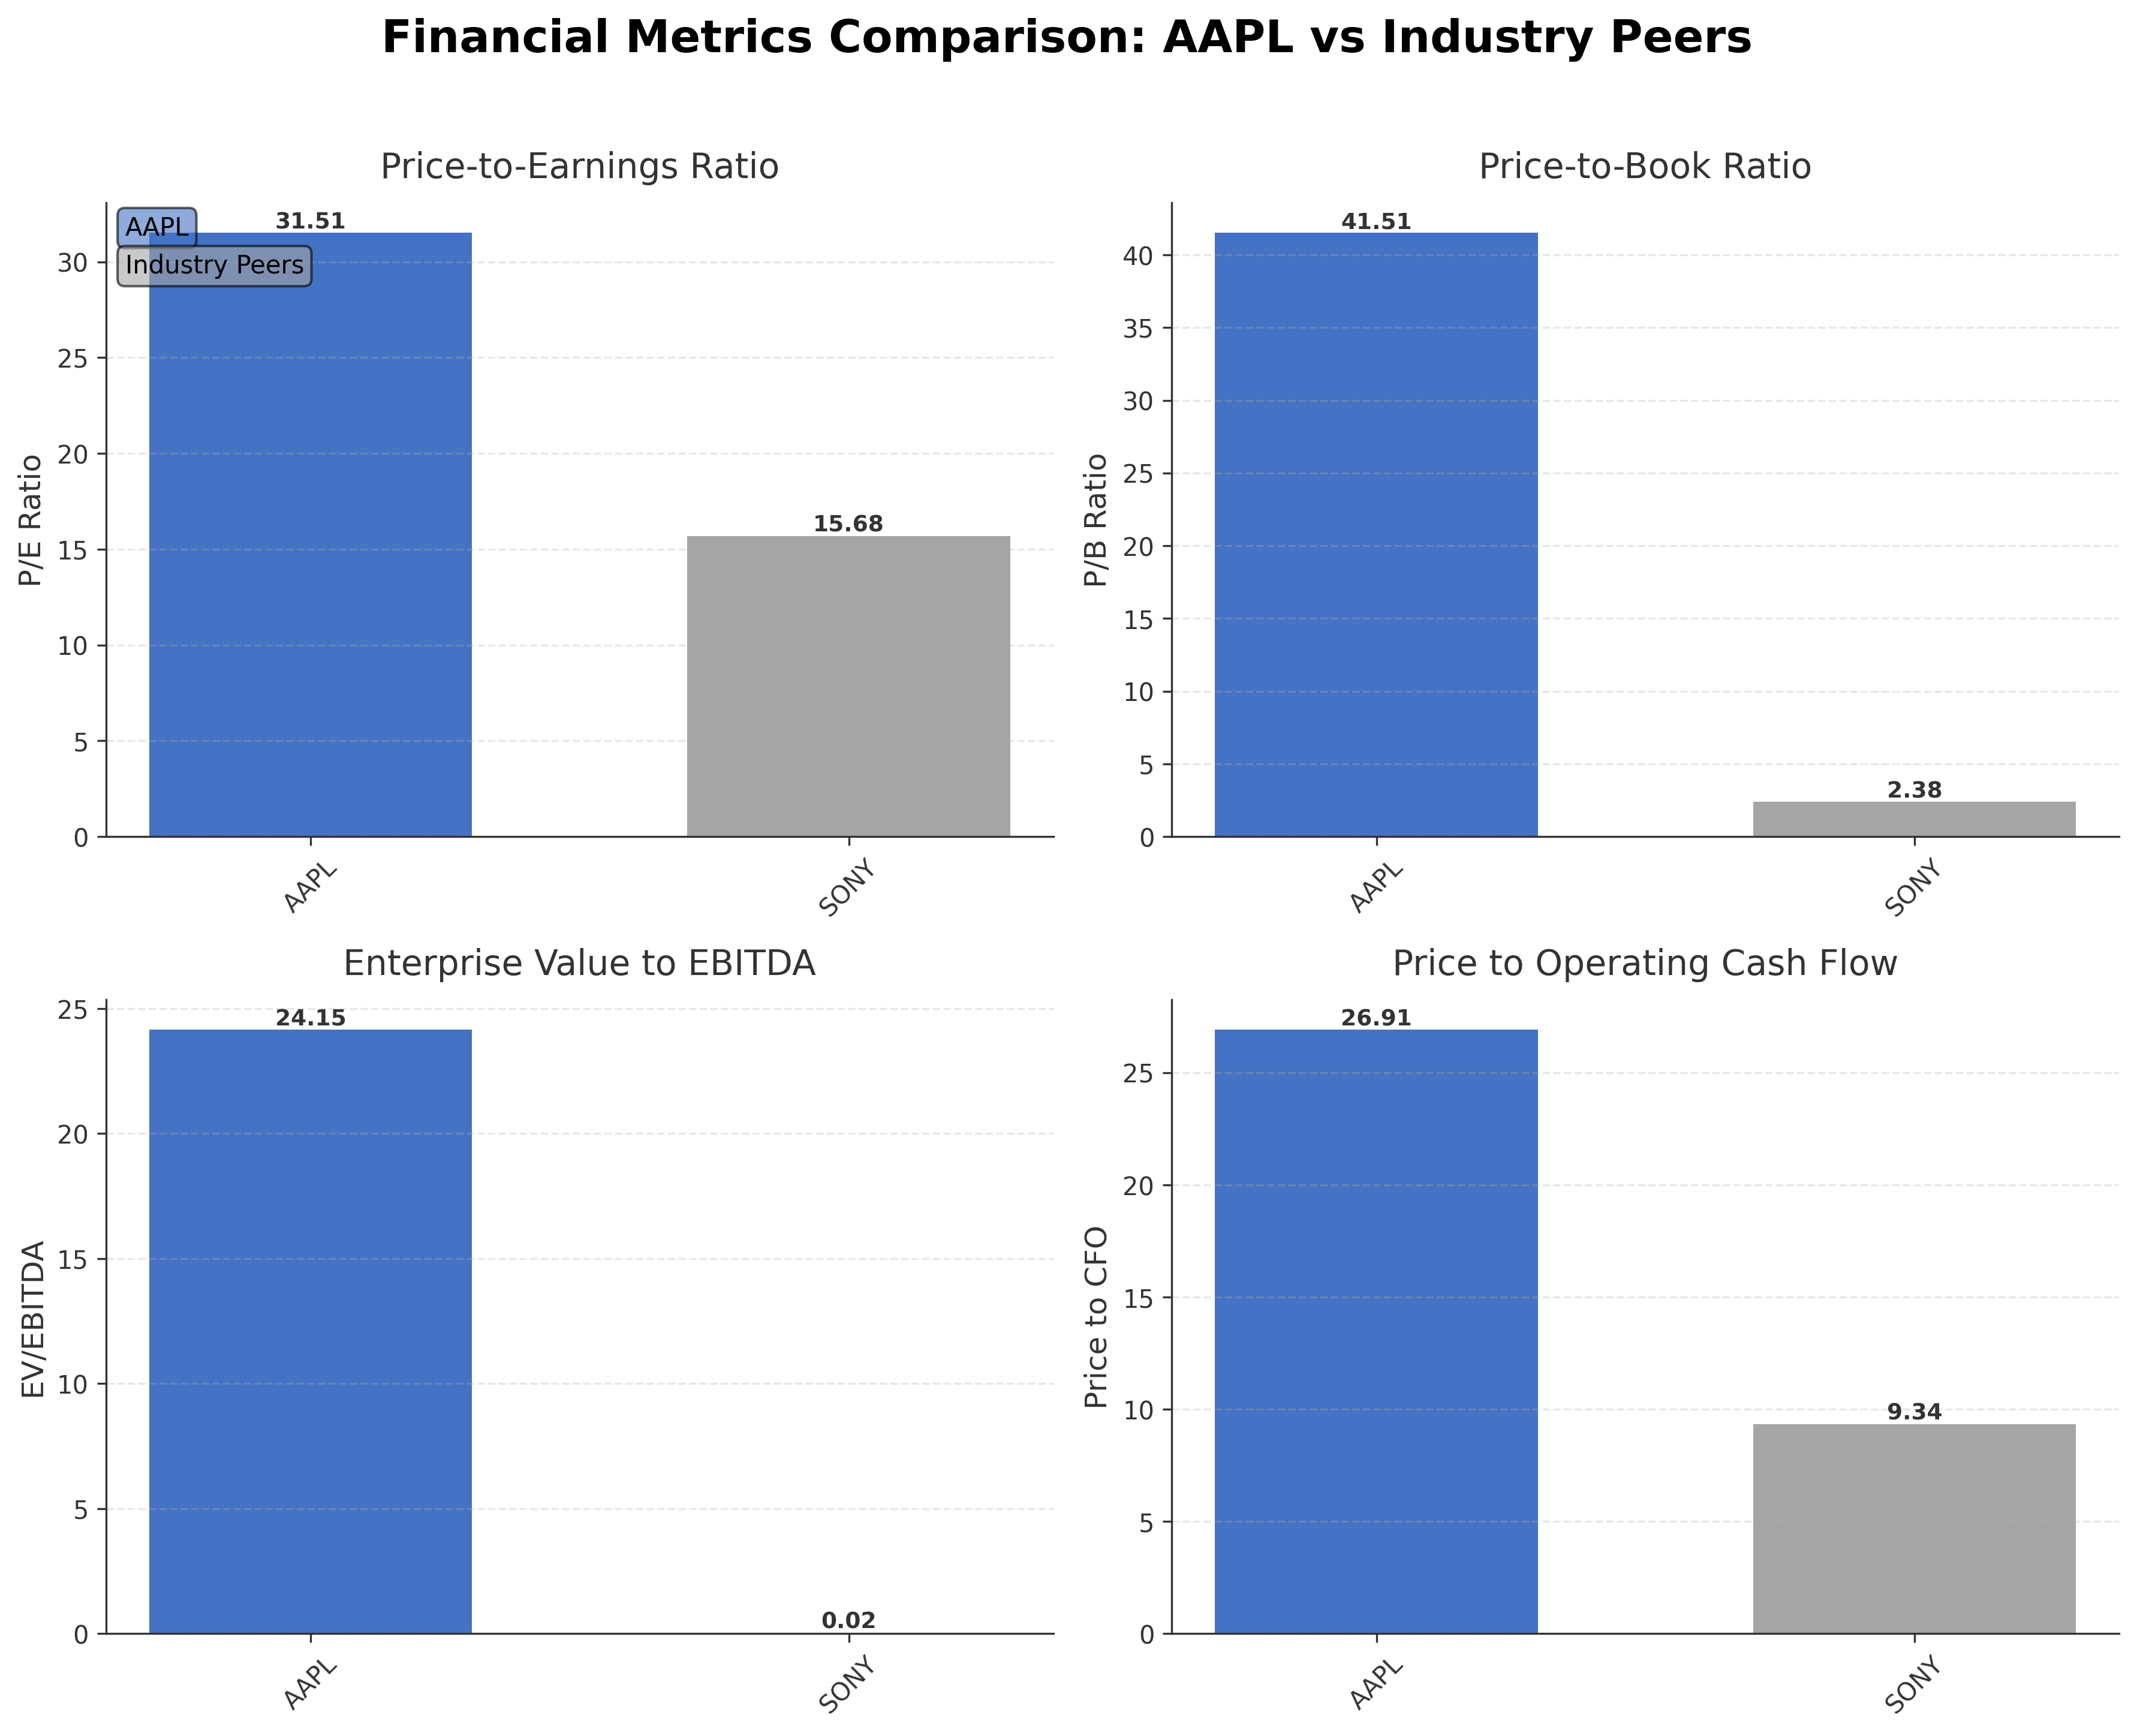
Comparison Analysis: Apple Inc. exhibits a substantially larger market capitalization compared to its peer Sony Group Corporation, reflecting its dominant industry position. Apple's valuation multiples, including P/E and price-to-book ratios, are markedly higher, indicating premium market expectations for growth and profitability. The company’s EV/EBITDA and price-to-CFO ratios also exceed those of Sony, suggesting higher operational efficiency and cash flow generation. Return on equity for Apple significantly outperforms Sony, highlighting superior capital effectiveness. These metrics collectively position Apple as a leading entity within the consumer electronics sector in the United States, with valuation and performance metrics that differentiate it from regional competitors.
Financial Metrics Comparison with Peers
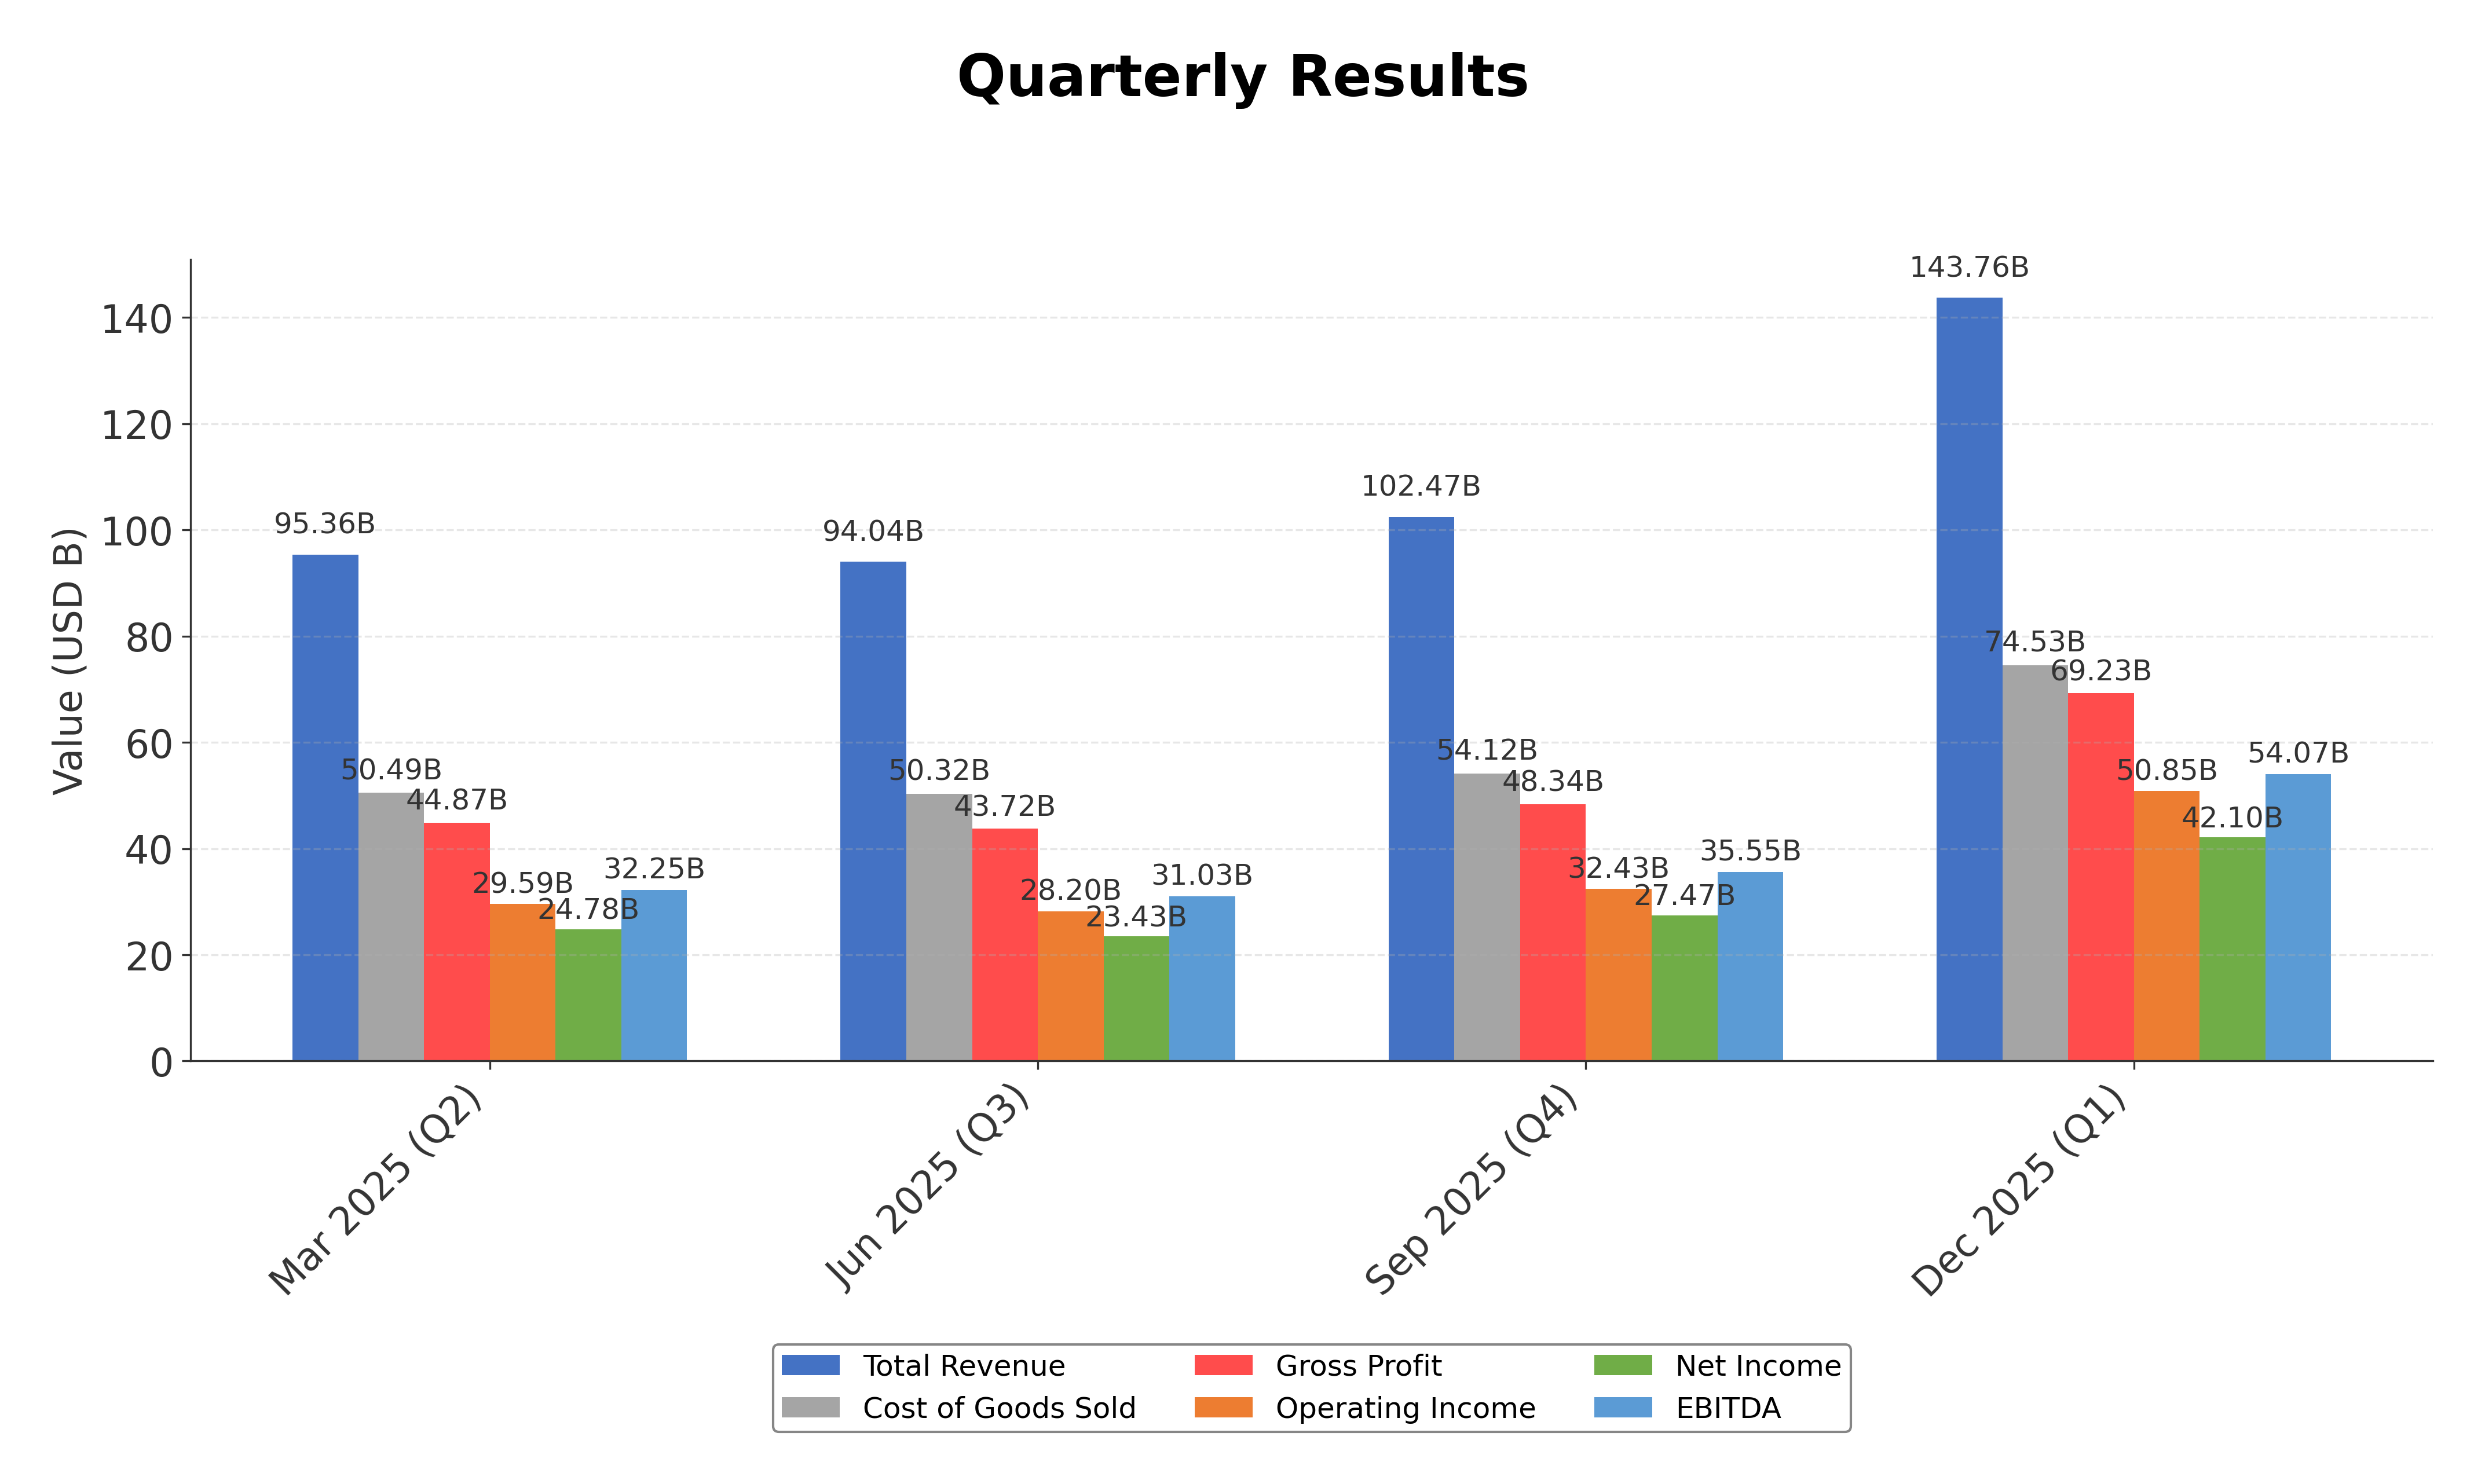
Financial Statements
Comprehensive financial data including income, balance sheet, and cash flow metrics
Income Statement
| fiscal_date | 2025-09-30 | 2024-09-30 | 2023-09-30 | 2022-09-30 | 2021-09-30 |
|---|---|---|---|---|---|
| Sales | 416.16B | 391.04B | 383.29B | 394.33B | 365.82B |
| Cost Of Goods | 220.96B | 210.35B | 214.14B | 223.55B | 212.98B |
| Gross Profit | 195.20B | 180.68B | 169.15B | 170.78B | 152.84B |
| Operating Expense Research And Development | 34.55B | 31.37B | 29.91B | 26.25B | 21.91B |
| Operating Expense Selling General And Administrative | 27.60B | 26.10B | 24.93B | 25.09B | 21.97B |
| Operating Income | 133.05B | 123.22B | 114.30B | 119.44B | 108.95B |
| Other Income Expense | -321.00M | 269.00M | -565.00M | -334.00M | 60.00M |
| Pretax Income | 132.73B | 123.48B | 113.74B | 119.10B | 109.21B |
| Income Tax | 20.72B | 29.75B | 16.74B | 19.30B | 14.53B |
| Net Income | 112.01B | 93.74B | 97.00B | 99.80B | 94.68B |
| Eps Basic | 7.49 | 6.11 | 6.16 | 6.15 | 5.67 |
| Eps Diluted | 7.46 | 6.08 | 6.13 | 6.11 | 5.61 |
| Basic Shares Outstanding | 14.95B | 15.34B | 15.74B | 16.22B | 16.70B |
| Diluted Shares Outstanding | 14.95B | 15.34B | 15.74B | 16.22B | 16.70B |
| Ebit | 133.05B | 123.22B | 114.30B | 119.44B | 111.85B |
| Ebitda | 144.75B | 134.66B | 125.82B | 130.54B | 123.14B |
| Net Income Continuous Operations | 112.01B | 93.74B | 97.00B | 99.80B | 94.68B |
| Non Operating Interest Income | N/A | N/A | 3.75B | 2.83B | 2.84B |
| Non Operating Interest Expense | N/A | N/A | 3.93B | 2.93B | 2.65B |
Source: Financial statements and regulatory filings
Balance Sheet
| fiscal_date | 2025-09-30 | 2024-09-30 | 2023-09-30 | 2022-09-30 | 2021-09-30 |
|---|---|---|---|---|---|
| Cash And Cash Equivalents | 35.93B | 29.94B | 29.96B | 23.65B | 34.94B |
| Accounts Receivable | 39.78B | 33.41B | 29.51B | 28.18B | 26.28B |
| Total Assets | 359.24B | 364.98B | 352.58B | 352.75B | 351.00B |
| Total Liabilities | 285.51B | 308.03B | 290.44B | 302.08B | 287.91B |
| Long Term Debt | 78.33B | 85.75B | 95.28B | 109.71B | 119.38B |
| Shareholders Equity | 73.73B | 56.95B | 62.15B | 50.67B | 63.09B |
Source: Financial statements and regulatory filings
Cash Flow Statement
| fiscal_date | 2025-09-30 | 2024-09-30 | 2023-09-30 | 2022-09-30 | 2021-09-30 |
|---|---|---|---|---|---|
| Operating Activities Net Income | 112.01B | 93.74B | 97.00B | 99.80B | 94.68B |
| Operating Activities Depreciation | 11.70B | 11.45B | 11.52B | 11.10B | 11.28B |
| Operating Activities Stock Based Compensation | 12.86B | 11.69B | 10.83B | 9.04B | 7.91B |
| Operating Activities Other Non Cash Items | -89.00M | -2.27B | -2.23B | 1.01B | -4.92B |
| Operating Activities Accounts Receivable | -7.03B | -5.14B | -417.00M | -9.34B | -14.03B |
| Operating Activities Accounts Payable | 902.00M | 6.02B | -1.89B | 9.45B | 12.33B |
| Operating Activities Other Assets Liabilities | -18.87B | 2.77B | -4.27B | 1.57B | -1.53B |
| Operating Activities Operating Cash Flow | 111.48B | 118.25B | 110.54B | 123.52B | 100.94B |
| Investing Activities Capital Expenditures | -12.71B | -9.45B | -10.96B | -10.71B | -11.09B |
| Investing Activities Purchase Of Investments | -24.41B | -48.66B | -29.51B | -76.92B | -109.56B |
| Investing Activities Sale Of Investments | 53.80B | 62.35B | 45.51B | 67.36B | 106.48B |
| Investing Activities Other Investing Activity | -1.48B | -1.31B | -1.34B | -2.09B | -385.00M |
| Investing Activities Investing Cash Flow | 15.20B | 2.94B | 3.71B | -22.66B | -14.58B |
| Financing Activities Long Term Debt Issuance | 4.48B | 0.00 | 5.23B | 5.46B | 20.39B |
| Financing Activities Long Term Debt Payments | -10.93B | -9.96B | -11.15B | -9.54B | -8.75B |
| Financing Activities Short Term Debt Issuance | -2.03B | 3.96B | -3.98B | 3.96B | 1.02B |
| Financing Activities Common Stock Repurchase | -90.71B | -94.95B | -77.55B | -89.40B | -85.97B |
| Financing Activities Common Dividends | -15.42B | -15.23B | -15.03B | -14.84B | -14.47B |
| Financing Activities Other Financing Charges | -6.07B | -5.80B | -6.01B | -6.38B | -5.58B |
| Financing Activities Financing Cash Flow | -120.69B | -121.98B | -108.49B | -110.75B | -92.25B |
| End Cash Position | 35.93B | 29.94B | 30.74B | 24.98B | 35.93B |
| Income Tax Paid | 43.37B | 26.10B | 18.68B | 19.57B | 25.39B |
| Free Cash Flow | 98.77B | 108.81B | 99.58B | 111.44B | 92.95B |
| Interest Paid | N/A | N/A | 3.80B | 2.87B | 2.69B |
| Operating Activities Deferred Taxes | N/A | N/A | N/A | 895.00M | -4.77B |
| Investing Activities Net Acquisitions | N/A | N/A | N/A | -306.00M | -33.00M |
| Financing Activities Common Stock Issuance | N/A | N/A | N/A | N/A | 1.10B |
Source: Financial statements and regulatory filings
Technical Analysis
Key Insights
- The current trend direction for Apple Inc. shows a sustained upward movement with price action maintaining levels above key moving averages.
- Key support levels are identified near $245, with resistance encountered around the 52-week high of $288.62.
- Apple’s stock price is trading above its 10-day, 50-day ($261.64), and 200-day ($246.36) moving averages, indicating bullish momentum across short and long-term timeframes.
- Momentum indicators reveal a moderately strong RSI, positive MACD crossover, and stochastic readings consistent with continued upward pressure.
- Multi-timeframe analysis across daily, weekly, and monthly charts confirms a consistent bullish trend with periodic consolidations.
- Potential market scenarios include continuation of the uptrend if support levels hold, or a corrective phase if resistance near the 52-week high proves strong.
Trending News
1. Headline: 7 Apple inventions that reinvented Apple | Macworld
Summary: Macworld examines seven pivotal Apple products that transformed the company from near-bankruptcy to tech dominance, including the G3 iMac, iPod, iTunes Store, MacBook Air, Apple Watch, AirPods, and Apple Silicon.
Sentiment: neutral
2. Headline: Apple Inc. $AAPL Position Increased by Nordea Investment Management AB
Summary: Nordea Investment Management AB boosted its position in Apple Inc. (NASDAQ:AAPL - Free Report) by 3.7% during the 4th quarter, according to the company in its most recent disclosure with the Securities & Exchange Commission. The institutional investor owned 22,035,680 shares of the iPhone make
Sentiment: positive
3. Headline: Occidental Asset Management LLC Buys 14,623 Shares of Apple Inc. $AAPL
Summary: Occidental Asset Management LLC raised its stake in Apple Inc. (NASDAQ:AAPL - Free Report) by 8.9% during the 4th quarter, according to the company in its most recent 13F filing with the Securities & Exchange Commission. The firm owned 178,223 shares of the iPhone maker's stock after acquiring
Sentiment: positive
4. Headline: Northside Capital Management LLC Cuts Stock Position in Apple Inc. $AAPL
Summary: Northside Capital Management LLC decreased its holdings in shares of Apple Inc. (NASDAQ:AAPL - Free Report) by 3.7% during the 4th quarter, according to its most recent 13F filing with the Securities and Exchange Commission. The institutional investor owned 94,470 shares of the iPhone maker's stoc
Sentiment: negative
5. Headline: Lake Street Private Wealth LLC Grows Stock Holdings in Apple Inc. $AAPL
Summary: Lake Street Private Wealth LLC lifted its stake in Apple Inc. (NASDAQ:AAPL - Free Report) by 13.5% in the fourth quarter, according to the company in its most recent disclosure with the Securities and Exchange Commission (SEC). The institutional investor owned 170,167 shares of the iPhone maker's
Sentiment: positive
6. Headline: Apple Inc. $AAPL is Cyndeo Wealth Partners LLC's 3rd Largest Position
Summary: Cyndeo Wealth Partners LLC increased its holdings in Apple Inc. (NASDAQ:AAPL - Free Report) by 2.8% during the 4th quarter, according to its most recent Form 13F filing with the SEC. The fund owned 209,696 shares of the iPhone maker's stock after purchasing an additional 5,674 shares during the per
Sentiment: positive
7. Headline: Apple expands American manufacturing program with four new partners
Summary: The expansion builds on Apple’s American Manufacturing Program, a cornerstone of the company’s $600 billion, four-year commitment to U.S. manufacturing and innovation. Initial AMP partners — including Amkor, Broadcom, Corning, GlobalFoundries, and Texas Instruments — are already hitting ...
Sentiment: positive
8. Headline: Henrickson Nauta Wealth Advisors Inc. Purchases 2,860 Shares of Apple Inc. $AAPL
Summary: Henrickson Nauta Wealth Advisors Inc. increased its position in shares of Apple Inc. (NASDAQ:AAPL - Free Report) by 57.8% in the fourth quarter, according to its most recent 13F filing with the Securities & Exchange Commission. The institutional investor owned 7,805 shares of the iPhone maker'
Sentiment: positive
9. Headline: Tealwood Asset Management Inc. Reduces Holdings in Apple Inc. $AAPL
Summary: Tealwood Asset Management Inc. decreased its position in shares of Apple Inc. (NASDAQ:AAPL - Free Report) by 27.6% in the 4th quarter, according to its most recent 13F filing with the SEC. The firm owned 9,833 shares of the iPhone maker's stock after selling 3,750 shares during the quarter. Apple m
Sentiment: negative
10. Headline: Introducing Apple Business — a new all-in-one platform for businesses of all sizes - Apple
Summary: Apple today announced Apple Business, a new all-in-one platform that includes key services companies need to effortlessly manage devices, reach more customers, equip team members with essential apps and tools, and get support from experts to run and grow efficiently and securely.
Sentiment: neutral
Recent Updates
News Summary
Recent news highlights Apple's historical innovation legacy, current strategic initiatives, and product development challenges. The 1979 Silicon Valley demo is recognized as a foundational moment shaping Apple's trajectory. The company is preparing to introduce local advertising within Apple Maps and has launched the Apple Business platform, enhancing enterprise service offerings. Concurrently, Apple is accelerating development of AI-powered wearable devices, although some product upgrades, such as the Siri virtual assistant, have encountered delays. These developments collectively reflect Apple's ongoing efforts to expand its ecosystem and adapt to emerging technology trends while managing operational complexities.
News Sentiment
Sentiment across recent news is mixed to positive, with institutional confidence evident in increased holdings and strategic expansions. Neutral coverage dominates announcements related to new platforms and advertising initiatives, while product development challenges introduce a cautious tone. Overall, the sentiment suggests a balanced outlook with recognition of both growth opportunities and execution risks.
Analytical Overview
Analysis Summary
Valuation Metrics: Apple's trailing P/E ratio of 31.51 is aligned with the industry average, while its forward P/E of 26.71 suggests anticipated earnings growth. The elevated price-to-book ratio reflects market confidence in intangible assets and innovation potential.
Growth Trajectory: Revenue growth of 15.7% year-over-year and strong operating cash flow exceeding $135 billion indicate a solid growth trajectory supported by robust product demand and service expansion.
Financial Health: The company maintains a manageable debt-to-equity ratio of approximately 102.63%, supported by substantial cash reserves of over $66 billion and strong free cash flow generation, underscoring financial stability.
Sector Specific Factors: Apple faces sector-specific challenges including rapid technological change and competitive pressures in wearables and AI, while opportunities arise from expanding services and manufacturing initiatives in the U.S.
Market Positioning: Apple's leadership in integrated hardware and software ecosystems, combined with strong brand loyalty and global reach, provide competitive advantages in the technology sector.
Investment Conclusion
Supporting Factors: Strong revenue growth and profitability metrics support ongoing business strength.
Risk Factors: High valuation multiples may limit upside potential in volatile markets.
SWOT Analysis
Strengths
- Market leadership with a diversified product and services ecosystem.
- Strong brand recognition and customer loyalty worldwide.
- Robust financial position with high cash reserves and cash flow.
- Innovative culture driving continuous product development.
Weaknesses
- High valuation ratios may constrain market expectations.
- Dependence on flagship products like the iPhone for revenue.
- Relatively high debt-to-equity ratio compared to some peers.
- Occasional delays in product launches impacting momentum.
Opportunities
- Expansion of services and subscription-based platforms.
- Growth potential in AI-powered wearable devices.
- Increased manufacturing presence in the United States.
- Development of enterprise-focused solutions like Apple Business.
Threats
- Intense competition in consumer electronics and software sectors.
- Regulatory scrutiny and geopolitical risks affecting operations.
- Rapid technological changes requiring constant innovation.
- Supply chain disruptions impacting product availability.
Company Description
Apple Inc. is a leading technology company renowned for designing, manufacturing, and marketing innovative hardware and software products for consumers and businesses worldwide. Its flagship product, the iPhone, accounts for the majority of sales, serving as the central hub of an expansive ecosystem that includes Mac computers, iPad tablets, Apple Watch wearables, and accessories like AirPods. Apple Inc. also offers a suite of services such as the App Store, Apple Music, iCloud, Apple TV+, and Apple Fitness+, providing digital content, cloud storage, and subscription-based platforms. Operating in the consumer electronics industry within the technology sector, the company employs approximately 166,000 people and maintains a broad global presence through online stores, retail outlets, and partnerships with carriers and resellers. With a substantial market capitalization reflecting its scale, Apple Inc. plays a pivotal role in shaping consumer technology trends, emphasizing seamless integration across devices and services to enhance user experience and productivity.