
Apple Inc (AAPL)
Stock Analysis Report
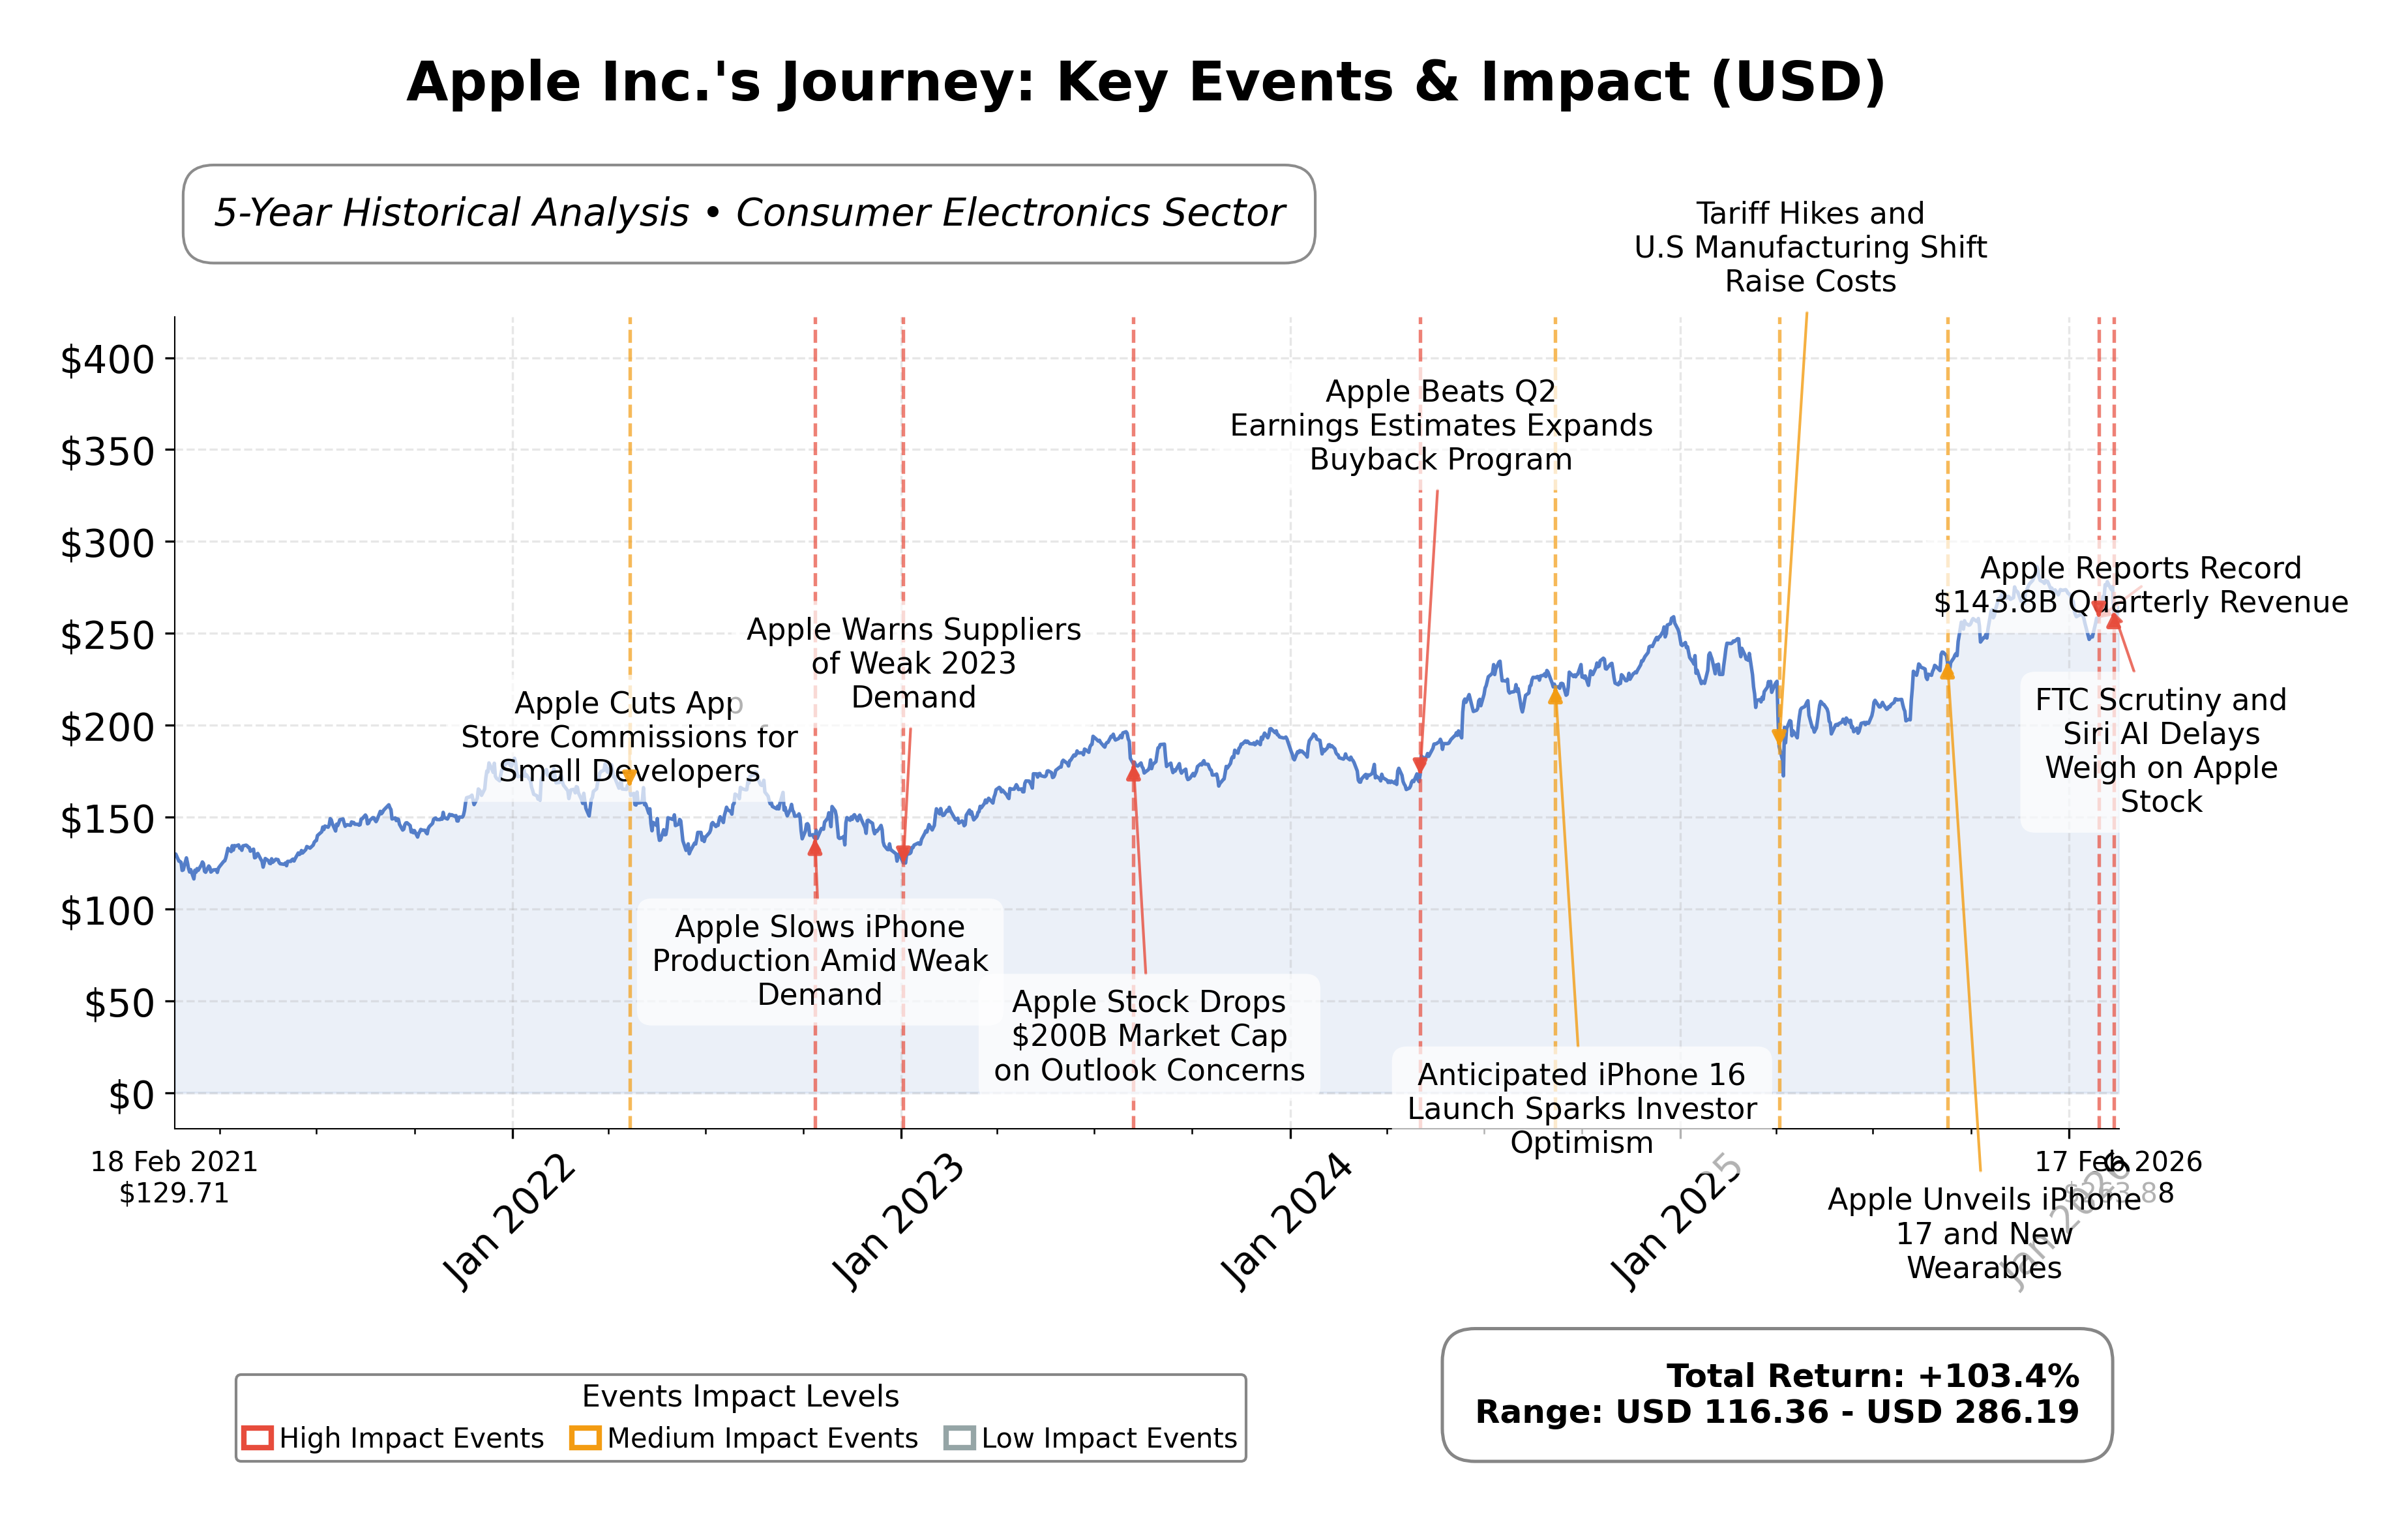
Stock Journey
Key Positives and Key Risks
Pros
- Market capitalization of $3.76 trillion reflects Apple's dominant industry position and scale.
- Quarterly revenue growth of 15.7% and profit margin of 27.0% indicate strong financial performance.
- Operating cash flow of $135 billion and free cash flow of $106 billion demonstrate robust liquidity and cash generation.
Cons
- High trailing P/E ratio of 32.38 and price-to-book ratio of 42.64 suggest elevated valuation levels.
- Current ratio of 0.974 indicates tight short-term liquidity, which may pose operational constraints.
- Recent removal of ESG modifiers from executive pay packages may raise governance concerns.
Disclosure: This information is for general awareness and does not constitute investment advice
Report Summary
Apple Inc. is a leading technology company specializing in designing, manufacturing, and marketing consumer electronics and software products. Operating primarily in the consumer electronics industry within the technology sector, Apple is globally recognized for its flagship iPhone, alongside a broad ecosystem including Mac computers, iPads, wearables, and digital services. The company maintains a significant presence worldwide through direct retail, online stores, and partnerships.
Financially, Apple exhibits robust metrics with a market capitalization exceeding $3.75 trillion and a trailing P/E ratio of approximately 32.38, reflecting premium valuation consistent with its industry peers. The company reported strong revenue growth of 15.7% year-over-year, with a profit margin of 27.0% and operating margin of 35.4%. Cash flow generation remains healthy, with operating cash flow surpassing $135 billion and free cash flow around $106 billion. Dividend yield stands modestly at 0.41%, supported by a low payout ratio near 13%.
From a strategic perspective, Apple continues to innovate with recent initiatives around AI-powered wearables and expanding its services ecosystem. Leadership remains stable under CEO Tim Cook, though recent removal of ESG modifiers from executive pay packages has drawn attention. Strengths include a dominant brand, strong cash flow, and diversified product portfolio, while risks involve high valuation multiples and competitive pressures in technology. Market sentiment is mixed, with recent news reflecting both optimism around product launches and caution on regulatory and ESG fronts.
Peer analysis within the consumer electronics sector in the United States reveals Appleâs market cap and valuation metrics significantly exceed those of regional competitors such as Sony Group Corporation, which has a market cap near $138 billion and lower valuation multiples. Appleâs premium pricing ratios and scale underscore its dominant market positioning, although this also implies heightened expectations and potential valuation risks relative to peers.
Apple navigates a complex industry landscape marked by rapid technological change and evolving consumer preferences. Recent achievements include strong quarterly growth and product innovation, while challenges persist in regulatory scrutiny and maintaining valuation support. The company stands at a pivotal moment where strategic execution on AI and wearables could drive future growth, but valuation and external risks remain key considerations. Given these factors, a balanced stance reflecting ongoing observation of market developments and financial performance may be appropriate.
Company and Industry Overview
Company Basics
Price Performance
Company Size
Shareholding Pattern
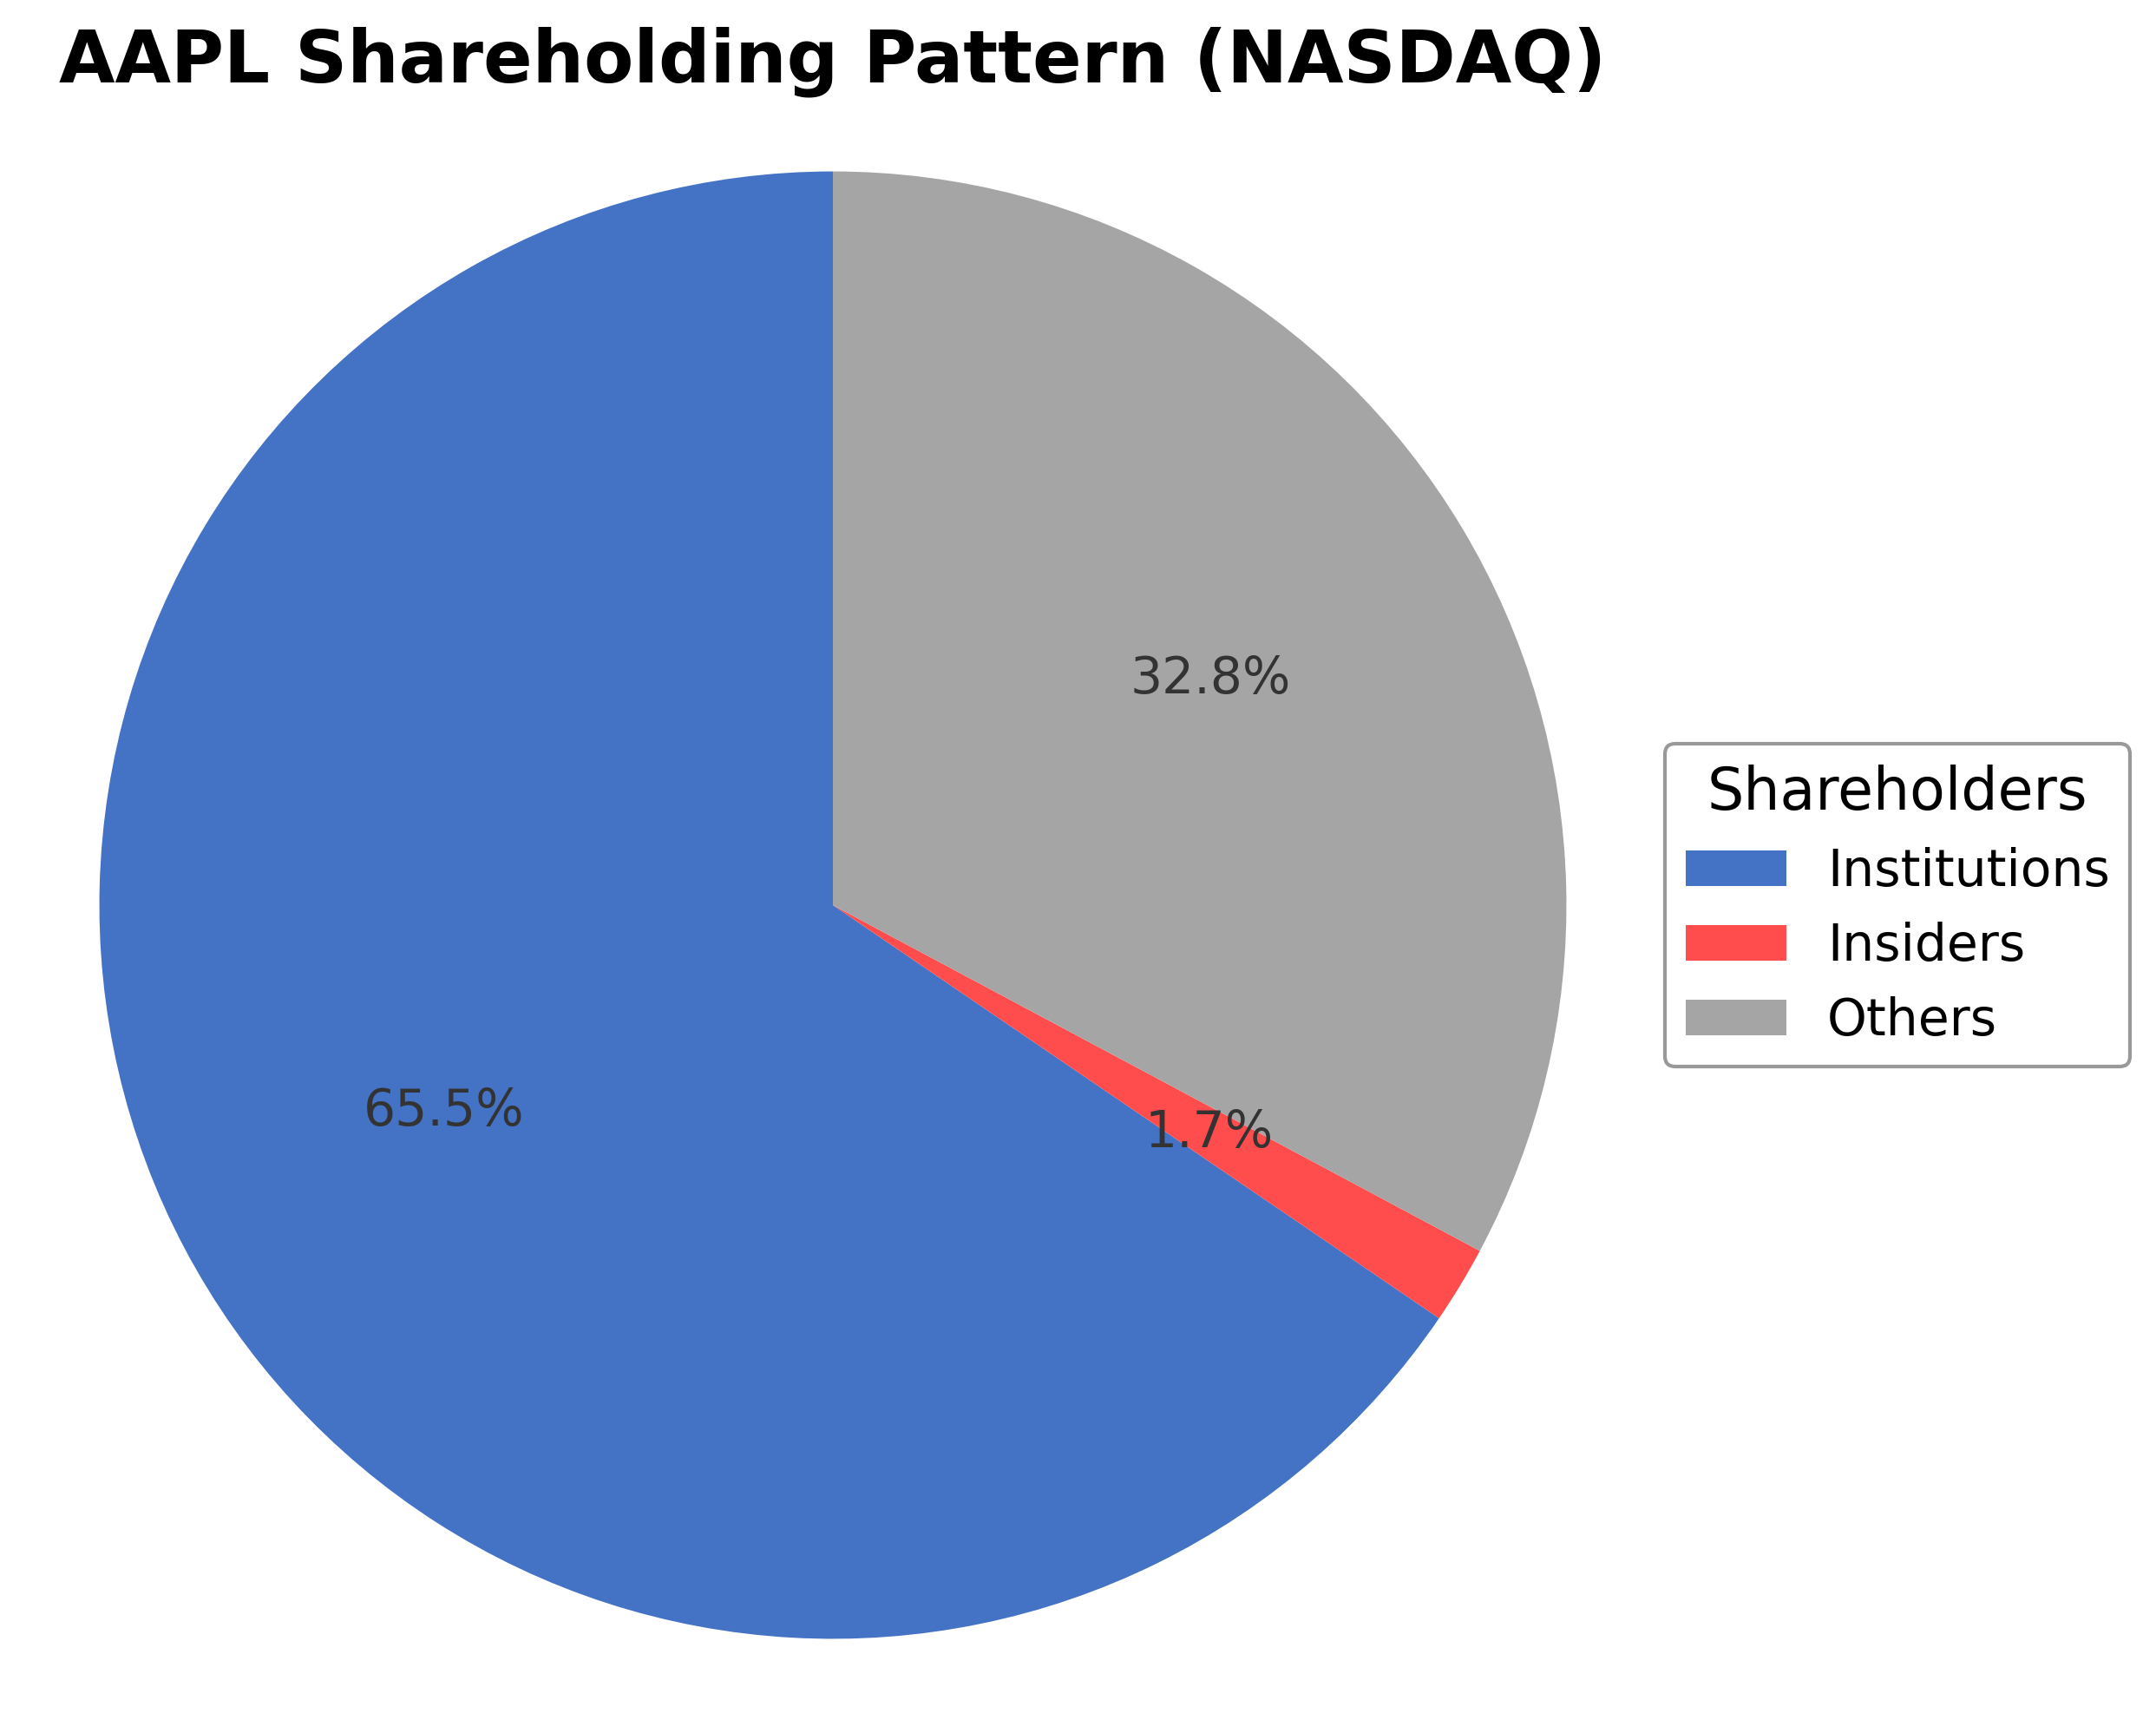
Apple Inc.'s ownership structure is characterized by a significant institutional investor presence, holding approximately 65.48% of shares, while insiders such as executives and board members hold around 1.71%. The remaining shares, approximately 34.52%, are held by public and other shareholders including retail investors and employee stock plans. Over the past 12-24 months, institutional ownership has shown steady accumulation, with notable increases from major funds such as Woodline Partners LP. This pattern suggests sustained confidence from large investors and reflects strong governance frameworks. The ownership distribution supports strategic continuity and positions the company well for future corporate actions within the competitive consumer electronics industry.
Sector and Industry Analysis
Apple Inc. (AAPL) operates within the broader Technology sector, specifically the Consumer Electronics and Software industry. The global technology sector is characterized by rapid innovation, substantial market size, and significant revenue generation, with Apple alone reporting revenues exceeding $500 billion. The sector’s growth trajectory remains robust, driven by increasing digitalization, mobile computing, cloud adoption, and consumer demand for integrated hardware-software ecosystems. Key players alongside Apple include Microsoft, Samsung, Alphabet (Google), and Amazon, each commanding substantial market share in various sub-segments such as smartphones, personal computing, software services, and cloud infrastructure.
Industry trends shaping Apple’s operating environment include accelerated technology shifts such as the transition to 5G connectivity, augmented reality (AR), artificial intelligence (AI), and the expansion of subscription-based services. Consumer behavior is evolving towards seamless, interconnected devices and personalized digital experiences, with growing emphasis on privacy and sustainability. Emerging opportunities lie in wearable technology, health monitoring, digital payments, and content streaming, all areas where Apple has strategically invested. Additionally, the proliferation of remote work and education has increased demand for high-performance computing devices and cloud services, further expanding market potential.
The regulatory landscape for Apple and its peers is complex and multifaceted, encompassing data privacy laws (e.g., GDPR in Europe, CCPA in California), antitrust scrutiny, intellectual property rights, and environmental regulations. Compliance requirements are stringent, particularly regarding user data protection and transparency in app marketplaces. Policy impacts include ongoing investigations into monopolistic practices related to app store commissions and platform control, which could influence operational models and revenue streams. Environmental regulations also drive corporate sustainability initiatives, with Apple emphasizing ESG (Environmental, Social, Governance) factors to align with regulatory expectations and investor preferences.
Competitive dynamics in the consumer technology industry are intense, with high barriers to entry due to substantial capital requirements, advanced R&D capabilities, brand equity, and global supply chain networks. Apple’s competitive positioning benefits from its vertically integrated ecosystem, strong brand loyalty, and continuous innovation in product design and software services. The market structure is oligopolistic, with a few dominant firms controlling significant market share and leveraging economies of scale. However, rapid technological change demands constant adaptation, and competition from emerging players in China and India, as well as disruptive startups, remains a factor influencing strategic decisions and market share retention.
Note: Analysis synthesized from industry research, market reports, and regulatory filings. Information is subject to change based on market conditions.
Illustrative Scenario Analysis
DCF Assumptions:
Method: Two-Stage EPS-Priority Model
Financials
Peer Analysis
| Company Name | Market Cap | P/E Ratio | P/B Ratio | EV/EBITDA | Price to CFO |
|---|---|---|---|---|---|
| Apple Inc. | $3.76T | 32.38 | 42.64 | 24.71 | 27.75 |
| Sony Group Corporation - Sponsored American Depositary Receipt | $138.29B | 17.07 | 2.56 | 0.03 | 10.35 |
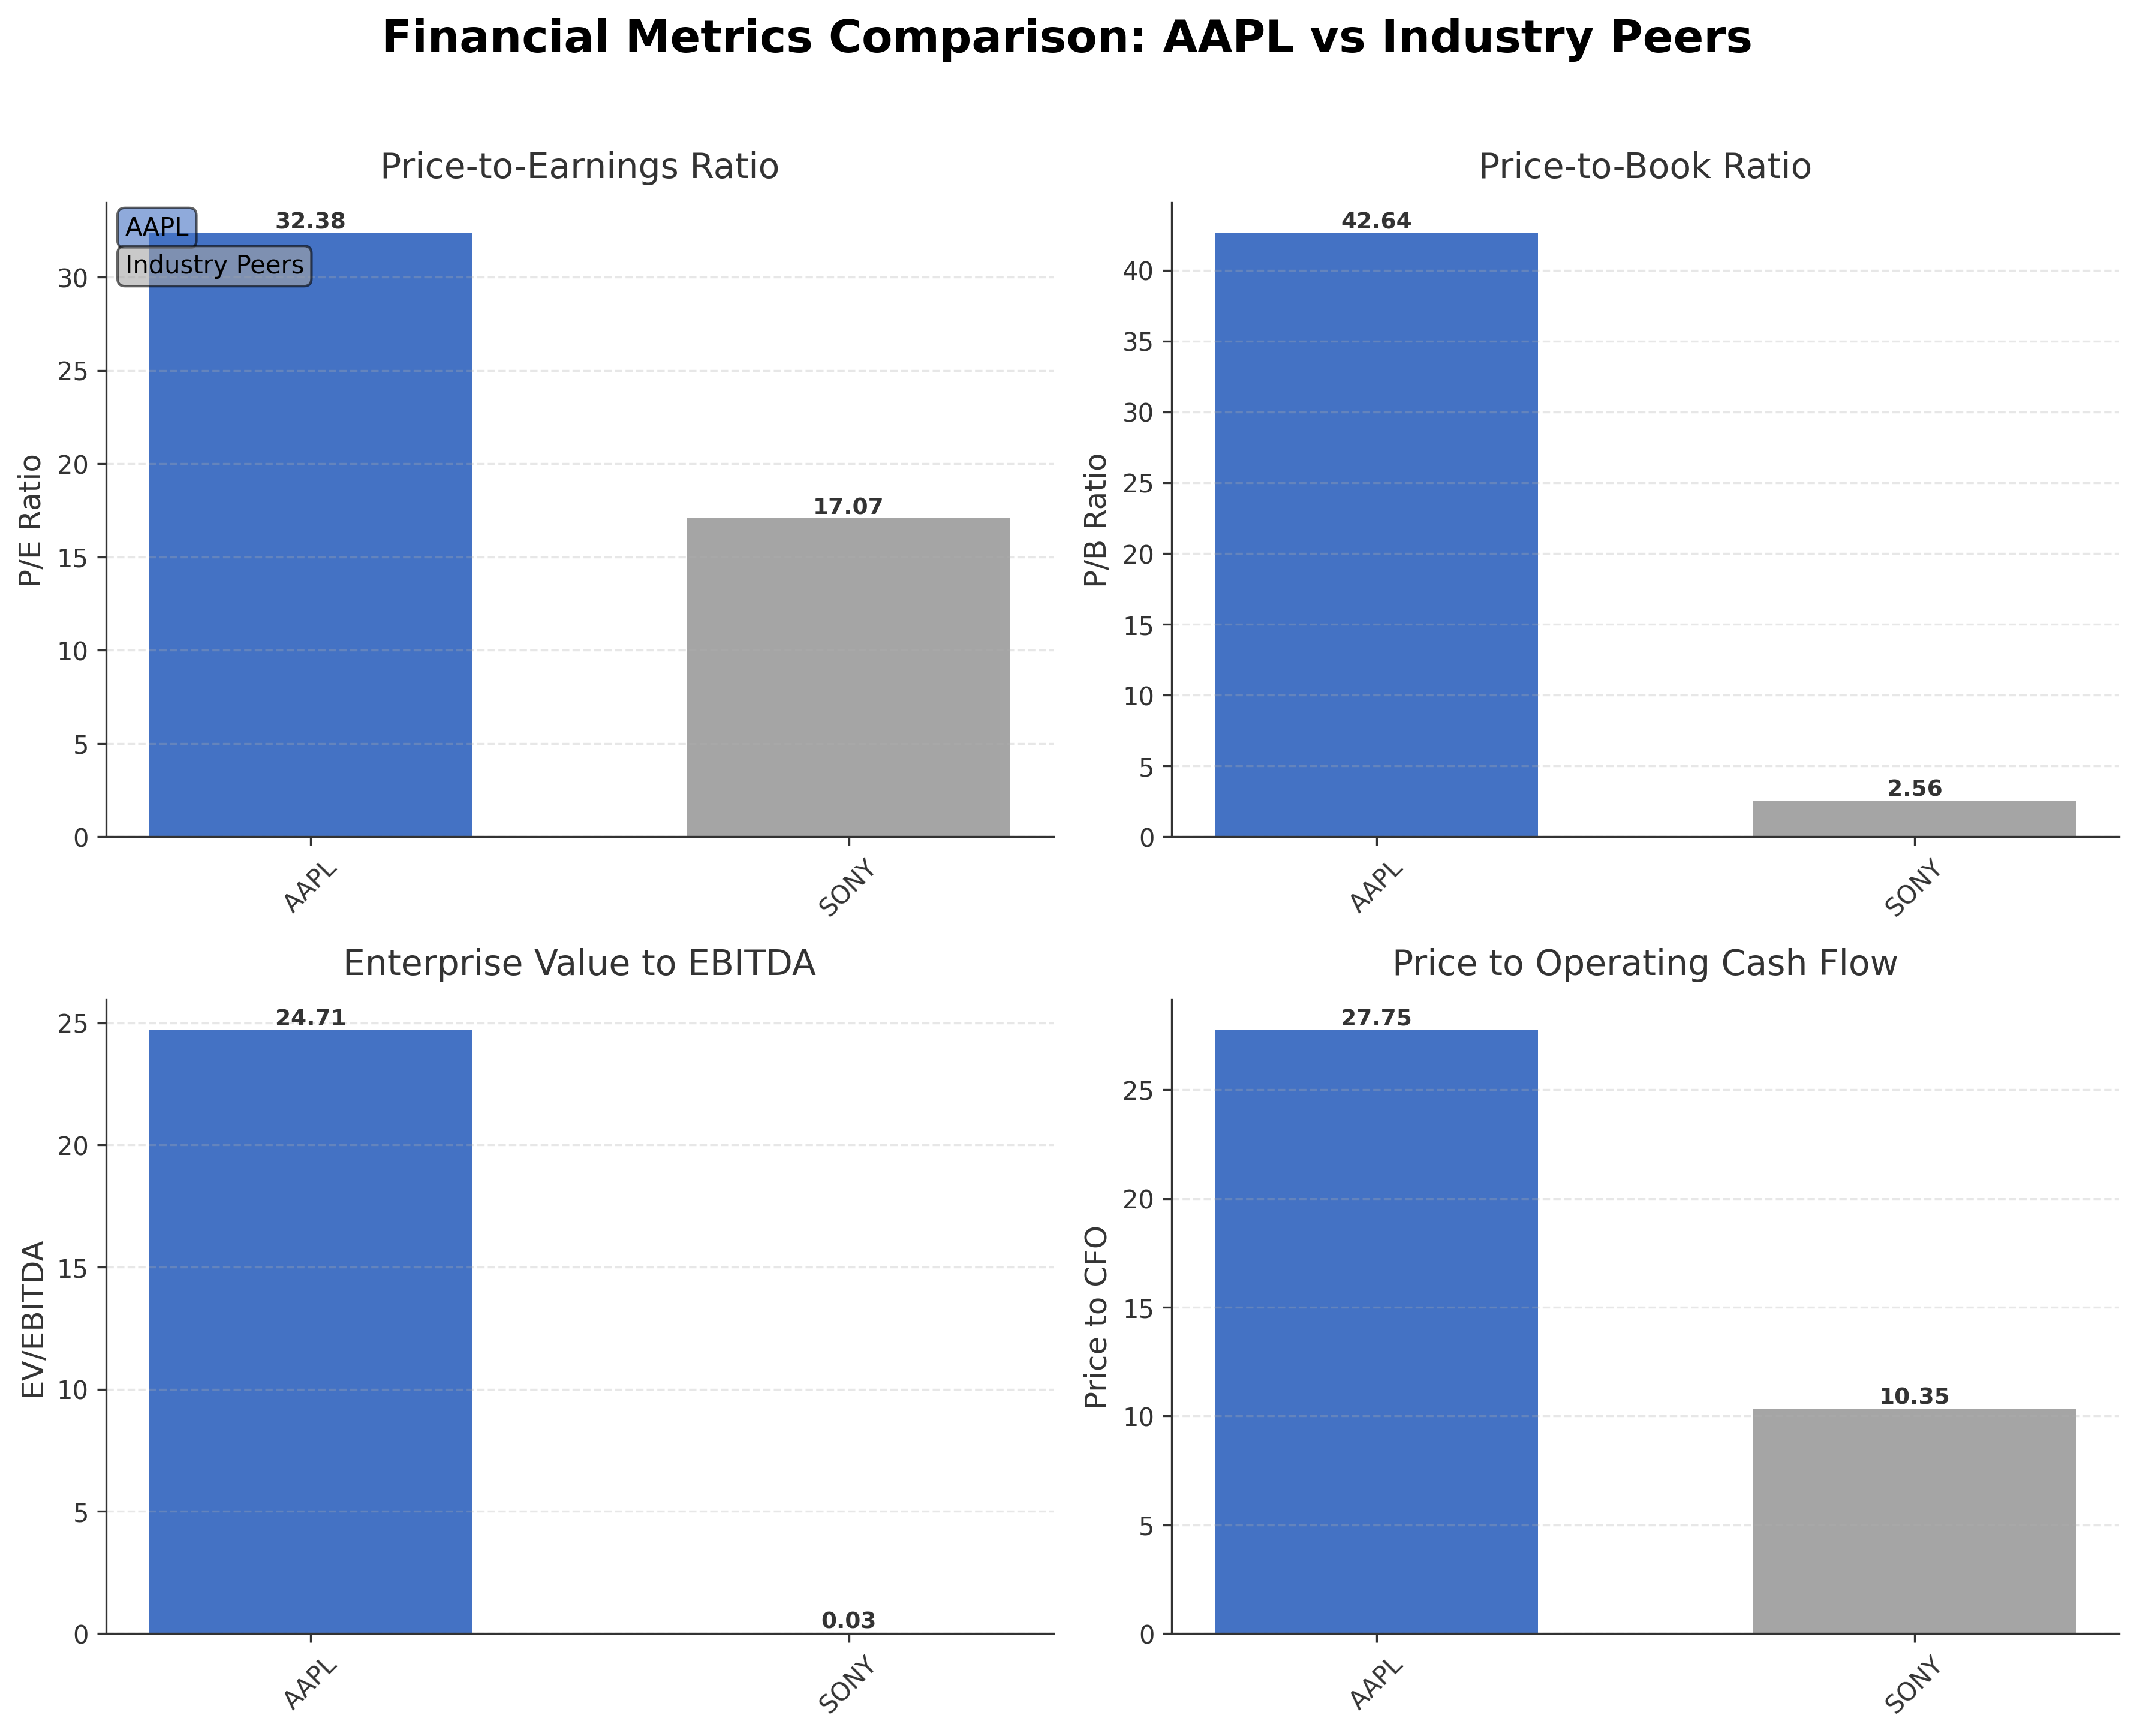
Comparison Analysis: Apple Inc. significantly surpasses its regional peer Sony Group Corporation in market capitalization and valuation multiples. Apple's P/E ratio of 32.38 and price-to-book ratio of 42.64 reflect a premium valuation compared to Sony's 17.07 P/E and 2.56 P/B ratios. Enterprise value to EBITDA and price to CFO metrics also indicate Apple's higher valuation levels. This premium is consistent with Apple's dominant market position, strong brand equity, and robust cash flow generation, though it also implies elevated expectations relative to peers in the consumer electronics sector.
Financial Metrics Comparison with Peers
Financial Statements
Comprehensive financial data including income, balance sheet, and cash flow metrics
Income Statement
| fiscal_date | 2025-09-30 | 2024-09-30 | 2023-09-30 | 2022-09-30 | 2021-09-30 |
|---|---|---|---|---|---|
| Sales | 416.16B | 391.04B | 383.29B | 394.33B | 365.82B |
| Cost Of Goods | 220.96B | 210.35B | 214.14B | 223.55B | 212.98B |
| Gross Profit | 195.20B | 180.68B | 169.15B | 170.78B | 152.84B |
| Operating Expense Research And Development | 34.55B | 31.37B | 29.91B | 26.25B | 21.91B |
| Operating Expense Selling General And Administrative | 27.60B | 26.10B | 24.93B | 25.09B | 21.97B |
| Operating Income | 133.05B | 123.22B | 114.30B | 119.44B | 108.95B |
| Other Income Expense | -321.00M | 269.00M | -565.00M | -334.00M | 60.00M |
| Pretax Income | 132.73B | 123.48B | 113.74B | 119.10B | 109.21B |
| Income Tax | 20.72B | 29.75B | 16.74B | 19.30B | 14.53B |
| Net Income | 112.01B | 93.74B | 97.00B | 99.80B | 94.68B |
| Eps Basic | 7.49 | 6.11 | 6.16 | 6.15 | 5.67 |
| Eps Diluted | 7.46 | 6.08 | 6.13 | 6.11 | 5.61 |
| Basic Shares Outstanding | 14.95B | 15.34B | 15.74B | 16.22B | 16.70B |
| Diluted Shares Outstanding | 14.95B | 15.34B | 15.74B | 16.22B | 16.70B |
| Ebit | 133.05B | 123.22B | 114.30B | 119.44B | 111.85B |
| Ebitda | 144.75B | 134.66B | 125.82B | 130.54B | 123.14B |
| Net Income Continuous Operations | 112.01B | 93.74B | 97.00B | 99.80B | 94.68B |
| Non Operating Interest Income | N/A | N/A | 3.75B | 2.83B | 2.84B |
| Non Operating Interest Expense | N/A | N/A | 3.93B | 2.93B | 2.65B |
Data provided by Twelve Data
Balance Sheet
| fiscal_date | 2025-12-31 | 2025-09-30 | 2025-06-30 | 2025-03-31 | 2024-12-31 |
|---|---|---|---|---|---|
| Cash And Cash Equivalents | 45.32B | 35.93B | 36.27B | 28.16B | 30.30B |
| Accounts Receivable | 39.92B | 39.78B | 27.56B | 26.14B | 29.64B |
| Total Assets | 379.30B | 359.24B | 331.50B | 331.23B | 344.08B |
| Total Liabilities | 291.11B | 285.51B | 265.67B | 264.44B | 277.33B |
| Long Term Debt | 76.69B | 78.33B | 82.43B | 78.57B | 83.96B |
| Shareholders Equity | 88.19B | 73.73B | 65.83B | 66.80B | 66.76B |
Data provided by Twelve Data
Cash Flow Statement
| fiscal_date | 2025-09-30 | 2024-09-30 | 2023-09-30 | 2022-09-30 | 2021-09-30 |
|---|---|---|---|---|---|
| Operating Activities Net Income | 112.01B | 93.74B | 97.00B | 99.80B | 94.68B |
| Operating Activities Depreciation | 11.70B | 11.45B | 11.52B | 11.10B | 11.28B |
| Operating Activities Stock Based Compensation | 12.86B | 11.69B | 10.83B | 9.04B | 7.91B |
| Operating Activities Other Non Cash Items | -89.00M | -2.27B | -2.23B | 1.01B | -4.92B |
| Operating Activities Accounts Receivable | -7.03B | -5.14B | -417.00M | -9.34B | -14.03B |
| Operating Activities Accounts Payable | 902.00M | 6.02B | -1.89B | 9.45B | 12.33B |
| Operating Activities Other Assets Liabilities | -18.87B | 2.77B | -4.27B | 1.57B | -1.53B |
| Operating Activities Operating Cash Flow | 111.48B | 118.25B | 110.54B | 123.52B | 100.94B |
| Investing Activities Capital Expenditures | -12.71B | -9.45B | -10.96B | -10.71B | -11.09B |
| Investing Activities Purchase Of Investments | -24.41B | -48.66B | -29.51B | -76.92B | -109.56B |
| Investing Activities Sale Of Investments | 53.80B | 62.35B | 45.51B | 67.36B | 106.48B |
| Investing Activities Other Investing Activity | -1.48B | -1.31B | -1.34B | -2.09B | -385.00M |
| Investing Activities Investing Cash Flow | 15.20B | 2.94B | 3.71B | -22.66B | -14.58B |
| Financing Activities Long Term Debt Issuance | 4.48B | 0.00 | 5.23B | 5.46B | 20.39B |
| Financing Activities Long Term Debt Payments | -10.93B | -9.96B | -11.15B | -9.54B | -8.75B |
| Financing Activities Short Term Debt Issuance | -2.03B | 3.96B | -3.98B | 3.96B | 1.02B |
| Financing Activities Common Stock Repurchase | -90.71B | -94.95B | -77.55B | -89.40B | -85.97B |
| Financing Activities Common Dividends | -15.42B | -15.23B | -15.03B | -14.84B | -14.47B |
| Financing Activities Other Financing Charges | -6.07B | -5.80B | -6.01B | -6.38B | -5.58B |
| Financing Activities Financing Cash Flow | -120.69B | -121.98B | -108.49B | -110.75B | -92.25B |
| End Cash Position | 35.93B | 29.94B | 30.74B | 24.98B | 35.93B |
| Income Tax Paid | 43.37B | 26.10B | 18.68B | 19.57B | 25.39B |
| Free Cash Flow | 98.77B | 108.81B | 99.58B | 111.44B | 92.95B |
| Interest Paid | N/A | N/A | 3.80B | 2.87B | 2.69B |
| Operating Activities Deferred Taxes | N/A | N/A | N/A | 895.00M | -4.77B |
| Investing Activities Net Acquisitions | N/A | N/A | N/A | -306.00M | -33.00M |
| Financing Activities Common Stock Issuance | N/A | N/A | N/A | N/A | 1.10B |
Data provided by Twelve Data
Technical Analysis
Key Insights
- The current trend shows a moderate downward price action from the 52-week high of $288.62 to the current price near $264.32, indicating some recent profit-taking.
- Key support levels are observed near the 200-day moving average at approximately $240.06, while resistance is near the 50-day moving average at $267.48 and the recent high of $288.62.
- The stock price is currently below the 50-day moving average but above the 200-day moving average, suggesting mixed momentum across short and long-term timeframes.
- Momentum indicators show RSI near neutral levels, MACD indicates a slight bearish crossover, and stochastic oscillators reflect consolidation without clear directional bias.
- Multi-timeframe analysis reveals daily charts showing consolidation, weekly charts indicating a mild uptrend, and monthly charts maintaining a long-term bullish trend.
- Potential market scenarios include a test of support at the 200-day moving average or a rebound toward resistance levels, depending on broader market sentiment and sector performance.
Trending News
1. Headline: AAPL Stock Today: February 18 - Apple AI Wearables Buzz Lifts Nasdaq
Summary: Nasdaq today edges higher as Apple shares jump over 3% on AI wearables buzz. The report explains key catalysts this week and highlights Apple's technical setup amid positive market sentiment.
Sentiment: Positive
Summary: Berkshire Hathaway maintains Apple as its largest holding, signaling confidence despite inherent investment risks. The article discusses implications of Buffett's CEO transition on Apple stock.
Sentiment: Neutral
3. Headline: Mark Zuckerberg said he reached out to Apple CEO Tim Cook to discuss 'wellbeing of teens and kids'
Summary: Meta CEO Mark Zuckerberg testified about social media safety and revealed outreach to Apple CEO Tim Cook regarding youth wellbeing. The discussion occurs amid major industry regulatory scrutiny.
Sentiment: Neutral
4. Headline: Apple Quietly Drops ESG Links From Top Executives’ Pay Packages
Summary: Apple has removed environmental, social, and governance (ESG) performance modifiers from executive compensation in 2025, signaling a shift in corporate governance priorities amid evolving stakeholder expectations.
Sentiment: Negative
5. Headline: Apple Offers Haven From AI-Driven Swings as Nasdaq Ties Weaken (AAPL)
Summary: Apple demonstrates resilience amid AI-fueled volatility affecting other tech stocks, providing a relatively stable alternative within the Nasdaq amid recent market fluctuations.
Sentiment: Positive
Powered by Brave
Recent Updates
News Summary
Recent news highlights Apple's accelerated development of AI-powered wearable devices, including glasses and camera AirPods, reflecting a strategic pivot toward emerging technologies. Concurrently, historical reflections on Steve Jobs' turnaround strategies provide context for Apple's ongoing innovation and restructuring efforts. Collaboration with Google on AI music creation signals expansion into new digital content areas. Institutional activity includes Woodline Partners LP increasing its stake, indicating continued confidence from select investors. Leadership commentary underscores CEO Tim Cook's commitment to maintaining Apple's brand strength despite market challenges.
News Sentiment
Sentiment across recent updates is mixed, with positive signals from product innovation and institutional stake increases balanced by cautious views on AI integration and historical challenges. Negative sentiment arises from concerns about competitive pressures and strategic shifts, while positive sentiment is linked to brand resilience and technological advancement. Overall, the news cycle reflects a dynamic environment with both opportunities and uncertainties influencing market perception.
Analytical Overview
Analysis Summary
Apple's valuation metrics, including a trailing P/E of 32.38 and forward P/E of 27.54, are elevated relative to industry averages, reflecting premium market expectations aligned with its strong brand and growth prospects.
The company demonstrates a solid growth trajectory with quarterly revenue growth of 15.7% and consistent positive earnings growth, supported by robust operating and free cash flows exceeding $135 billion and $106 billion respectively.
Financial health indicators reveal a manageable debt-to-equity ratio near 0.95 and a current ratio just below 1, indicating sufficient liquidity alongside prudent leverage management. Cash reserves remain substantial at over $66 billion.
Sector-specific challenges include intense competition in consumer electronics and evolving regulatory scrutiny, while opportunities arise from AI integration, wearable technology expansion, and service ecosystem growth.
Consideration of market positioning and competitive advantages highlights Apple's dominant ecosystem, brand loyalty, and innovation pipeline as key factors supporting its strategic outlook.
Investment Conclusion
Supporting Factors: Primary supporting factors include strong revenue and earnings growth, substantial cash flow generation, and a leading market position with diversified product lines.
Risk Factors: Main risk factors to monitor are the high valuation multiples, potential regulatory and ESG-related challenges, and competitive dynamics within the technology sector.
SWOT Analysis
Strengths
- Apple Inc. has a globally recognized brand with strong customer loyalty.
- The company generates substantial free cash flow supporting investments and dividends.
- A diversified product ecosystem enhances revenue stability and cross-selling opportunities.
- Robust operating margins and profitability metrics indicate efficient operations.
Weaknesses
- High valuation multiples may limit upside potential in volatile markets.
- Current ratio below 1 suggests tight short-term liquidity management.
- Dependence on flagship products like the iPhone exposes revenue to product cycle risks.
- Executive compensation changes may raise governance concerns among stakeholders.
Opportunities
- Expansion into AI-powered wearables and services offers new growth avenues.
- Increasing institutional ownership signals potential for strategic capital allocation.
- Collaborations in AI and digital content can diversify revenue streams.
- Emerging markets provide scope for expanding customer base and sales.
Threats
- Intense competition in consumer electronics could pressure market share and margins.
- Regulatory scrutiny and ESG-related challenges may impact operational flexibility.
- Global supply chain disruptions could affect product availability and costs.
- Market volatility linked to technology sector trends may influence stock performance.
Company Description
Apple Inc. is a leading technology company renowned for designing, manufacturing, and marketing innovative hardware and software products for consumers and businesses worldwide. Its flagship product, the iPhone, accounts for the majority of sales, serving as the central hub of an expansive ecosystem that includes Mac computers, iPad tablets, Apple Watch wearables, and accessories like AirPods. Apple Inc. also offers a suite of services such as the App Store, Apple Music, iCloud, Apple TV+, and Apple Fitness+, providing digital content, cloud storage, and subscription-based platforms. Operating in the consumer electronics industry within the technology sector, the company employs approximately 166,000 people and maintains a broad global presence through online stores, retail outlets, and partnerships with carriers and resellers. With a substantial market capitalization reflecting its scale, Apple Inc. plays a pivotal role in shaping consumer technology trends, emphasizing seamless integration across devices and services to enhance user experience and productivity.