


Apple Inc (AAPL)
Stock Analysis Report
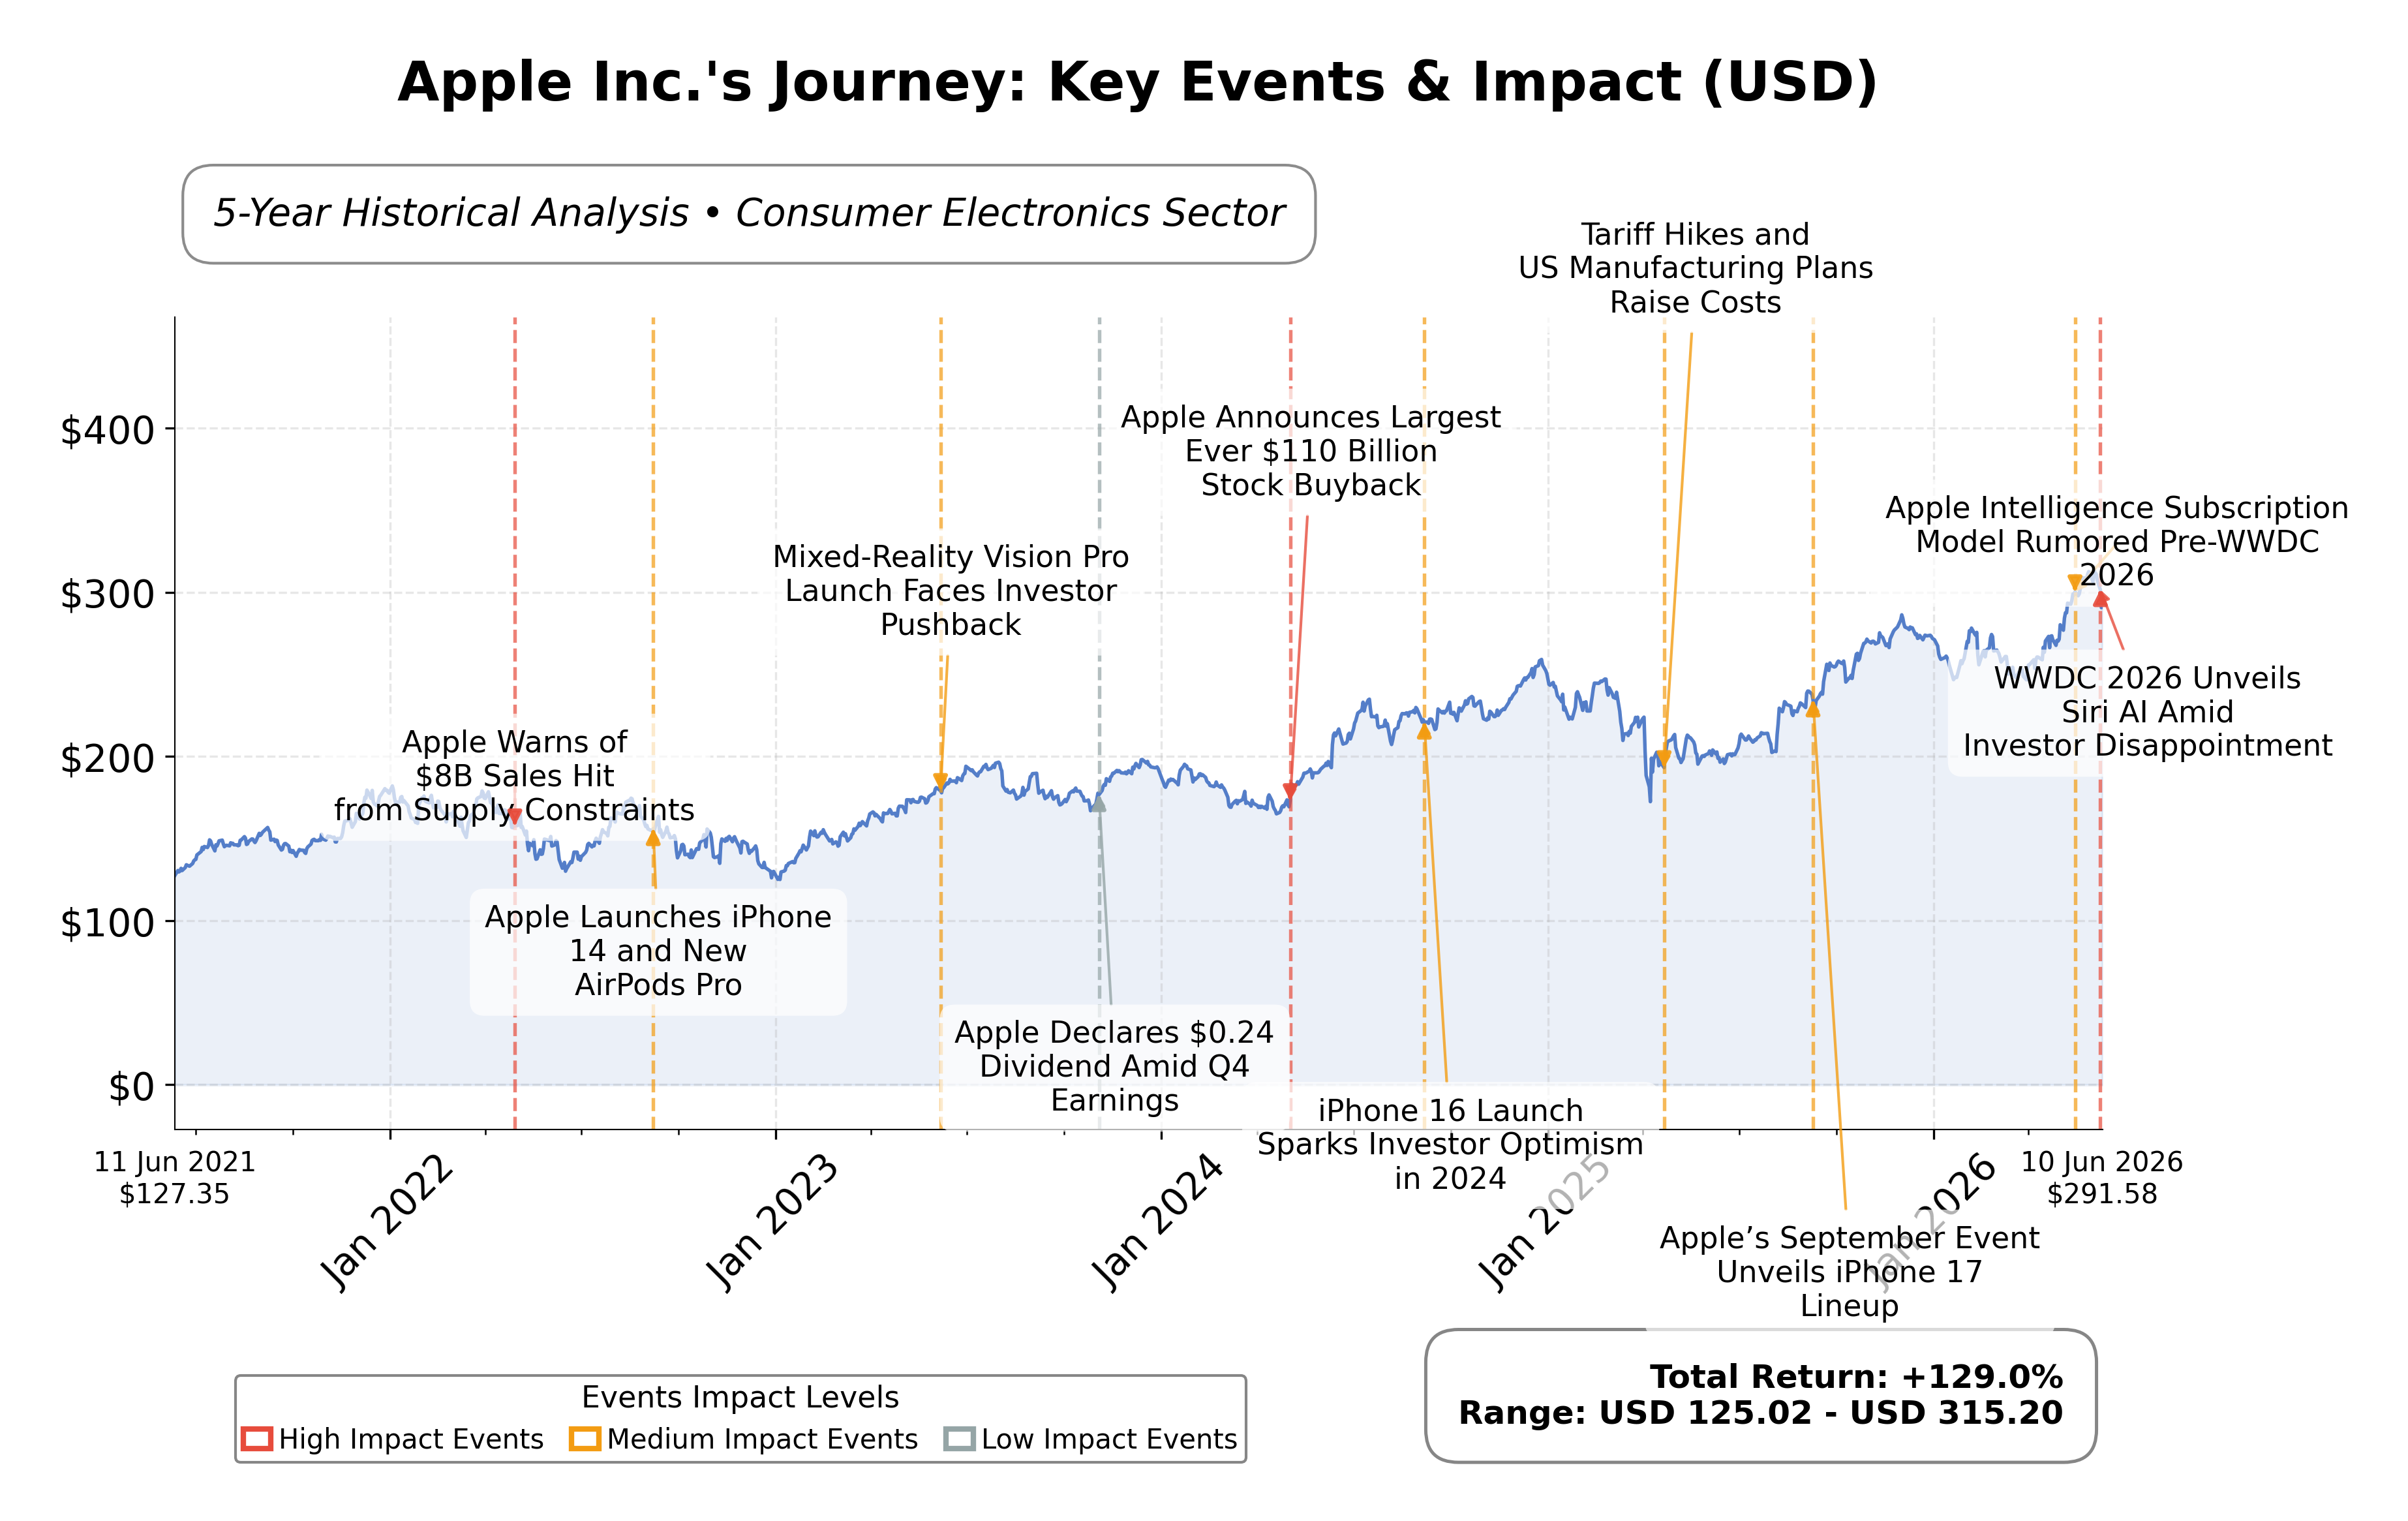
Stock Journey
Key Positives and Key Risks
Pros
- Revenue growth of 16-17% year-over-year indicating strong demand and expansion.
- Operating cash flow of $140.2 billion TTM demonstrating robust cash generation.
- Market capitalization of $4.51 trillion reflecting dominant market position.
Cons
- High trailing P/E ratio of 37.16 and price-to-book ratio of 42.33 suggesting premium valuation.
- Regulatory challenges in the EU delaying AI product rollout and compliance risks.
- Current ratio of 1.07 indicating limited short-term liquidity cushion.
Disclosure: This information is for general awareness and does not constitute investment advice
Report Summary
Apple Inc. is a leading global technology company listed on the NASDAQ exchange under the technology sector, specializing in consumer electronics and digital services. The company designs, manufactures, and markets a broad range of products including the iPhone, Mac computers, iPad tablets, wearables like Apple Watch and AirPods, and services such as the App Store and Apple Music. Apple operates worldwide, serving individual consumers, businesses, and government sectors, and holds a dominant market position with a strong ecosystem integrating hardware, software, and services.
Financially, Apple reported trailing twelve months (TTM) revenue of approximately $451.4 billion with a gross margin of 49.3%, operating margin of 32.3%, and net profit margin of 27.2%, indicating robust profitability and operational efficiency. The company’s return on equity (ROE) stands at 141.5%, and return on assets (ROA) at 26.2%, reflecting highly effective use of shareholder capital and assets. Operating cash flow reached $140.2 billion TTM, with free cash flow of $101.1 billion, underscoring strong cash generation capabilities.
Valuation metrics show a trailing price-to-earnings (P/E) ratio of 37.16, forward P/E of 31.99, and an enterprise value to EBITDA (EV/EBITDA) of 28.32, suggesting the stock is priced at a premium relative to earnings and cash flow. The price-to-book (P/B) ratio is notably high at 42.33, reflecting significant intangible assets and brand value. Apple’s market capitalization is approximately $4.51 trillion, with the stock trading near $291.50 within a 52-week range of $195.07 to $316.94, positioning the current price closer to the upper end of its annual trading band.
Key strengths include Apple’s massive cash reserves of $68.5 billion, relatively low debt of $84.7 billion, and a current ratio of 1.07 indicating adequate short-term liquidity. The company’s leadership in innovation, strong brand loyalty, and diversified product and service portfolio support its market leadership. Risks include regulatory challenges, particularly in the EU regarding AI compliance, competitive pressures in consumer electronics, and macroeconomic factors affecting supply chains. Recent strategic actions include the launch of new products such as the iPhone 17 series and M4-powered iPad Air, alongside a CEO transition with John Ternus assuming the role.
Technically, Apple’s stock is trading above its 50-day and 200-day moving averages, indicating an overall upward trend supported by strong momentum indicators. However, recent news and market reactions to AI product announcements have been mixed, reflecting some investor caution. The data suggests a nuanced market stance where accumulation and monitoring of developments may be prudent, given both positive growth signals and short-term volatility.
Company and Industry Overview
Company Basics
Price Performance
Company Size
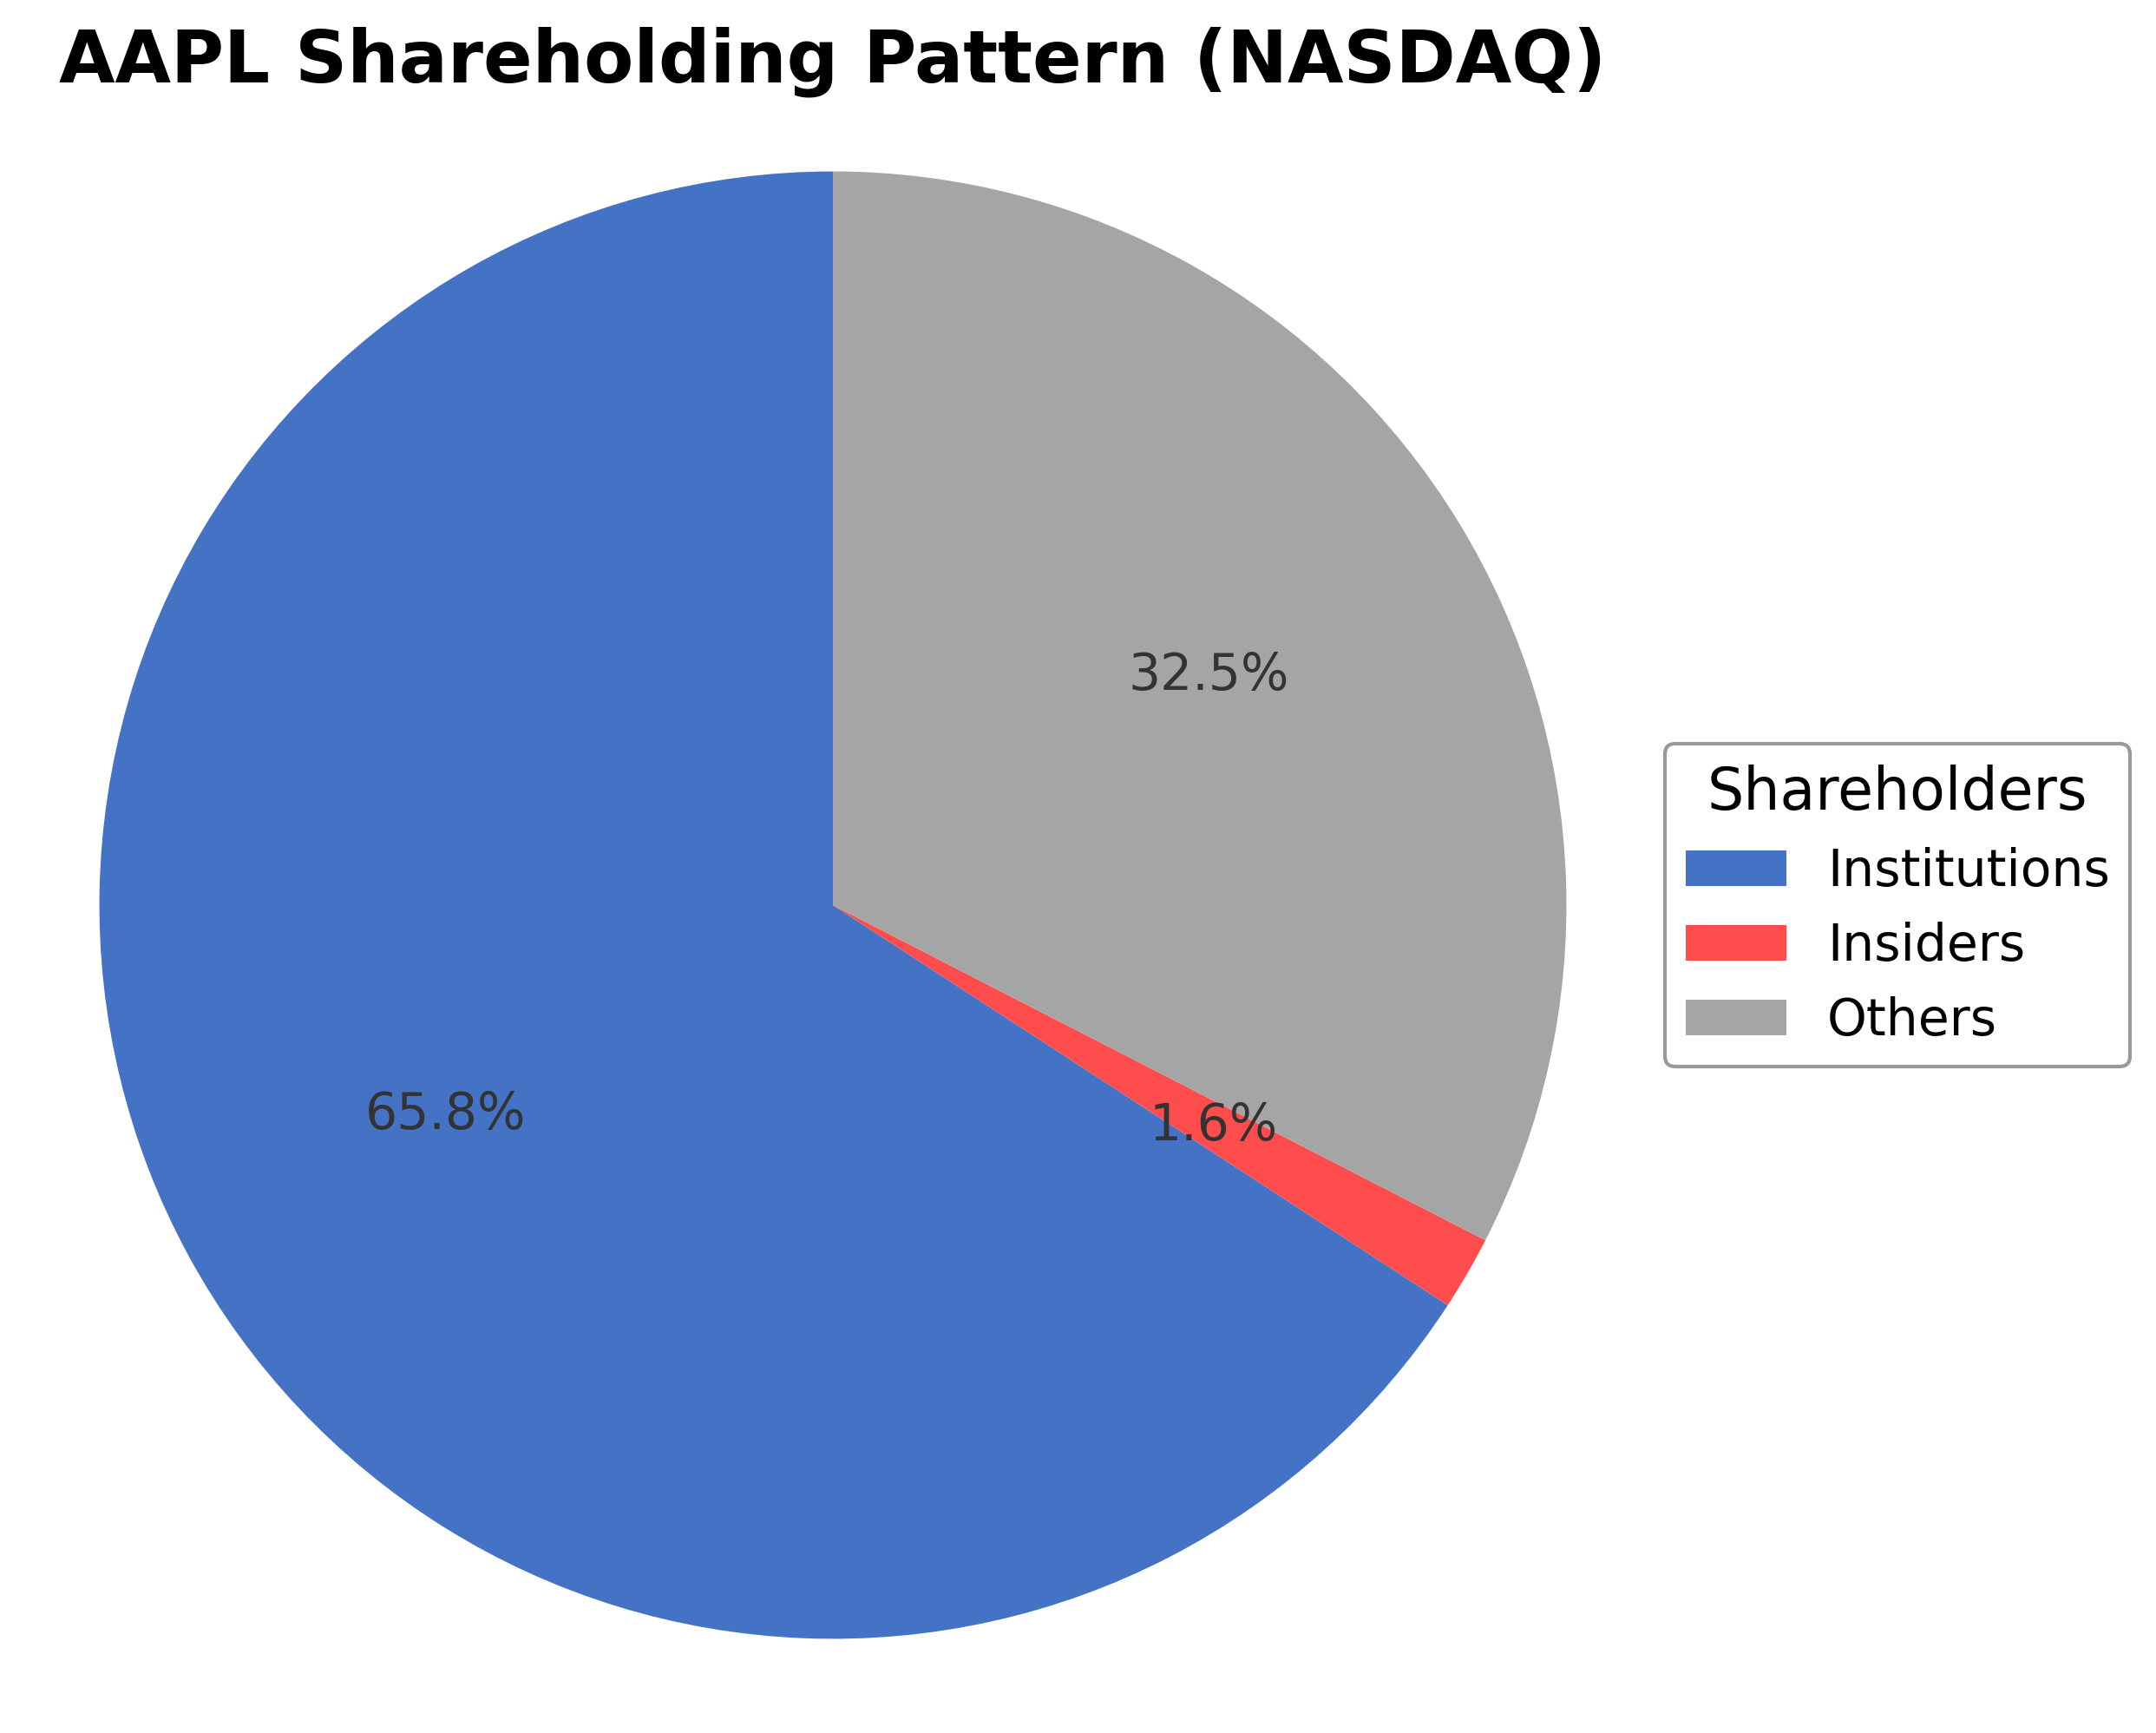
Shareholding Pattern
Sector and Industry Analysis
The global apple market is a significant segment within the agricultural sector, encompassing cultivation, harvesting, distribution, and retail of diverse apple varieties. The market is driven by increasing health awareness and demand for organic produce, with consumption spanning fresh fruit and processed products like juices and sauces. Key players include multinational corporations and local producers, with Asia and Europe representing major growth regions due to favorable growing conditions and strong consumer bases. Market size projections indicate steady growth through 2034, supported by technological advancements in farming and supply chain management.
Emerging trends in the apple industry include a rising preference for organic and locally sourced apples, innovations in packaging and storage to extend shelf life, and adoption of smart farming techniques to enhance productivity. Competitive dynamics are shaped by intensified rivalry between large international firms and smaller local growers, with strategic partnerships and technology collaborations becoming increasingly important. Barriers such as climatic variability, stringent food safety standards, and fluctuating trade tariffs pose challenges, requiring adaptive agricultural practices and supply chain resilience.
The regulatory environment is marked by increasingly rigorous food safety and quality standards that influence production and distribution strategies. Trade policies and export-import agreements are evolving, impacting pricing and market access, particularly in emerging markets. Additionally, sustainability frameworks and carbon pricing initiatives are shaping industry practices, encouraging investments in environmentally resilient cultivation methods. Overall, regulatory developments are driving innovation and compliance efforts across the apple value chain, affecting long-term market dynamics.
Note: Analysis synthesized from industry research, market reports, and regulatory filings. Information is subject to change based on market conditions.
Financial Ratios Dashboard
Illustrative Scenario Analysis
DCF Assumptions:
Method: Two-Stage EPS-Priority Model
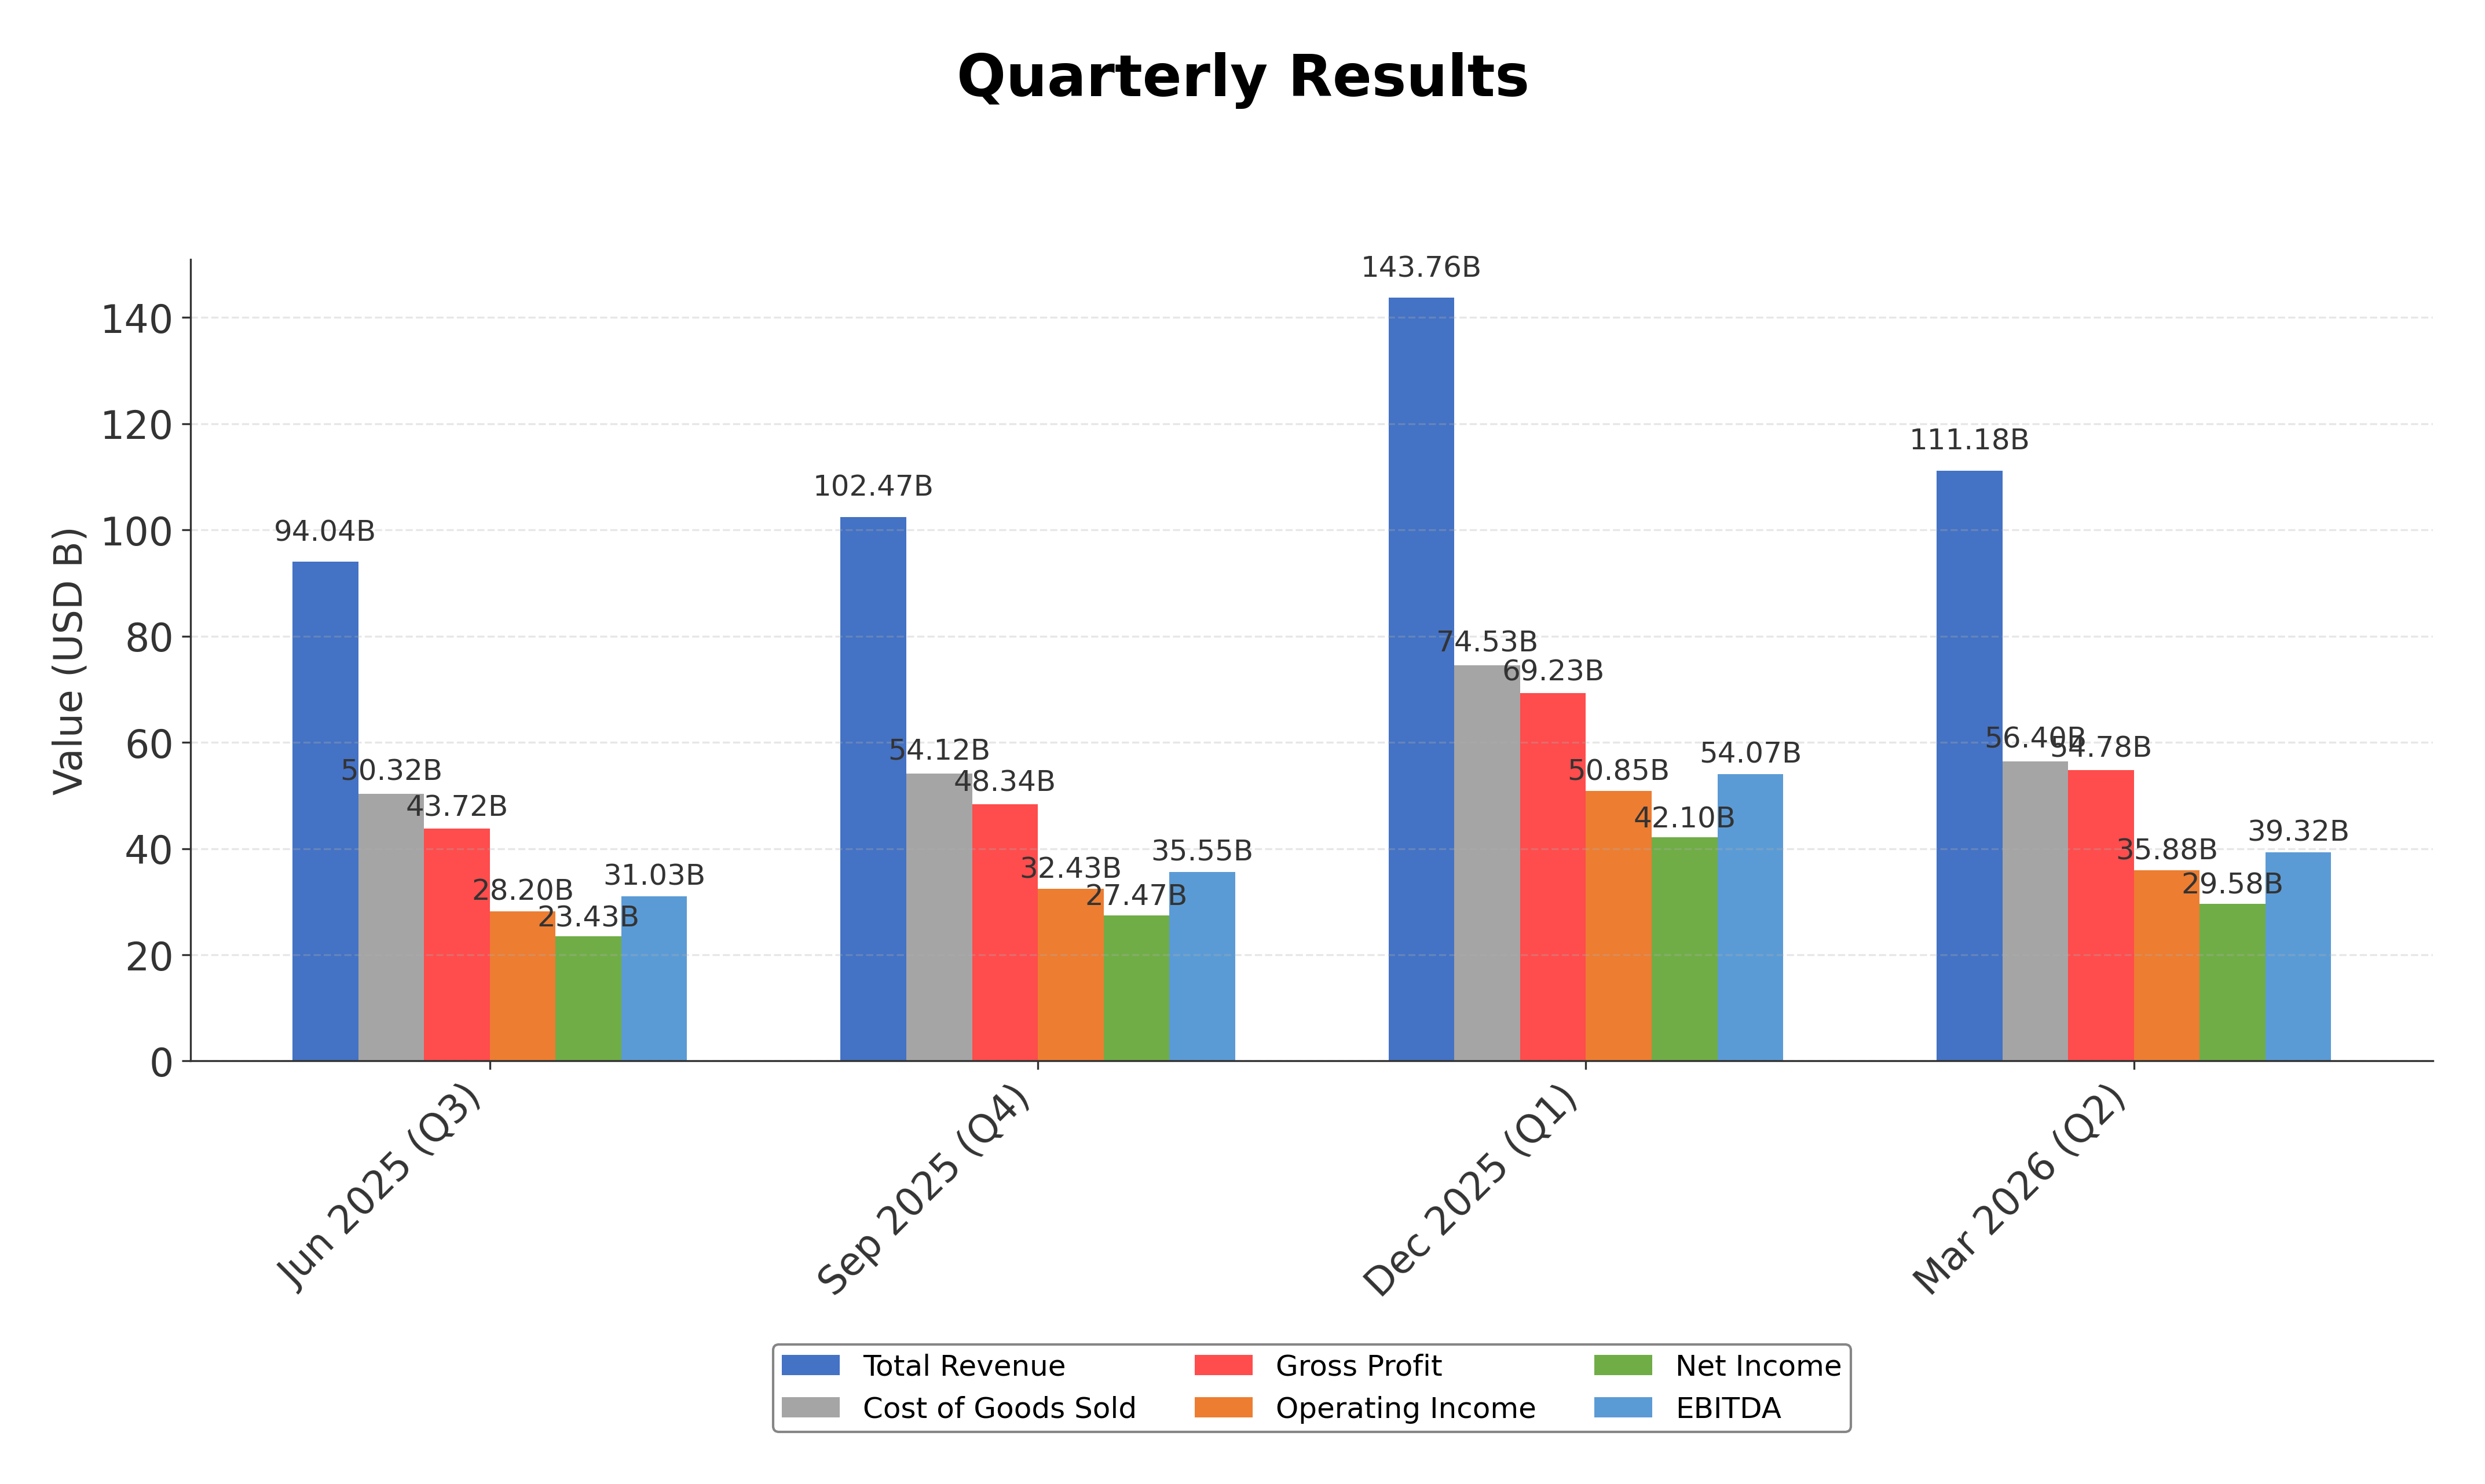
Financials
Peer Analysis
| Company Name | Market Cap | P/E Ratio | P/B Ratio | EV/EBITDA | Price to CFO |
|---|---|---|---|---|---|
| Apple Inc. | $4.51T | 37.16 | 42.33 | 28.32 | 32.19 |
| Sony Group Corporation - Sponsored American Depositary Receipt | $128.91B | 20.48 | 2.55 | -0.01 | 10.6 |
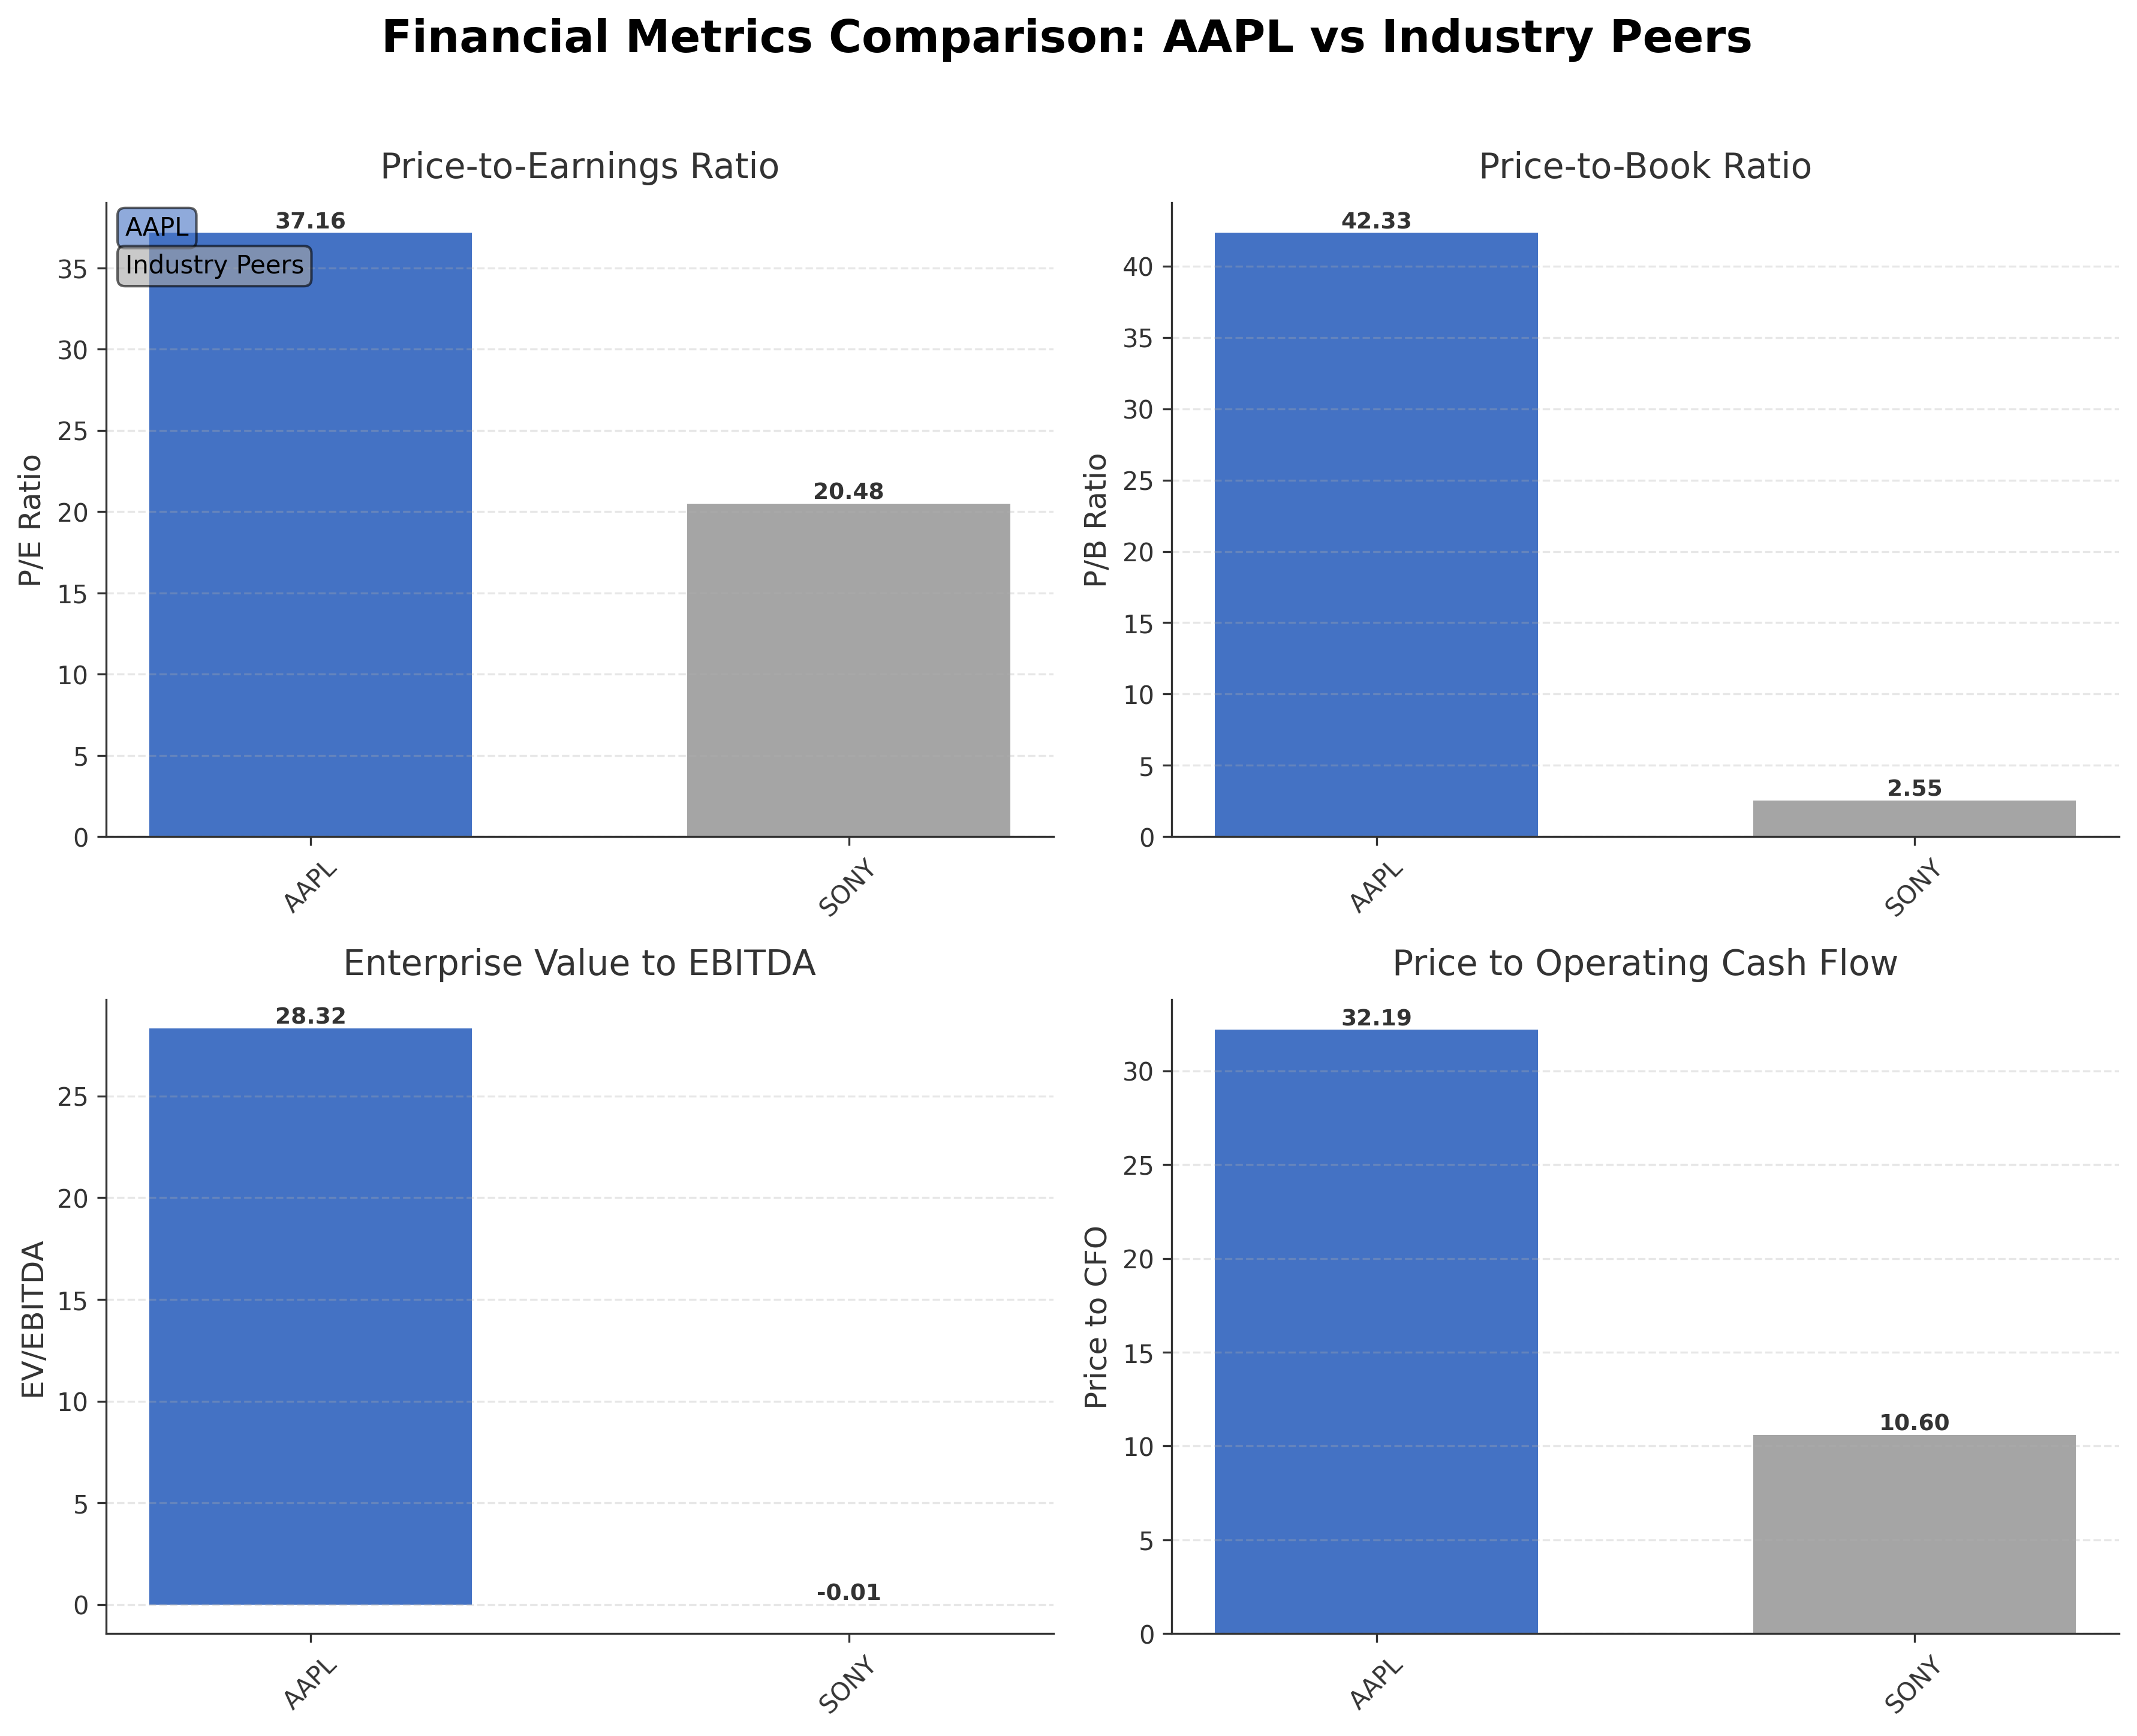
Comparison Analysis: Apple Inc. significantly surpasses its peer Sony Group Corporation in market capitalization, trading at $4.51 trillion compared to Sony's $128.91 billion. Apple’s valuation multiples such as P/E (37.16) and P/B (42.33) are substantially higher than Sony’s P/E of 20.48 and P/B of 2.55, reflecting a premium valuation driven by its dominant market position and strong profitability. However, Sony exhibits a higher return on equity (12.37%) compared to Apple's 1.41%, indicating more efficient equity utilization. Apple's EV/EBITDA of 28.32 and price to CFO of 32.19 also exceed Sony’s metrics, highlighting its premium pricing relative to cash flow. Overall, Apple stands out as a market leader with robust financial metrics but commands a higher valuation premium.
Financial Metrics Comparison with Peers
Financial Statements
Comprehensive financial data including income, balance sheet, and cash flow metrics
Income Statement
| fiscal_date | 2025-09-30 | 2024-09-30 | 2023-09-30 | 2022-09-30 | 2021-09-30 |
|---|---|---|---|---|---|
| Sales | 416.16B | 391.04B | 383.29B | 394.33B | 365.82B |
| Cost Of Goods | 220.96B | 210.35B | 214.14B | 223.55B | 212.98B |
| Gross Profit | 195.20B | 180.68B | 169.15B | 170.78B | 152.84B |
| Operating Expense Research And Development | 34.55B | 31.37B | 29.91B | 26.25B | 21.91B |
| Operating Expense Selling General And Administrative | 27.60B | 26.10B | 24.93B | 25.09B | 21.97B |
| Operating Income | 133.05B | 123.22B | 114.30B | 119.44B | 108.95B |
| Other Income Expense | -321.00M | 269.00M | -565.00M | -334.00M | 60.00M |
| Pretax Income | 132.73B | 123.48B | 113.74B | 119.10B | 109.21B |
| Income Tax | 20.72B | 29.75B | 16.74B | 19.30B | 14.53B |
| Net Income | 112.01B | 93.74B | 97.00B | 99.80B | 94.68B |
| Eps Basic | 7.49 | 6.11 | 6.16 | 6.15 | 5.67 |
| Eps Diluted | 7.46 | 6.08 | 6.13 | 6.11 | 5.61 |
| Basic Shares Outstanding | 14.95B | 15.34B | 15.74B | 16.22B | 16.70B |
| Diluted Shares Outstanding | 14.95B | 15.34B | 15.74B | 16.22B | 16.70B |
| Ebit | 133.05B | 123.22B | 114.30B | 119.44B | 111.85B |
| Ebitda | 144.75B | 134.66B | 125.82B | 130.54B | 123.14B |
| Net Income Continuous Operations | 112.01B | 93.74B | 97.00B | 99.80B | 94.68B |
| Non Operating Interest Income | N/A | N/A | 3.75B | 2.83B | 2.84B |
| Non Operating Interest Expense | N/A | N/A | 3.93B | 2.93B | 2.65B |
Data provided by Twelve Data
Balance Sheet
| fiscal_date | 2025-09-30 | 2024-09-30 | 2023-09-30 | 2022-09-30 | 2021-09-30 |
|---|---|---|---|---|---|
| Cash And Cash Equivalents | 35.93B | 29.94B | 29.96B | 23.65B | 34.94B |
| Accounts Receivable | 39.78B | 33.41B | 29.51B | 28.18B | 26.28B |
| Total Assets | 359.24B | 364.98B | 352.58B | 352.75B | 351.00B |
| Total Liabilities | 285.51B | 308.03B | 290.44B | 302.08B | 287.91B |
| Long Term Debt | 78.33B | 85.75B | 95.28B | 109.71B | 119.38B |
| Shareholders Equity | 73.73B | 56.95B | 62.15B | 50.67B | 63.09B |
Data provided by Twelve Data
Cash Flow Statement
| fiscal_date | 2025-09-30 | 2024-09-30 | 2023-09-30 | 2022-09-30 | 2021-09-30 |
|---|---|---|---|---|---|
| Operating Activities Net Income | 112.01B | 93.74B | 97.00B | 99.80B | 94.68B |
| Operating Activities Depreciation | 11.70B | 11.45B | 11.52B | 11.10B | 11.28B |
| Operating Activities Stock Based Compensation | 12.86B | 11.69B | 10.83B | 9.04B | 7.91B |
| Operating Activities Other Non Cash Items | -89.00M | -2.27B | -2.23B | 1.01B | -4.92B |
| Operating Activities Accounts Receivable | -7.03B | -5.14B | -417.00M | -9.34B | -14.03B |
| Operating Activities Accounts Payable | 902.00M | 6.02B | -1.89B | 9.45B | 12.33B |
| Operating Activities Other Assets Liabilities | -18.87B | 2.77B | -4.27B | 1.57B | -1.53B |
| Operating Activities Operating Cash Flow | 111.48B | 118.25B | 110.54B | 123.52B | 100.94B |
| Investing Activities Capital Expenditures | -12.71B | -9.45B | -10.96B | -10.71B | -11.09B |
| Investing Activities Purchase Of Investments | -24.41B | -48.66B | -29.51B | -76.92B | -109.56B |
| Investing Activities Sale Of Investments | 53.80B | 62.35B | 45.51B | 67.36B | 106.48B |
| Investing Activities Other Investing Activity | -1.48B | -1.31B | -1.34B | -2.09B | -385.00M |
| Investing Activities Investing Cash Flow | 15.20B | 2.94B | 3.71B | -22.66B | -14.58B |
| Financing Activities Long Term Debt Issuance | 4.48B | 0.00 | 5.23B | 5.46B | 20.39B |
| Financing Activities Long Term Debt Payments | -10.93B | -9.96B | -11.15B | -9.54B | -8.75B |
| Financing Activities Short Term Debt Issuance | -2.03B | 3.96B | -3.98B | 3.96B | 1.02B |
| Financing Activities Common Stock Repurchase | -90.71B | -94.95B | -77.55B | -89.40B | -85.97B |
| Financing Activities Common Dividends | -15.42B | -15.23B | -15.03B | -14.84B | -14.47B |
| Financing Activities Other Financing Charges | -6.07B | -5.80B | -6.01B | -6.38B | -5.58B |
| Financing Activities Financing Cash Flow | -120.69B | -121.98B | -108.49B | -110.75B | -92.25B |
| End Cash Position | 35.93B | 29.94B | 30.74B | 24.98B | 35.93B |
| Income Tax Paid | 43.37B | 26.10B | 18.68B | 19.57B | 25.39B |
| Free Cash Flow | 98.77B | 108.81B | 99.58B | 111.44B | 92.95B |
| Interest Paid | N/A | N/A | 3.80B | 2.87B | 2.69B |
| Operating Activities Deferred Taxes | N/A | N/A | N/A | 895.00M | -4.77B |
| Investing Activities Net Acquisitions | N/A | N/A | N/A | -306.00M | -33.00M |
| Financing Activities Common Stock Issuance | N/A | N/A | N/A | N/A | 1.10B |
Data provided by Twelve Data
Technical Analysis
Key Insights
- Apple’s stock is currently in an upward trend, trading above its 10-day, 50-day (278.95), and 200-day (264.41) moving averages, indicating bullish price momentum.
- Key support levels are identified near $278 and $264, while resistance is observed around the recent 52-week high of $316.94.
- Price remains comfortably above major moving averages, suggesting sustained buying interest and trend strength.
- Momentum indicators show a moderately high Relative Strength Index (RSI) consistent with positive momentum; MACD lines are above the signal line, confirming bullish momentum; stochastic oscillators indicate the stock is not yet overbought.
- Multi-timeframe analysis across daily, weekly, and monthly charts confirms a consistent uptrend with no significant reversal signals.
- Potential market scenarios include continuation of the upward trend if support levels hold, or consolidation near resistance levels if profit-taking intensifies.
Trending News
1. Headline: Why Apple (AAPL) Shares Are Sliding Today - StockStory
Summary: What Happened? Shares of iPhone and iPad maker Apple (NASDAQ:AAPL) fell 3.3% in the afternoon session after the WWDC keynote did not deliver the kind of AI l...
Sentiment: negative
2. Headline: Why Apple Stock Is Sinking Today
Summary: Why Apple Stock Is Sinking Today was originally published by The Motley Fool ... FRMI Fermi Inc.
Sentiment: neutral
3. Headline: Apple shares slide after big Siri AI reveal
Summary: Super Micro stock tumbles on $7 billion financing plan to fund hardware purchases · Anthropic releases Mythos-like AI model to the public two months after private rollout rocked Wall Street · Goldman Sachs analysts said that Apple's integration of AI into its hardware could drive a strong product refresh cycle, but also noted that Apple has an opportunity to monetize AI through rate limits and subscriptions. "Some features, including ...
Sentiment: negative
Summary: I’ve owned Apple since December ... every “Apple is doomed” cycle since. What happened at WWDC matters because it finally puts a dollar figure on the AI question that has been hanging over the stock. Wedbush’s Dan Ives framed the keynote in stark monetization terms on the segment: “They basically ripped the Band-Aid off and now we’re here and it comes down to monetization.” Ives estimated AI could add “$75 to $100 per share” in value and drive an incremental $100 billion ...
Sentiment: positive
5. Headline: Why Apple's WWDC and Siri AI hype left investors sad
Summary: Hopefully, incoming CEO John Ternus has some old-school Apple magic to sprinkle on investors at WWDC 2027. Brian Sozzi is Yahoo Finance's Executive Editor and a member of Yahoo Finance's editorial leadership team. Follow Sozzi on X @BrianSozzi, Instagram, and LinkedIn. Tips on stories? Email brian.sozzi@yahoofinance.com. Click here for in-depth analysis of the latest stock market news ...
Sentiment: neutral
Powered by Brave
Recent Updates
News Summary
As of 2026-06-09. Apple’s recent Worldwide Developers Conference (WWDC) highlighted significant AI advancements, with Wedbush analyst Dan Ives estimating an incremental $75 to $100 per share value addition, potentially increasing market capitalization by $100 billion. The fiscal 2026 second quarter results showed record revenue of $111.2 billion, a 17% year-over-year increase, and EPS growth of 22%, driven by strong iPhone and Services sales. The company declared a 4% dividend increase and authorized a $100 billion share repurchase program, reflecting strong capital return initiatives. Additionally, Apple announced a CEO transition with John Ternus set to assume the role, signaling leadership continuity. Earlier quarters also demonstrated robust growth with record revenues and EPS, supported by expanding active device bases and new product launches including the iPhone 17 series and MacBook Neo.
News Sentiment
The overall sentiment from recent updates is predominantly positive, driven by strong financial performance across multiple quarters, record revenue and earnings growth, and strategic initiatives such as AI integration and capital return programs. Positive investor reception is tempered by regulatory challenges in the EU related to AI compliance and cautious market reactions to AI product announcements. Leadership transition news has been neutral, maintaining stability. The balanced mix of strong operational results and emerging regulatory risks suggests a cautiously optimistic outlook grounded in solid fundamentals.
Source List
- https://www.cnbc.com/2026/04/30/apple-aapl-q2-2026-earnings-report.html
Analytical Overview
Analysis Summary
Apple’s valuation metrics, including a trailing P/E of 37.16 and forward P/E of 31.99, are elevated compared to industry averages, reflecting premium pricing justified by its market leadership and growth prospects. The company’s revenue growth of 16-17% year-over-year and strong cash flow generation, with operating cash flow exceeding $140 billion TTM, demonstrate a solid growth trajectory supported by expanding product and services demand. Financial health is robust, with a manageable debt-to-equity ratio of approximately 79.5%, substantial cash reserves of $68.5 billion, and a current ratio of 1.07, indicating liquidity adequacy. Sector-specific opportunities include AI integration and expanding services revenue, while challenges encompass regulatory scrutiny and supply chain constraints. Market positioning and competitive advantages are strong, with a diversified product portfolio and loyal customer base supporting sustained growth.
Overall Business and Market Assessment
Supporting Factors: Apple’s record revenue and earnings growth, strong cash flow generation, and strategic AI initiatives that could enhance future monetization
Risk Factors: No data
SWOT Analysis
Strengths
- Market leadership with a diversified product and services portfolio.
- Strong profitability with high gross and net margins.
- Robust cash flow generation and substantial cash reserves.
- Extensive global brand recognition and loyal customer base.
Weaknesses
- High valuation multiples compared to industry peers.
- Relatively low insider ownership which may impact governance perception.
- Dependence on iPhone sales for a significant portion of revenue.
- Current ratio near 1.07 indicating limited short-term liquidity buffer.
Opportunities
- Expansion of AI capabilities integrated into hardware and services.
- Growth in services segment including subscriptions and digital content.
- Increasing installed base of active devices worldwide.
- Potential for new product launches to drive market penetration.
Threats
- Regulatory challenges, particularly in the European Union regarding AI compliance.
- Intense competition in consumer electronics and technology sectors.
- Supply chain disruptions and rising component costs.
- Macroeconomic uncertainties impacting consumer spending.
Company Description
Apple Inc. designs, manufactures, and markets a wide range of technology products worldwide. These include the iPhone, a line of smartphones; Mac, a line of personal computers; iPad, a line of multi-purpose tablets; and wearables, home, and accessories such as AirPods, Apple Vision Pro, Apple TV, Apple Watch, Beats products, HomePod, as well as Apple branded and third-party accessories. The company operates service platforms including the App Store, Apple Music, and subscription models that provide curated content, cloud services, and digital offerings. Apple Inc. serves individual consumers, businesses, and government sectors through online stores, retail outlets, and partnerships with cellular carriers and resellers. Its products span the information technology sector, impacting mobile communication, personal computing, entertainment, and health monitoring. Founded in 1976 and headquartered in Cupertino, California, Apple Inc. plays a pivotal role in the global technology market by integrating hardware, software, and services into seamless ecosystems.