


Apple Inc (AAPL)
Stock Analysis Report
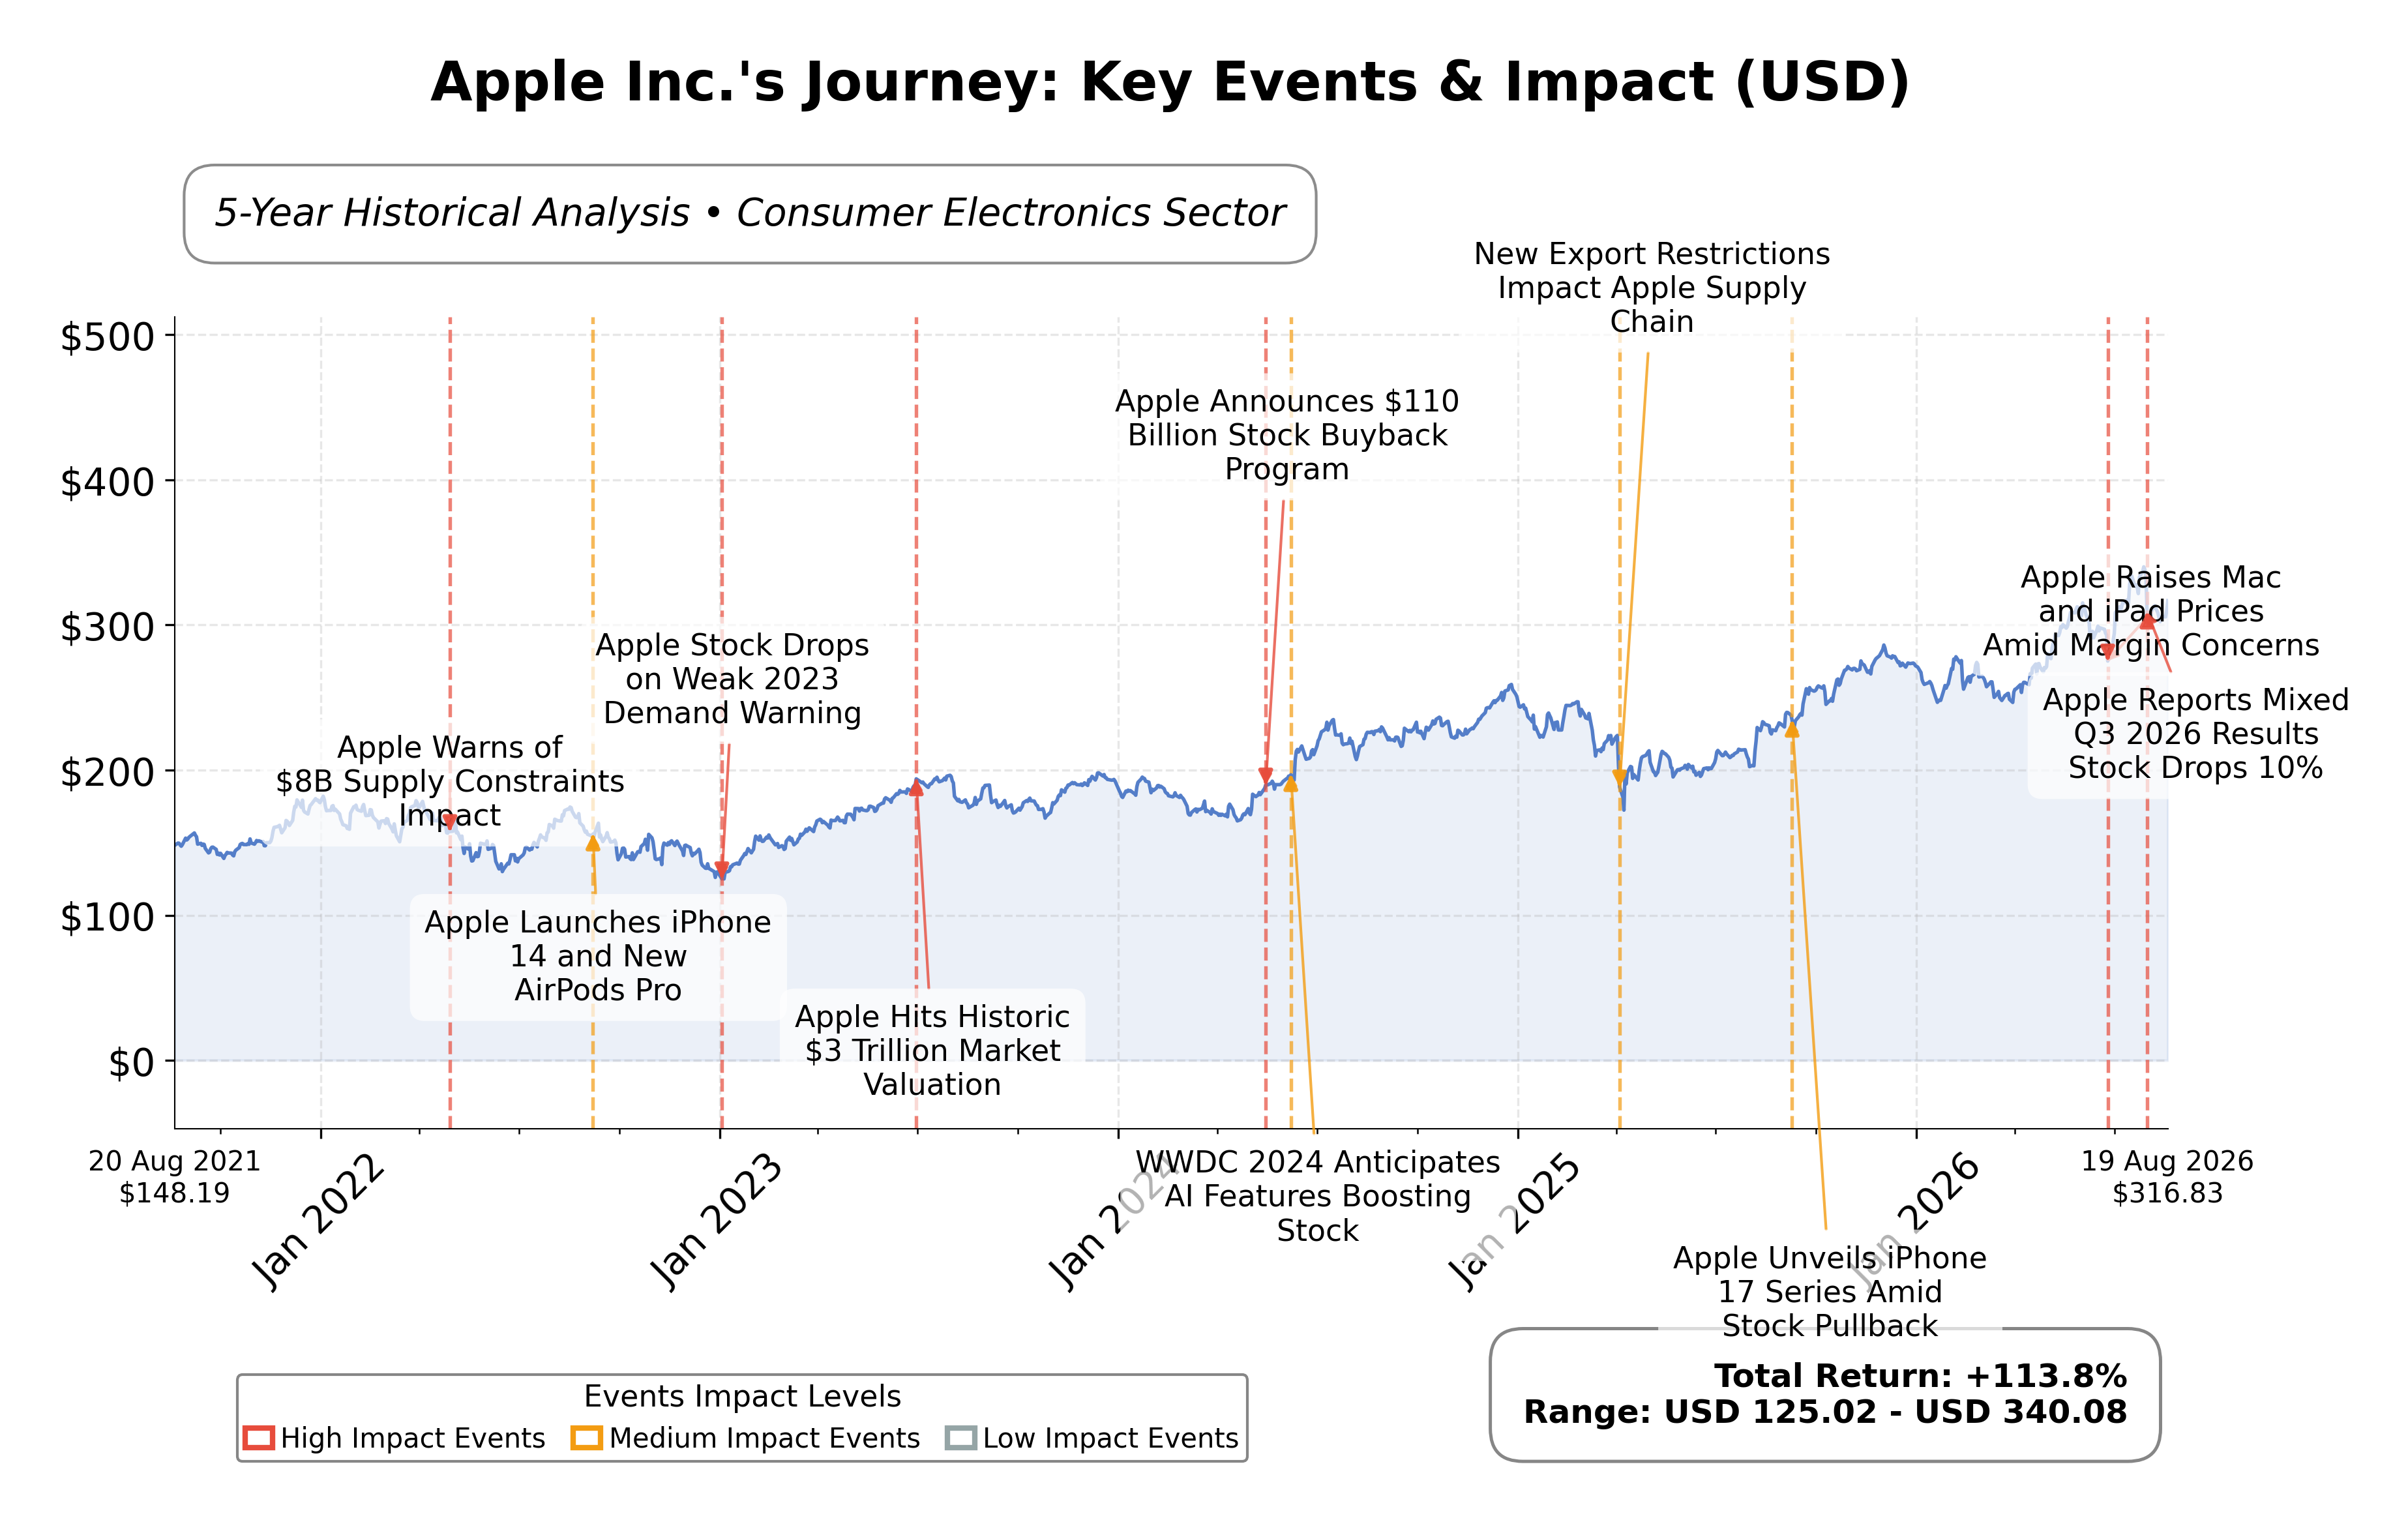
Stock Journey
Key Positives and Key Risks
Pros
- Strong revenue growth of 16.4% year-over-year demonstrates robust demand and market expansion.
- Operating cash flow of $146.7 billion and free cash flow of $106.9 billion indicate excellent cash generation capacity.
- Market capitalization of $4.54 trillion reflects dominant industry positioning and investor confidence.
Cons
- High trailing P/E ratio of 35.34 and P/B ratio of 42.55 suggest a premium valuation that may limit upside.
- Regulatory risks in the European Union and other markets could impact operational flexibility and profitability.
- Supply chain constraints and rising component costs may pressure margins and revenue growth.
Disclosure: This information is for general awareness and does not constitute investment advice
Report Summary
Apple Inc. is a leading global technology company listed on the NASDAQ exchange under the Technology sector, specializing in consumer electronics and digital services. The company designs, manufactures, and markets a broad range of products including the iPhone, Mac computers, iPad tablets, wearables such as Apple Watch and AirPods, and services like the App Store and Apple Music. Apple operates worldwide, serving individual consumers, businesses, and government sectors, and is recognized for its integrated hardware-software ecosystem that positions it as a dominant player in the consumer electronics industry.
Financially, Apple reported trailing twelve-month revenue of approximately $466.8 billion with a gross margin of 50.06%, an operating margin of 32.62%, and a net profit margin of 27.62%. The company’s return on equity (ROE) stands at 148.75%, and return on assets (ROA) at 27.08%, indicating exceptional profitability and efficient asset utilization. Operating cash flow reached $146.7 billion, with free cash flow of $106.9 billion, reflecting strong cash generation capabilities. Quarterly revenue growth was 16.4%, and earnings per share grew by 27.1% year-over-year, underscoring continued growth momentum.
Apple’s valuation metrics show a trailing price-to-earnings (P/E) ratio of 35.34 and a forward P/E of 32.28, with a price-to-book (P/B) ratio of 42.55 and an enterprise value to EBITDA (EV/EBITDA) of 27.00. The market capitalization is approximately $4.54 trillion, reflecting its status as one of the world’s most valuable companies. The stock price currently trades at $316.88, within a 52-week range of $201.68 to $344.57, indicating a price appreciation of 34.17% over the past year.
Key strengths include Apple’s robust cash flow generation, a strong balance sheet with $62.4 billion in cash against $84.3 billion in debt, and market leadership in multiple product categories. The company recently announced strategic changes to its App Store terms in the European Union, resolving regulatory disputes and potentially reducing compliance complexity. Risks include regulatory scrutiny, competitive pressures in the technology sector, and supply chain constraints. Notable recent developments include the launch of new AI-powered software and continued expansion of its services business.
Technically, Apple’s stock is trading above its 50-day and 200-day moving averages, with momentum indicators showing mixed signals across multiple timeframes. Recent news highlights regulatory progress and investor interest, tempered by concerns about the company’s stance on artificial intelligence. Overall, the data suggests a balanced environment where market participants may consider monitoring developments closely while assessing risk and opportunity dynamics.
Company and Industry Overview
Company Basics
Price Performance
Company Size
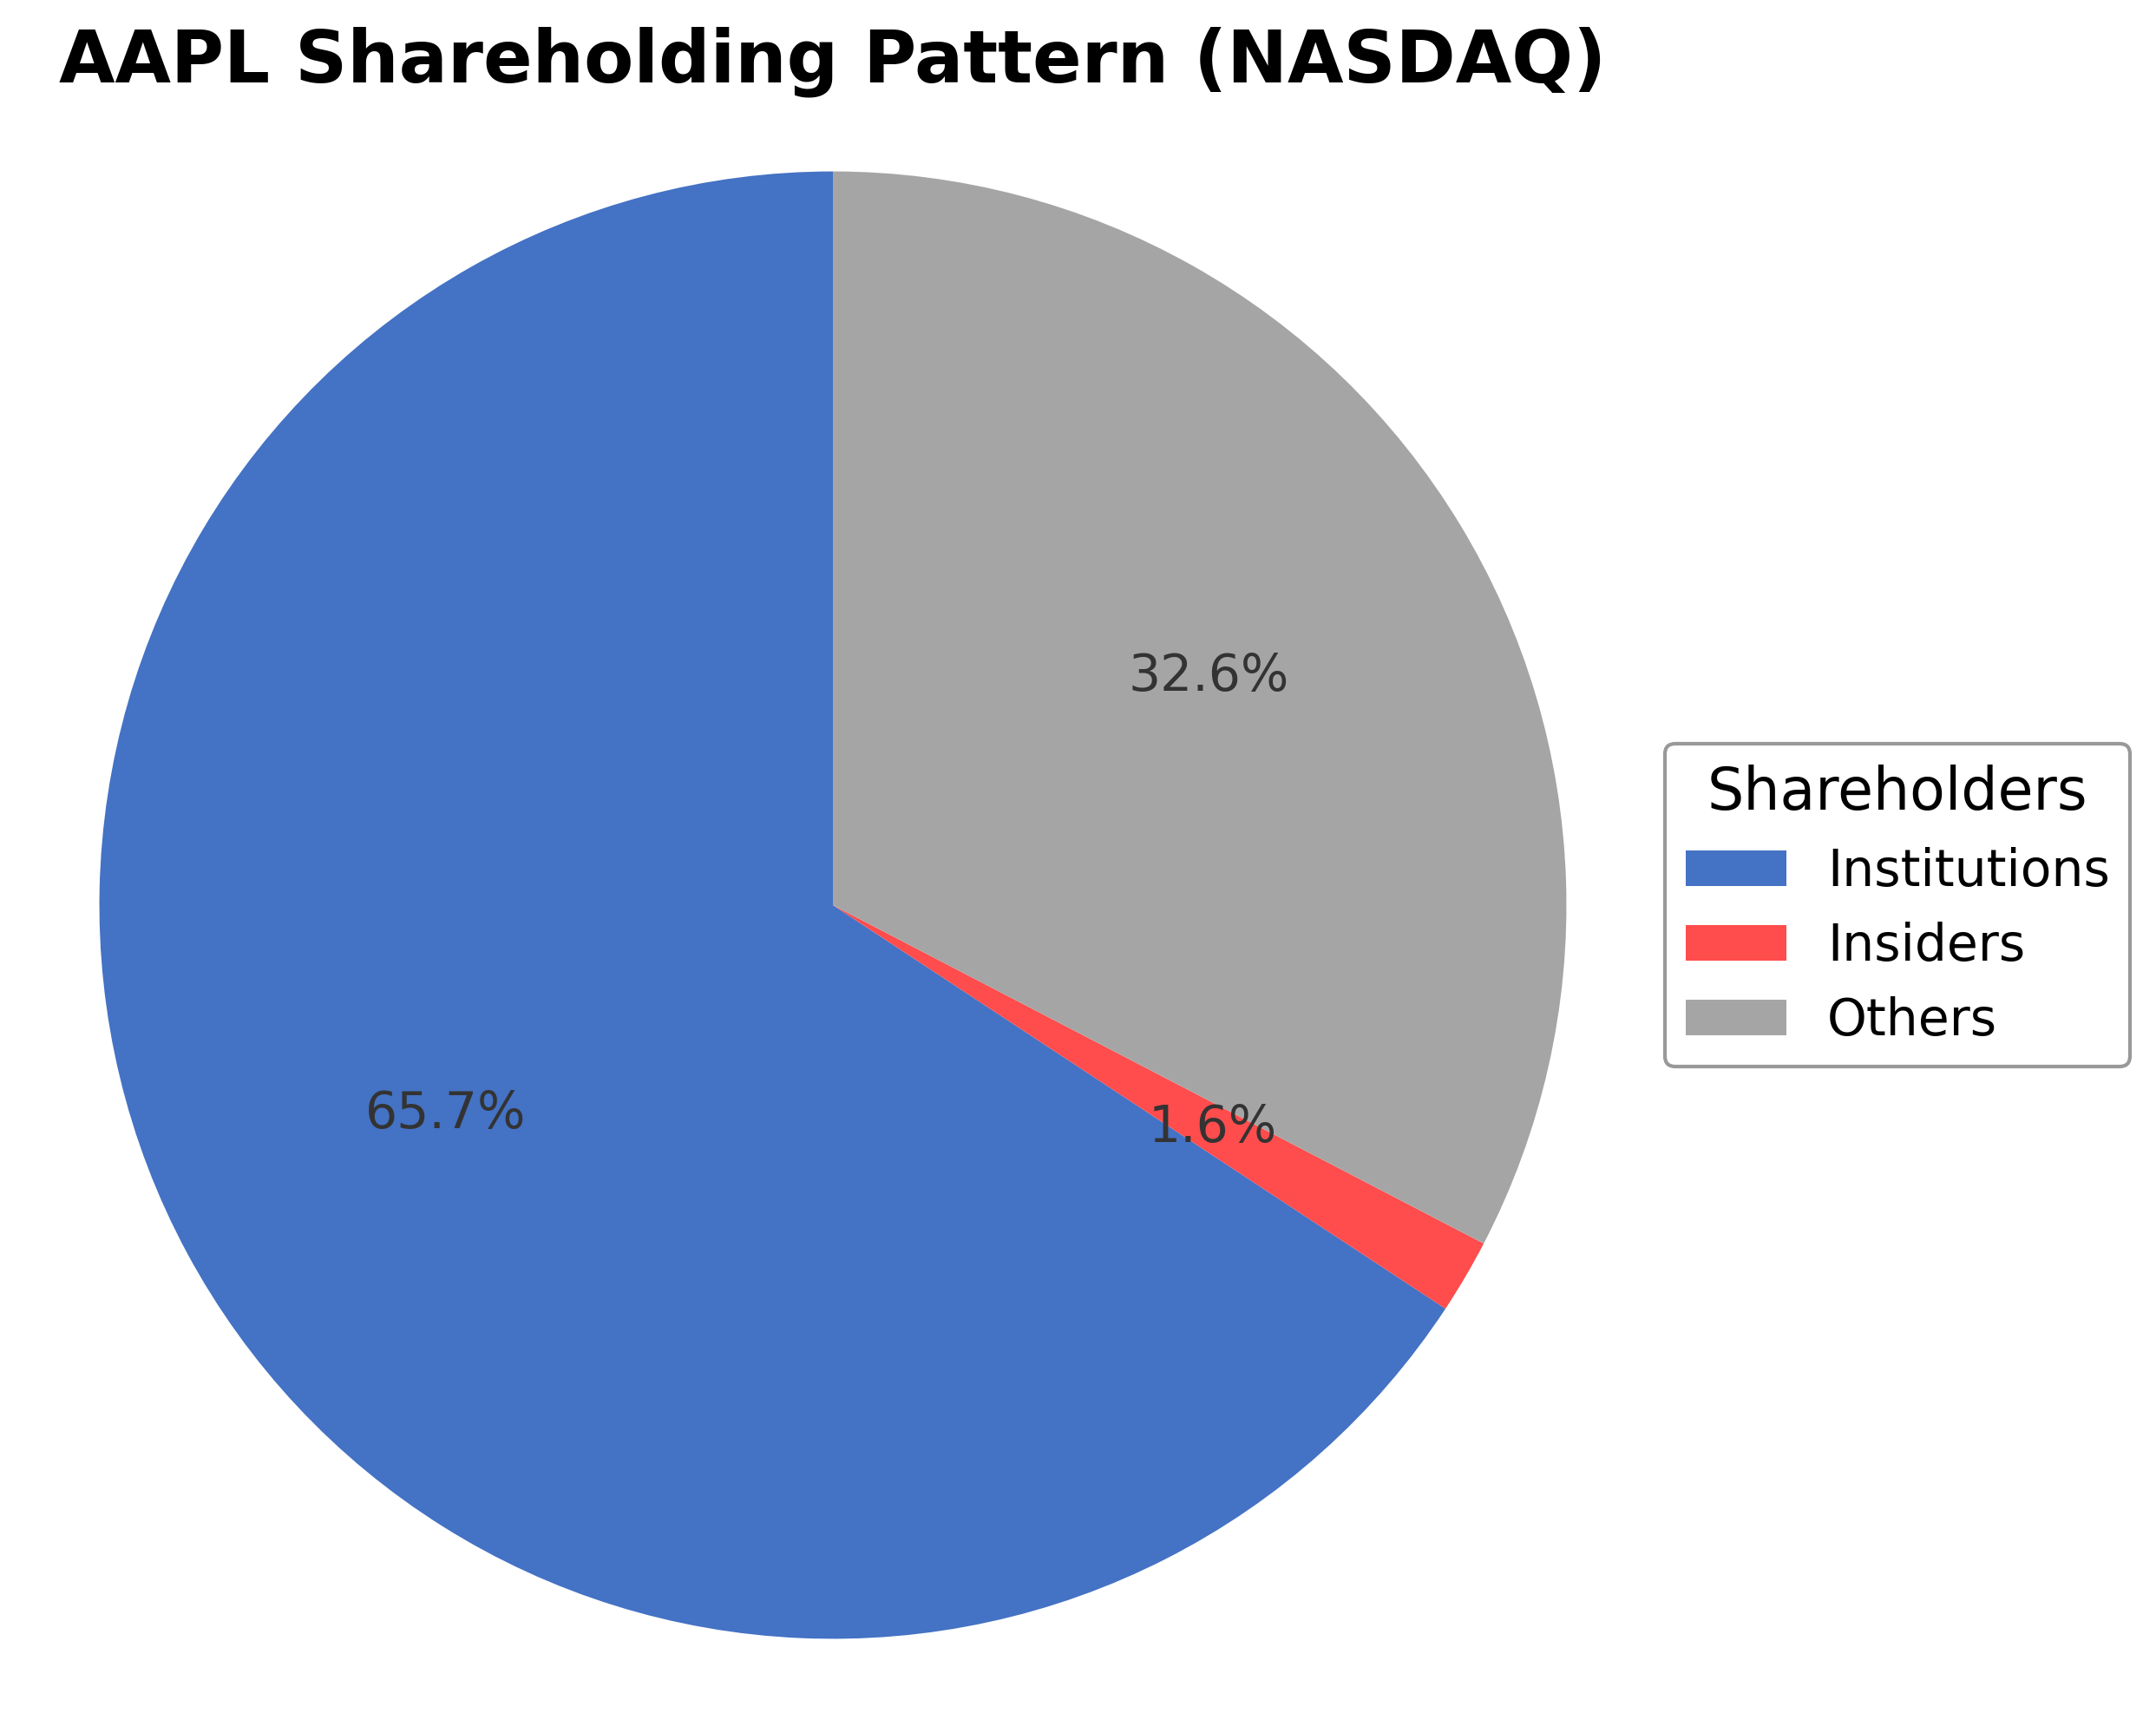
Shareholding Pattern
Sector and Industry Analysis
The global apple market is a significant segment within the agricultural sector, encompassing a wide variety of apple types and a complex value chain from cultivation to retail. The market is experiencing steady growth driven by rising health awareness and increasing demand for organic produce, with projections extending through 2034 across major regions including North America, Europe, and Asia-Pacific. Key players range from multinational corporations to local producers, each competing to capture market share in diverse geographic markets.
Emerging trends in the apple industry include a shift toward organic and locally sourced products, innovations in packaging and storage technologies to extend shelf life, and the adoption of smart farming techniques to improve yield and sustainability. Competitive dynamics are intensifying as international firms expand operations, challenging smaller producers to innovate and diversify. Barriers such as climatic variability, stringent food safety standards, and trade tariff fluctuations continue to influence market entry and operational strategies.
The regulatory environment is increasingly focused on food safety, quality standards, and sustainability, with stricter compliance requirements shaping production and distribution practices. Trade policies and geopolitical developments, including recent conflicts, have affected supply chains and pricing structures globally. Looking ahead, regulatory frameworks related to carbon pricing and energy security are expected to further impact market strategies and growth trajectories within the apple industry.
Note: Analysis synthesized from industry research, market reports, and regulatory filings. Information is subject to change based on market conditions.
Financial Ratios Dashboard
Illustrative Scenario Analysis
DCF Assumptions:
Method: Two-Stage EPS-Priority Model
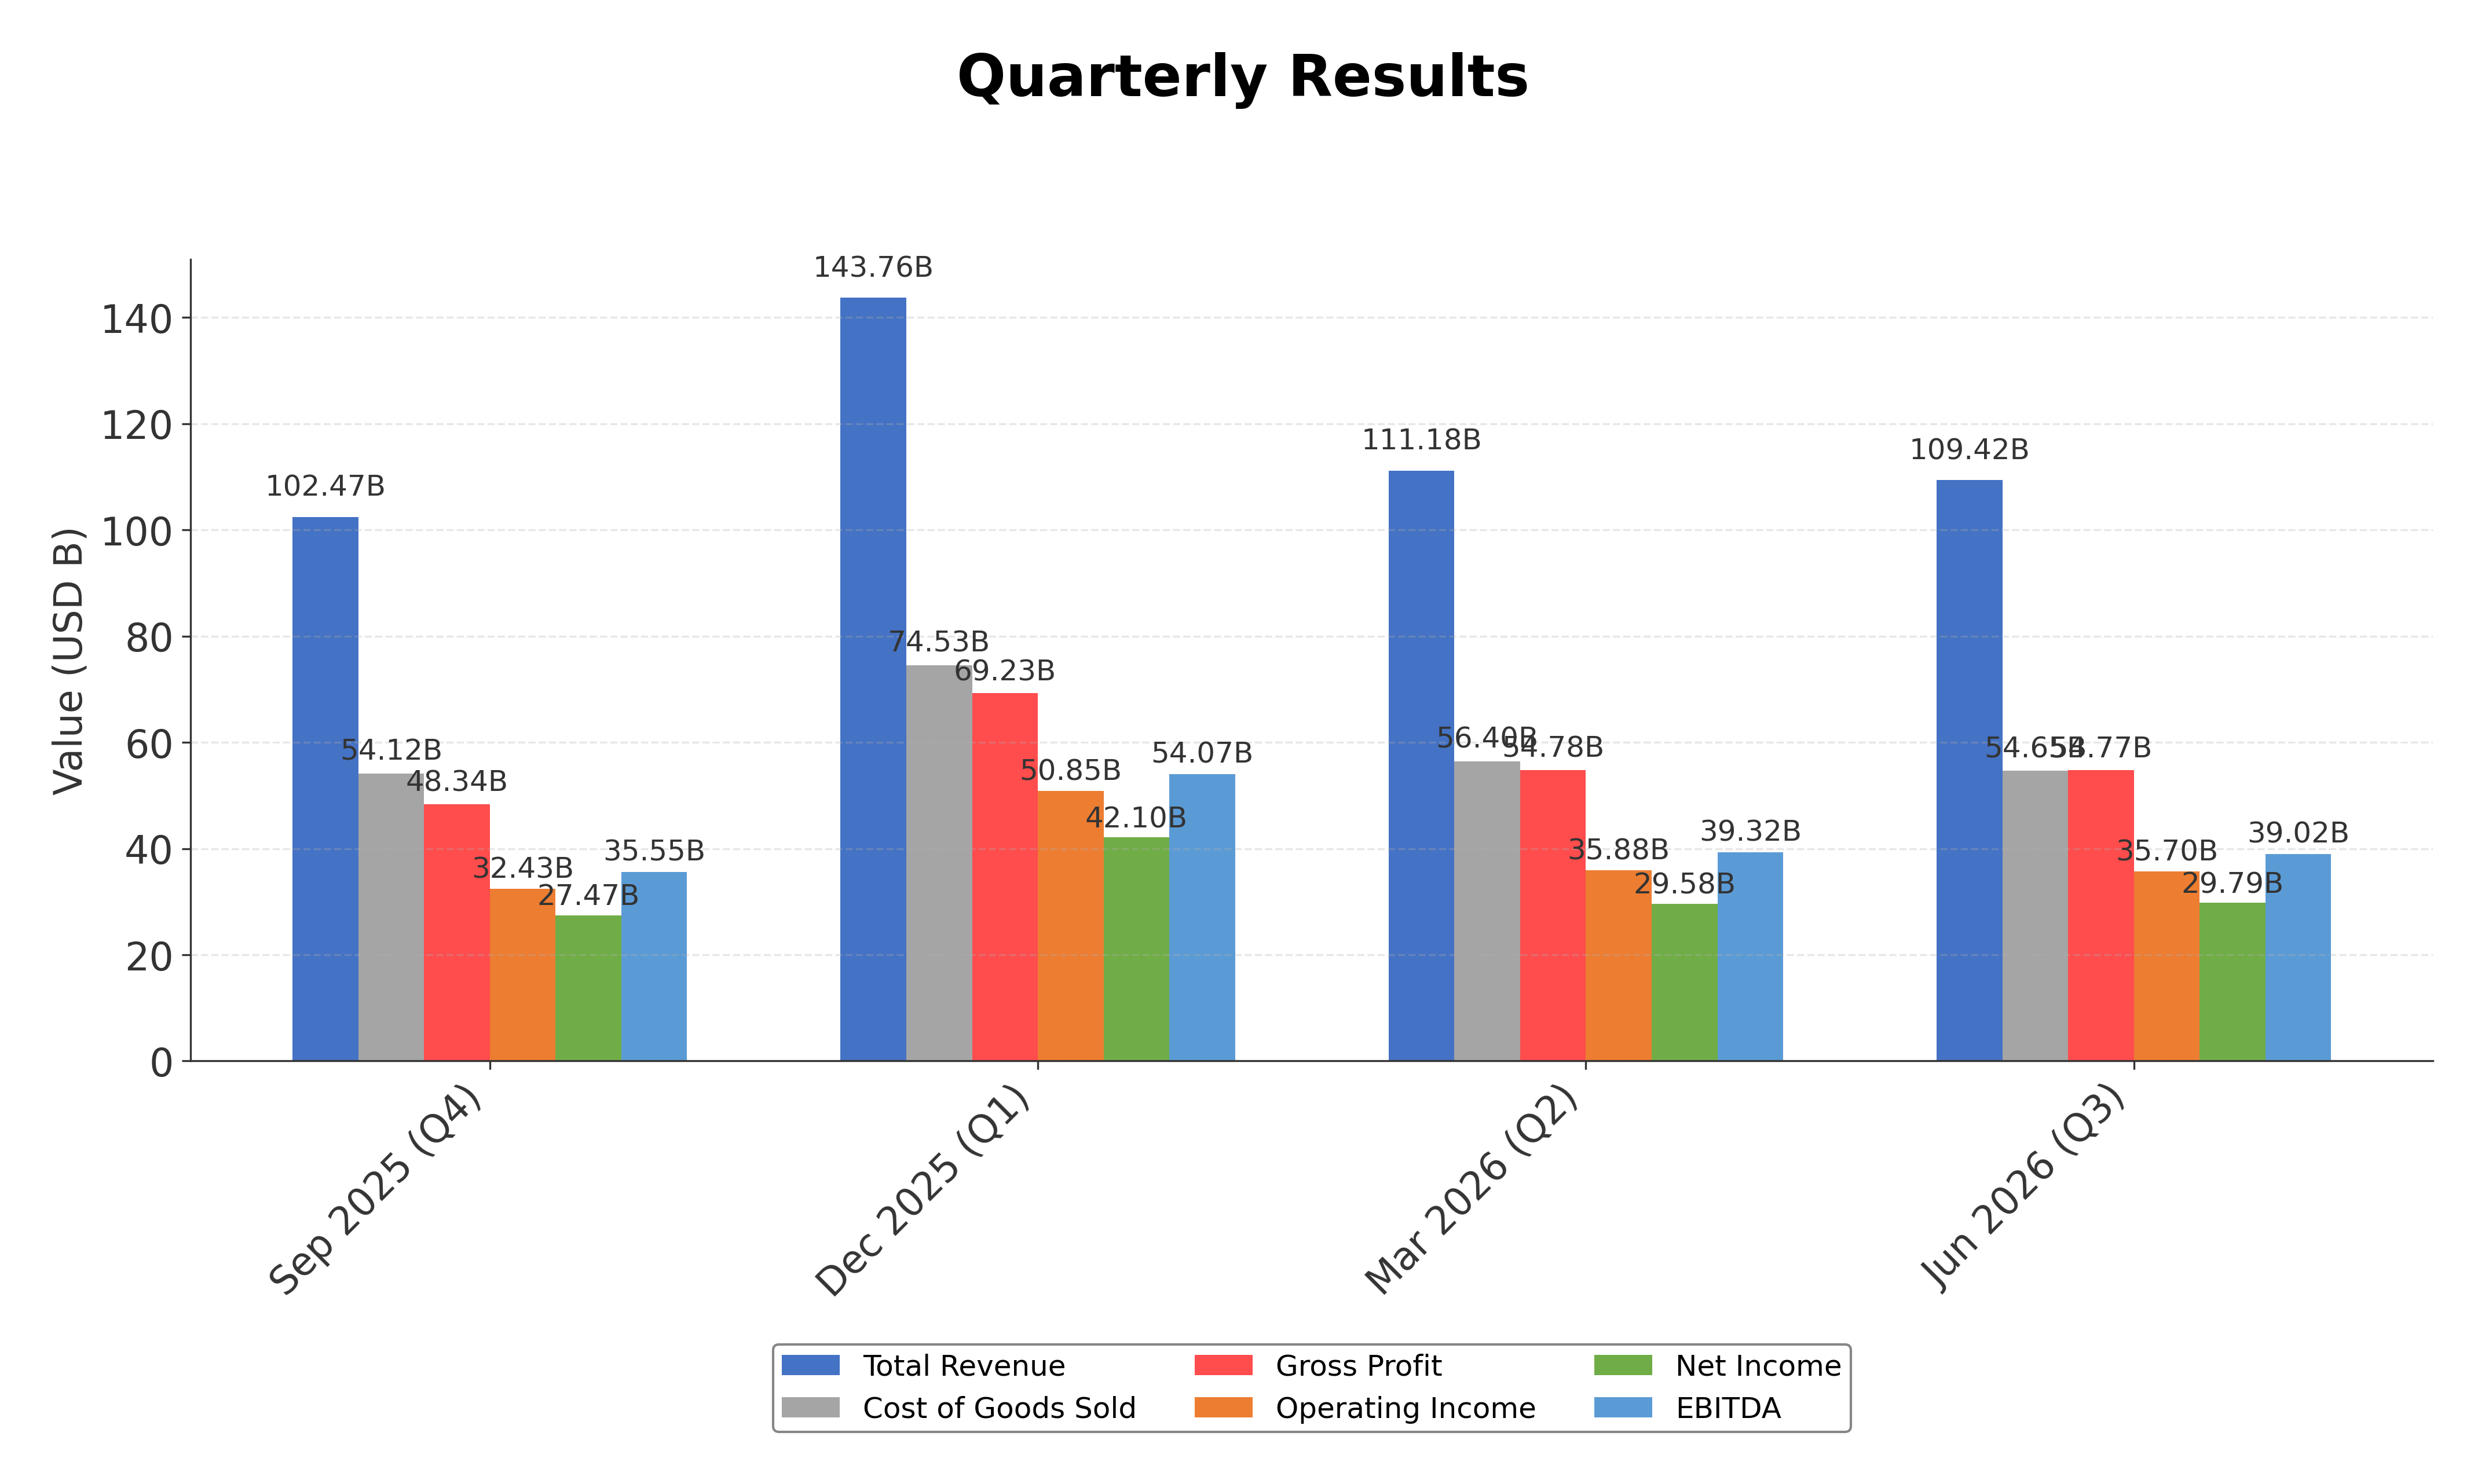
Financials
Peer Analysis
| Company Name | Market Cap | P/E Ratio | P/B Ratio | EV/EBITDA | Price to CFO |
|---|---|---|---|---|---|
| Apple Inc. | $4.54T | 35.34 | 42.55 | 27.00 | 30.92 |
| Sony Group Corporation - Sponsored American Depositary Receipt | $123.20B | 19.99 | 2.49 | 0.01 | 10.37 |
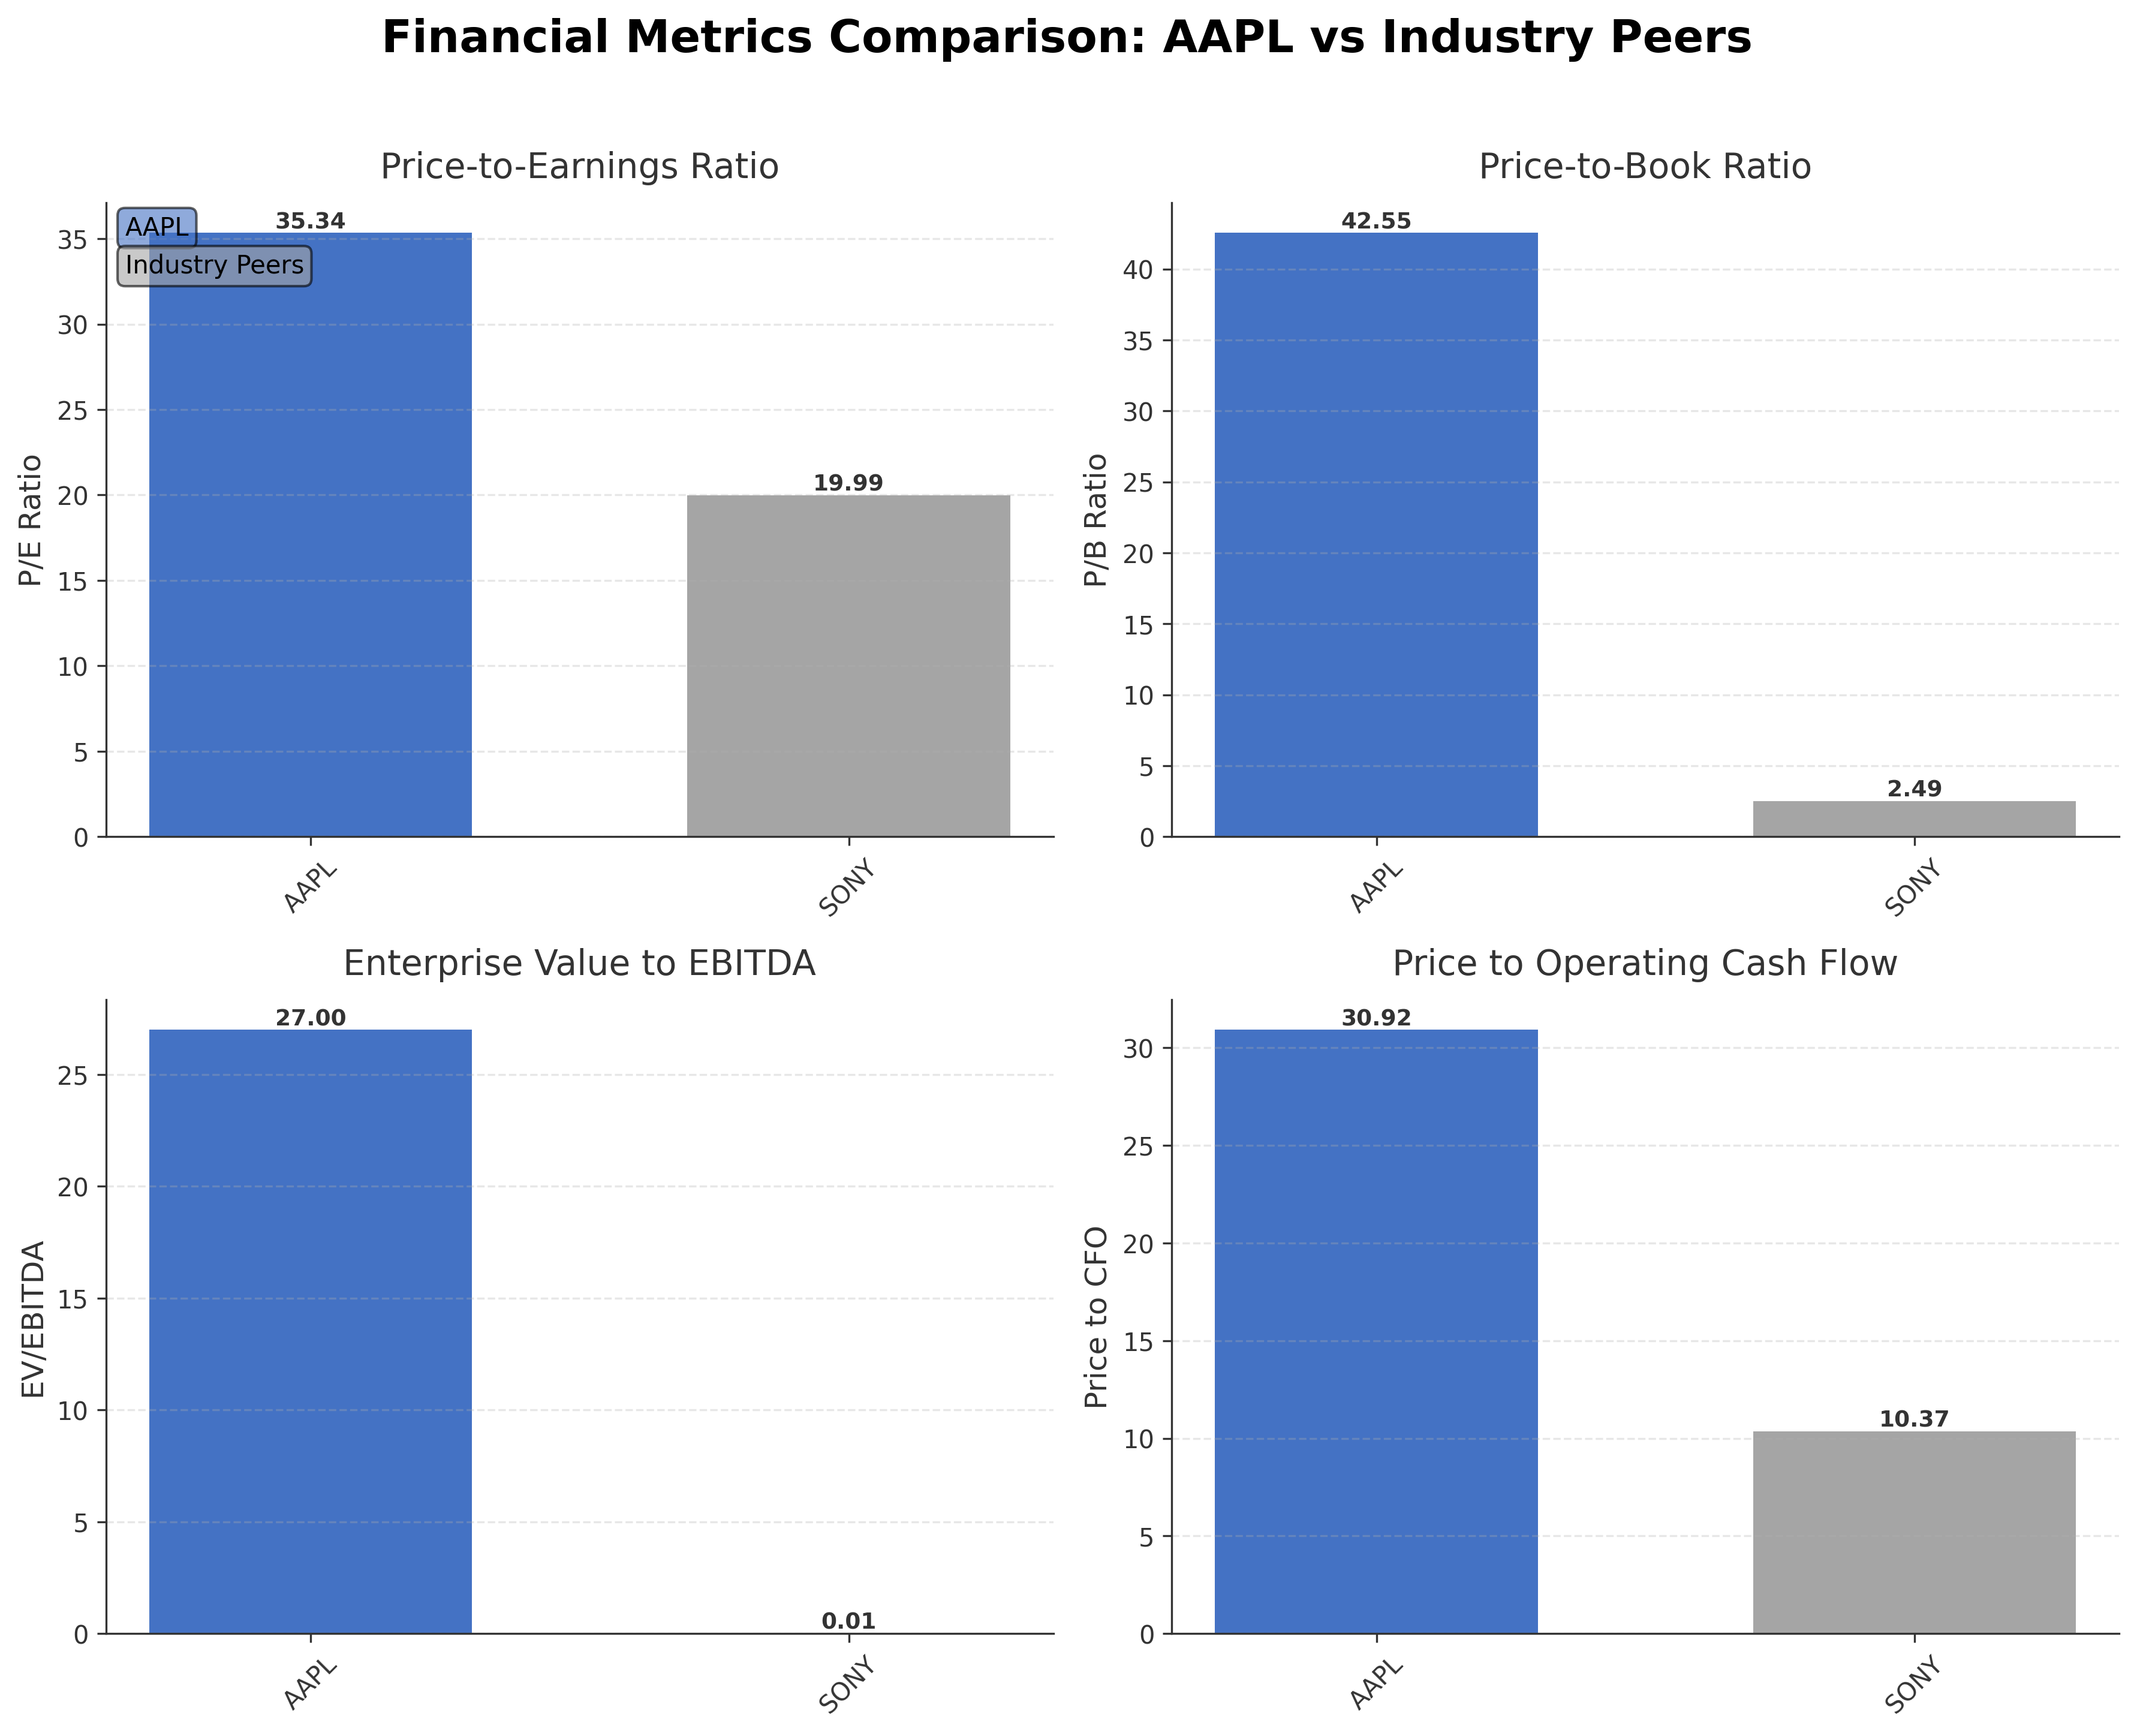
Comparison Analysis: Apple Inc. significantly surpasses its peer Sony Group Corporation in market capitalization, reflecting its dominant industry position. Apple’s P/E ratio of 35.34 is notably higher than Sony’s 19.99, indicating a premium valuation possibly justified by stronger growth prospects and profitability. The P/B ratio of 42.55 for Apple contrasts sharply with Sony’s 2.49, suggesting substantial intangible asset value and brand strength. Apple’s EV/EBITDA ratio of 27.00 is elevated relative to Sony’s near zero, reflecting market expectations of sustained earnings power. However, Sony demonstrates a higher return on equity at 12.34% compared to Apple’s 1.49%, which may indicate more efficient equity utilization in the peer group.
Financial Metrics Comparison with Peers
Financial Statements
Comprehensive financial data including income, balance sheet, and cash flow metrics
Income Statement
| fiscal_date | 2025-09-30 | 2024-09-30 | 2023-09-30 | 2022-09-30 | 2021-09-30 |
|---|---|---|---|---|---|
| Sales | 416.16B | 391.04B | 383.29B | 394.33B | 365.82B |
| Cost Of Goods | 220.96B | 210.35B | 214.14B | 223.55B | 212.98B |
| Gross Profit | 195.20B | 180.68B | 169.15B | 170.78B | 152.84B |
| Operating Expense Research And Development | 34.55B | 31.37B | 29.91B | 26.25B | 21.91B |
| Operating Expense Selling General And Administrative | 27.60B | 26.10B | 24.93B | 25.09B | 21.97B |
| Operating Income | 133.05B | 123.22B | 114.30B | 119.44B | 108.95B |
| Other Income Expense | -321.00M | 269.00M | -565.00M | -334.00M | 60.00M |
| Pretax Income | 132.73B | 123.48B | 113.74B | 119.10B | 109.21B |
| Income Tax | 20.72B | 29.75B | 16.74B | 19.30B | 14.53B |
| Net Income | 112.01B | 93.74B | 97.00B | 99.80B | 94.68B |
| Eps Basic | 7.49 | 6.11 | 6.16 | 6.15 | 5.67 |
| Eps Diluted | 7.46 | 6.08 | 6.13 | 6.11 | 5.61 |
| Basic Shares Outstanding | 14.95B | 15.34B | 15.74B | 16.22B | 16.70B |
| Diluted Shares Outstanding | 14.95B | 15.34B | 15.74B | 16.22B | 16.70B |
| Ebit | 133.05B | 123.22B | 114.30B | 119.44B | 111.85B |
| Ebitda | 144.75B | 134.66B | 125.82B | 130.54B | 123.14B |
| Net Income Continuous Operations | 112.01B | 93.74B | 97.00B | 99.80B | 94.68B |
| Non Operating Interest Income | N/A | N/A | 3.75B | 2.83B | 2.84B |
| Non Operating Interest Expense | N/A | N/A | 3.93B | 2.93B | 2.65B |
Data provided by Twelve Data
Balance Sheet
| fiscal_date | 2025-09-30 | 2024-09-30 | 2023-09-30 | 2022-09-30 | 2021-09-30 |
|---|---|---|---|---|---|
| Cash And Cash Equivalents | 35.93B | 29.94B | 29.96B | 23.65B | 34.94B |
| Accounts Receivable | 39.78B | 33.41B | 29.51B | 28.18B | 26.28B |
| Total Assets | 359.24B | 364.98B | 352.58B | 352.75B | 351.00B |
| Total Liabilities | 285.51B | 308.03B | 290.44B | 302.08B | 287.91B |
| Long Term Debt | 78.33B | 85.75B | 95.28B | 109.71B | 119.38B |
| Shareholders Equity | 73.73B | 56.95B | 62.15B | 50.67B | 63.09B |
Data provided by Twelve Data
Cash Flow Statement
| fiscal_date | 2025-09-30 | 2024-09-30 | 2023-09-30 | 2022-09-30 | 2021-09-30 |
|---|---|---|---|---|---|
| Operating Activities Net Income | 112.01B | 93.74B | 97.00B | 99.80B | 94.68B |
| Operating Activities Depreciation | 11.70B | 11.45B | 11.52B | 11.10B | 11.28B |
| Operating Activities Stock Based Compensation | 12.86B | 11.69B | 10.83B | 9.04B | 7.91B |
| Operating Activities Other Non Cash Items | -89.00M | -2.27B | -2.23B | 1.01B | -4.92B |
| Operating Activities Accounts Receivable | -7.03B | -5.14B | -417.00M | -9.34B | -14.03B |
| Operating Activities Accounts Payable | 902.00M | 6.02B | -1.89B | 9.45B | 12.33B |
| Operating Activities Other Assets Liabilities | -18.87B | 2.77B | -4.27B | 1.57B | -1.53B |
| Operating Activities Operating Cash Flow | 111.48B | 118.25B | 110.54B | 123.52B | 100.94B |
| Investing Activities Capital Expenditures | -12.71B | -9.45B | -10.96B | -10.71B | -11.09B |
| Investing Activities Purchase Of Investments | -24.41B | -48.66B | -29.51B | -76.92B | -109.56B |
| Investing Activities Sale Of Investments | 53.80B | 62.35B | 45.51B | 67.36B | 106.48B |
| Investing Activities Other Investing Activity | -1.48B | -1.31B | -1.34B | -2.09B | -385.00M |
| Investing Activities Investing Cash Flow | 15.20B | 2.94B | 3.71B | -22.66B | -14.58B |
| Financing Activities Long Term Debt Issuance | 4.48B | 0.00 | 5.23B | 5.46B | 20.39B |
| Financing Activities Long Term Debt Payments | -10.93B | -9.96B | -11.15B | -9.54B | -8.75B |
| Financing Activities Short Term Debt Issuance | -2.03B | 3.96B | -3.98B | 3.96B | 1.02B |
| Financing Activities Common Stock Repurchase | -90.71B | -94.95B | -77.55B | -89.40B | -85.97B |
| Financing Activities Common Dividends | -15.42B | -15.23B | -15.03B | -14.84B | -14.47B |
| Financing Activities Other Financing Charges | -6.07B | -5.80B | -6.01B | -6.38B | -5.58B |
| Financing Activities Financing Cash Flow | -120.69B | -121.98B | -108.49B | -110.75B | -92.25B |
| End Cash Position | 35.93B | 29.94B | 30.74B | 24.98B | 35.93B |
| Income Tax Paid | 43.37B | 26.10B | 18.68B | 19.57B | 25.39B |
| Free Cash Flow | 98.77B | 108.81B | 99.58B | 111.44B | 92.95B |
| Interest Paid | N/A | N/A | 3.80B | 2.87B | 2.69B |
| Operating Activities Deferred Taxes | N/A | N/A | N/A | 895.00M | -4.77B |
| Investing Activities Net Acquisitions | N/A | N/A | N/A | -306.00M | -33.00M |
| Financing Activities Common Stock Issuance | N/A | N/A | N/A | N/A | 1.10B |
Data provided by Twelve Data
Technical Analysis
Key Insights
- Apple’s current trend shows an overall upward trajectory with the stock price trading above the 10-day, 50-day ($309.30), and 200-day ($277.65) moving averages, indicating bullish momentum in the medium to long term.
- Key support levels are identified near $300 and $280, while resistance is observed around the 52-week high of $344.57, which may act as a psychological barrier.
- Price remains comfortably above the major moving averages, suggesting sustained buying interest and a healthy trend continuation.
- Momentum indicators show a Relative Strength Index (RSI) near neutral levels, MACD histogram indicating slight bullish crossover, and Stochastic oscillators reflecting moderate momentum without overbought conditions.
- Multi-timeframe analysis reveals consistent strength on daily and weekly charts, while monthly charts show consolidation phases, indicating potential for further gains after periods of sideways movement.
- Current technical setup suggests potential scenarios of continued upward movement if support holds, or consolidation near resistance levels if profit-taking intensifies.
Trending News
1. Headline: Ed Case from Hawaii’s 1st district invests in Apple Inc. By Investing.com
Summary: Congressman Ed Case, representing Hawaii’s 1st congressional district, has recently made a new investment in Apple Inc. (NASDAQ:AAPL), according to the latest congressional trade report. The transaction, which took place on August 13, 2026, was reported to be an automatic stock dividend ...
Sentiment: neutral
2. Headline: Why is Apple stock rallying today? By Investing.com
Summary: Investing.com -- Apple Inc. stock is up 2.3% in morning trading, reaching $317.21, after the company unveiled a major restructuring of its App Store terms for European developers that investors are interpreting as a meaningful de-escalation of its long-running regulatory battle on the continent.
Sentiment: positive
3. Headline: Interesting News for Apple Stock Investors | The Motley Fool
Summary: The app store is one of the most lucrative parts of Apple's business.
Sentiment: neutral
4. Headline: Apple’s Anti-AI Position Is Becoming Stock Market Baggage - Bloomberg
Summary: Apple Inc.’s status as an anti-artificial intelligence play helped the stock tear through the first half of the year as investors grew skeptical of the AI trade. But that sentiment has flipped, and the shares are struggling.
Sentiment: negative
5. Headline: Apple’s Anti-AI Position Suddenly Becomes Stock Market Baggage
Summary: Apple Inc.’s status as an anti-artificial intelligence play helped the stock tear through the first half of the year as investors grew skeptical of the AI trade. But that sentiment has flipped, and the shares are suddenly struggling.
Sentiment: negative
Powered by Brave
Recent Updates
News Summary
As of August 18, 2026. Apple announced significant changes to its App Store business terms in the European Union, resolving disputes with the European Commission by unifying developer terms and adjusting commission structures effective October 1, 2026. The company reported record-breaking quarterly revenues and earnings per share across multiple quarters in fiscal 2026, driven by strong iPhone, Mac, and Services sales, with active device bases reaching all-time highs. Apple declared quarterly dividends and authorized substantial share repurchase programs, reflecting robust cash flow and shareholder returns. The company also introduced new AI-powered software and child safety features, indicating ongoing innovation and product development. Despite supply constraints and rising component costs, Apple maintains strong financial performance and growth guidance for upcoming quarters.
News Sentiment
The overall sentiment from recent updates is predominantly positive, supported by record revenue and earnings growth, strategic regulatory resolutions in the EU, and continued innovation in product offerings. Neutral tones arise from cautious commentary on supply chain constraints and regulatory risks, while negative sentiment is limited and primarily linked to external challenges such as antitrust scrutiny. The balance of strong financial results and proactive regulatory engagement contributes to a constructive outlook on the company’s operational and strategic position.
Source List
Analytical Overview
Analysis Summary
Apple’s valuation metrics, including a trailing P/E of 35.34 and forward P/E of 32.28, are elevated relative to the industry average P/E of 35.34, reflecting premium pricing consistent with its market leadership and growth prospects. The company’s revenue growth rate of 16.4% and strong cash flow trends, with operating cash flow of $146.7 billion and free cash flow of $106.9 billion, demonstrate a robust growth trajectory supported by diversified product and services revenue streams. Financial health is solid with a manageable debt-to-equity ratio of 78.45%, ample liquidity of $62.4 billion in cash, and a current ratio near 1.0, indicating balanced short-term financial stability. Sector-specific challenges include regulatory scrutiny and supply chain constraints, while opportunities arise from expanding services and AI integration. Market positioning and competitive advantages in innovation, brand loyalty, and ecosystem integration underpin Apple’s resilience in the technology sector.
Overall Business and Market Assessment
Supporting Factors: No data
Risk Factors: regulatory developments, competitive pressures, and supply chain disruptions
SWOT Analysis
Strengths
- Market leadership with a diversified product and services portfolio.
- Strong profitability with high gross and net margins.
- Robust cash flow generation supporting dividends and buybacks.
- Extensive global brand recognition and customer loyalty.
Weaknesses
- High price-to-book ratio indicating premium valuation.
- Significant reliance on iPhone sales for revenue.
- Moderate debt levels relative to equity.
- Exposure to supply chain constraints affecting production.
Opportunities
- Expansion of services and subscription-based revenue streams.
- Increasing integration of artificial intelligence technologies.
- Growth potential in emerging markets and new product categories.
- Regulatory resolutions improving market access in key regions.
Threats
- Regulatory scrutiny and antitrust investigations globally.
- Intense competition in consumer electronics and software.
- Rising component and semiconductor costs impacting margins.
- Potential shifts in consumer preferences and technology trends.
Company Description
Apple Inc. designs, manufactures, and markets a wide range of technology products worldwide. These include the iPhone, a line of smartphones; Mac, a line of personal computers; iPad, a line of multi-purpose tablets; and wearables, home, and accessories such as AirPods, Apple Vision Pro, Apple TV, Apple Watch, Beats products, HomePod, as well as Apple branded and third-party accessories. The company operates service platforms including the App Store, Apple Music, and subscription models that provide curated content, cloud services, and digital offerings. Apple Inc. serves individual consumers, businesses, and government sectors through online stores, retail outlets, and partnerships with cellular carriers and resellers. Its products span the information technology sector, impacting mobile communication, personal computing, entertainment, and health monitoring. Founded in 1976 and headquartered in Cupertino, California, Apple Inc. plays a pivotal role in the global technology market by integrating hardware, software, and services into seamless ecosystems.