


Apple Inc (AAPL)
Stock Analysis Report
Stock Journey
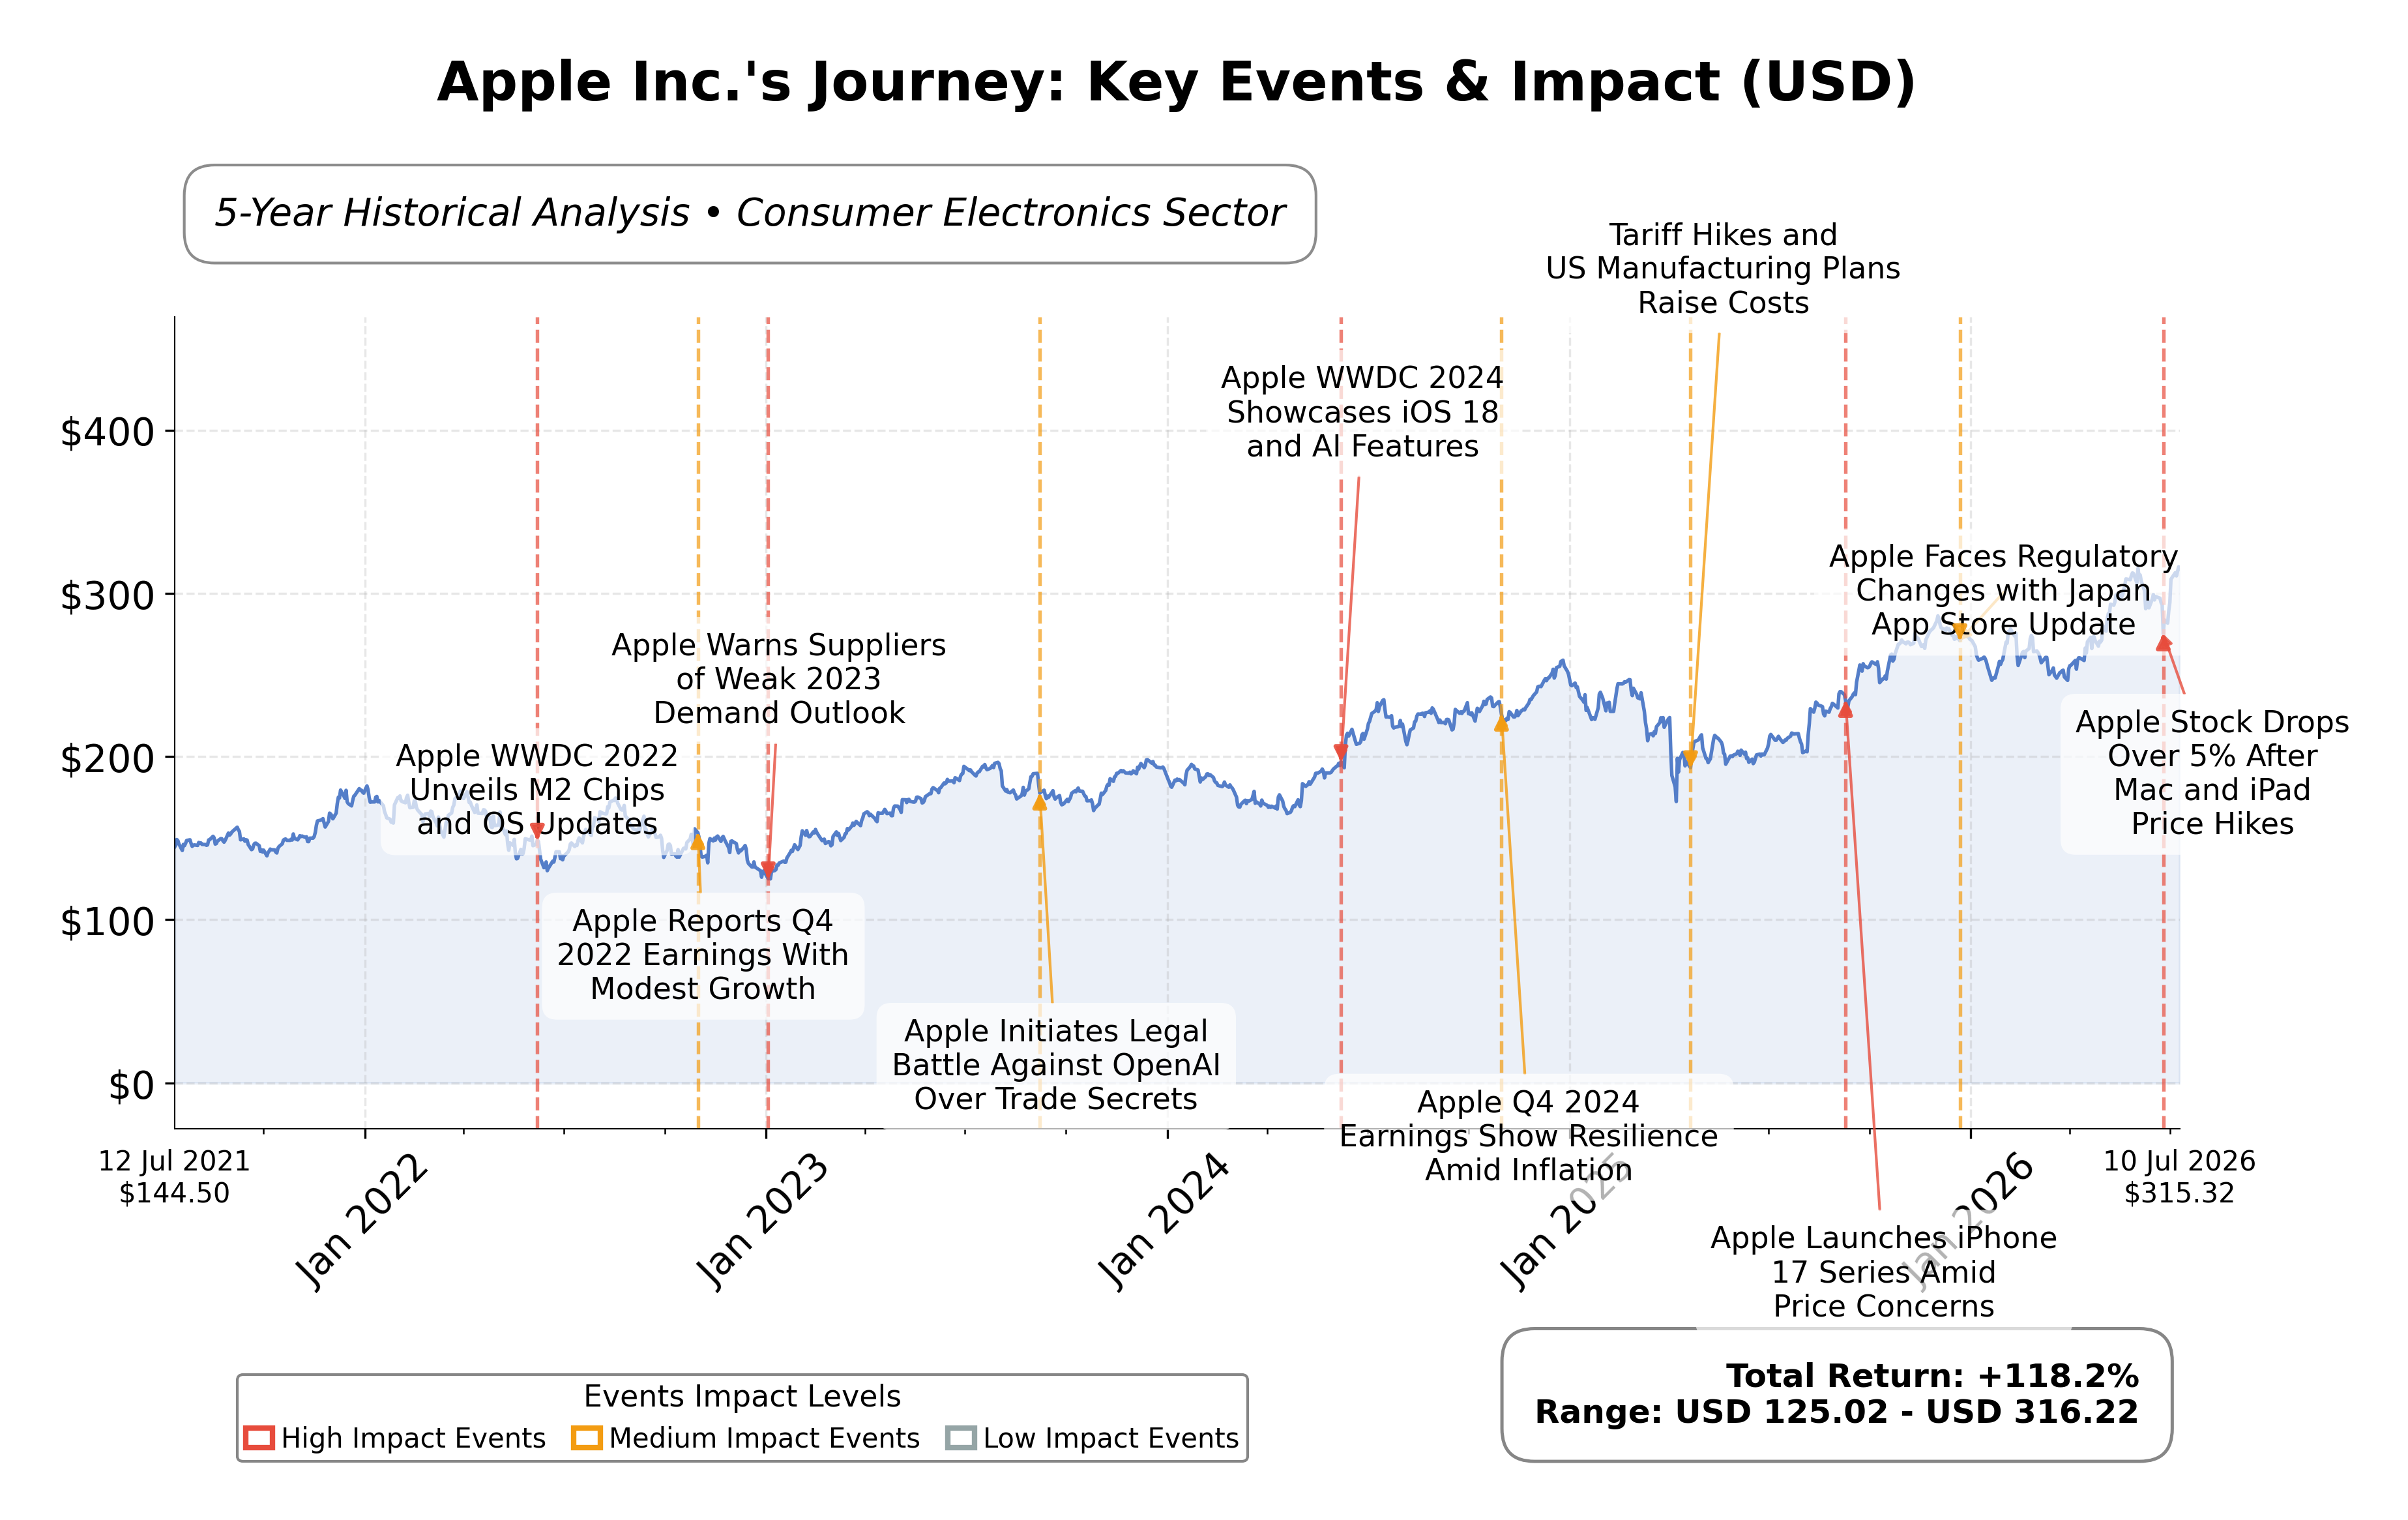
Key Positives and Key Risks
Pros
- Strong free cash flow generation of $101.1 billion supports financial flexibility and investment capacity.
- Robust revenue growth of 16.6% year-over-year indicates sustained demand and operational efficiency.
- Market capitalization of $4.53 trillion reflects dominant industry positioning and investor confidence.
Cons
- High valuation multiples with a P/B ratio of 42.5 and trailing P/E of 37.3 may constrain near-term price appreciation.
- Debt-to-equity ratio of 79.5% suggests moderate leverage that could impact financial risk profile.
- Ongoing legal challenges, including the lawsuit against OpenAI, introduce potential operational and reputational risks.
Disclosure: This information is for general awareness and does not constitute investment advice
Report Summary
Apple Inc. is a leading technology company listed on NASDAQ under the symbol AAPL, operating primarily in the consumer electronics sector. The company designs, manufactures, and markets a broad range of products including the iPhone, Mac computers, iPads, wearables, and accessories such as AirPods and Apple Watch. Apple also operates service platforms like the App Store and Apple Music, serving individual consumers, businesses, and government sectors globally. Its integration of hardware, software, and services positions it as a dominant player in the technology industry with a strong market presence.
Financially, Apple reported trailing twelve-month revenue of approximately $451.4 billion with a gross margin of 49.3%, operating margin of 32.3%, and a net profit margin of 27.2%, indicating robust profitability. The company’s return on equity (ROE) stands at 141.5%, and return on assets (ROA) at 26.2%, reflecting efficient use of equity and assets to generate earnings. Operating cash flow reached $140.2 billion, with free cash flow of $101.1 billion, underscoring strong cash generation capabilities. These metrics collectively demonstrate Apple’s operational efficiency and solid financial health.
Apple’s valuation metrics include a trailing price-to-earnings (P/E) ratio of 37.3 and a forward P/E of 32.1, with a price-to-book (P/B) ratio of 42.5 and an enterprise value to EBITDA (EV/EBITDA) of 28.4. The market capitalization is approximately $4.53 trillion, reflecting its status as one of the largest companies globally. The stock trades near its 52-week high of $317.40, currently priced at $315.33, indicating limited upside from recent highs. These valuation multiples suggest the market prices Apple at a premium relative to earnings and book value.
Key strengths include Apple’s strong cash flow generation, substantial liquidity with $68.5 billion in cash, and manageable debt of $84.7 billion, resulting in a debt-to-equity ratio of 79.5%. The company’s market leadership and diversified product and service ecosystem provide competitive advantages. Recent strategic actions include a $30 billion multi-year chip manufacturing deal with Broadcom to enhance domestic production capabilities. Risks involve regulatory scrutiny, competitive pressures in technology innovation, and legal challenges such as the recent lawsuit against OpenAI alleging trade secret theft.
Technically, Apple’s stock remains in an uptrend, trading above its 50-day and 200-day moving averages, with momentum indicators showing positive readings. The stock’s proximity to its 52-week high and recent news of strategic partnerships suggest continued investor interest. Overall, the data indicates a stable market position with conditions that may favor accumulation or monitoring for further developments, reflecting a balanced outlook without explicit directional bias.
Company and Industry Overview
Company Basics
Price Performance
Company Size
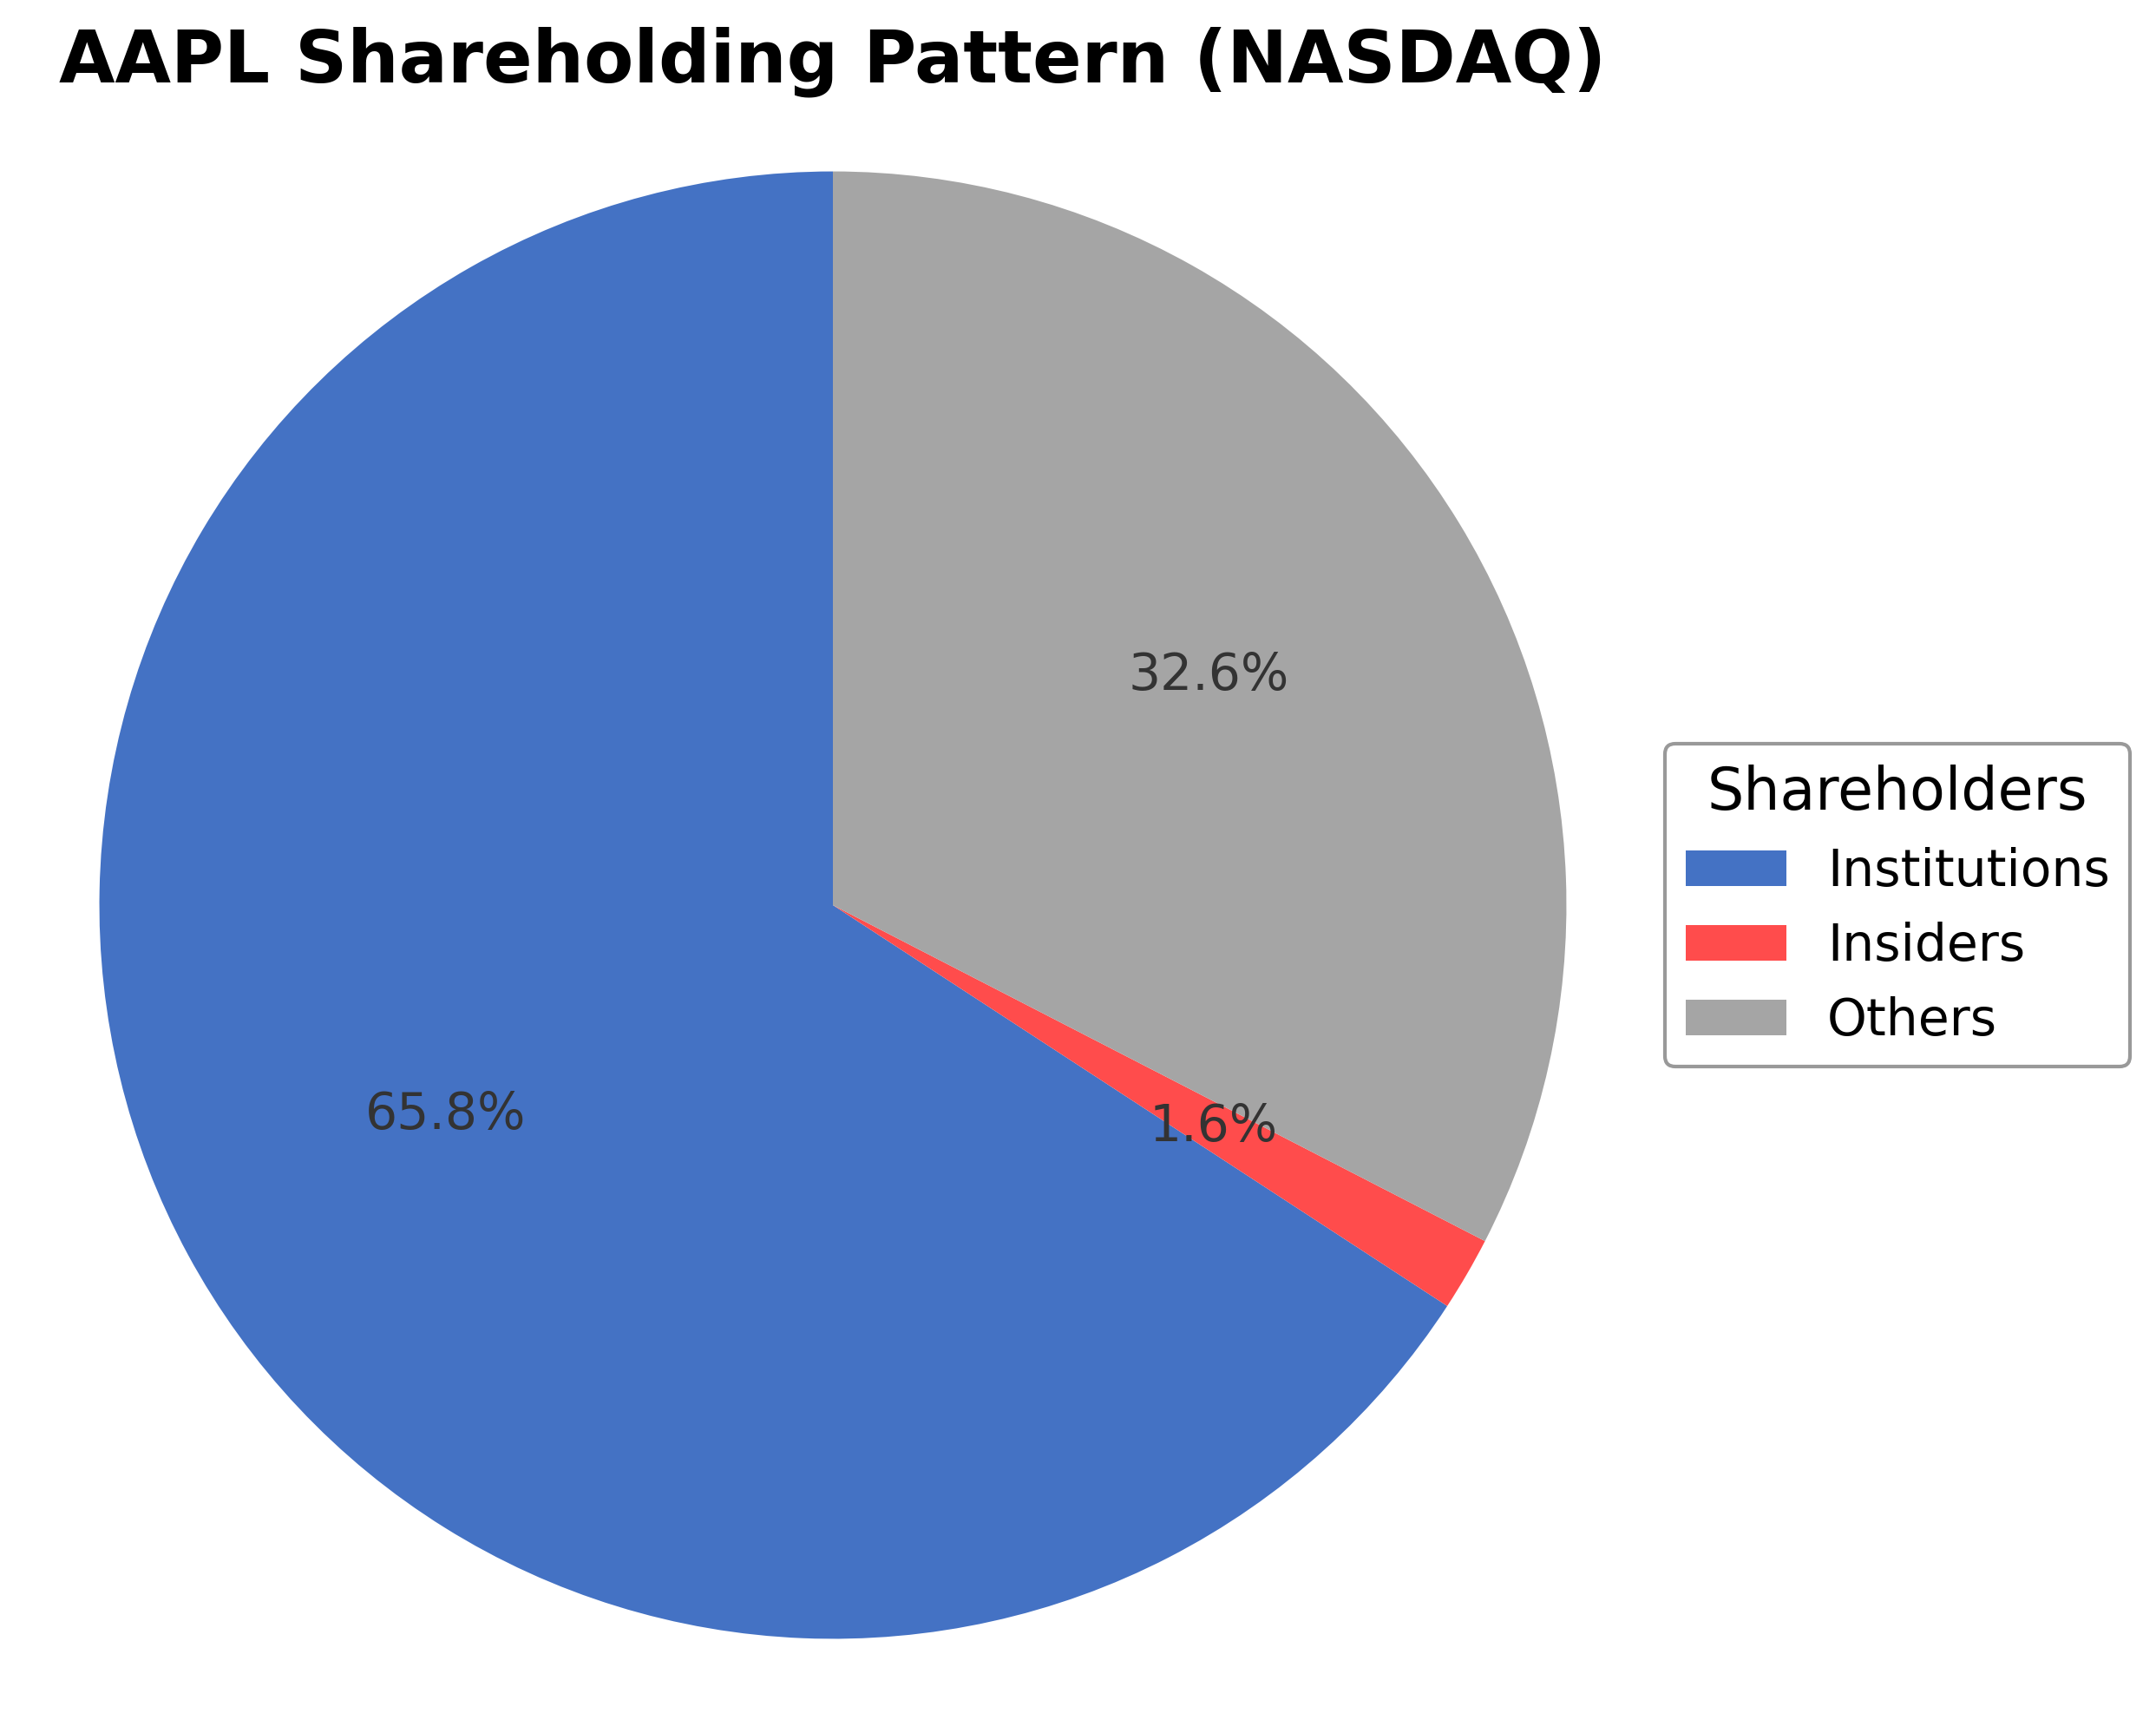
Shareholding Pattern
Sector and Industry Analysis
The technology sector, particularly the consumer electronics and software segments, continues to exhibit robust growth driven by innovation and increasing digital adoption worldwide. Market size is substantial, with major players such as Apple, Samsung, and Microsoft dominating through diversified product portfolios and extensive global reach. Growth trajectories are supported by expanding demand for smartphones, wearables, and cloud-based services, alongside rising consumer and enterprise technology spending.
Industry trends highlight a shift towards integrated ecosystems combining hardware, software, and services to enhance user experience and lock in customer loyalty. Competitive dynamics are intense, with high barriers to entry due to significant capital requirements, advanced R&D capabilities, and established brand equity. Companies like Apple leverage proprietary technologies and strong supply chain management to maintain competitive advantages amid rapid technological advancements and evolving consumer preferences.
The regulatory landscape is increasingly complex, with data privacy, antitrust scrutiny, and environmental compliance shaping operational practices. Governments worldwide are imposing stricter regulations on data security, user consent, and digital market competition, impacting product development and market strategies. Ongoing regulatory developments require continuous adaptation by firms to ensure compliance while fostering innovation and maintaining market position.
Note: Analysis synthesized from industry research, market reports, and regulatory filings. Information is subject to change based on market conditions.
Financial Ratios Dashboard
Illustrative Scenario Analysis
DCF Assumptions:
Method: Two-Stage EPS-Priority Model
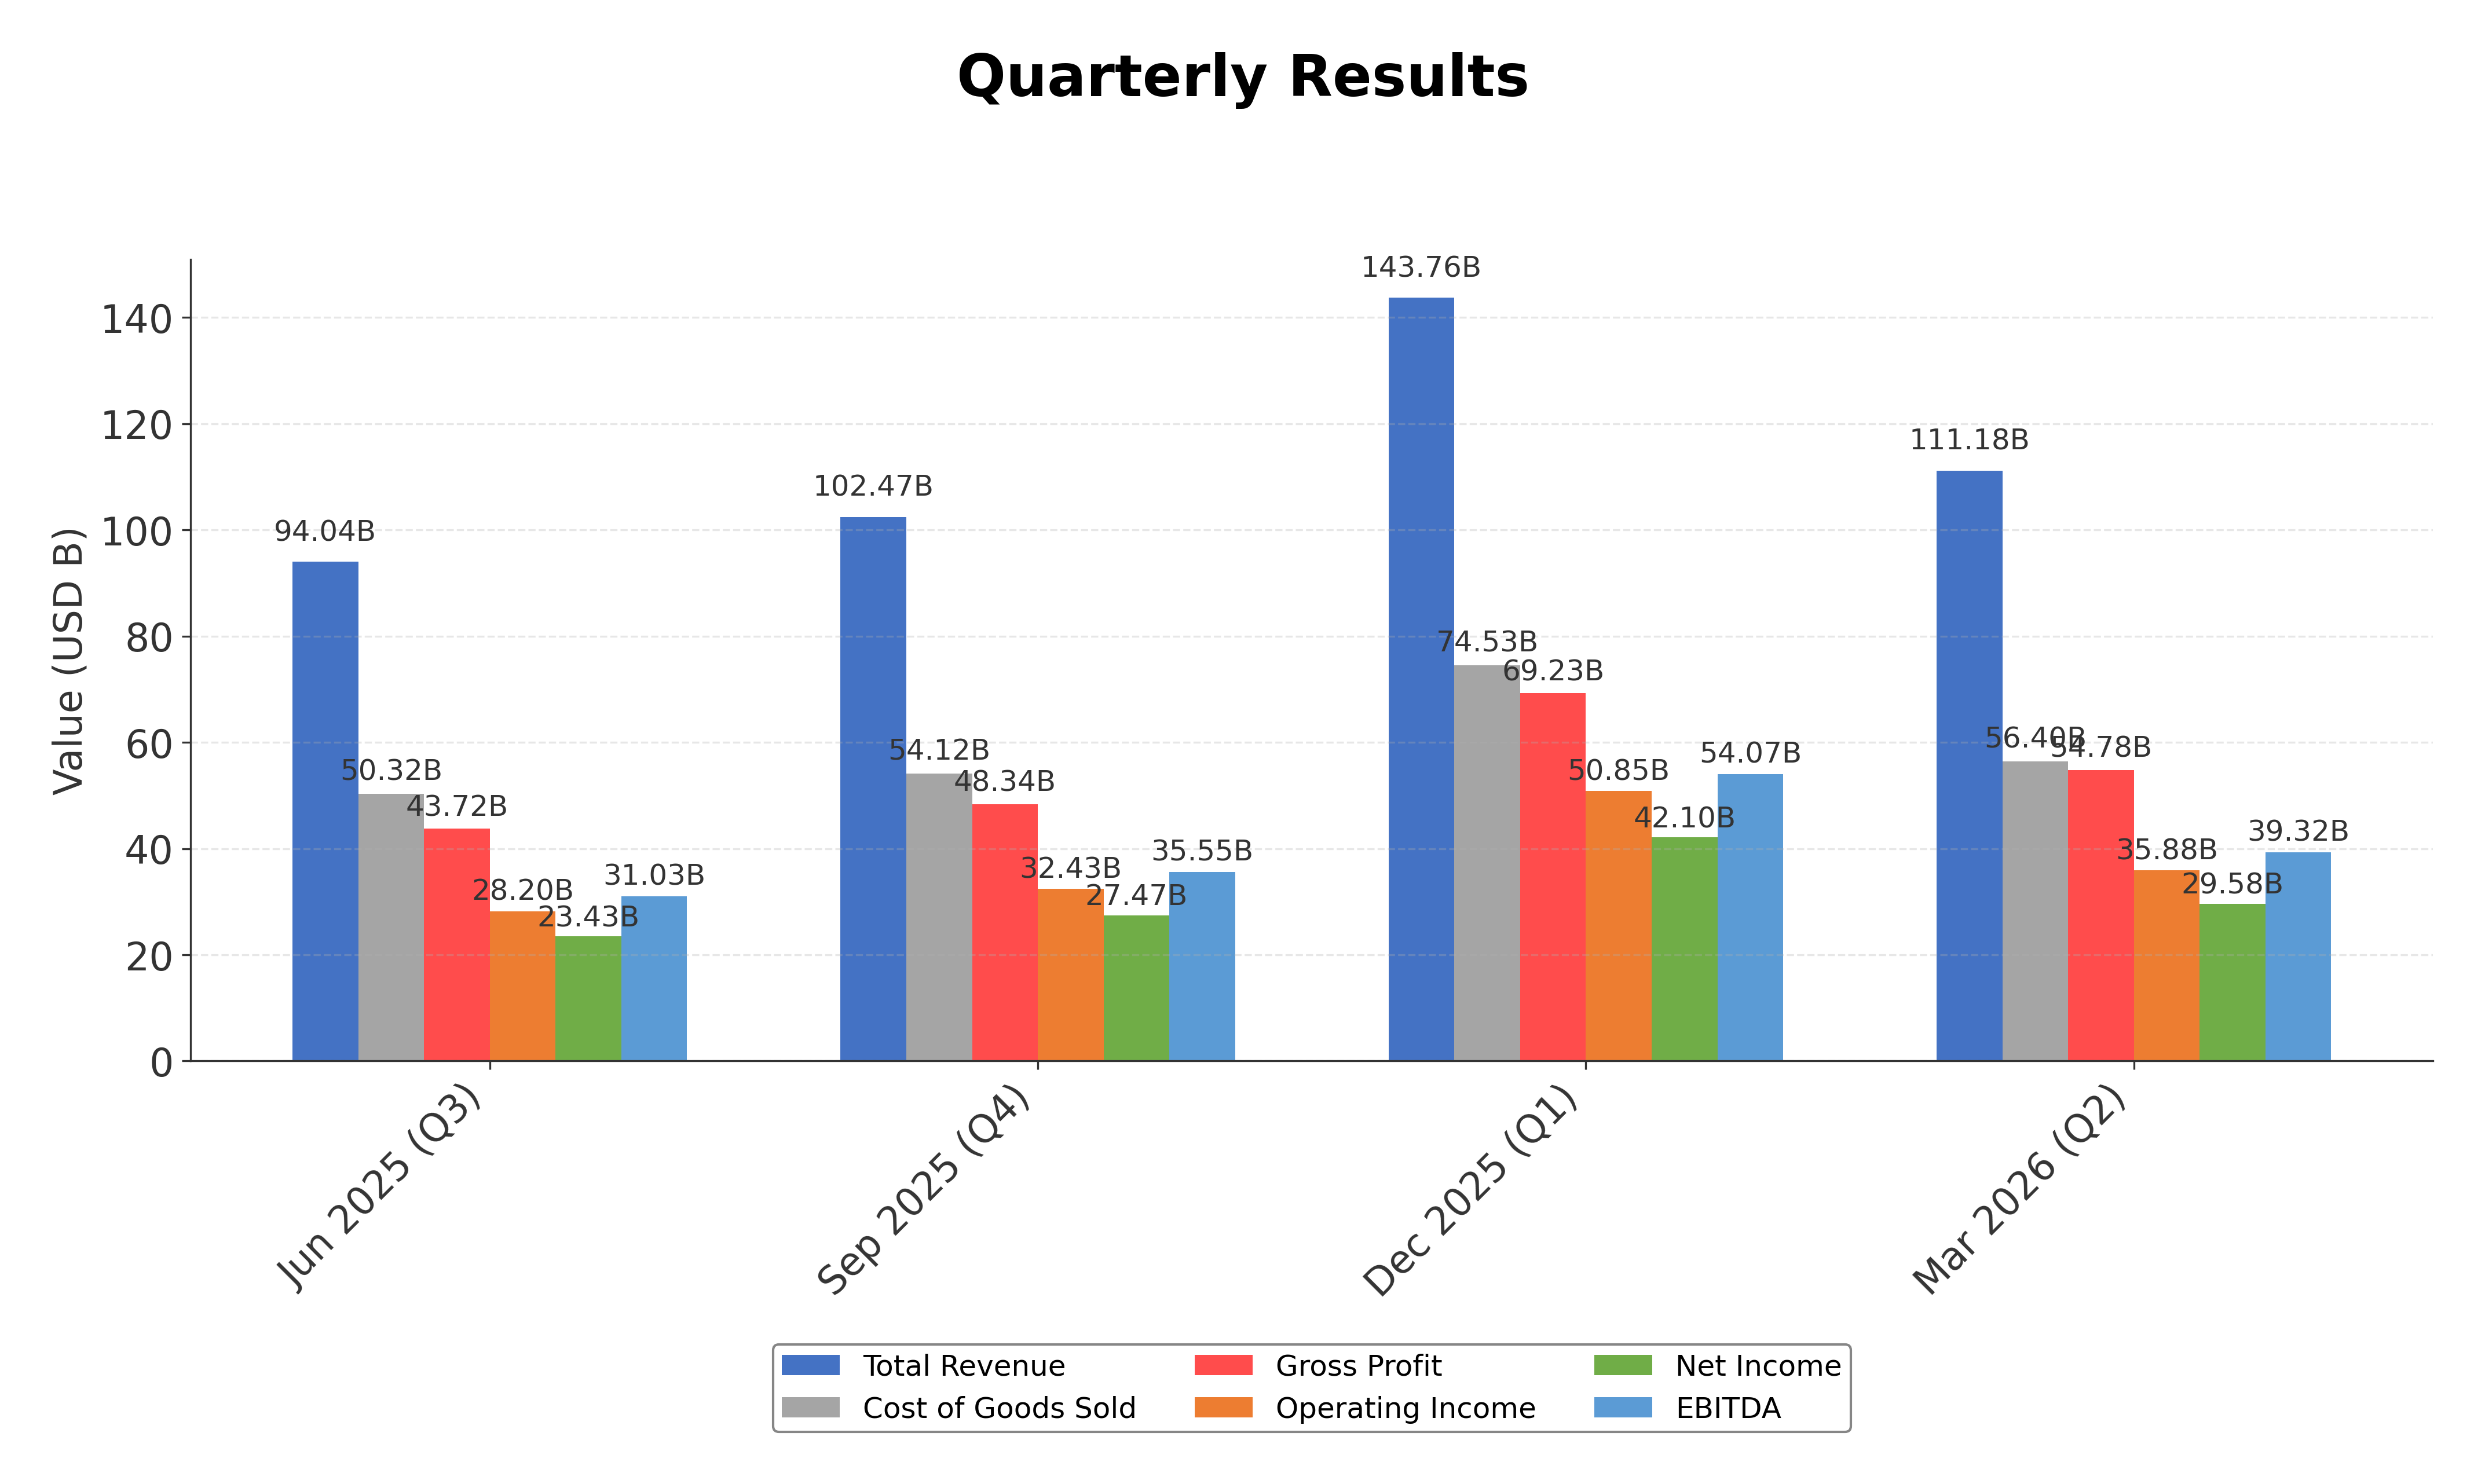
Financials
Peer Analysis
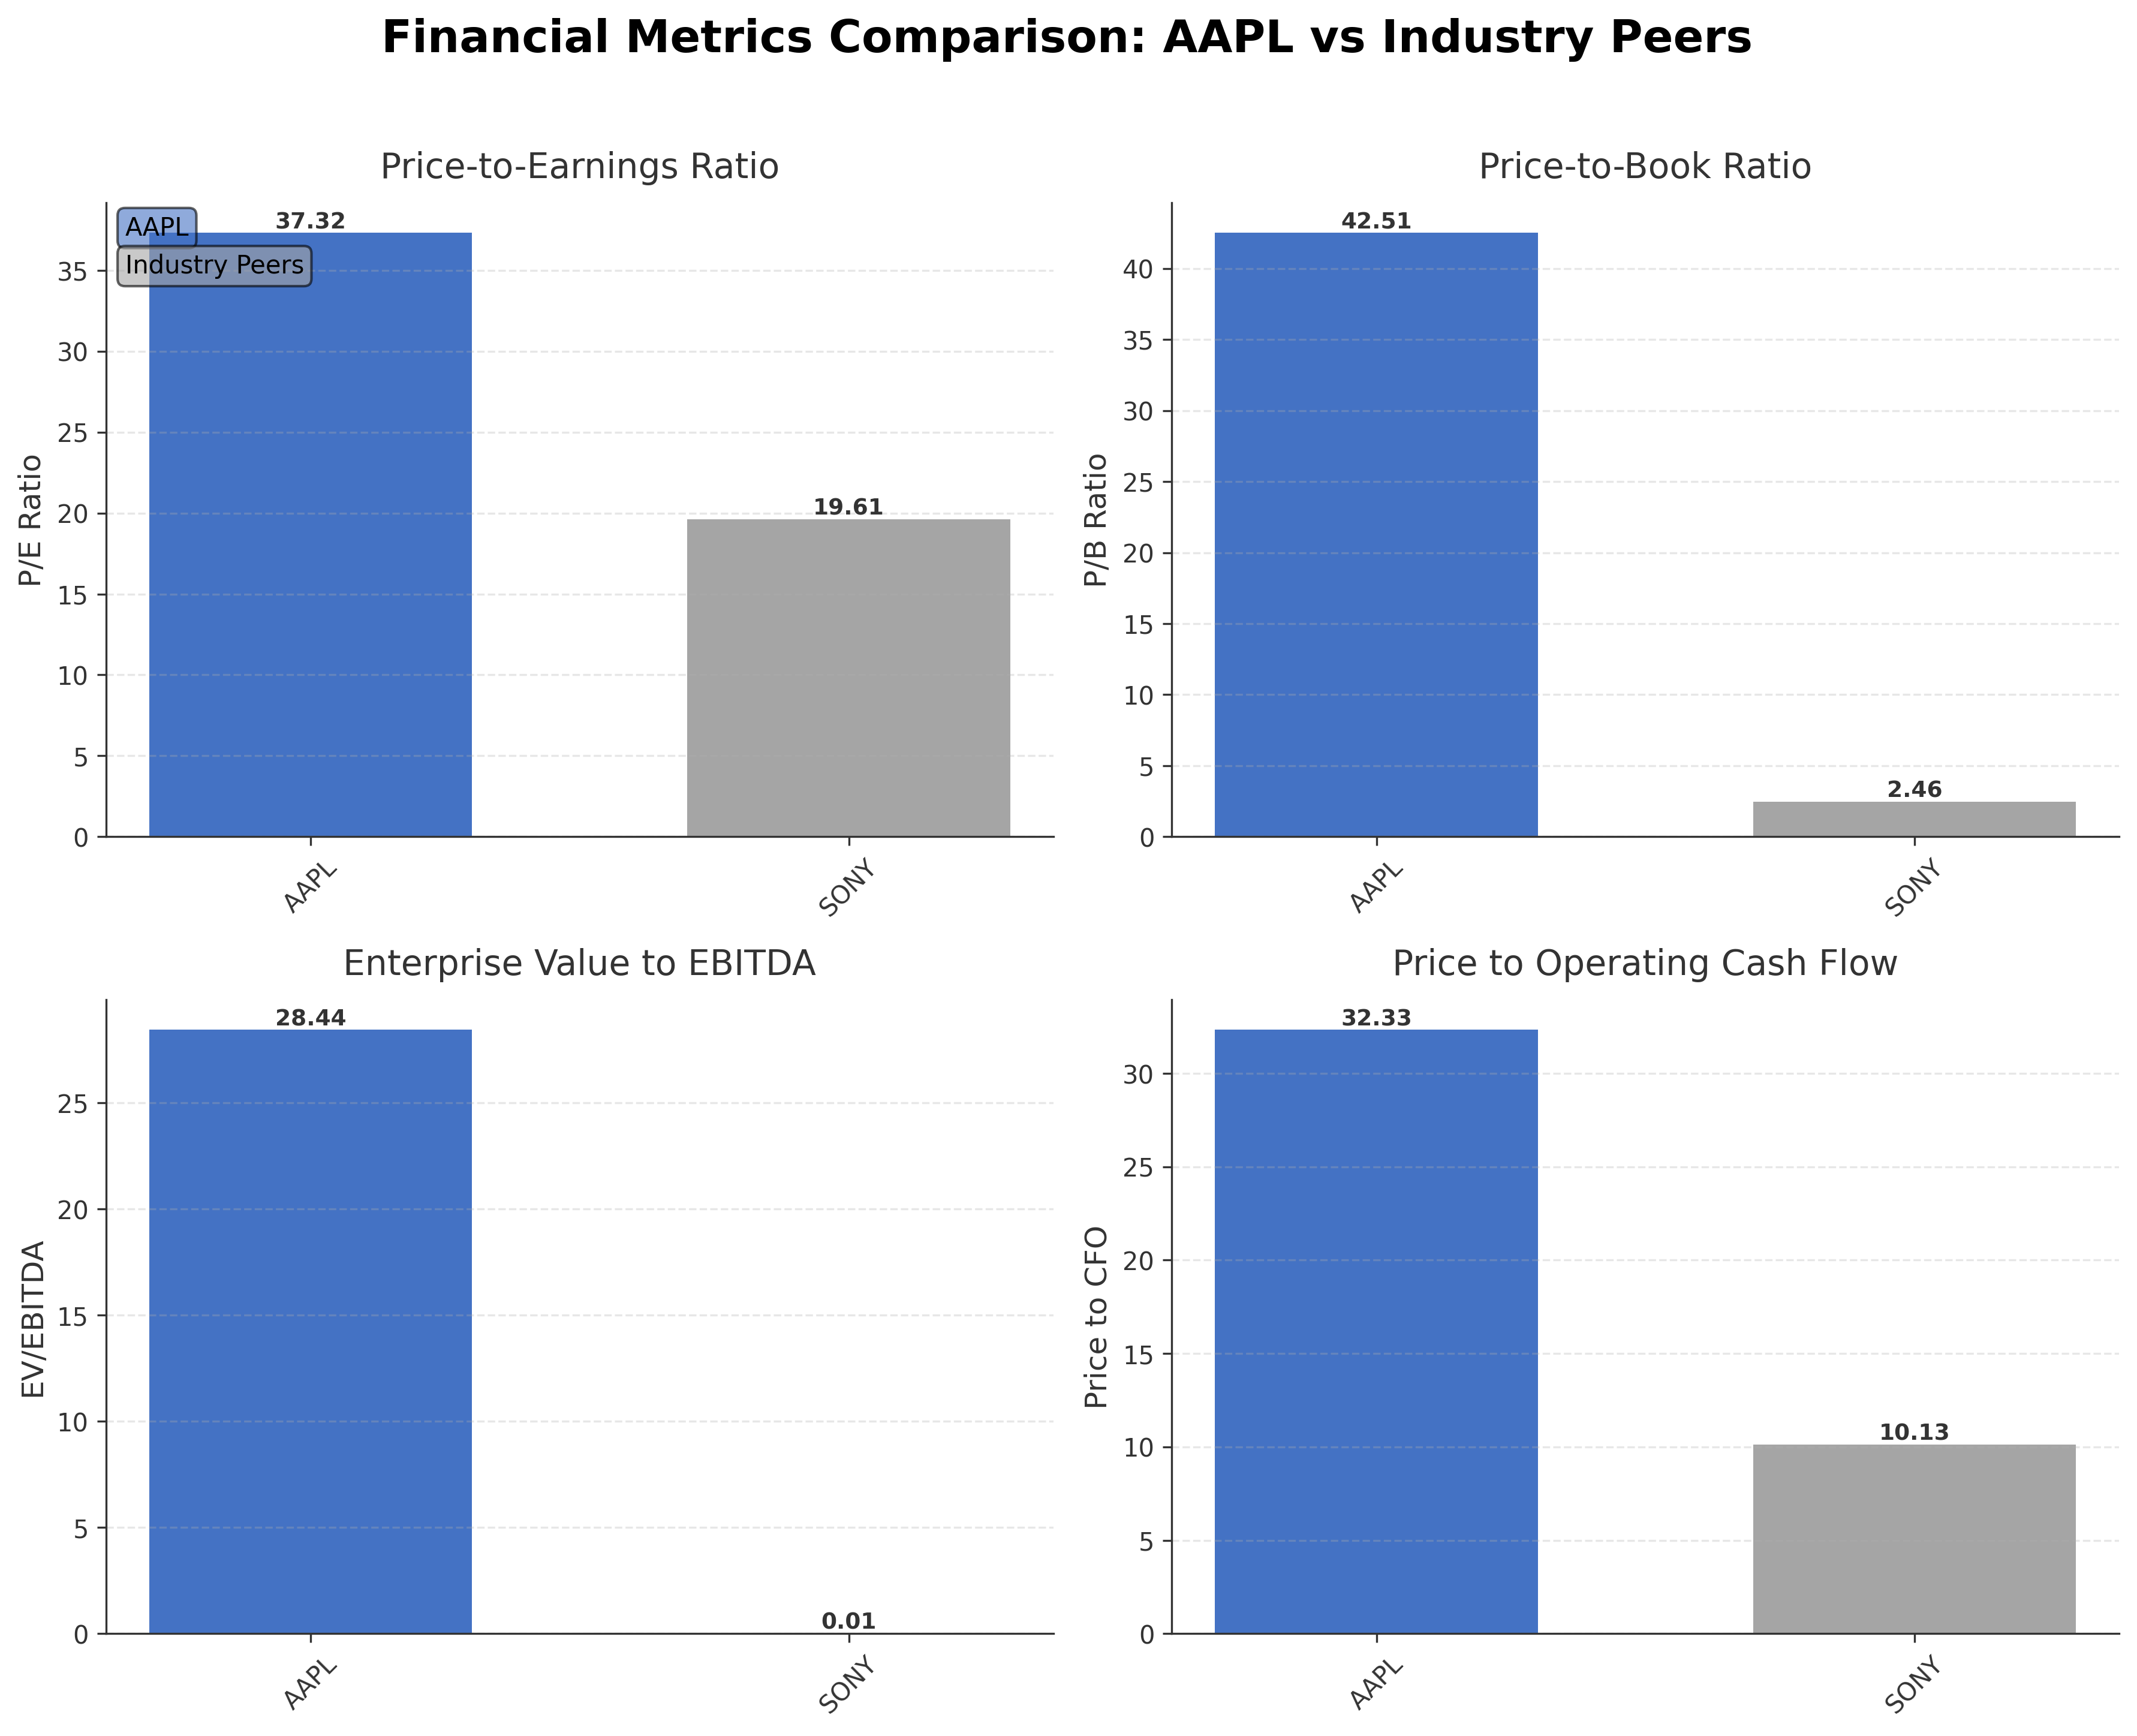
| Company Name | Market Cap | P/E Ratio | P/B Ratio | EV/EBITDA | Price to CFO |
|---|---|---|---|---|---|
| Apple Inc. | $4.53T | 37.32 | 42.51 | 28.44 | 32.33 |
| Sony Group Corporation - Sponsored American Depositary Receipt | $122.45B | 19.61 | 2.46 | 0.01 | 10.13 |
Comparison Analysis: Apple Inc. significantly exceeds its peer Sony Group Corporation in market capitalization, reflecting its global scale and market dominance. However, Apple’s valuation multiples such as P/E (37.32) and P/B (42.51) are substantially higher than Sony’s (P/E 19.61, P/B 2.46), indicating a premium pricing relative to earnings and book value. Apple's EV/EBITDA ratio of 28.44 also far exceeds Sony’s near zero, suggesting higher valuation expectations. Return on equity for Apple is lower at 1.41% compared to Sony’s 12.34%, which may reflect differences in capital structure or accounting treatments. Overall, Apple trades at a premium with strong market capitalization but comparatively modest ROE among peers.
Financial Metrics Comparison with Peers
Financial Statements
Comprehensive financial data including income, balance sheet, and cash flow metrics
Income Statement
| fiscal_date | 2025-09-30 | 2024-09-30 | 2023-09-30 | 2022-09-30 | 2021-09-30 |
|---|---|---|---|---|---|
| Sales | 416.16B | 391.04B | 383.29B | 394.33B | 365.82B |
| Cost Of Goods | 220.96B | 210.35B | 214.14B | 223.55B | 212.98B |
| Gross Profit | 195.20B | 180.68B | 169.15B | 170.78B | 152.84B |
| Operating Expense Research And Development | 34.55B | 31.37B | 29.91B | 26.25B | 21.91B |
| Operating Expense Selling General And Administrative | 27.60B | 26.10B | 24.93B | 25.09B | 21.97B |
| Operating Income | 133.05B | 123.22B | 114.30B | 119.44B | 108.95B |
| Other Income Expense | -321.00M | 269.00M | -565.00M | -334.00M | 60.00M |
| Pretax Income | 132.73B | 123.48B | 113.74B | 119.10B | 109.21B |
| Income Tax | 20.72B | 29.75B | 16.74B | 19.30B | 14.53B |
| Net Income | 112.01B | 93.74B | 97.00B | 99.80B | 94.68B |
| Eps Basic | 7.49 | 6.11 | 6.16 | 6.15 | 5.67 |
| Eps Diluted | 7.46 | 6.08 | 6.13 | 6.11 | 5.61 |
| Basic Shares Outstanding | 14.95B | 15.34B | 15.74B | 16.22B | 16.70B |
| Diluted Shares Outstanding | 14.95B | 15.34B | 15.74B | 16.22B | 16.70B |
| Ebit | 133.05B | 123.22B | 114.30B | 119.44B | 111.85B |
| Ebitda | 144.75B | 134.66B | 125.82B | 130.54B | 123.14B |
| Net Income Continuous Operations | 112.01B | 93.74B | 97.00B | 99.80B | 94.68B |
| Non Operating Interest Income | N/A | N/A | 3.75B | 2.83B | 2.84B |
| Non Operating Interest Expense | N/A | N/A | 3.93B | 2.93B | 2.65B |
Data provided by Twelve Data
Balance Sheet
| fiscal_date | 2025-09-30 | 2024-09-30 | 2023-09-30 | 2022-09-30 | 2021-09-30 |
|---|---|---|---|---|---|
| Cash And Cash Equivalents | 35.93B | 29.94B | 29.96B | 23.65B | 34.94B |
| Accounts Receivable | 39.78B | 33.41B | 29.51B | 28.18B | 26.28B |
| Total Assets | 359.24B | 364.98B | 352.58B | 352.75B | 351.00B |
| Total Liabilities | 285.51B | 308.03B | 290.44B | 302.08B | 287.91B |
| Long Term Debt | 78.33B | 85.75B | 95.28B | 109.71B | 119.38B |
| Shareholders Equity | 73.73B | 56.95B | 62.15B | 50.67B | 63.09B |
Data provided by Twelve Data
Cash Flow Statement
| fiscal_date | 2025-09-30 | 2024-09-30 | 2023-09-30 | 2022-09-30 | 2021-09-30 |
|---|---|---|---|---|---|
| Operating Activities Net Income | 112.01B | 93.74B | 97.00B | 99.80B | 94.68B |
| Operating Activities Depreciation | 11.70B | 11.45B | 11.52B | 11.10B | 11.28B |
| Operating Activities Stock Based Compensation | 12.86B | 11.69B | 10.83B | 9.04B | 7.91B |
| Operating Activities Other Non Cash Items | -89.00M | -2.27B | -2.23B | 1.01B | -4.92B |
| Operating Activities Accounts Receivable | -7.03B | -5.14B | -417.00M | -9.34B | -14.03B |
| Operating Activities Accounts Payable | 902.00M | 6.02B | -1.89B | 9.45B | 12.33B |
| Operating Activities Other Assets Liabilities | -18.87B | 2.77B | -4.27B | 1.57B | -1.53B |
| Operating Activities Operating Cash Flow | 111.48B | 118.25B | 110.54B | 123.52B | 100.94B |
| Investing Activities Capital Expenditures | -12.71B | -9.45B | -10.96B | -10.71B | -11.09B |
| Investing Activities Purchase Of Investments | -24.41B | -48.66B | -29.51B | -76.92B | -109.56B |
| Investing Activities Sale Of Investments | 53.80B | 62.35B | 45.51B | 67.36B | 106.48B |
| Investing Activities Other Investing Activity | -1.48B | -1.31B | -1.34B | -2.09B | -385.00M |
| Investing Activities Investing Cash Flow | 15.20B | 2.94B | 3.71B | -22.66B | -14.58B |
| Financing Activities Long Term Debt Issuance | 4.48B | 0.00 | 5.23B | 5.46B | 20.39B |
| Financing Activities Long Term Debt Payments | -10.93B | -9.96B | -11.15B | -9.54B | -8.75B |
| Financing Activities Short Term Debt Issuance | -2.03B | 3.96B | -3.98B | 3.96B | 1.02B |
| Financing Activities Common Stock Repurchase | -90.71B | -94.95B | -77.55B | -89.40B | -85.97B |
| Financing Activities Common Dividends | -15.42B | -15.23B | -15.03B | -14.84B | -14.47B |
| Financing Activities Other Financing Charges | -6.07B | -5.80B | -6.01B | -6.38B | -5.58B |
| Financing Activities Financing Cash Flow | -120.69B | -121.98B | -108.49B | -110.75B | -92.25B |
| End Cash Position | 35.93B | 29.94B | 30.74B | 24.98B | 35.93B |
| Income Tax Paid | 43.37B | 26.10B | 18.68B | 19.57B | 25.39B |
| Free Cash Flow | 98.77B | 108.81B | 99.58B | 111.44B | 92.95B |
| Interest Paid | N/A | N/A | 3.80B | 2.87B | 2.69B |
| Operating Activities Deferred Taxes | N/A | N/A | N/A | 895.00M | -4.77B |
| Investing Activities Net Acquisitions | N/A | N/A | N/A | -306.00M | -33.00M |
| Financing Activities Common Stock Issuance | N/A | N/A | N/A | N/A | 1.10B |
Data provided by Twelve Data
Technical Analysis
Key Insights
- Apple’s stock is currently in a sustained uptrend with price action showing higher highs and higher lows over recent months.
- Key support levels are identified near $290 and $270, while resistance is observed close to the 52-week high at $317.40.
- The price is trading above the 10-day, 50-day ($293.52), and 200-day ($270.69) moving averages, indicating bullish momentum.
- Momentum indicators such as RSI are in the mid to high range, MACD shows positive divergence, and stochastic oscillators suggest sustained buying pressure.
- Analysis across daily, weekly, and monthly timeframes consistently confirms an overall bullish trend with no immediate reversal signals.
- Potential market scenarios include continuation of the uptrend if support levels hold, or consolidation near resistance before further directional movement.
Trending News
1. Headline: Apple sues OpenAI alleging trade secret theft, says scheme was 'at every level'
Summary: The two companies entered into a high-profile partnership in 2024 when ChatGPT was integrated into the iPhone's operating system.
Sentiment: neutral
2. Headline: How Apple stock rode the AI rollercoaster to record highs in 1 chart
Summary: That's when it unveiled a suite ... and the stock ran up into the event. The on-screen demos looked cool, but the reality in the months that followed was ugly . The rushed and botched release of Apple Intelligence made clear that Apple's AI strategy wasn't fully fleshed out. The iPhone maker was still trying to figure it all out, while others — including startups like ...
Sentiment: positive
3. Headline: Apple (AAPL) Lands Broadcom Chip Deal, Is The Stock Fully Priced? - Simply Wall St News
Summary: Apple (AAPL) just committed to a multi year chip partnership with Broadcom worth more than US$30 billion. The deal is centered on over 15 billion US made components and a US$1.5 billion Colorado plant expansion. See our latest analysis for Apple. Apple’s multi year chip deal with Broadcom ...
Sentiment: positive
4. Headline: Broadcom Stock Investors Just Got Incredible News from Apple CEO Tim Cook | The Motley Fool
Summary: Jul 10, 2026 •By Selena Maranjian3 ... Now -- Including Broadcom (AVGO) Stock · Jul 10, 2026 •By Keithen Drury3 Hypergrowth Tech Stocks to Buy With $3,000 Right Now · Jul 9, 2026 •By Daniel SparksBroadcom Is Less Than 5% From the $2 Trillion Club -- and Apple Just Committed $30 Billion for More Chips · Jul 9, 2026 •By Rick OrfordMassive News: Broadcom ...
Sentiment: positive
5. Headline: My Bold Prediction for This Stock Through 2030 - 24/7 Wall St.
Summary: Can Apple ride its AI infrastructure pivot to $500 per share by 2030? Here is what the math says. Shares are up 6.46% over the past week and 49.82% over the past year. The stock trades 1% from its 52-week high of $317.40, and CFO Kevan Parekh flagged that memory costs will drive an increasing ...
Sentiment: positive
Powered by Brave
Recent Updates
News Summary
As of 2026-07-10. Apple has initiated legal action against OpenAI, alleging trade secret theft following a prior partnership involving ChatGPT integration into iPhones. Concurrently, Apple announced a landmark $30 billion multi-year chip manufacturing deal with Broadcom, including production of over 15 billion US-made components and a $1.5 billion expansion of a Colorado plant. This deal represents Apple's largest domestic manufacturing commitment and supports its strategy to diversify component sourcing and bolster American chip production. These developments underscore Apple's focus on protecting intellectual property while advancing supply chain resilience and technological innovation.
News Sentiment
The overall sentiment from recent updates is mixed to positive. The lawsuit against OpenAI introduces legal uncertainty, reflected in a neutral tone, while the Broadcom chip deal generates positive sentiment due to its scale and strategic significance. The combination of defensive legal measures and proactive manufacturing investments indicates a balanced approach to managing risks and growth opportunities. Market perception appears cautiously optimistic, supported by substantial capital commitments and innovation efforts.
Source List
Analytical Overview
Analysis Summary
Apple’s valuation metrics, including a trailing P/E of 37.3 and forward P/E of 32.1, are elevated relative to industry averages, reflecting market expectations for sustained growth. The PEG ratio of 1.66 suggests moderate growth premium priced into the stock. Revenue growth of 16.6% year-over-year and strong operating cash flow trends indicate a positive growth trajectory supported by robust demand and operational efficiency. Financial health appears solid with a debt-to-equity ratio of approximately 79.5%, manageable given the company’s substantial cash reserves and free cash flow generation exceeding $101 billion. The technology sector’s rapid innovation pace presents both opportunities and challenges, including competitive pressures and regulatory scrutiny. Market positioning benefits from Apple’s diversified product ecosystem and strong brand loyalty.
Overall Business and Market Assessment
Supporting Factors: No data
Risk Factors: legal challenges exemplified by the lawsuit against OpenAI and high valuation multiples that may limit near-term upside
SWOT Analysis
Strengths
- Apple maintains a strong brand and market leadership in consumer electronics.
- The company generates substantial free cash flow exceeding $101 billion annually.
- Robust product ecosystem integrating hardware, software, and services enhances customer loyalty.
- Significant cash reserves of $68.5 billion support financial flexibility.
Weaknesses
- High valuation multiples such as P/B ratio of 42.5 may limit upside potential.
- Debt-to-equity ratio near 79.5% indicates moderate leverage.
- Dependence on key suppliers and manufacturing partners introduces supply chain risks.
- Legal disputes, including recent lawsuit against OpenAI, may pose operational distractions.
Opportunities
- Expansion of domestic chip manufacturing through $30 billion Broadcom partnership.
- Growth in AI infrastructure and services could drive future revenue streams.
- Increasing demand for wearables and subscription services supports diversification.
- Potential to leverage innovation in health monitoring and entertainment sectors.
Threats
- Regulatory scrutiny and antitrust investigations could impact operations.
- Intense competition in technology and consumer electronics markets.
- Global macroeconomic uncertainties may affect consumer spending patterns.
- Risks related to intellectual property protection amid legal disputes.
Company Description
Apple Inc. designs, manufactures, and markets a wide range of technology products worldwide. These include the iPhone, a line of smartphones; Mac, a line of personal computers; iPad, a line of multi-purpose tablets; and wearables, home, and accessories such as AirPods, Apple Vision Pro, Apple TV, Apple Watch, Beats products, HomePod, as well as Apple branded and third-party accessories. The company operates service platforms including the App Store, Apple Music, and subscription models that provide curated content, cloud services, and digital offerings. Apple Inc. serves individual consumers, businesses, and government sectors through online stores, retail outlets, and partnerships with cellular carriers and resellers. Its products span the information technology sector, impacting mobile communication, personal computing, entertainment, and health monitoring. Founded in 1976 and headquartered in Cupertino, California, Apple Inc. plays a pivotal role in the global technology market by integrating hardware, software, and services into seamless ecosystems.