
Apple Inc (AAPL)
Stock Analysis Report
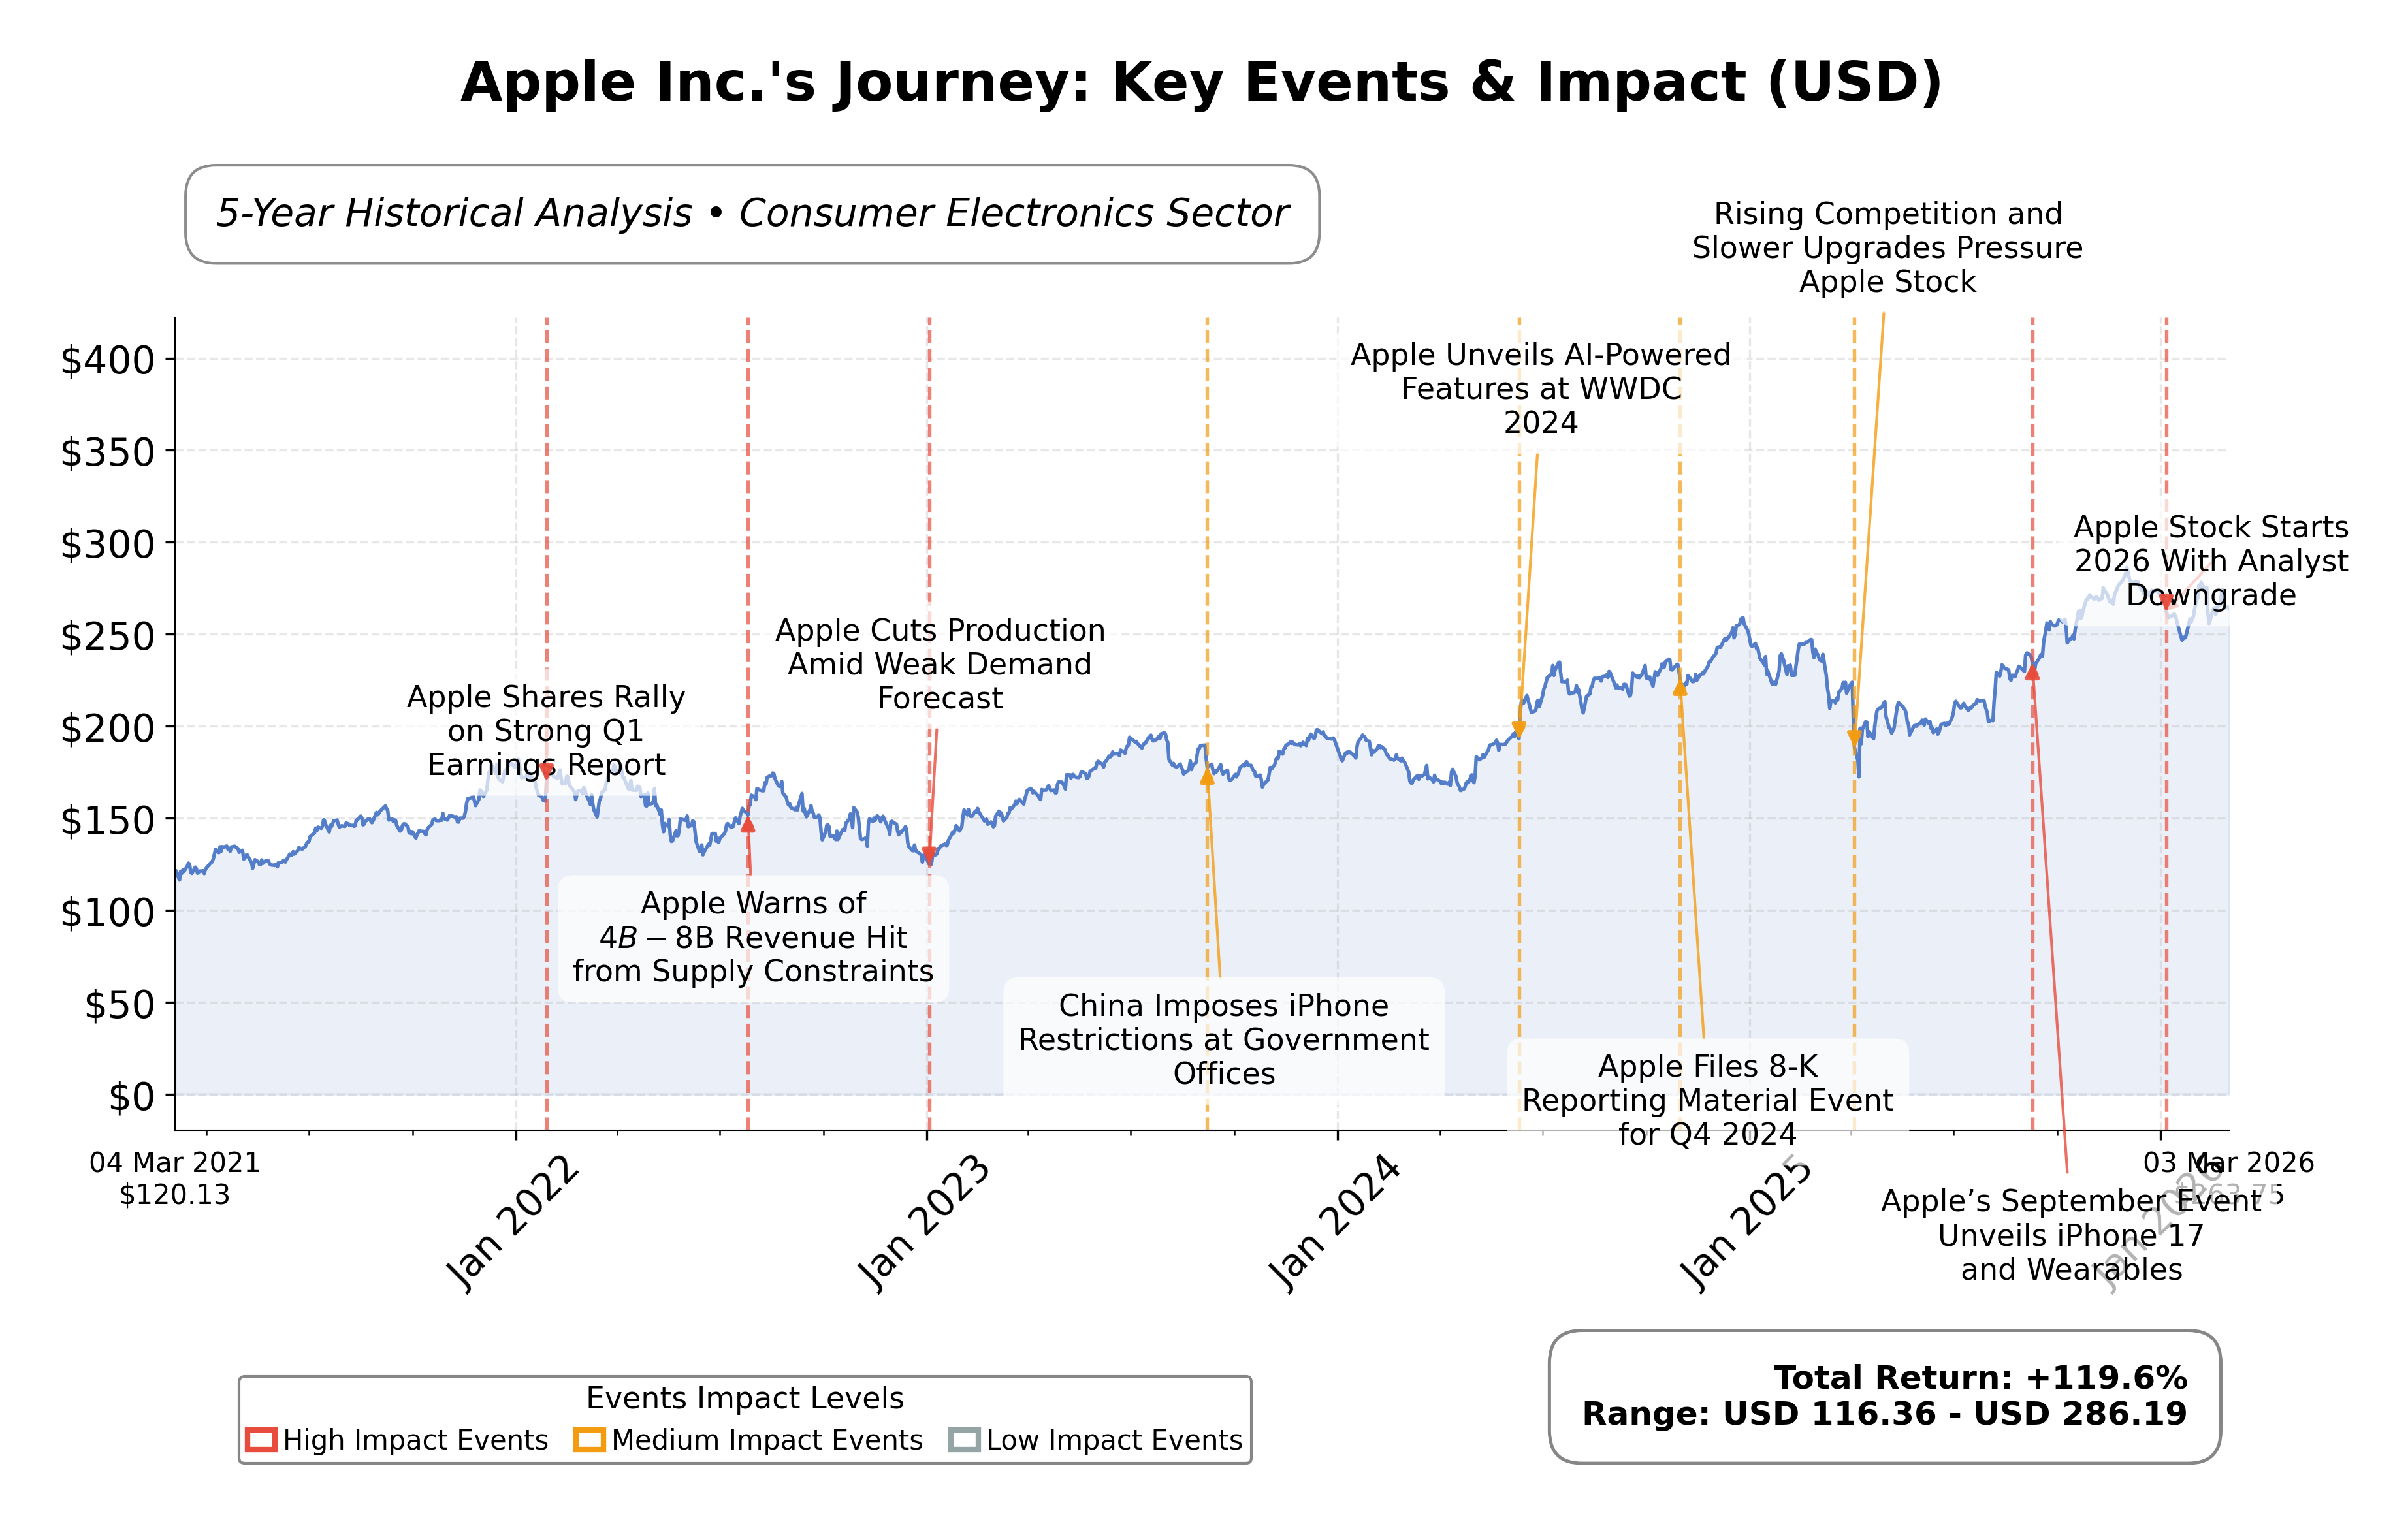
Stock Journey
Key Positives and Key Risks
Pros
- Strong revenue growth with a quarterly increase of 15.7%, indicating robust demand.
- High operating cash flow of $135.5 billion TTM supports financial flexibility.
- Premium market capitalization of $3.88 trillion reflects strong market confidence.
Cons
- Elevated debt-to-equity ratio of 102.63 suggests significant leverage.
- Price-to-book ratio of 44.04 indicates a highly premium valuation.
- Supply chain and memory shortages have led to product price increases, potentially impacting demand.
Disclosure: This information is for general awareness and does not constitute investment advice
Report Summary
Apple Inc. is a leading technology company specializing in the design, manufacturing, and marketing of consumer electronics and software products. Operating primarily in the consumer electronics industry within the technology sector, Apple is globally recognized for its flagship iPhone product, complemented by a broad ecosystem including Mac computers, iPads, wearables, and digital services. The company maintains a significant market presence through extensive retail and online channels worldwide.
Financially, Apple exhibits robust performance with a market capitalization of approximately $3.88 trillion and a trailing P/E ratio of 33.48, slightly above the industry average. The company reported trailing twelve months (TTM) revenue of $435.6 billion and net income of $117.8 billion, reflecting strong profitability with a profit margin of 27.0%. Key valuation metrics include a forward P/E of 28.41 and a price-to-book ratio of 44.04, indicating premium market valuation relative to book value.
Technically, Appleâs stock price is currently trading at $262.45, positioned above its 200-day moving average of $242.65 and near the 50-day moving average of $265.58, suggesting a generally positive trend. Recent strategic initiatives include product launches such as the iPhone 17e and MacBook Neo, signaling a focus on expanding market segments with competitive pricing. Leadership changes were not reported recently, while notable risks include industry-wide supply constraints and pricing pressures. Institutional ownership is significant at 65.17%, indicating strong institutional interest.
In peer comparison within the consumer electronics industry and U.S. market, Appleâs market capitalization and valuation metrics substantially exceed those of its peers, such as Sony Group Corporation, which has a market cap of $137.51 billion and a P/E ratio of 17.47. Appleâs return on equity (1.52%) is higher than Sonyâs (0.15%), reflecting comparatively stronger profitability and capital efficiency. However, Appleâs price-to-book and EV/EBITDA ratios are markedly higher, underscoring its premium valuation status.
Apple navigates a dynamic technology landscape characterized by rapid innovation and competitive pressures. Recent achievements include successful product launches targeting diverse consumer segments and sustained revenue growth. Challenges persist in managing supply chain constraints and maintaining market share amid evolving consumer preferences. The companyâs strategic decisions and market conditions will critically influence its ability to sustain growth and valuation. Given the current data, a balanced approach to monitoring Appleâs market developments and financial performance appears prudent.
Company and Industry Overview
Company Basics
Price Performance
Company Size
Shareholding Pattern
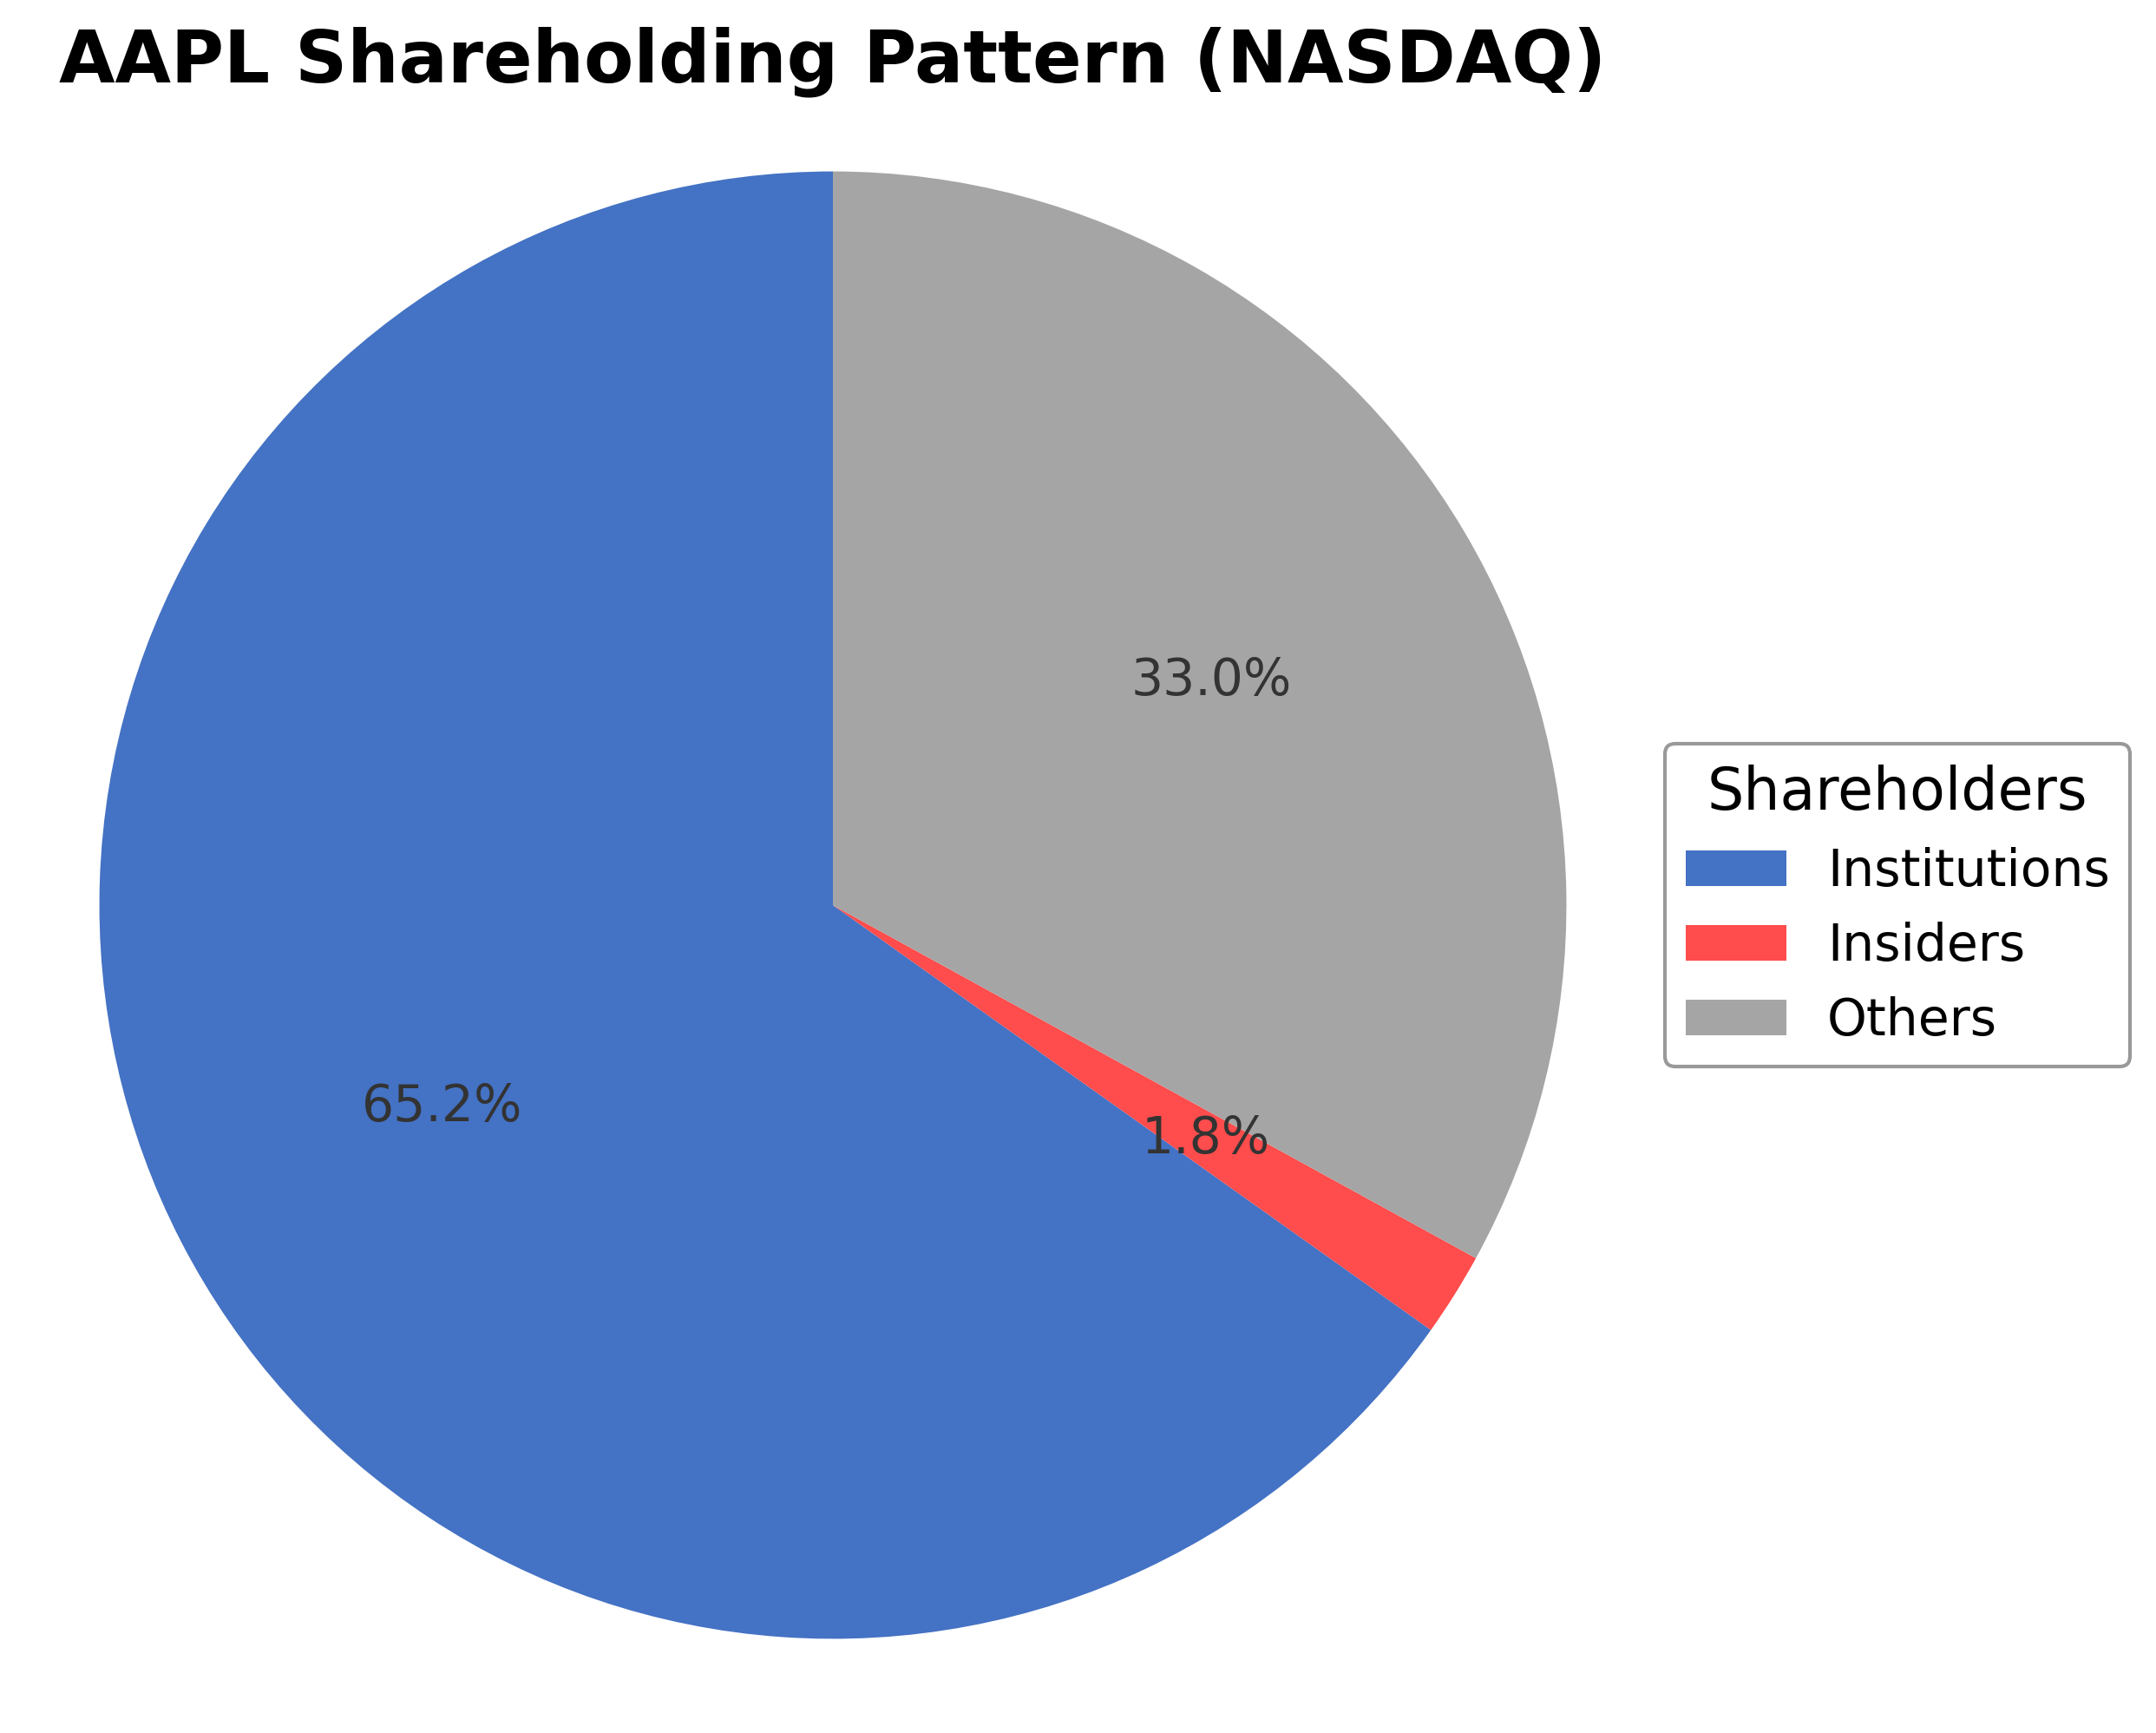
Apple Inc.'s ownership structure features approximately 1.84% held by insiders, 65.17% by institutional investors, and 34.81% by other shareholders including retail investors and employee stock plans. Over the past 12-24 months, institutional ownership has remained robust, with notable funds maintaining or slightly adjusting their stakes. The significant institutional accumulation reflects confidence in Apple's governance and strategic direction. This ownership distribution suggests a stable governance framework with strong institutional oversight, which may influence future corporate actions and strategic initiatives within the competitive consumer electronics industry.
Sector and Industry Analysis
Apple Inc. (AAPL) operates primarily within the Technology sector, specifically in the Consumer Electronics and Software industry. The global technology sector is one of the largest and fastest-growing sectors worldwide, with market capitalization in the trillions of dollars and sustained double-digit growth driven by innovation and digital transformation. Key players alongside Apple include Microsoft, Samsung, Alphabet, and Amazon, each commanding significant market share across hardware, software, and services. The sector’s growth trajectory is fueled by expanding adoption of smart devices, cloud computing, artificial intelligence, and the increasing integration of technology into daily life and enterprise operations.
Within the consumer electronics and software industry, the landscape is characterized by rapid technological shifts and evolving consumer preferences. Apple’s ecosystem strategy—anchored by flagship products like the iPhone, complemented by Mac, iPad, Apple Watch, and services such as streaming and subscription bundles—reflects broader industry trends toward device interconnectivity and recurring revenue models. Emerging opportunities include augmented reality (AR), wearables, health technology, and services expansion, which are reshaping product portfolios and revenue streams. Consumer behavior increasingly favors seamless, integrated experiences and privacy-centric solutions, pushing companies to innovate on both hardware and software fronts.
The regulatory environment for Apple and its peers is complex and multifaceted, spanning data privacy laws (e.g., GDPR in Europe, CCPA in California), antitrust scrutiny, intellectual property protections, and trade policies affecting global supply chains. Compliance with these regulations is critical, as governments intensify oversight on large technology firms regarding market dominance, data security, and consumer rights. Additionally, semiconductor supply chain regulations and export controls, especially involving key partners like TSMC and Foxconn, influence operational risk and strategic planning. Policy shifts toward digital taxation and environmental sustainability also impact cost structures and corporate governance.
Competitive dynamics in the consumer electronics and software industry are intense, with high barriers to entry due to the need for substantial R&D investment, brand equity, and global distribution networks. Apple’s competitive positioning is strengthened by its vertically integrated model—designing proprietary hardware, software, and silicon chips—enabling tight ecosystem control and differentiation. The market structure is oligopolistic, dominated by a few large firms with significant economies of scale and network effects. Innovation cycles, intellectual property portfolios, and customer loyalty are critical competitive levers, while partnerships and supply chain management remain key to maintaining market leadership in a rapidly evolving landscape.
Note: Analysis synthesized from industry research, market reports, and regulatory filings. Information is subject to change based on market conditions.
Illustrative Scenario Analysis
DCF Assumptions:
Method: Two-Stage EPS-Priority Model
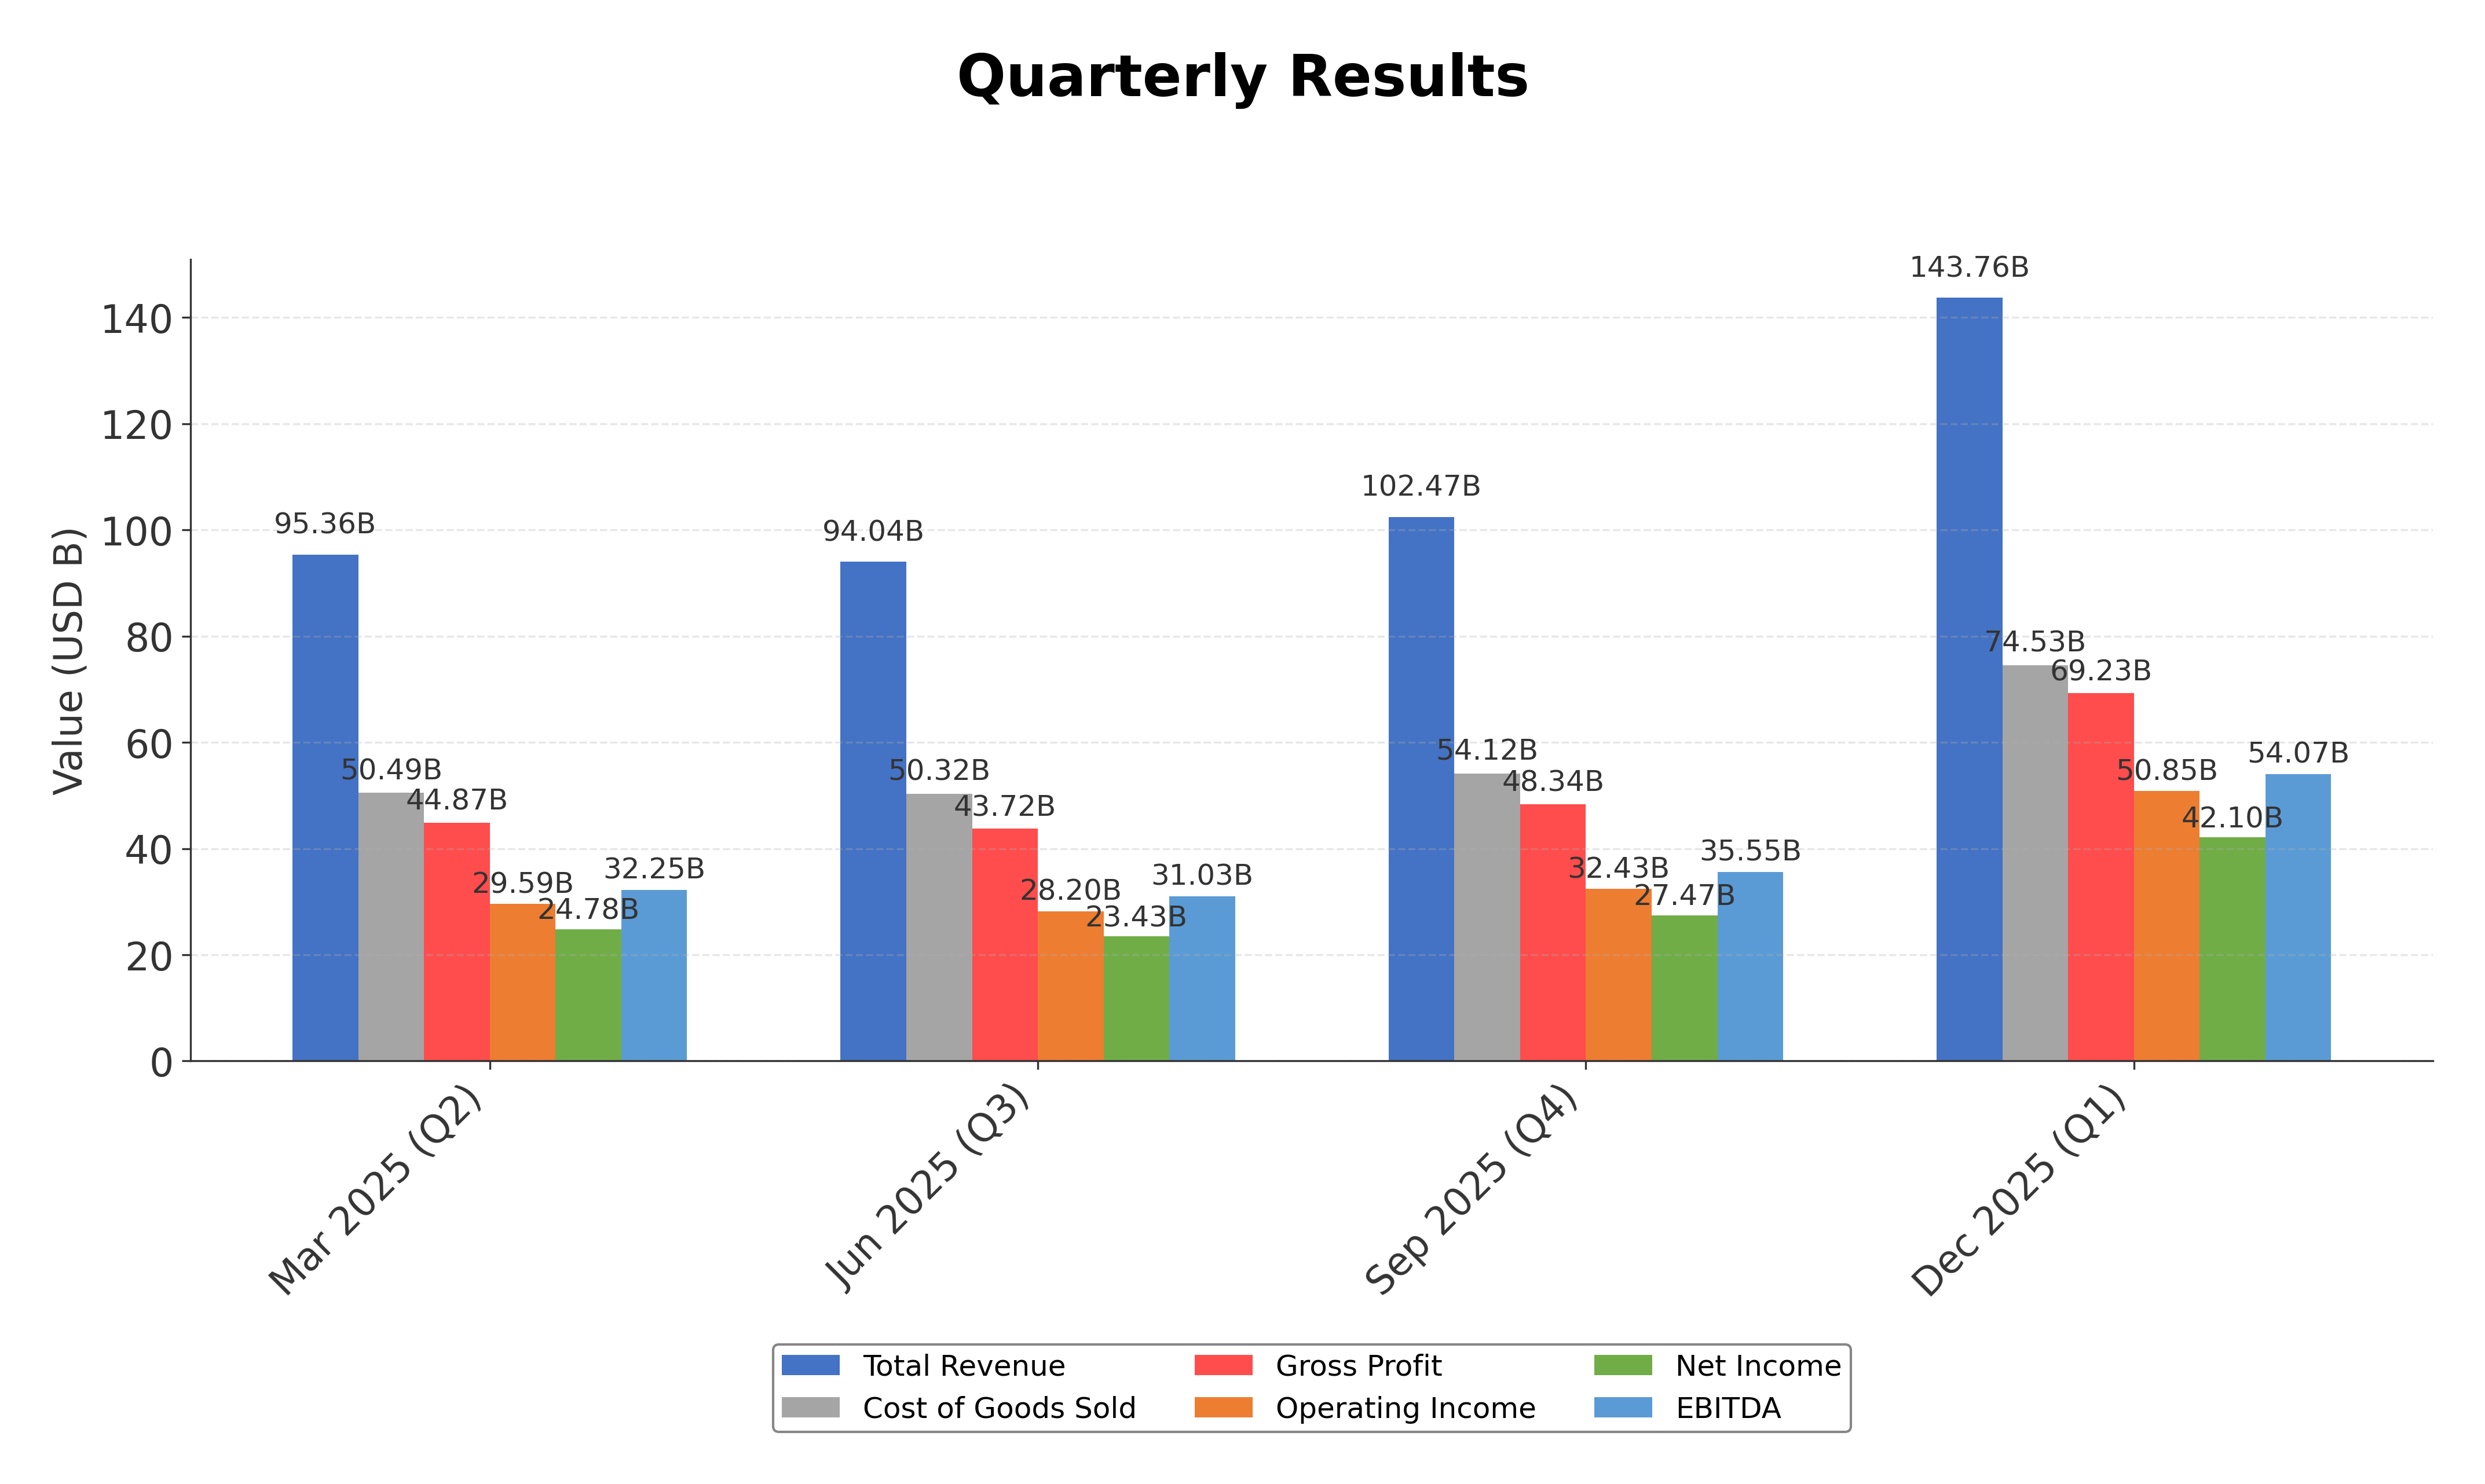
Financials
Peer Analysis
| Company Name | Market Cap | P/E Ratio | P/B Ratio | EV/EBITDA | Price to CFO |
|---|---|---|---|---|---|
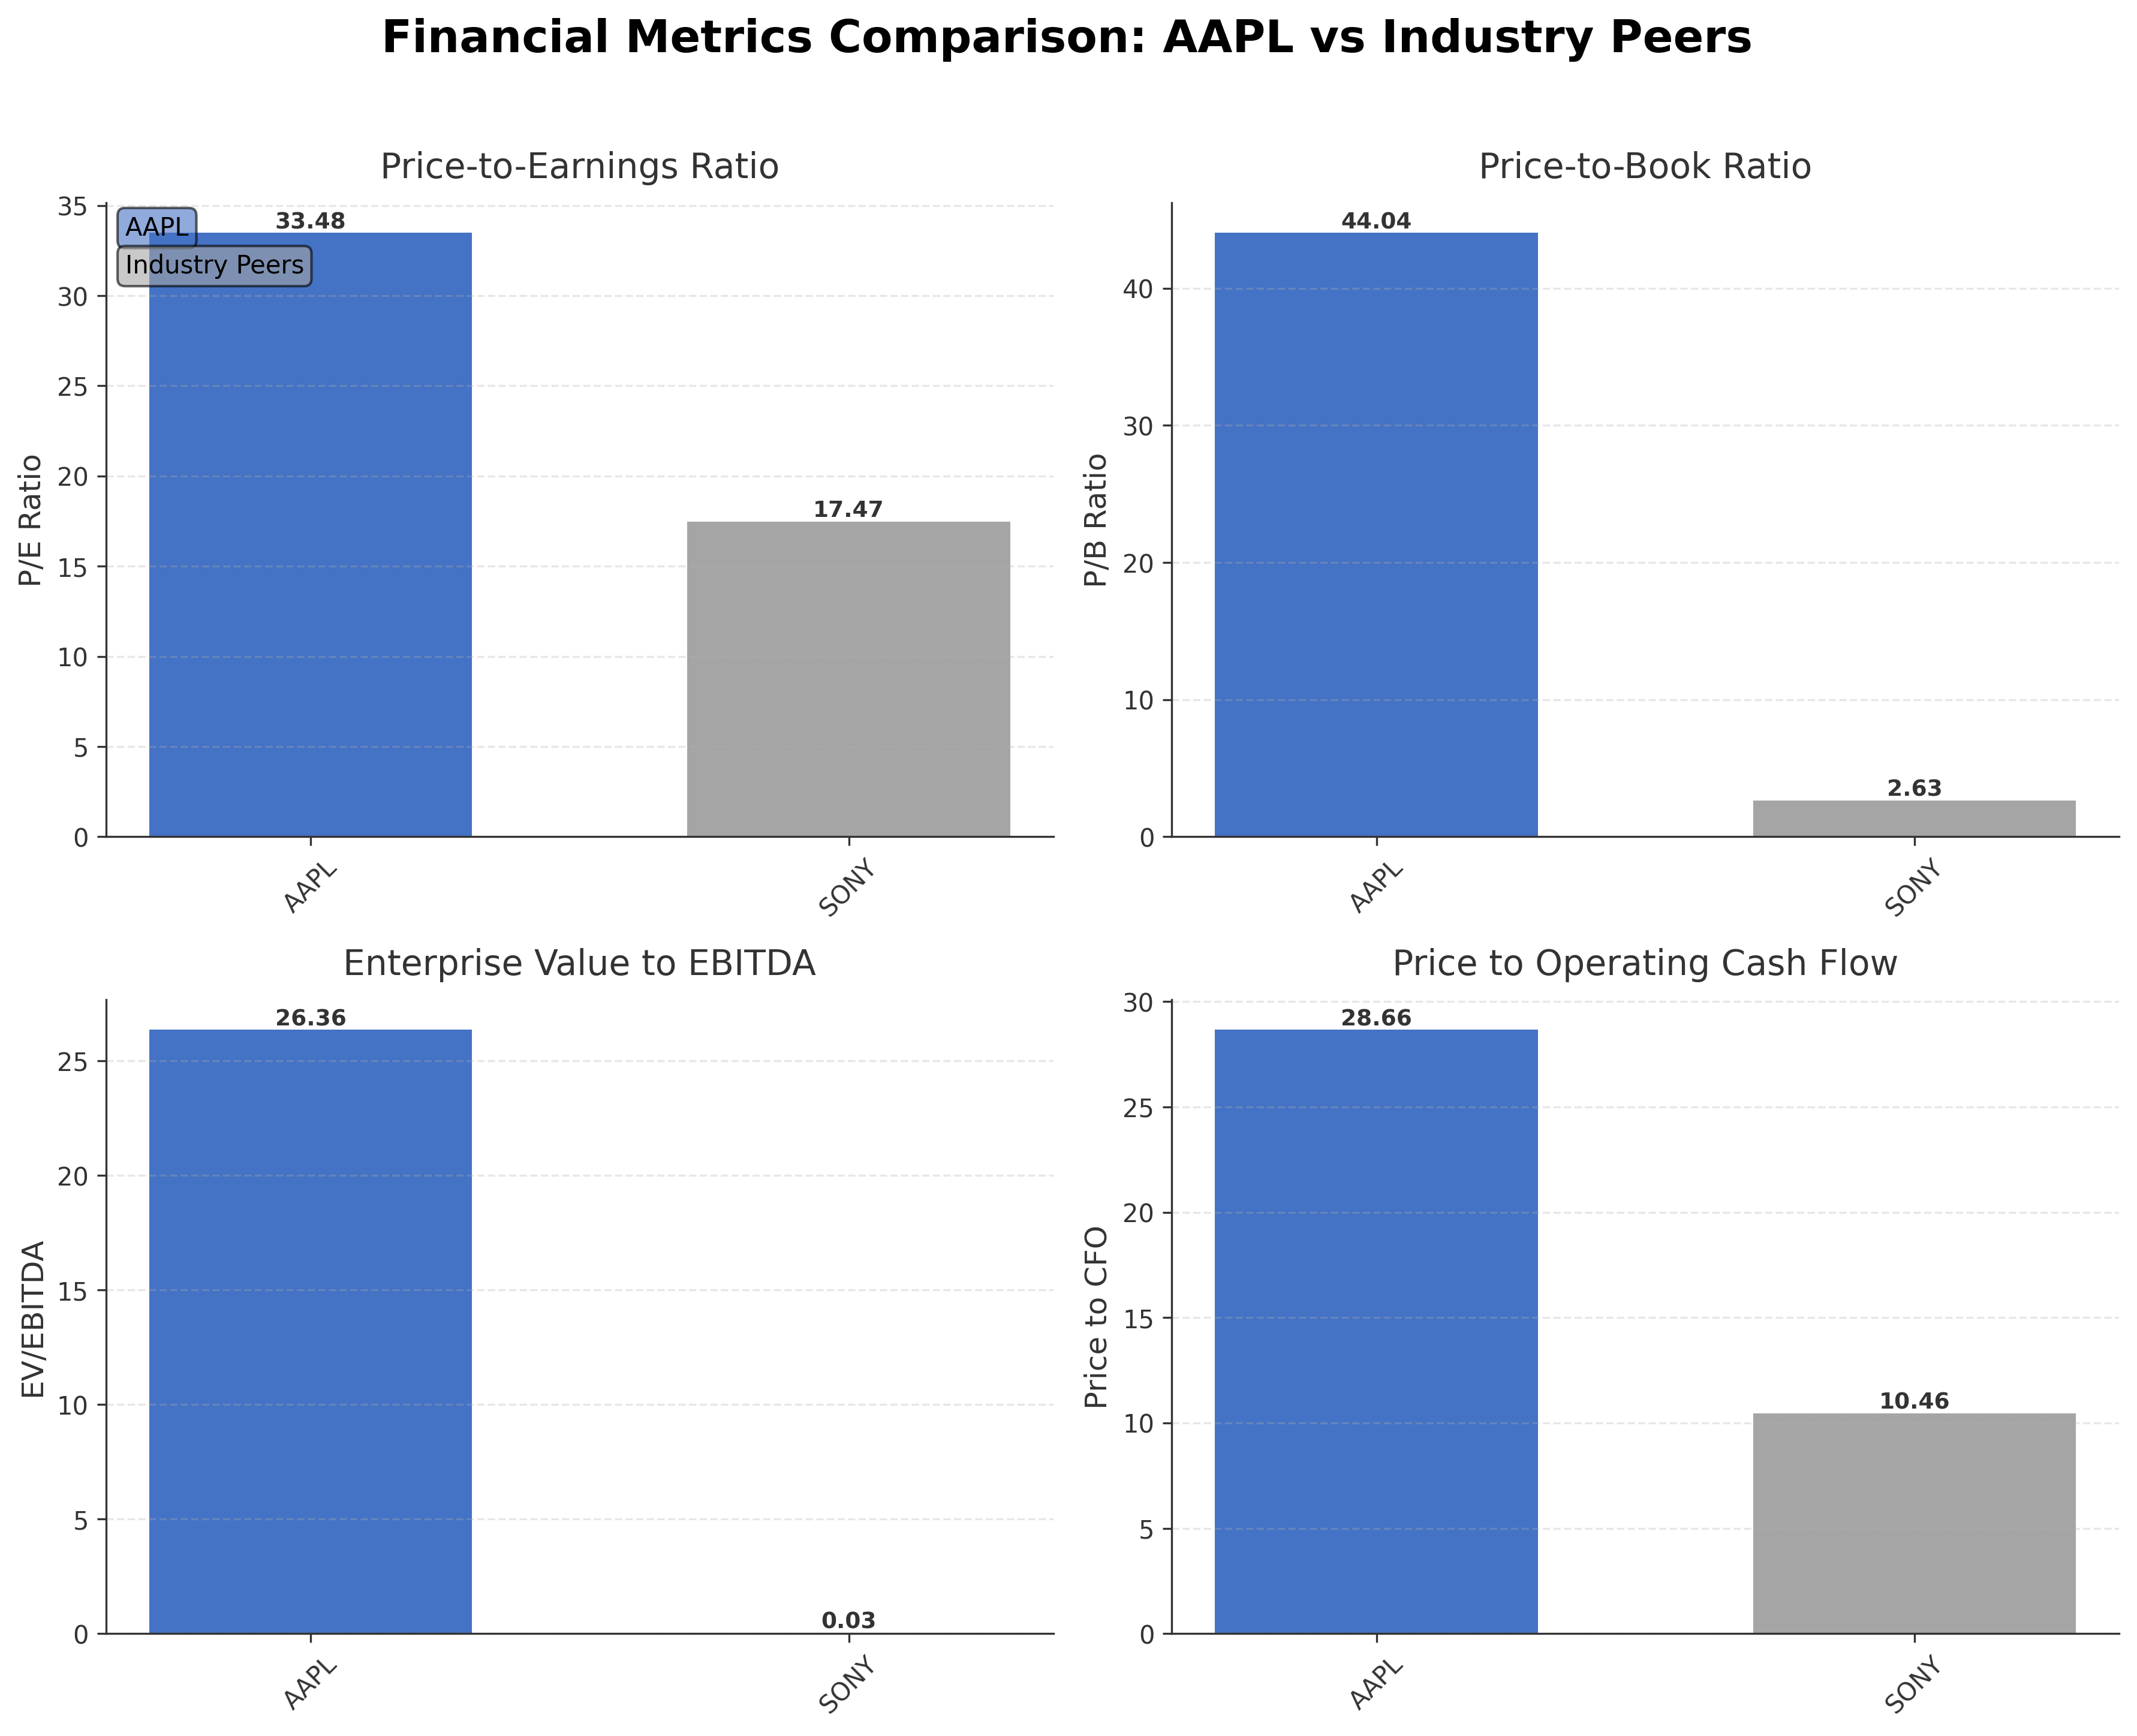
| Apple Inc. | $3.88T | 33.48 | 44.04 | 26.36 | 28.66 |
| Sony Group Corporation - Sponsored American Depositary Receipt | $137.51B | 17.47 | 2.63 | 0.03 | 10.46 |
Comparison Analysis: Apple Inc. significantly outpaces its regional industry peer Sony Group Corporation in market capitalization and valuation metrics, reflecting its dominant market position and premium brand status. Apple’s P/E ratio of 33.48 and price-to-book ratio of 44.04 are substantially higher than Sony’s 17.47 and 2.63 respectively, indicating a market premium based on growth expectations and profitability. Return on equity for Apple at 1.52% also exceeds Sony’s 0.15%, highlighting superior capital efficiency. However, Apple’s elevated EV/EBITDA and price-to-CFO ratios suggest a higher valuation multiple relative to cash flow and earnings, which may warrant close observation.
Financial Metrics Comparison with Peers
Financial Statements
Comprehensive financial data including income, balance sheet, and cash flow metrics
Income Statement
| fiscal_date | 2025-09-30 | 2024-09-30 | 2023-09-30 | 2022-09-30 | 2021-09-30 |
|---|---|---|---|---|---|
| Sales | 416.16B | 391.04B | 383.29B | 394.33B | 365.82B |
| Cost Of Goods | 220.96B | 210.35B | 214.14B | 223.55B | 212.98B |
| Gross Profit | 195.20B | 180.68B | 169.15B | 170.78B | 152.84B |
| Operating Expense Research And Development | 34.55B | 31.37B | 29.91B | 26.25B | 21.91B |
| Operating Expense Selling General And Administrative | 27.60B | 26.10B | 24.93B | 25.09B | 21.97B |
| Operating Income | 133.05B | 123.22B | 114.30B | 119.44B | 108.95B |
| Other Income Expense | -321.00M | 269.00M | -565.00M | -334.00M | 60.00M |
| Pretax Income | 132.73B | 123.48B | 113.74B | 119.10B | 109.21B |
| Income Tax | 20.72B | 29.75B | 16.74B | 19.30B | 14.53B |
| Net Income | 112.01B | 93.74B | 97.00B | 99.80B | 94.68B |
| Eps Basic | 7.49 | 6.11 | 6.16 | 6.15 | 5.67 |
| Eps Diluted | 7.46 | 6.08 | 6.13 | 6.11 | 5.61 |
| Basic Shares Outstanding | 14.95B | 15.34B | 15.74B | 16.22B | 16.70B |
| Diluted Shares Outstanding | 14.95B | 15.34B | 15.74B | 16.22B | 16.70B |
| Ebit | 133.05B | 123.22B | 114.30B | 119.44B | 111.85B |
| Ebitda | 144.75B | 134.66B | 125.82B | 130.54B | 123.14B |
| Net Income Continuous Operations | 112.01B | 93.74B | 97.00B | 99.80B | 94.68B |
| Non Operating Interest Income | N/A | N/A | 3.75B | 2.83B | 2.84B |
| Non Operating Interest Expense | N/A | N/A | 3.93B | 2.93B | 2.65B |
Source: Financial statements and regulatory filings
Balance Sheet
| fiscal_date | 2025-09-30 | 2024-09-30 | 2023-09-30 | 2022-09-30 | 2021-09-30 |
|---|---|---|---|---|---|
| Cash And Cash Equivalents | 35.93B | 29.94B | 29.96B | 23.65B | 34.94B |
| Accounts Receivable | 39.78B | 33.41B | 29.51B | 28.18B | 26.28B |
| Total Assets | 359.24B | 364.98B | 352.58B | 352.75B | 351.00B |
| Total Liabilities | 285.51B | 308.03B | 290.44B | 302.08B | 287.91B |
| Long Term Debt | 78.33B | 85.75B | 95.28B | 109.71B | 119.38B |
| Shareholders Equity | 73.73B | 56.95B | 62.15B | 50.67B | 63.09B |
Source: Financial statements and regulatory filings
Cash Flow Statement
| fiscal_date | 2025-09-30 | 2024-09-30 | 2023-09-30 | 2022-09-30 | 2021-09-30 |
|---|---|---|---|---|---|
| Operating Activities Net Income | 112.01B | 93.74B | 97.00B | 99.80B | 94.68B |
| Operating Activities Depreciation | 11.70B | 11.45B | 11.52B | 11.10B | 11.28B |
| Operating Activities Stock Based Compensation | 12.86B | 11.69B | 10.83B | 9.04B | 7.91B |
| Operating Activities Other Non Cash Items | -89.00M | -2.27B | -2.23B | 1.01B | -4.92B |
| Operating Activities Accounts Receivable | -7.03B | -5.14B | -417.00M | -9.34B | -14.03B |
| Operating Activities Accounts Payable | 902.00M | 6.02B | -1.89B | 9.45B | 12.33B |
| Operating Activities Other Assets Liabilities | -18.87B | 2.77B | -4.27B | 1.57B | -1.53B |
| Operating Activities Operating Cash Flow | 111.48B | 118.25B | 110.54B | 123.52B | 100.94B |
| Investing Activities Capital Expenditures | -12.71B | -9.45B | -10.96B | -10.71B | -11.09B |
| Investing Activities Purchase Of Investments | -24.41B | -48.66B | -29.51B | -76.92B | -109.56B |
| Investing Activities Sale Of Investments | 53.80B | 62.35B | 45.51B | 67.36B | 106.48B |
| Investing Activities Other Investing Activity | -1.48B | -1.31B | -1.34B | -2.09B | -385.00M |
| Investing Activities Investing Cash Flow | 15.20B | 2.94B | 3.71B | -22.66B | -14.58B |
| Financing Activities Long Term Debt Issuance | 4.48B | 0.00 | 5.23B | 5.46B | 20.39B |
| Financing Activities Long Term Debt Payments | -10.93B | -9.96B | -11.15B | -9.54B | -8.75B |
| Financing Activities Short Term Debt Issuance | -2.03B | 3.96B | -3.98B | 3.96B | 1.02B |
| Financing Activities Common Stock Repurchase | -90.71B | -94.95B | -77.55B | -89.40B | -85.97B |
| Financing Activities Common Dividends | -15.42B | -15.23B | -15.03B | -14.84B | -14.47B |
| Financing Activities Other Financing Charges | -6.07B | -5.80B | -6.01B | -6.38B | -5.58B |
| Financing Activities Financing Cash Flow | -120.69B | -121.98B | -108.49B | -110.75B | -92.25B |
| End Cash Position | 35.93B | 29.94B | 30.74B | 24.98B | 35.93B |
| Income Tax Paid | 43.37B | 26.10B | 18.68B | 19.57B | 25.39B |
| Free Cash Flow | 98.77B | 108.81B | 99.58B | 111.44B | 92.95B |
| Interest Paid | N/A | N/A | 3.80B | 2.87B | 2.69B |
| Operating Activities Deferred Taxes | N/A | N/A | N/A | 895.00M | -4.77B |
| Investing Activities Net Acquisitions | N/A | N/A | N/A | -306.00M | -33.00M |
| Financing Activities Common Stock Issuance | N/A | N/A | N/A | N/A | 1.10B |
Source: Financial statements and regulatory filings
Technical Analysis
Key Insights
- The current trend shows a generally positive price action with the stock trading above the 200-day moving average and near the 50-day moving average, indicating sustained upward momentum.
- Key support levels are identified near $242.65 (200-day MA) and $169.21 (52-week low), while resistance is observed around $288.62 (52-week high) and $265.58 (50-day MA).
- The stock price is positioned above the 200-day moving average and slightly below the 50-day moving average, suggesting a consolidation phase within an overall uptrend.
- Momentum indicators such as RSI, MACD, and Stochastic currently reflect moderate strength without extreme overbought or oversold conditions, indicating balanced momentum.
- Multi-timeframe analysis reveals consistent bullish tendencies on weekly and monthly charts, with daily charts showing short-term consolidation.
- Potential market scenarios include continuation of the uptrend if the price breaks above the 50-day moving average resistance, or a pullback toward the 200-day moving average support in case of broader market weakness.
Trending News
1. Headline: Apple raises MacBook prices across the board as M5 chips, new displays signal AI-first strategy
Summary: Apple rolled out new MacBook Pro and MacBook Air models with M5 chips, plus a revamped Studio Display lineup. The new Macs are more expensive, with MacBook Air prices rising by $100 and the 16-inch M5 Max MacBook Pro starting at $3,899.
Sentiment: negative
2. Headline: Apple Launches Two New Studio Display Models (And Discontinues The Pro) - BGR
Summary: It's by far the world's best pro display," John Ternus, Apple's senior vice president of Hardware Engineering, wrote in the press release. ... The basic 27-inch 5K Studio Display might not look like an enticing upgrade for those with the original Studio Display, which BGR reviewed.
Sentiment: positive
3. Headline: Apple Raises MacBook Air and Pro Prices in Face of Memory Crunch - Bloomberg
Summary: Apple Inc. updated the MacBook Air and MacBook Pro, the company’s two main laptop computer lines, adding faster processors and raising prices as it copes with an industrywide memory crunch.
Sentiment: positive
4. Headline: Apple Inc. $AAPL Shares Sold by SWP Financial LLC
Summary: SWP Financial LLC lowered its stake in shares of Apple Inc. (NASDAQ:AAPL - Free Report) by 5.6% during the 3rd quarter, according to its most recent Form 13F filing with the Securities and Exchange Commission. The firm owned 38,903 shares of the iPhone maker's stock after selling 2,307 shares durin
Sentiment: negative
5. Headline: This iPhone App for Productivity Was Named Apple's Top Pick of the Year. Here's Why It Stands Out
Summary: The iPhone app offers both a free version and a premium one (at $10 per month) and allows for unlimited AI planning, cross-device synchronization (i.e phone, watch and desktop), and comprehensive calendar integration (including both Google and Apple Calendar).
Sentiment: neutral
6. Headline: Apple Launches iPad Air (2026) in India With M4 Chip: Here’s How Much It Costs - Tech
Summary: Apple Inc. has launched the iPad Air (2026) in India and global markets, powered by the new M4 chipset. The tablet debuted alongside the iPhone 17e and is available in 11-inch and 13-inch display variants. It comes in four colour options and offers both Wi-Fi-only and Wi-Fi + Cellular models.
Sentiment: neutral
7. Headline: Apple debuts $599 iPhone 17e, more powerful iPad Airs
Summary: The 17e is Apple's most recent attempt to attract customers looking for a relatively inexpensive iPhone with a starting price of $599 with 256GB of storage. That's $200 less than the base iPhone 17, which costs $799. It's also a step up in memory from last year's iPhone 16e, which also started at $599 but came with just 128GB of storage. A few trade-offs come with the 17e, though. You'll get a smaller 6.1-inch ...
Sentiment: positive
8. Headline: Apple launches lower cost iPhone 17e and a new iPad Air powered by its M4 chip
Summary: That makes it an important product for Apple in the mid-tier smartphone market, where it competes more directly with lower-priced devices from Samsung, Google, and Chinese phone makers, particularly in more price-sensitive markets. The 17e keeps the same 6.1-inch size, but adds tougher glass, ...
Sentiment: positive
9. Headline: Apple Launches $599 iPhone 17e With MagSafe Charging, M4 Chip iPad Air - Bloomberg
Summary: Apple Inc. unveiled the iPhone 17e, the latest version of its lower-end smartphone, and a faster version of the iPad Air, kicking off a wave of new products.
Sentiment: neutral
10. Headline: Apple Touch-Screen MacBook Pro Fall 2026 Details; Cheap MacBook Launch; Core AI - Bloomberg
Summary: Apple’s upcoming touch-screen MacBook Pro will show the company is still far from combining the Mac and iPad. Also: Apple is preparing its retail stores for significant interest in this coming week’s new products, and it’s readying a new artificial intelligence framework for developers.
Sentiment: neutral
Recent Updates
News Summary
Recent news highlights Apple’s continued innovation and market expansion through new product launches such as the budget-friendly iPhone 17e and MacBook Neo, signaling strategic moves to capture diverse consumer segments. Industry commentary reflects stable sentiment with maintained outperform ratings and recognition of Apple’s historical innovation leadership. The company’s pricing adjustments in response to supply constraints and memory shortages underscore ongoing operational challenges. These developments collectively impact Apple's revenue streams, competitive positioning, and market perception, aligning with broader technology sector trends emphasizing AI integration and affordability.
News Sentiment
Sentiment across recent updates ranges from positive to neutral, with constructive coverage on product launches and strategic initiatives balanced by cautious observations on pricing and supply chain challenges. The overall tone suggests measured optimism regarding Apple's growth prospects amid evolving market conditions.
Analytical Overview
Analysis Summary
Valuation Metrics: Apple's trailing P/E ratio of 33.48 and forward P/E of 28.41 are slightly above the consumer electronics industry average of 33.48, reflecting a premium valuation consistent with its market leadership and growth expectations.
Growth Trajectory: The company demonstrates a solid growth trajectory with quarterly revenue growth of 15.7% and quarterly earnings growth year-over-year of 15.9%, supported by strong operating and free cash flow generation.
Financial Health: Apple maintains a robust financial position with operating cash flow of $135.5 billion TTM and levered free cash flow of $106.3 billion TTM, though its total debt-to-equity ratio of 102.63 indicates a leveraged capital structure requiring monitoring.
Sector Specific Factors: The consumer electronics sector faces challenges such as supply chain constraints and pricing pressures, while opportunities arise from AI integration and expanding digital services, areas where Apple is actively investing.
Market Positioning: Apple's strong brand, extensive ecosystem, and innovation capabilities provide competitive advantages, supporting its ability to navigate market dynamics and capitalize on emerging technology trends.
Investment Conclusion
Supporting Factors: No data
Risk Factors: No data
SWOT Analysis
Strengths
- Market leadership with a strong global brand and loyal customer base.
- Robust revenue growth and high profitability margins.
- Diverse product ecosystem integrating hardware, software, and services.
- Strong cash flow generation supporting investment and shareholder returns.
Weaknesses
- High price-to-book ratio indicating premium valuation.
- Leverage reflected in a debt-to-equity ratio exceeding 100%.
- Dependence on flagship products like the iPhone for majority of revenues.
- Current ratio below 1, suggesting tight short-term liquidity.
Opportunities
- Expansion into AI-driven products and services.
- Growth potential in emerging markets with affordable product lines.
- Increasing demand for subscription-based digital services.
- Innovation in wearables and health technology sectors.
Threats
- Supply chain disruptions and memory shortages affecting production.
- Intense competition from global consumer electronics manufacturers.
- Regulatory scrutiny and geopolitical tensions impacting operations.
- Market sensitivity to premium pricing amid economic uncertainties.
Company Description
Apple Inc. is a leading technology company renowned for designing, manufacturing, and marketing innovative hardware and software products for consumers and businesses worldwide. Its flagship product, the iPhone, accounts for the majority of sales, serving as the central hub of an expansive ecosystem that includes Mac computers, iPad tablets, Apple Watch wearables, and accessories like AirPods. Apple Inc. also offers a suite of services such as the App Store, Apple Music, iCloud, Apple TV+, and Apple Fitness+, providing digital content, cloud storage, and subscription-based platforms. Operating in the consumer electronics industry within the technology sector, the company employs approximately 166,000 people and maintains a broad global presence through online stores, retail outlets, and partnerships with carriers and resellers. With a substantial market capitalization reflecting its scale, Apple Inc. plays a pivotal role in shaping consumer technology trends, emphasizing seamless integration across devices and services to enhance user experience and productivity.