
Apple Inc (AAPL)
Stock Analysis Report
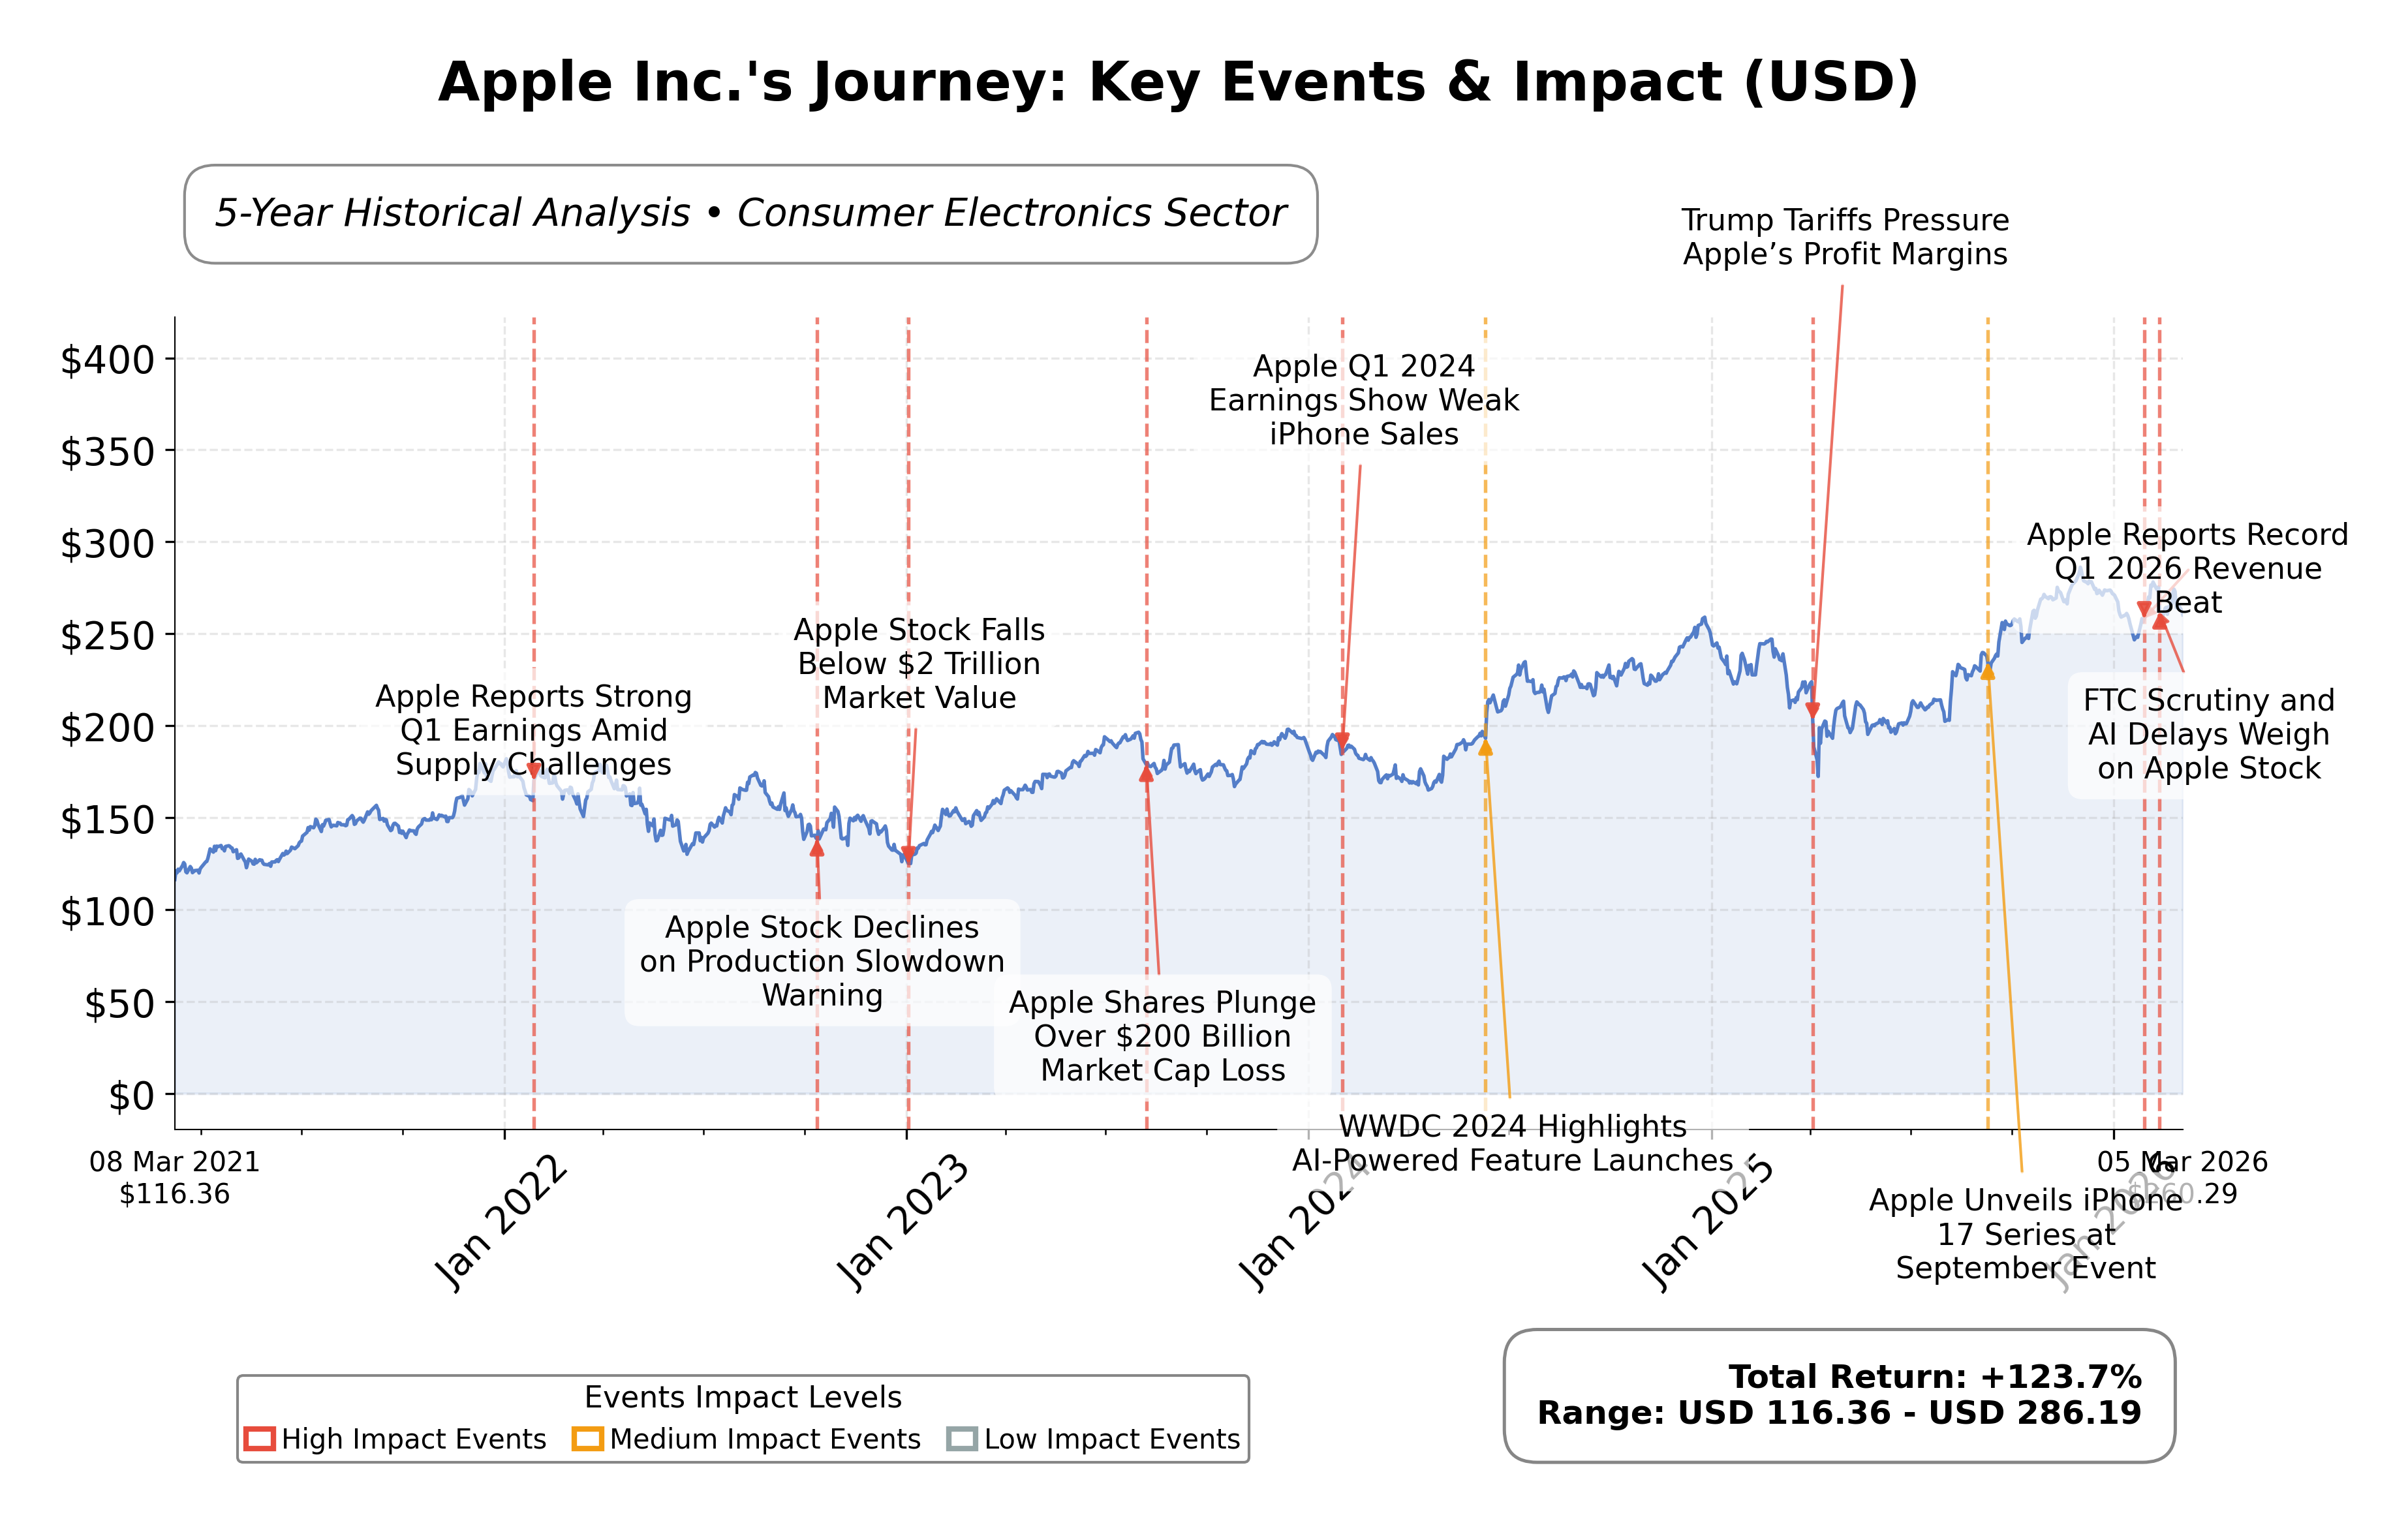
Stock Journey
Key Positives and Key Risks
Pros
- Market capitalization of $3.88 trillion underscores dominant industry position and scale.
- Quarterly revenue growth of 15.7% and quarterly earnings growth year-over-year of 15.9% indicate strong growth momentum.
- Operating cash flow of $135.5 billion and free cash flow of $106.3 billion reflect robust cash generation supporting strategic initiatives.
Cons
- Trailing P/E ratio of 33.48 and price-to-book ratio of 44.04 suggest a premium valuation that may limit upside potential.
- Total debt to equity ratio of 102.63% indicates moderate leverage that could impact financial flexibility.
- Current ratio of 0.974 points to tight short-term liquidity, which may pose operational risks under stress.
Disclosure: This information is for general awareness and does not constitute investment advice
Report Summary
Apple Inc. operates as a leading technology company specializing in the design, manufacturing, and marketing of consumer electronics and software products globally. Its core offerings include the iPhone, Mac computers, iPads, wearables like the Apple Watch, and a broad range of digital services such as the App Store, Apple Music, and iCloud. Positioned prominently in the consumer electronics industry within the technology sector, Apple leverages its integrated ecosystem to maintain a strong market presence and brand loyalty.
Financially, Apple exhibits robust performance with a market capitalization of approximately $3.88 trillion and a trailing P/E ratio of 33.48, slightly above the industry average. The company reported a trailing twelve-month revenue of $435.6 billion and net income of $117.8 billion, reflecting solid profitability with a profit margin of 27%. Its forward P/E ratio of 28.41 and PEG ratio near 1.83 indicate valuation metrics consistent with growth expectations. Apple maintains strong cash flows, with operating cash flow at $135.5 billion and free cash flow exceeding $106 billion, alongside a modest dividend yield of 0.39%.
From a strategic perspective, Apple recently introduced new product lines including the lower-cost iPhone 17e and the MacBook Neo, signaling efforts to expand market share in mid-tier and budget segments. Technical indicators show the stock trading above its 200-day moving average, with momentum oscillators suggesting a cautiously positive trend. Institutional ownership remains significant at approximately 65%, while insider holdings are minimal. Key risks include pricing pressures from recent MacBook price hikes and industry-wide supply constraints, balanced by strengths such as brand equity, innovation, and a diversified product portfolio.
In comparison to its regional peers within the consumer electronics industry, Appleâs market capitalization and valuation multiples notably exceed those of competitors like Sony Group Corporation. While Appleâs P/E and price-to-book ratios are substantially higher, reflecting premium market positioning, its return on equity and cash flow metrics also underscore operational efficiency. This contrast highlights Appleâs dominant scale and profitability relative to its peers in the United States technology sector.
Apple stands at a pivotal juncture as it navigates competitive pressures and evolving consumer preferences in the global technology landscape. Recent product launches and strategic pricing adjustments demonstrate a focus on sustaining growth and market relevance amid challenges such as supply chain constraints and pricing sensitivity. The companyâs ability to leverage its ecosystem and innovation pipeline will be critical in shaping future performance. Given the current financial and market data, a balanced approach that monitors ongoing developments and valuation dynamics may be most appropriate for those assessing the stockâs potential.
Company and Industry Overview
Company Basics
Price Performance
Company Size
Shareholding Pattern
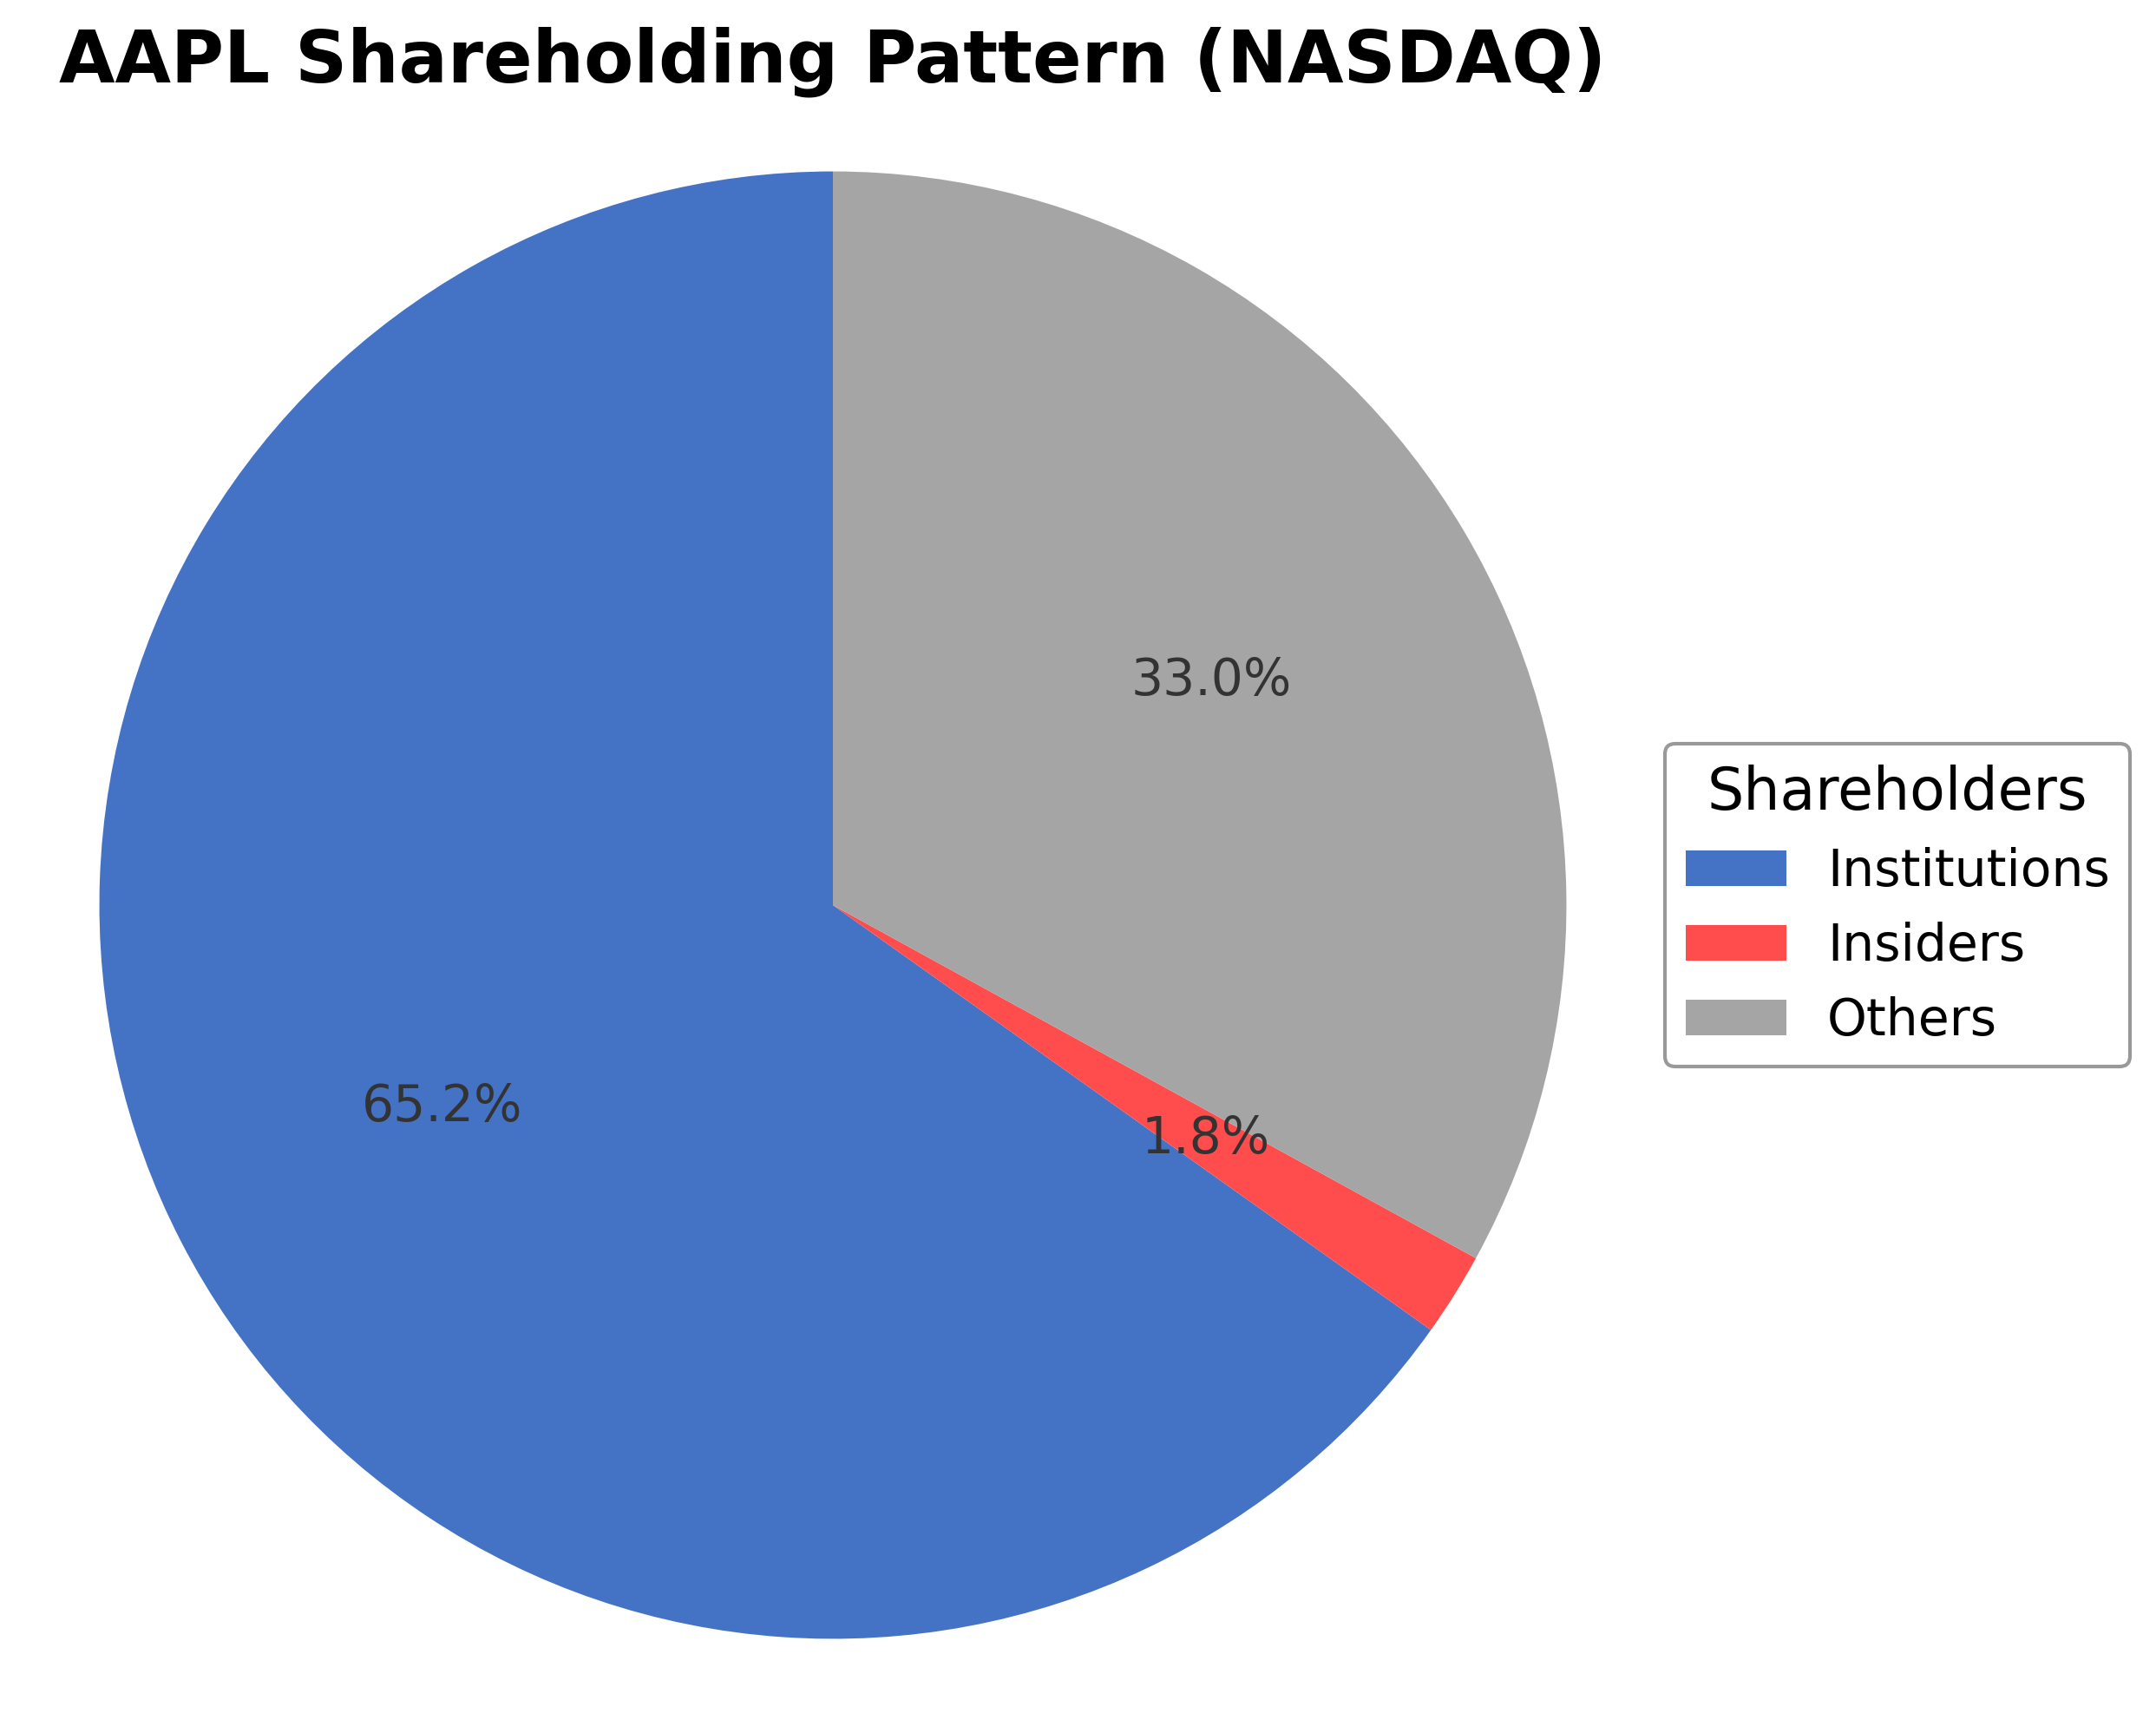
Apple Inc.'s ownership structure is characterized by a predominant institutional investor presence at 65.17%, with insiders holding a minimal 1.84% stake, and the remainder held by public shareholders at approximately 34.83%. Over the past 12-24 months, institutional ownership has remained relatively stable, with no significant shifts reported among major funds. This ownership distribution reflects strong institutional confidence and suggests governance aligned with shareholder interests. The company's position within the consumer electronics industry is reinforced by its substantial market capitalization and global footprint, with strategic emphasis on innovation and integrated product ecosystems.
Sector and Industry Analysis
Apple Inc. (AAPL) operates primarily within the Technology sector, specifically in the Hardware industry, which encompasses consumer electronics, computing devices, and related software ecosystems. The global hardware market is substantial, driven by continuous innovation in smartphones, personal computing, wearables, and ancillary devices. Apple is a dominant player, with its iPhone product line constituting the majority of its revenue, complemented by Mac, iPad, Apple Watch, and a growing portfolio of services such as streaming, subscription bundles, and augmented reality applications. The sector exhibits steady growth, propelled by rising consumer demand for integrated hardware-software solutions and expanding digital ecosystems.
Industry trends highlight a pronounced shift towards seamless integration of hardware and proprietary software, with Apple exemplifying this through its in-house chip design (e.g., M-series processors) and tightly controlled operating systems. Consumer behavior increasingly favors ecosystem lock-in, where devices and services interoperate to enhance user experience and retention. Emerging opportunities include augmented reality (AR), health and fitness technologies, and subscription-based services, which offer recurring revenue streams beyond traditional hardware sales. Additionally, supply chain partnerships with key manufacturers like Foxconn and TSMC underscore the importance of global manufacturing networks and semiconductor innovation in maintaining competitive advantage.
The regulatory landscape for the hardware and technology sectors is complex and evolving, encompassing data privacy laws, antitrust scrutiny, and international trade policies. Apple faces compliance requirements related to user data protection (e.g., GDPR in Europe, CCPA in California), product safety standards, and increasingly, regulatory attention on app store policies and market dominance. Trade tensions and tariffs, particularly between the U.S. and China, also impact supply chain costs and operational flexibility. Companies must navigate these frameworks while balancing innovation and market expansion, with regulatory developments potentially influencing competitive dynamics and profitability.
Competitive dynamics in the hardware industry are characterized by high barriers to entry due to significant capital investment requirements, advanced R&D capabilities, and established brand loyalty. Apple’s competitive positioning is strengthened by its vertically integrated business model, combining proprietary hardware design, software development, and a robust services ecosystem. The market structure is oligopolistic, with a few large incumbents such as Samsung, Microsoft, and Google competing across overlapping product categories. Distribution channels vary, with Apple leveraging both direct retail through flagship stores and indirect partnerships, enhancing market reach. Sustained innovation, intellectual property protection, and ecosystem development remain critical to maintaining market share in this highly competitive environment.
Note: Analysis synthesized from industry research, market reports, and regulatory filings. Information is subject to change based on market conditions.
Illustrative Scenario Analysis
DCF Assumptions:
Method: Two-Stage EPS-Priority Model
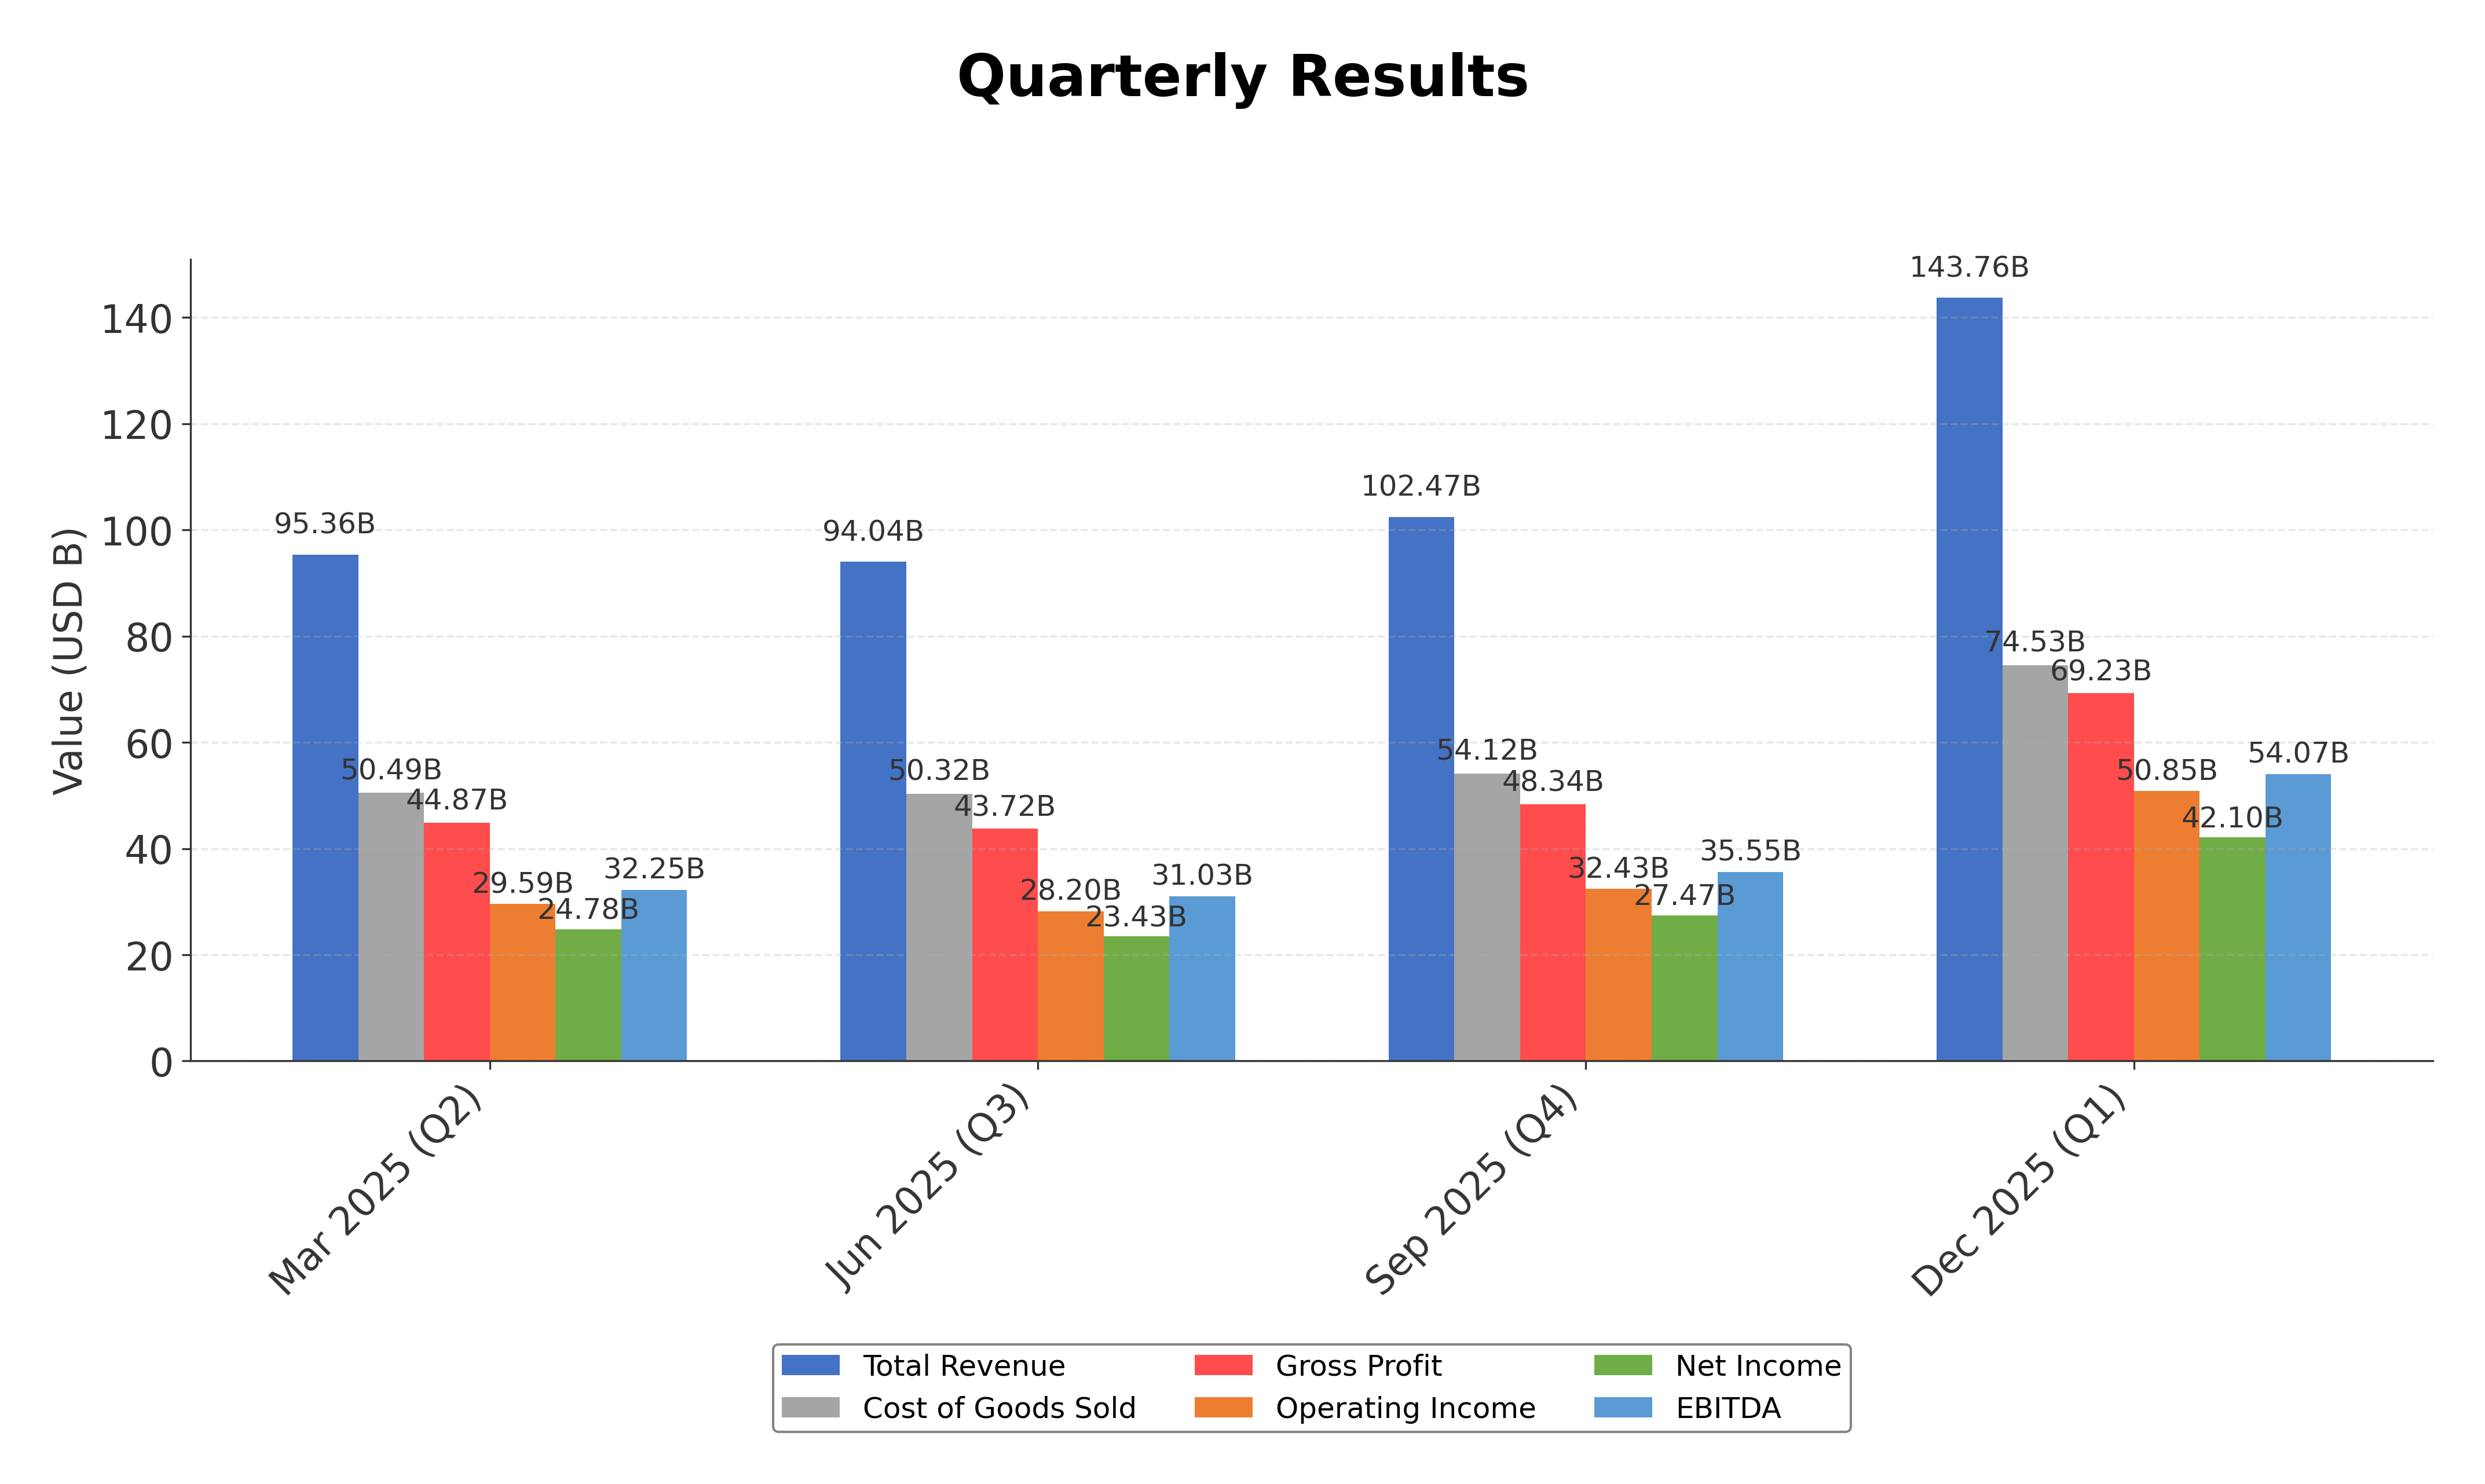
Financials
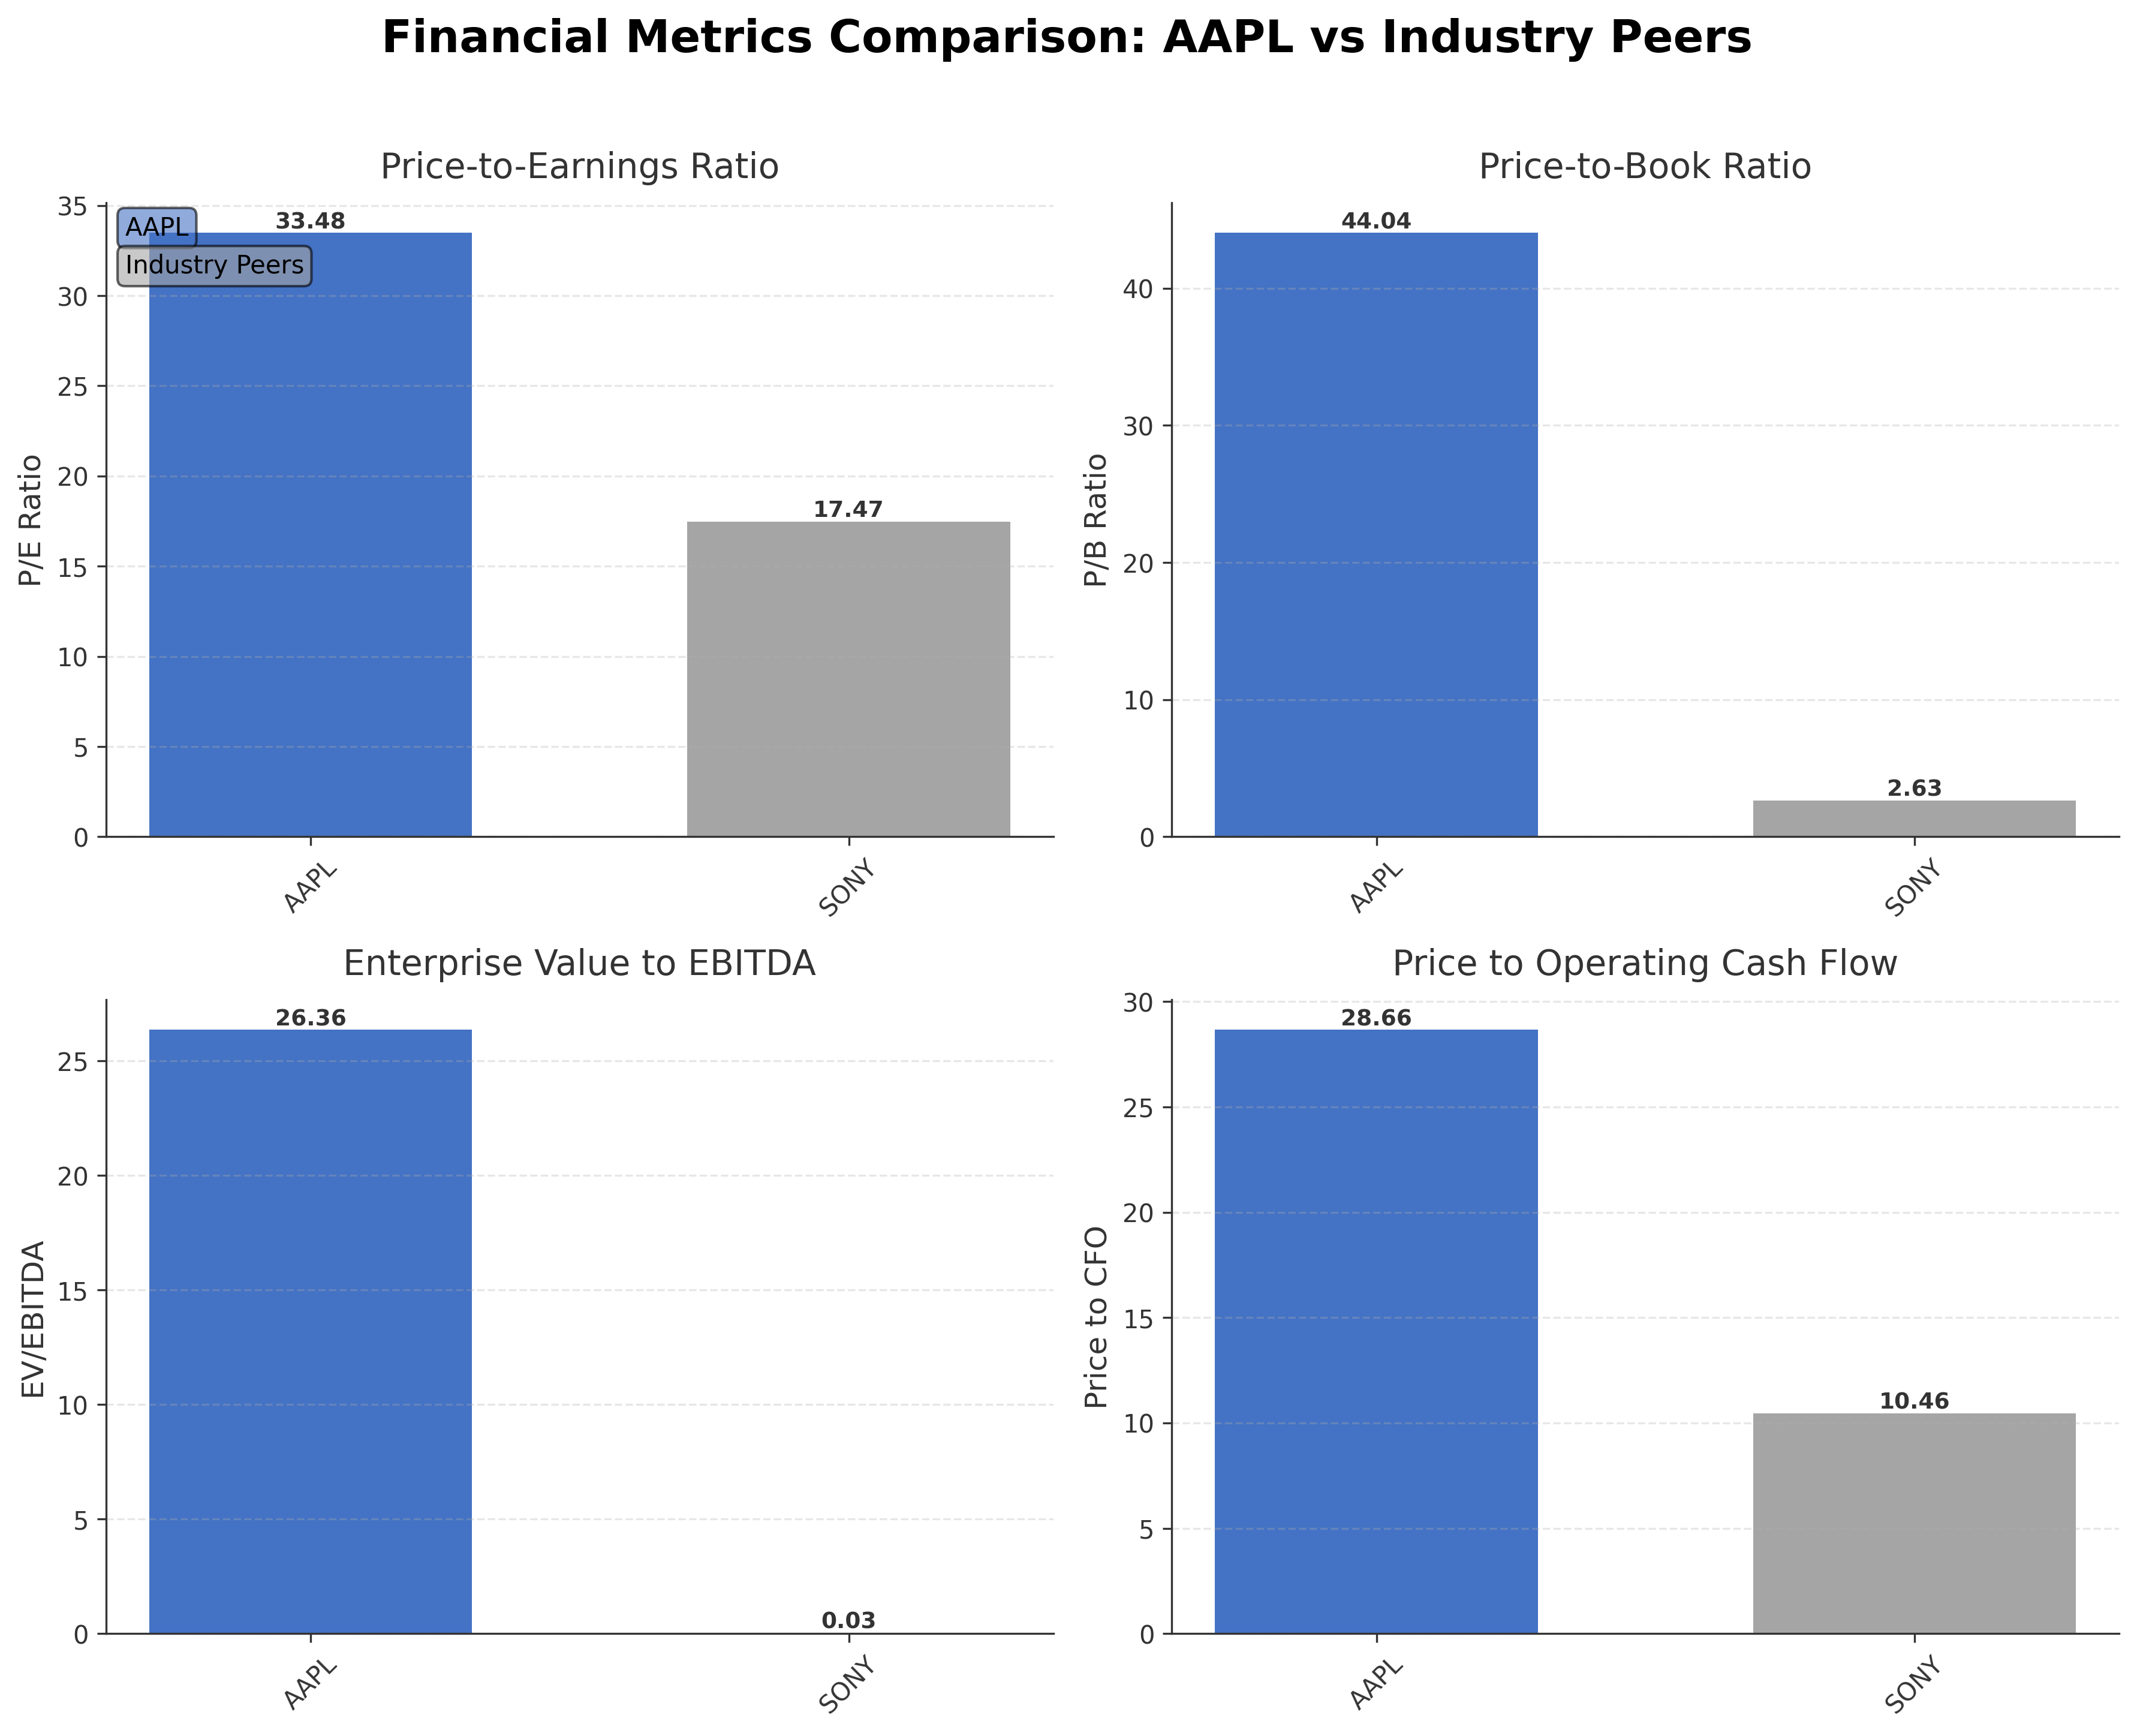
Peer Analysis
| Company Name | Market Cap | P/E Ratio | P/B Ratio | EV/EBITDA | Price to CFO |
|---|---|---|---|---|---|
| Apple Inc. | $3.88T | 33.48 | 44.04 | 26.36 | 28.66 |
| Sony Group Corporation - Sponsored American Depositary Receipt | $137.51B | 17.47 | 2.63 | 0.03 | 10.46 |
Comparison Analysis: Apple Inc. significantly outpaces its regional peer Sony Group Corporation in market capitalization and valuation multiples, reflecting its dominant scale and premium market positioning within the consumer electronics industry. Apple's P/E ratio of 33.48 and price-to-book ratio of 44.04 are substantially higher than Sony's 17.47 and 2.63 respectively, indicating a market premium likely driven by stronger profitability and growth prospects. Additionally, Apple's return on equity of 1.52% surpasses Sony's 0.15%, underscoring more efficient capital utilization. The elevated EV/EBITDA and price-to-CFO ratios further highlight Apple's robust operational metrics relative to its peers.
Financial Metrics Comparison with Peers
Financial Statements
Comprehensive financial data including income, balance sheet, and cash flow metrics
Income Statement
| fiscal_date | 2025-09-30 | 2024-09-30 | 2023-09-30 | 2022-09-30 | 2021-09-30 |
|---|---|---|---|---|---|
| Sales | 416.16B | 391.04B | 383.29B | 394.33B | 365.82B |
| Cost Of Goods | 220.96B | 210.35B | 214.14B | 223.55B | 212.98B |
| Gross Profit | 195.20B | 180.68B | 169.15B | 170.78B | 152.84B |
| Operating Expense Research And Development | 34.55B | 31.37B | 29.91B | 26.25B | 21.91B |
| Operating Expense Selling General And Administrative | 27.60B | 26.10B | 24.93B | 25.09B | 21.97B |
| Operating Income | 133.05B | 123.22B | 114.30B | 119.44B | 108.95B |
| Other Income Expense | -321.00M | 269.00M | -565.00M | -334.00M | 60.00M |
| Pretax Income | 132.73B | 123.48B | 113.74B | 119.10B | 109.21B |
| Income Tax | 20.72B | 29.75B | 16.74B | 19.30B | 14.53B |
| Net Income | 112.01B | 93.74B | 97.00B | 99.80B | 94.68B |
| Eps Basic | 7.49 | 6.11 | 6.16 | 6.15 | 5.67 |
| Eps Diluted | 7.46 | 6.08 | 6.13 | 6.11 | 5.61 |
| Basic Shares Outstanding | 14.95B | 15.34B | 15.74B | 16.22B | 16.70B |
| Diluted Shares Outstanding | 14.95B | 15.34B | 15.74B | 16.22B | 16.70B |
| Ebit | 133.05B | 123.22B | 114.30B | 119.44B | 111.85B |
| Ebitda | 144.75B | 134.66B | 125.82B | 130.54B | 123.14B |
| Net Income Continuous Operations | 112.01B | 93.74B | 97.00B | 99.80B | 94.68B |
| Non Operating Interest Income | N/A | N/A | 3.75B | 2.83B | 2.84B |
| Non Operating Interest Expense | N/A | N/A | 3.93B | 2.93B | 2.65B |
Data provided by Twelve Data
Balance Sheet
| fiscal_date | 2025-09-30 | 2024-09-30 | 2023-09-30 | 2022-09-30 | 2021-09-30 |
|---|---|---|---|---|---|
| Cash And Cash Equivalents | 35.93B | 29.94B | 29.96B | 23.65B | 34.94B |
| Accounts Receivable | 39.78B | 33.41B | 29.51B | 28.18B | 26.28B |
| Total Assets | 359.24B | 364.98B | 352.58B | 352.75B | 351.00B |
| Total Liabilities | 285.51B | 308.03B | 290.44B | 302.08B | 287.91B |
| Long Term Debt | 78.33B | 85.75B | 95.28B | 109.71B | 119.38B |
| Shareholders Equity | 73.73B | 56.95B | 62.15B | 50.67B | 63.09B |
Data provided by Twelve Data
Cash Flow Statement
| fiscal_date | 2025-09-30 | 2024-09-30 | 2023-09-30 | 2022-09-30 | 2021-09-30 |
|---|---|---|---|---|---|
| Operating Activities Net Income | 112.01B | 93.74B | 97.00B | 99.80B | 94.68B |
| Operating Activities Depreciation | 11.70B | 11.45B | 11.52B | 11.10B | 11.28B |
| Operating Activities Stock Based Compensation | 12.86B | 11.69B | 10.83B | 9.04B | 7.91B |
| Operating Activities Other Non Cash Items | -89.00M | -2.27B | -2.23B | 1.01B | -4.92B |
| Operating Activities Accounts Receivable | -7.03B | -5.14B | -417.00M | -9.34B | -14.03B |
| Operating Activities Accounts Payable | 902.00M | 6.02B | -1.89B | 9.45B | 12.33B |
| Operating Activities Other Assets Liabilities | -18.87B | 2.77B | -4.27B | 1.57B | -1.53B |
| Operating Activities Operating Cash Flow | 111.48B | 118.25B | 110.54B | 123.52B | 100.94B |
| Investing Activities Capital Expenditures | -12.71B | -9.45B | -10.96B | -10.71B | -11.09B |
| Investing Activities Purchase Of Investments | -24.41B | -48.66B | -29.51B | -76.92B | -109.56B |
| Investing Activities Sale Of Investments | 53.80B | 62.35B | 45.51B | 67.36B | 106.48B |
| Investing Activities Other Investing Activity | -1.48B | -1.31B | -1.34B | -2.09B | -385.00M |
| Investing Activities Investing Cash Flow | 15.20B | 2.94B | 3.71B | -22.66B | -14.58B |
| Financing Activities Long Term Debt Issuance | 4.48B | 0.00 | 5.23B | 5.46B | 20.39B |
| Financing Activities Long Term Debt Payments | -10.93B | -9.96B | -11.15B | -9.54B | -8.75B |
| Financing Activities Short Term Debt Issuance | -2.03B | 3.96B | -3.98B | 3.96B | 1.02B |
| Financing Activities Common Stock Repurchase | -90.71B | -94.95B | -77.55B | -89.40B | -85.97B |
| Financing Activities Common Dividends | -15.42B | -15.23B | -15.03B | -14.84B | -14.47B |
| Financing Activities Other Financing Charges | -6.07B | -5.80B | -6.01B | -6.38B | -5.58B |
| Financing Activities Financing Cash Flow | -120.69B | -121.98B | -108.49B | -110.75B | -92.25B |
| End Cash Position | 35.93B | 29.94B | 30.74B | 24.98B | 35.93B |
| Income Tax Paid | 43.37B | 26.10B | 18.68B | 19.57B | 25.39B |
| Free Cash Flow | 98.77B | 108.81B | 99.58B | 111.44B | 92.95B |
| Interest Paid | N/A | N/A | 3.80B | 2.87B | 2.69B |
| Operating Activities Deferred Taxes | N/A | N/A | N/A | 895.00M | -4.77B |
| Investing Activities Net Acquisitions | N/A | N/A | N/A | -306.00M | -33.00M |
| Financing Activities Common Stock Issuance | N/A | N/A | N/A | N/A | 1.10B |
Data provided by Twelve Data
Technical Analysis
Key Insights
- The current trend shows Apple’s stock trading in an overall upward trajectory, with price action maintaining above the 200-day moving average at $242.65, indicating a long-term bullish bias.
- Key support levels are identified near $242.65 (200-day MA) and $265.58 (50-day MA), while resistance is observed close to the 52-week high of $288.62.
- The stock price is currently above the 10-day, 50-day, and 200-day moving averages, suggesting sustained momentum across short, medium, and long-term timeframes.
- Momentum indicators show the RSI in a neutral to slightly bullish range, MACD lines are above the signal line indicating positive momentum, and the stochastic oscillator reflects moderate upward pressure.
- Multi-timeframe analysis reveals consistent strength on daily and weekly charts, with monthly trends supporting a stable upward movement.
- Potential market scenarios include continuation of the uptrend if support levels hold, while failure to maintain above the 50-day moving average could signal consolidation or short-term correction.
Trending News
1. Headline: Apple unveils lower cost iPhone 17e, hikes MacBook prices | Fox Business
Summary: The 14-inch MacBook Pro with the M5 Max chip starts at $3,599 while the 16-inch version begins at $3,899 – both up $400. The standard M5 MacBook Pro also saw a price hike, rising to $1,699, Bloomberg reported. Apple also unveiled the MacBook Neo on Wednesday, calling it its most affordable ...
Sentiment: positive
2. Headline: Apple Just Made a Power Move to Gain Market Share - AOL
Summary: The iPhone maker just unveiled new models that came with a big surprise.
Sentiment: positive
3. Headline: Apple announces MacBook Neo, its most affordable laptop ever
Summary: The laptop features a 13-inch display, a lightweight metal body that comes in at 2.7 pounds and a colorful finish that gives it a more approachable, consumer-friendly look than the rest of Apple's notebook lineup.
Sentiment: neutral
4. Headline: Apple closes all stores in fast-growing market - TheStreet
Summary: In the first quarter of fiscal 2026, Apple reported net sales of $143.8 billion, up 16% year over year, according to its latest earnings release. The company does not break out UAE-specific revenue and instead includes it within its Europe reportable geographical segment.
Sentiment: positive
5. Headline: Apple Rolls Out $599 MacBook Neo, Threatening Windows PC Market - Bloomberg
Summary: Apple Inc. rolled out the $599 MacBook Neo in its biggest push yet into low-end laptops, aiming to challenge Windows PCs and Chromebooks for budget-minded shoppers.
Sentiment: neutral
6. Headline: Apple, Microsoft, ServiceNow among 10 tech stocks to own amid Iran conflict: Wedbush (AAPL:NASDAQ) | Seeking Alpha
Summary: Wedbush identifies Apple, Microsoft, ServiceNow, Palantir, CrowdStrike, Palo Alto Networks, Check Point Software, Planet Labs, Voyager, and Salesforce as the top tech stocks to own during the geopolitical conflict with Iran. Analysts believe cybersecurity and military-exposed stocks like Palantir and CrowdStrike are well positioned due to increasing ...
Sentiment: positive
7. Headline: Apple raises MacBook prices across the board as M5 chips, new displays signal AI-first strategy
Summary: Apple rolled out new MacBook Pro and MacBook Air models with M5 chips, plus a revamped Studio Display lineup. The new Macs are more expensive, with MacBook Air prices rising by $100 and the 16-inch M5 Max MacBook Pro starting at $3,899.
Sentiment: negative
8. Headline: Apple Raises MacBook Air and Pro Prices in Face of Memory Crunch - Bloomberg
Summary: Apple Inc. updated the MacBook Air and MacBook Pro, the company’s two main laptop computer lines, adding faster processors and raising prices as it copes with an industrywide memory crunch.
Sentiment: positive
9. Headline: Apple debuts $599 iPhone 17e, more powerful iPad Airs
Summary: The 17e is Apple's most recent attempt to attract customers looking for a relatively inexpensive iPhone with a starting price of $599 with 256GB of storage. That's $200 less than the base iPhone 17, which costs $799. It's also a step up in memory from last year's iPhone 16e, which also started at $599 but came with just 128GB of storage. A few trade-offs come with the 17e, though. You'll get a smaller 6.1-inch ...
Sentiment: positive
10. Headline: Apple launches lower cost iPhone 17e and a new iPad Air powered by its M4 chip
Summary: That makes it an important product for Apple in the mid-tier smartphone market, where it competes more directly with lower-priced devices from Samsung, Google, and Chinese phone makers, particularly in more price-sensitive markets. The 17e keeps the same 6.1-inch size, but adds tougher glass, ...
Sentiment: positive
Powered by Brave
Recent Updates
News Summary
Recent news highlights Apple's strategic expansion into more affordable product segments with the launch of the MacBook Neo, a budget-friendly laptop priced at $599. This move complements other product introductions, including the lower-cost iPhone 17e, aimed at capturing a broader consumer base. These developments align with Apple's ongoing efforts to balance premium offerings with accessible devices, potentially increasing market penetration. The company's financial results continue to show strong revenue growth and operational cash flow, supporting its capacity for innovation and market adaptation. These updates reflect a dynamic phase for Apple as it addresses competitive pressures and evolving consumer demands.
News Sentiment
The overall sentiment across recent news is predominantly positive, emphasizing product innovation and market share expansion. Neutral sentiments accompany reports on pricing adjustments and competitive positioning, while negative sentiment is limited and related to pricing pressures. The positive tone is reinforced by coverage of strong earnings and strategic initiatives, suggesting confidence in Apple's growth trajectory and market strategy.
Analytical Overview
Analysis Summary
Apple’s valuation metrics, including a trailing P/E of 33.48 and forward P/E of 28.41, are elevated relative to the consumer electronics industry average of 33.48, reflecting a premium valuation consistent with its market leadership and growth expectations.
The company demonstrates a strong growth trajectory with a quarterly revenue growth rate of 15.7% and a quarterly earnings growth year-over-year of 15.9%, supported by robust cash flow generation with operating cash flow at $135.5 billion and free cash flow exceeding $106 billion.
Financial health indicators show a total debt to equity ratio of 102.63%, indicating moderate leverage, balanced by substantial cash reserves of approximately $66.9 billion and a current ratio near 0.97, reflecting liquidity management.
Sector-specific challenges include pricing pressures from recent product price increases and supply chain constraints, while opportunities arise from expanding product lines into budget segments and strengthening services revenue.
Consider market positioning and competitive advantages, as Apple’s integrated ecosystem and brand strength provide resilience and growth potential amid evolving technology trends.
Investment Conclusion
Supporting Factors: Primary supporting factors include strong revenue and earnings growth, significant cash flow generation, and a dominant market position with a diversified product portfolio.
Risk Factors: Main risk factors to monitor encompass pricing pressures, supply chain challenges, and elevated valuation multiples relative to peers.
SWOT Analysis
Strengths
- Apple maintains a strong global brand with a loyal customer base.
- The company has a diversified product ecosystem integrating hardware and services.
- Robust financial performance with high revenue and cash flow generation.
- Significant institutional ownership supports governance and strategic stability.
Weaknesses
- High price-to-book ratio indicates premium valuation that may limit upside.
- Moderate leverage with a total debt to equity ratio above 100%.
- Recent price increases on key products could affect demand elasticity.
- Current ratio below 1 suggests tight short-term liquidity.
Opportunities
- Expansion into budget-friendly product segments like MacBook Neo and iPhone 17e.
- Growth potential in digital services and subscription-based offerings.
- Increasing market share in emerging markets through affordable devices.
- Advancements in AI and chip technology enhancing product capabilities.
Threats
- Supply chain disruptions impacting product availability and costs.
- Intense competition from other technology and consumer electronics firms.
- Regulatory scrutiny and geopolitical tensions affecting global operations.
- Macroeconomic factors influencing consumer spending patterns.
Company Description
Apple Inc. is a leading technology company renowned for designing, manufacturing, and marketing innovative hardware and software products for consumers and businesses worldwide. Its flagship product, the iPhone, accounts for the majority of sales, serving as the central hub of an expansive ecosystem that includes Mac computers, iPad tablets, Apple Watch wearables, and accessories like AirPods. Apple Inc. also offers a suite of services such as the App Store, Apple Music, iCloud, Apple TV+, and Apple Fitness+, providing digital content, cloud storage, and subscription-based platforms. Operating in the consumer electronics industry within the technology sector, the company employs approximately 166,000 people and maintains a broad global presence through online stores, retail outlets, and partnerships with carriers and resellers. With a substantial market capitalization reflecting its scale, Apple Inc. plays a pivotal role in shaping consumer technology trends, emphasizing seamless integration across devices and services to enhance user experience and productivity.