
Apple Inc (AAPL)
Stock Analysis Report
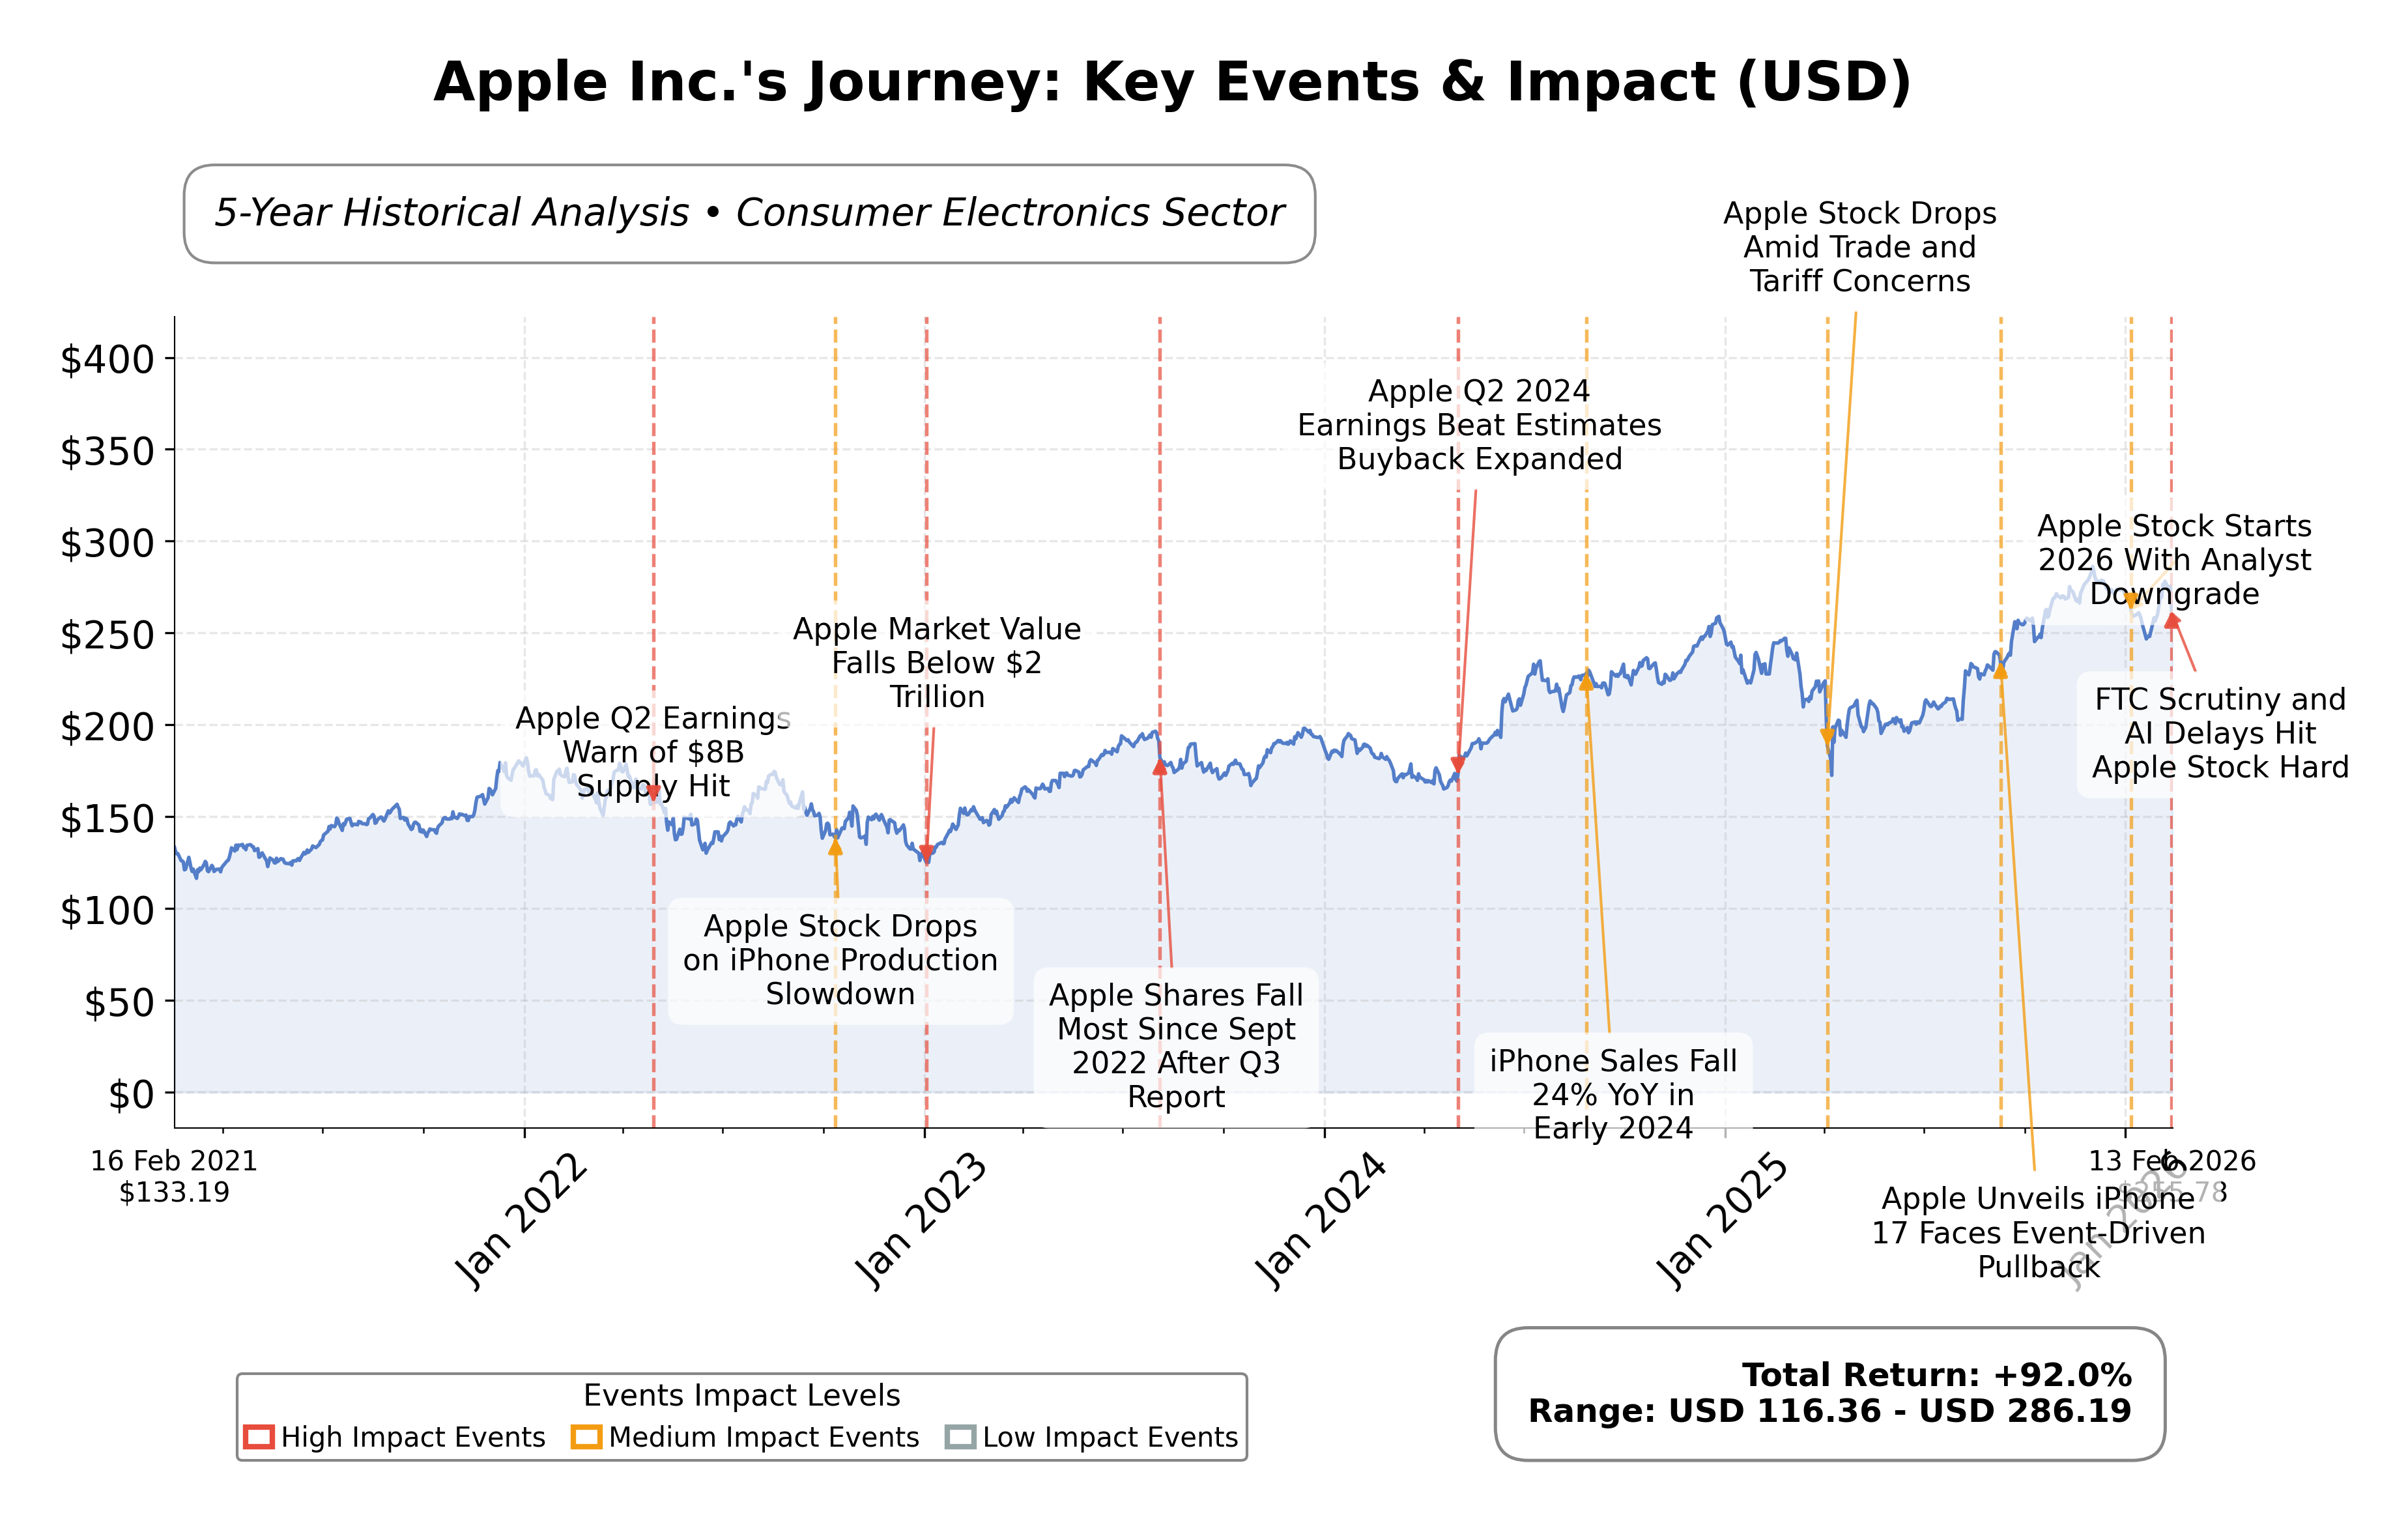
Stock Journey
Key Positives and Key Risks
Pros
- Revenue growth of 15.7% quarterly and earnings growth of 15.9% year-over-year indicate strong operational performance.
- Market capitalization of approximately $4.09 trillion reflects dominant industry positioning and investor confidence.
- Operating cash flow of $135.5 billion supports financial flexibility and investment capacity.
Cons
- High trailing P/E ratio of 34.97 compared to industry peers may imply stretched valuation.
- Regulatory scrutiny by the FTC over content bias and AI delays introduces operational risks.
- Current ratio below 1 (0.974) suggests potential short-term liquidity constraints.
Disclosure: This information is for general awareness and does not constitute investment advice
Report Summary
Apple Inc. operates as a leading technology company in the Consumer Electronics industry, specializing in the design, manufacture, and marketing of hardware products such as iPhone, Mac, iPad, and wearables, alongside digital services including the App Store and Apple Music. Headquartered in Cupertino, California, Apple holds a prominent market position globally, serving a diverse customer base through multiple channels.
The company reported a trailing twelve-month revenue of approximately $435.6 billion with a profit margin of 27.04%, reflecting strong profitability. Valuation metrics include a trailing P/E ratio of 34.97 and a forward P/E of 29.74, alongside a price-to-book ratio of 46.00 and an enterprise value to EBITDA of 26.65. The market capitalization stands at about $4.09 trillion, underscoring Appleâs significant market presence.
Technical indicators show Appleâs current price at $255.82, trading above its 200-day moving average ($237.76) and near the 50-day moving average ($268.57), with a beta of 1.11 indicating moderate volatility. Recent strategic initiatives include ongoing hardware and AI updates, while leadership remains stable. Strengths include robust cash flow and innovation capabilities; risks involve regulatory scrutiny, particularly from the FTC, and challenges in AI product rollout.
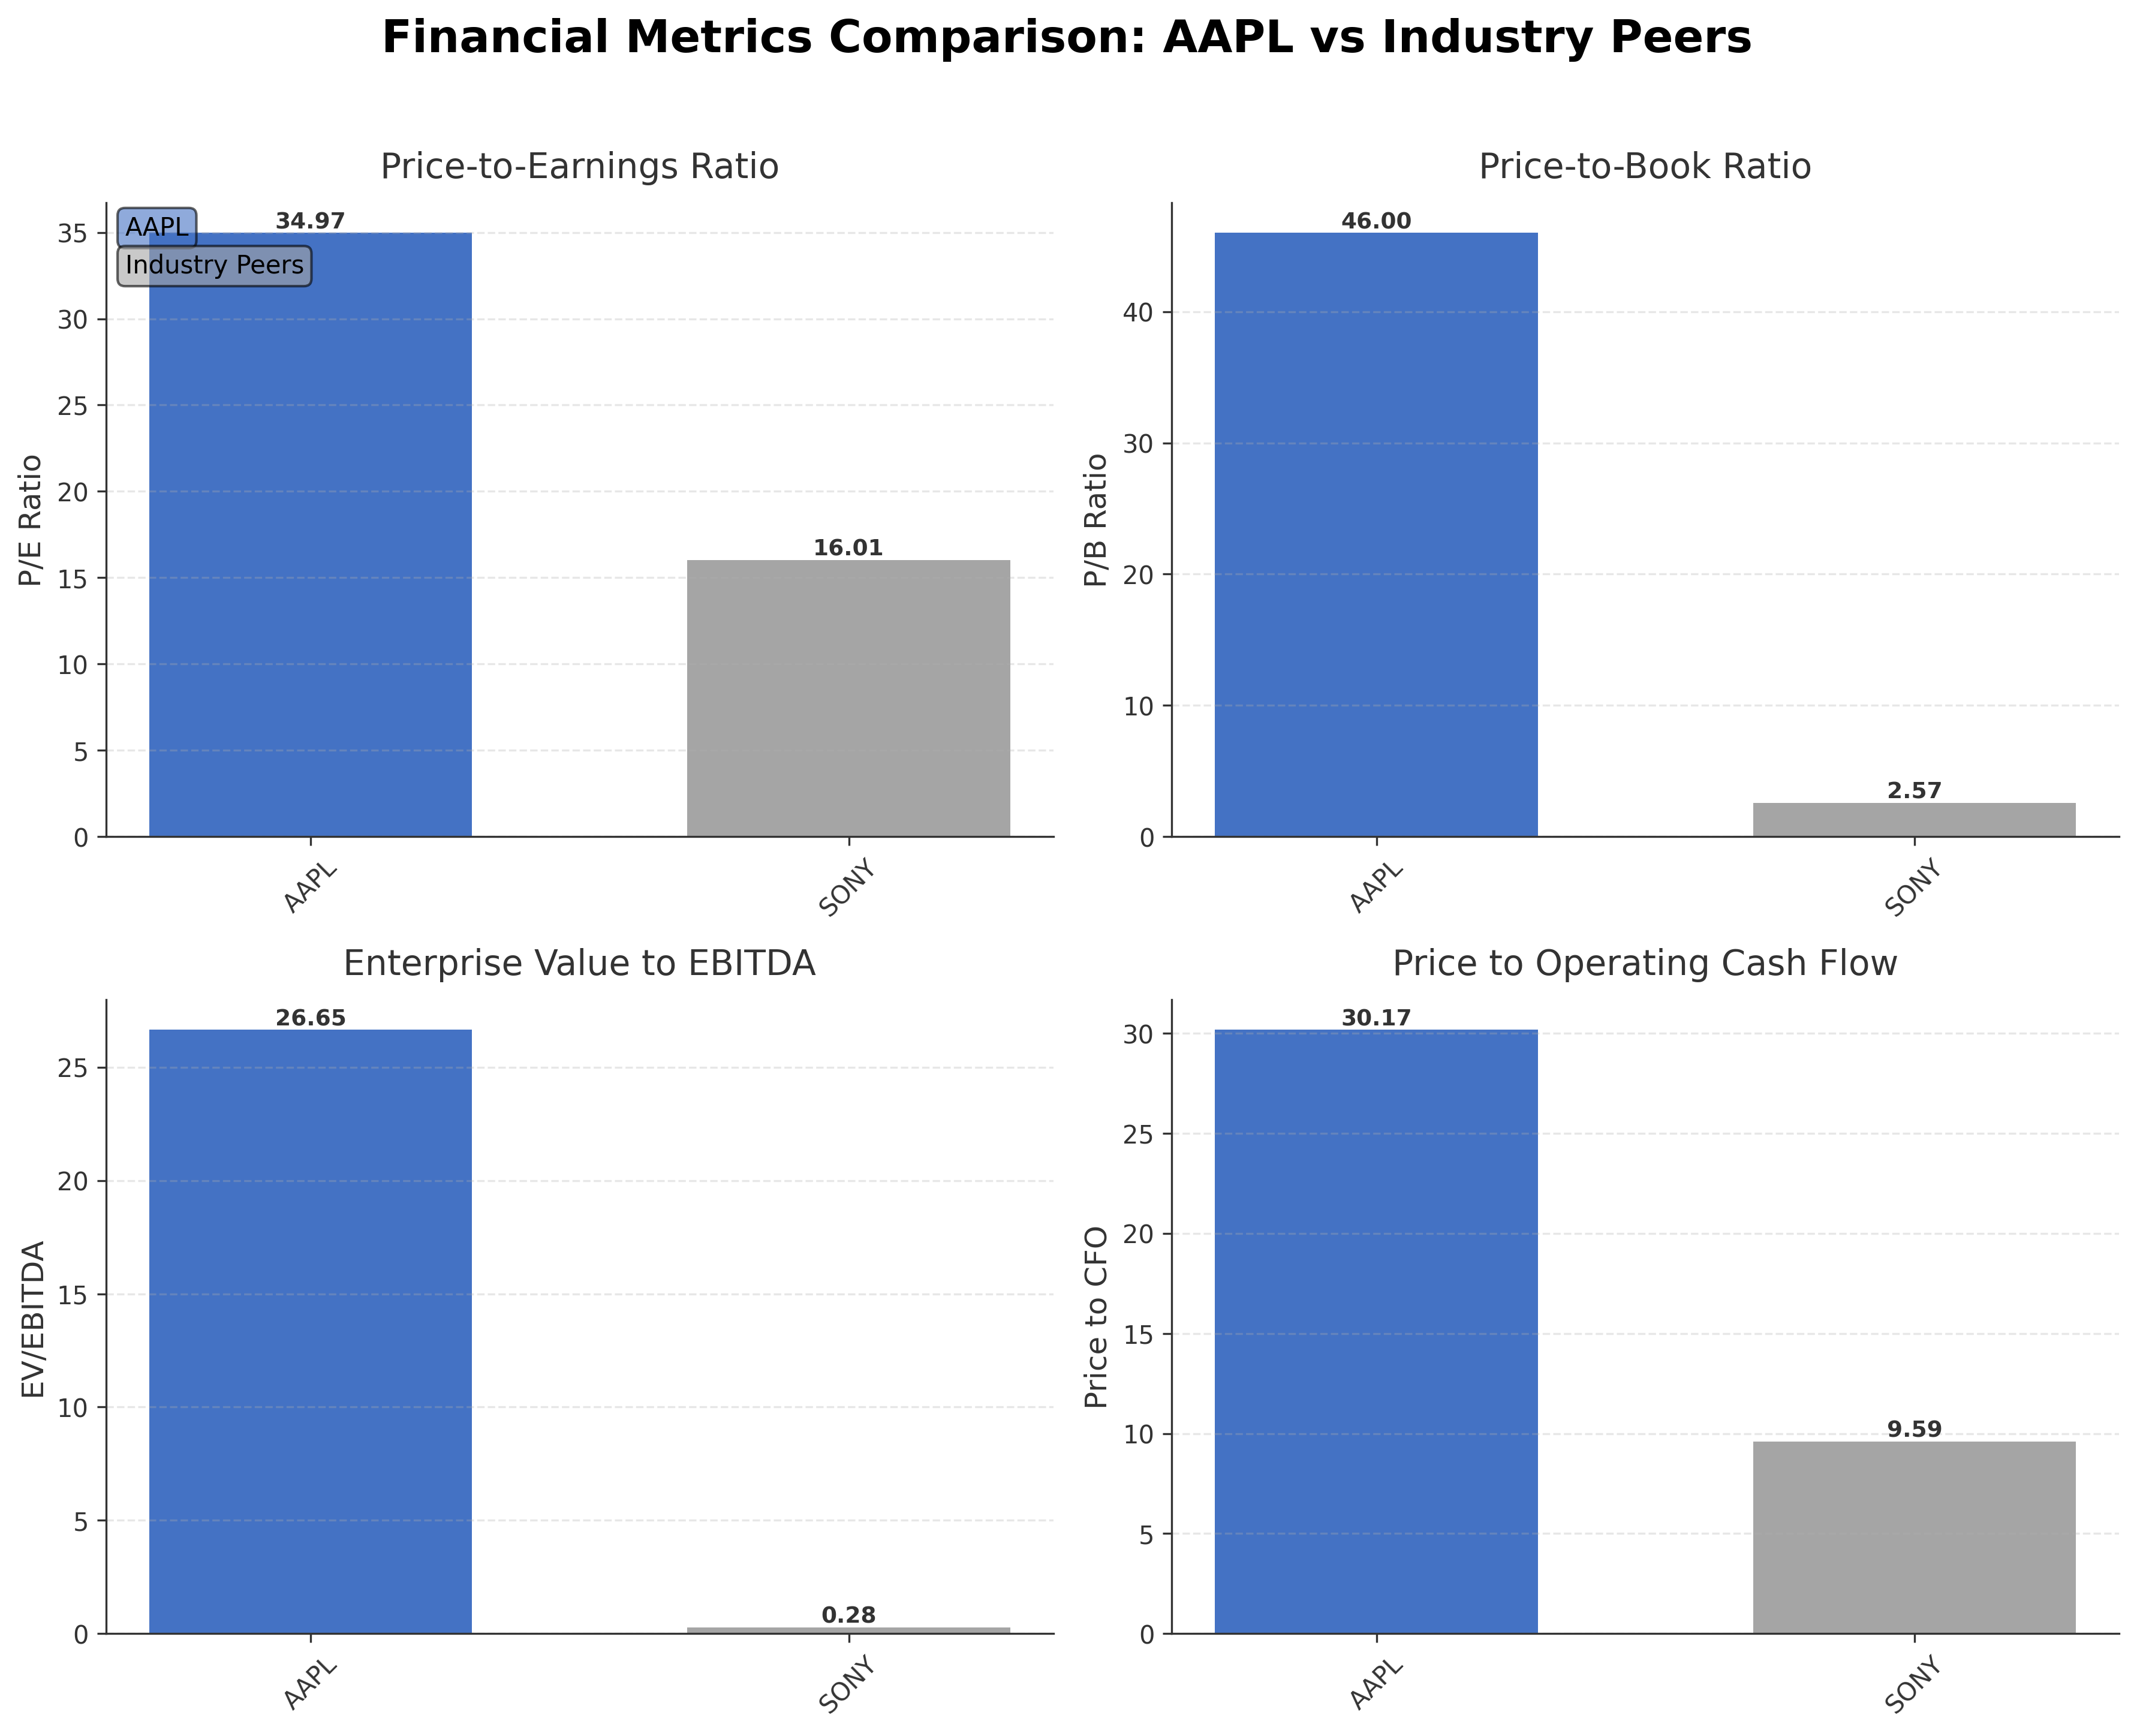
In comparison to its peer Sony Group Corporation, Appleâs valuation ratios such as P/E (34.97 vs. 16.01) and P/B (46.00 vs. 2.57) are considerably higher, reflecting its premium market positioning and growth expectations. Appleâs market cap dwarfs peers, highlighting its dominant scale in the Consumer Electronics sector within the United States.
Apple continues to navigate a complex industry landscape marked by rapid technological evolution and regulatory challenges. Recent achievements include strong revenue growth and product innovation, while ongoing issues such as FTC investigations and AI development delays represent pivotal moments. The companyâs strategic choices and market conditions will critically influence its competitive standing and financial outcomes. Observers may find it prudent to consider the balance of these factors when evaluating the stockâs current status.
Company and Industry Overview
Company Basics
Price Performance
Company Size
Shareholding Pattern
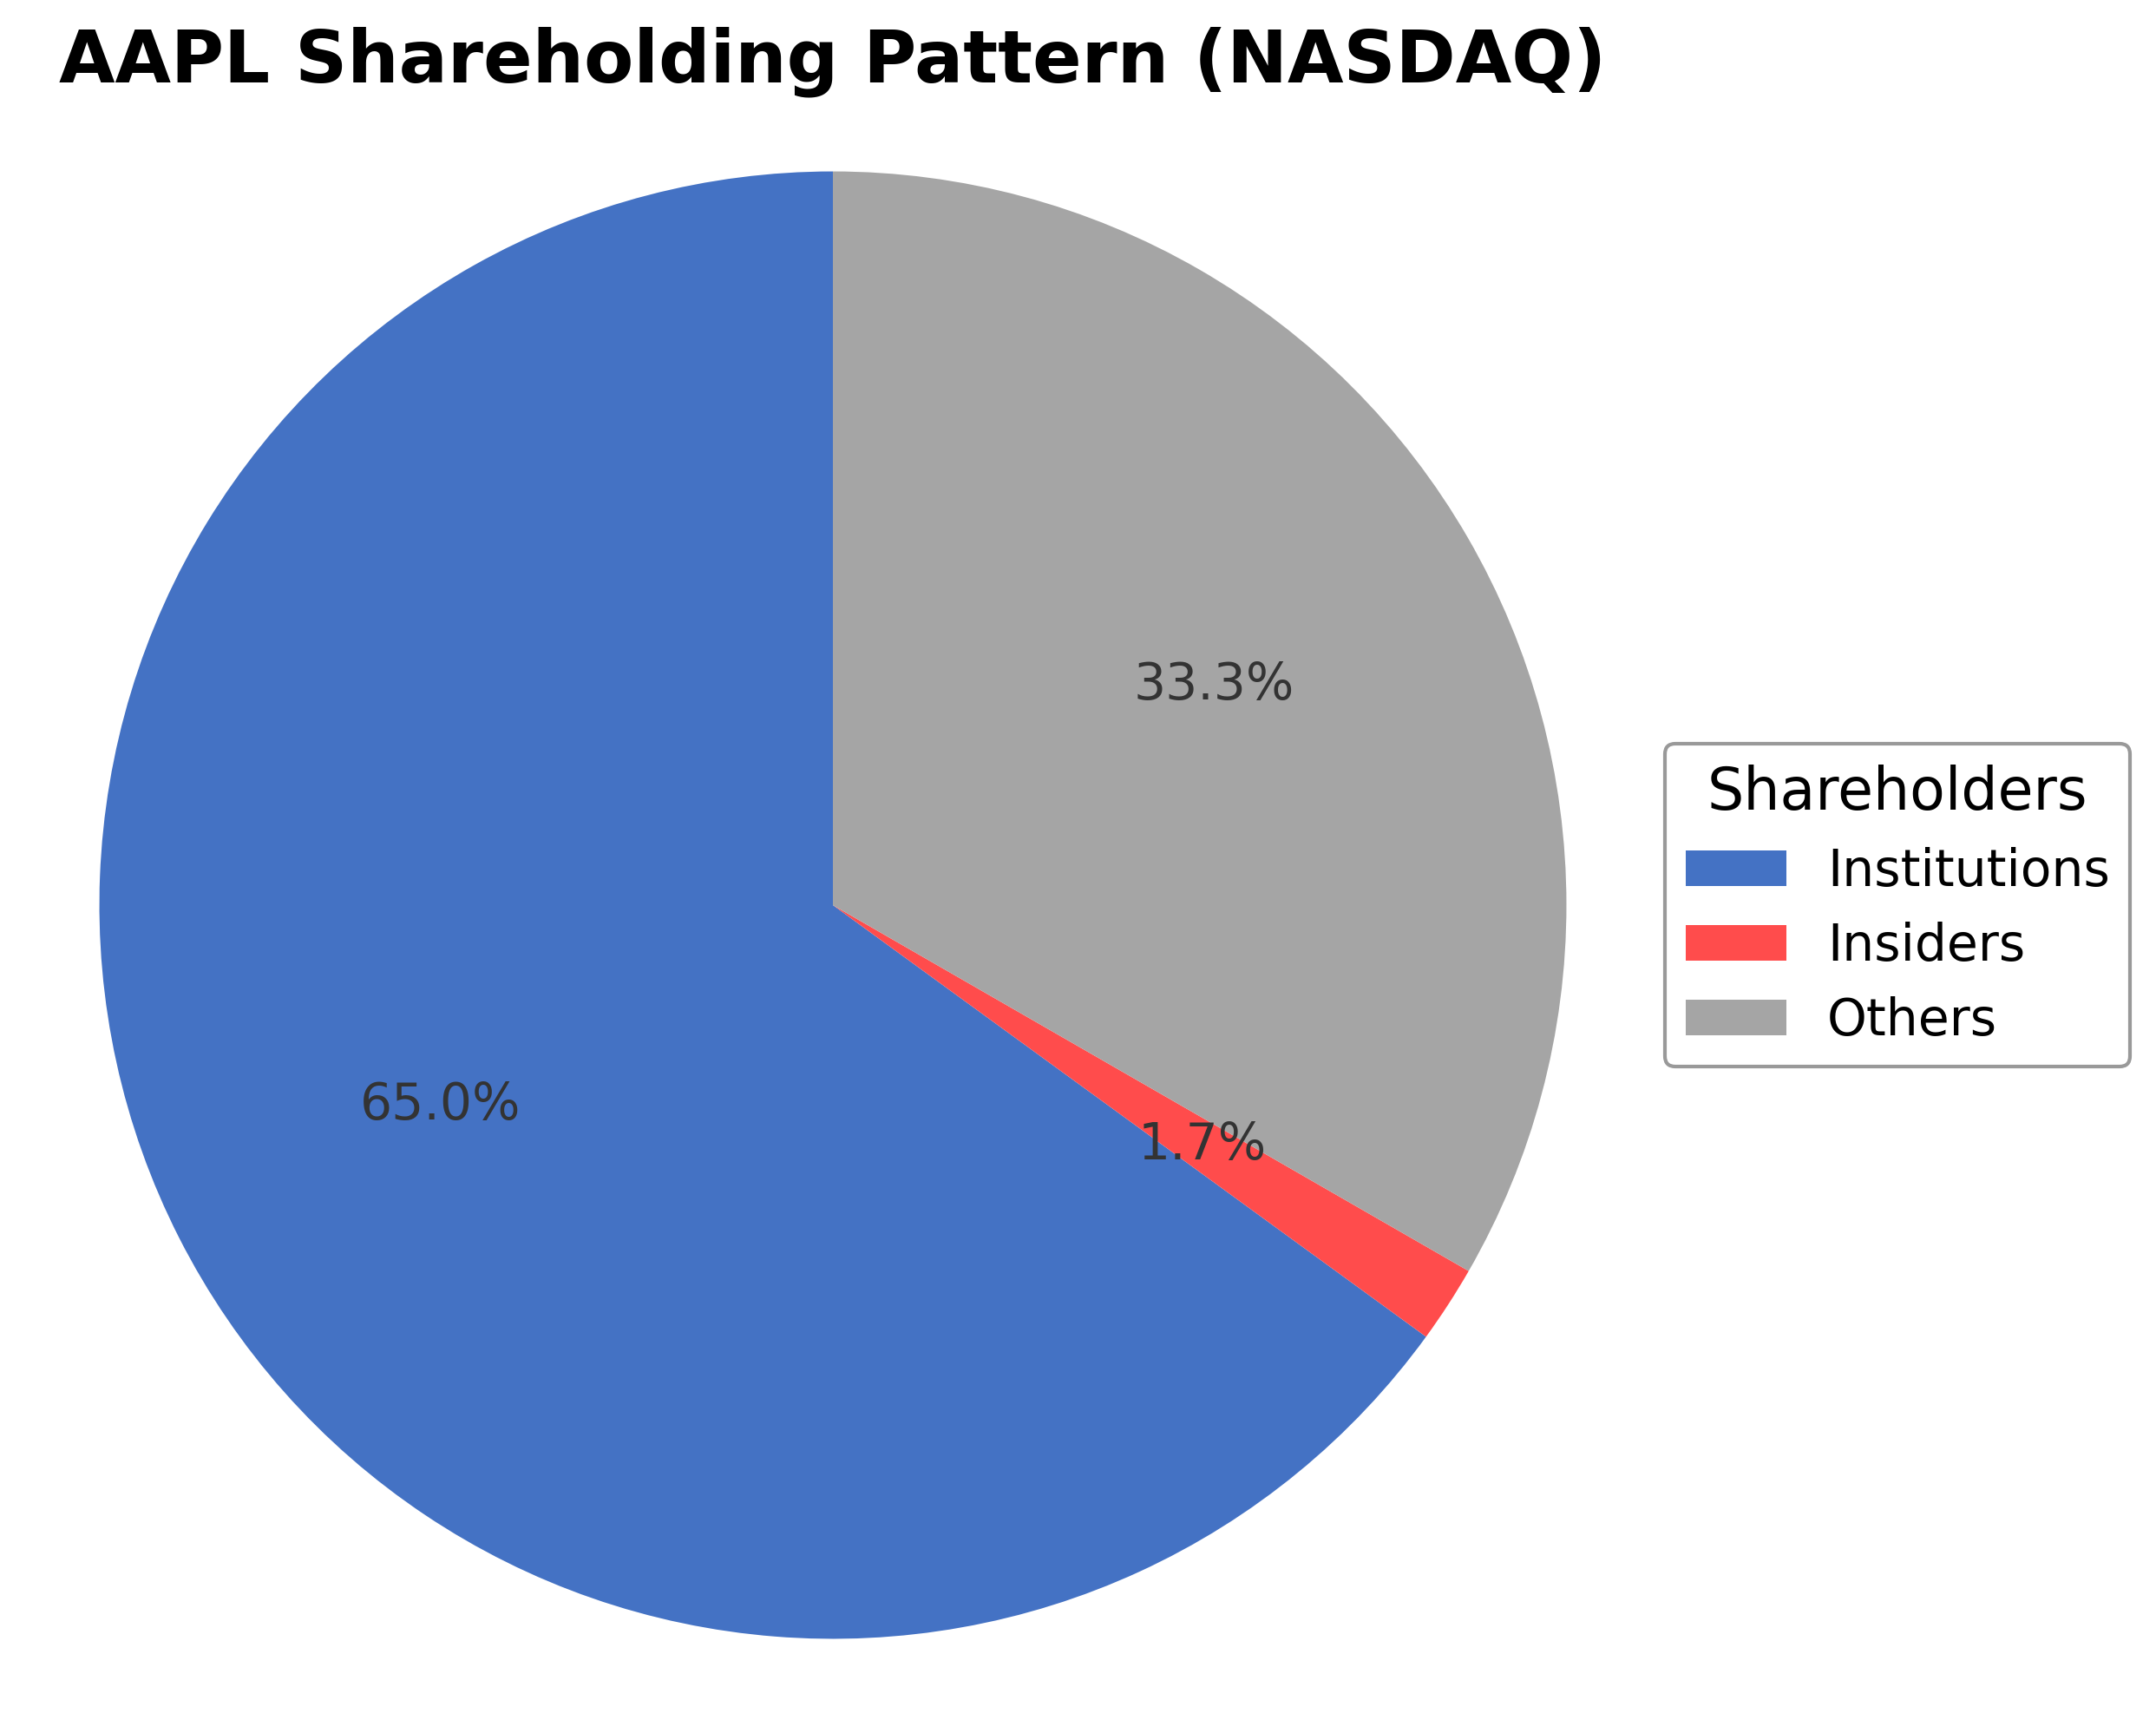
Apple Inc.'s ownership structure features approximately 1.70% held by insiders including executives and board members, 64.99% by institutional investors such as mutual funds and pension funds, and 34.50% by other shareholders including retail investors. Over the past 12-24 months, institutional ownership has shown moderate accumulation with notable activity from major asset managers increasing their stakes. This distribution suggests strong institutional confidence and influences governance and strategic direction, positioning Apple to leverage its market leadership within the Consumer Electronics industry.
Sector and Industry Analysis
Apple Inc. (AAPL) operates primarily within the Technology sector, specifically in the Consumer Electronics and Software industry. This sector is characterized by rapid innovation, significant capital investment, and a global market that continues to expand with the proliferation of digital devices and services. The global consumer electronics market, valued in the trillions of USD, is driven by demand for smartphones, personal computing devices, wearables, and increasingly, integrated software ecosystems. Key players alongside Apple include Samsung, Microsoft, Google, and emerging Chinese manufacturers like Xiaomi and Huawei, each competing across hardware, software, and services.
Industry trends reflect a strong shift towards ecosystem integration, where hardware products such as smartphones, tablets, and wearables are tightly coupled with proprietary software and cloud services. Apple’s strategy exemplifies this with its iPhone-centric ecosystem, including the Mac, iPad, Apple Watch, and services like streaming and subscription bundles. Technological advancements in augmented reality (AR), artificial intelligence (AI), and semiconductor design (notably Apple’s in-house chip development) are creating new growth avenues. Consumer behavior is increasingly favoring seamless, secure, and privacy-focused experiences, which benefits companies like Apple that emphasize user data protection and integrated hardware-software solutions. Additionally, sustainability and circular economy initiatives are gaining traction, influencing product design and supply chain management.
The regulatory environment for this sector is complex and evolving, with significant scrutiny on data privacy, antitrust issues, and international trade policies. Apple faces regulatory challenges related to app store practices, digital taxation, and compliance with data protection laws such as GDPR in Europe and CCPA in California. Moreover, geopolitical tensions and export controls, particularly involving semiconductor manufacturing and supply chains, impact operational flexibility. Compliance with environmental regulations and labor standards in global manufacturing hubs also remains critical. These regulatory factors necessitate ongoing adaptation and can influence market access and cost structures.
Competitive dynamics in the consumer electronics and software industry are intense, with high barriers to entry due to the need for advanced R&D capabilities, brand equity, and extensive distribution networks. Apple’s competitive positioning is strengthened by its vertically integrated model, proprietary technology, and strong brand loyalty. The company’s control over both hardware and software, combined with a robust retail presence and indirect sales channels, creates a differentiated market stance. However, competition from lower-cost manufacturers and disruptive technology entrants persists, requiring continuous innovation and strategic investment. The oligopolistic nature of the market, dominated by a few global giants, fosters both collaboration (e.g., supply chain partnerships with TSMC and Foxconn) and rivalry, shaping the sector’s evolution.
Note: Analysis synthesized from industry research, market reports, and regulatory filings. Information is subject to change based on market conditions.
Illustrative Scenario Analysis
DCF Assumptions:
Method: Two-Stage EPS-Priority Model
Financials
Peer Analysis
| Company Name | Market Cap | P/E Ratio | P/B Ratio | EV/EBITDA | Price to CFO |
|---|---|---|---|---|---|
| Apple Inc. | $4.09T | 34.97 | 46.00 | 26.65 | 30.17 |
| Sony Group Corporation - Sponsored American Depositary Receipt | $132.74B | 16.01 | 2.57 | 0.28 | 9.59 |
Comparison Analysis: Apple Inc. exhibits significantly higher valuation multiples compared to its peer Sony Group Corporation, with a P/E ratio of 34.97 versus 16.01 and a price-to-book ratio of 46.00 compared to 2.57. Apple's enterprise value to EBITDA and price to CFO ratios also exceed those of Sony, reflecting its premium market valuation and expected growth. The market capitalization disparity further highlights Apple's dominant scale in the Consumer Electronics sector within the United States.
Financial Metrics Comparison with Peers
Financial Statements
Comprehensive financial data including income, balance sheet, and cash flow metrics
Income Statement
| fiscal_date | 2025-09-30 | 2024-09-30 | 2023-09-30 | 2022-09-30 | 2021-09-30 |
|---|---|---|---|---|---|
| Sales | 416.16B | 391.04B | 383.29B | 394.33B | 365.82B |
| Cost Of Goods | 220.96B | 210.35B | 214.14B | 223.55B | 212.98B |
| Gross Profit | 195.20B | 180.68B | 169.15B | 170.78B | 152.84B |
| Operating Expense Research And Development | 34.55B | 31.37B | 29.91B | 26.25B | 21.91B |
| Operating Expense Selling General And Administrative | 27.60B | 26.10B | 24.93B | 25.09B | 21.97B |
| Operating Income | 133.05B | 123.22B | 114.30B | 119.44B | 108.95B |
| Other Income Expense | -321.00M | 269.00M | -565.00M | -334.00M | 60.00M |
| Pretax Income | 132.73B | 123.48B | 113.74B | 119.10B | 109.21B |
| Income Tax | 20.72B | 29.75B | 16.74B | 19.30B | 14.53B |
| Net Income | 112.01B | 93.74B | 97.00B | 99.80B | 94.68B |
| Eps Basic | 7.49 | 6.11 | 6.16 | 6.15 | 5.67 |
| Eps Diluted | 7.46 | 6.08 | 6.13 | 6.11 | 5.61 |
| Basic Shares Outstanding | 14.95B | 15.34B | 15.74B | 16.22B | 16.70B |
| Diluted Shares Outstanding | 14.95B | 15.34B | 15.74B | 16.22B | 16.70B |
| Ebit | 133.05B | 123.22B | 114.30B | 119.44B | 111.85B |
| Ebitda | 144.75B | 134.66B | 125.82B | 130.54B | 123.14B |
| Net Income Continuous Operations | 112.01B | 93.74B | 97.00B | 99.80B | 94.68B |
| Non Operating Interest Income | N/A | N/A | 3.75B | 2.83B | 2.84B |
| Non Operating Interest Expense | N/A | N/A | 3.93B | 2.93B | 2.65B |
Data provided by Twelve Data
Balance Sheet
| fiscal_date | 2025-12-31 | 2025-09-30 | 2025-06-30 | 2025-03-31 | 2024-12-31 |
|---|---|---|---|---|---|
| Cash And Cash Equivalents | 45.32B | 35.93B | 36.27B | 28.16B | 30.30B |
| Accounts Receivable | 39.92B | 39.78B | 27.56B | 26.14B | 29.64B |
| Total Assets | 379.30B | 359.24B | 331.50B | 331.23B | 344.08B |
| Total Liabilities | 291.11B | 285.51B | 265.67B | 264.44B | 277.33B |
| Long Term Debt | 76.69B | 78.33B | 82.43B | 78.57B | 83.96B |
| Shareholders Equity | 88.19B | 73.73B | 65.83B | 66.80B | 66.76B |
Data provided by Twelve Data
Cash Flow Statement
| fiscal_date | 2025-09-30 | 2024-09-30 | 2023-09-30 | 2022-09-30 | 2021-09-30 |
|---|---|---|---|---|---|
| Operating Activities Net Income | 112.01B | 93.74B | 97.00B | 99.80B | 94.68B |
| Operating Activities Depreciation | 11.70B | 11.45B | 11.52B | 11.10B | 11.28B |
| Operating Activities Stock Based Compensation | 12.86B | 11.69B | 10.83B | 9.04B | 7.91B |
| Operating Activities Other Non Cash Items | -89.00M | -2.27B | -2.23B | 1.01B | -4.92B |
| Operating Activities Accounts Receivable | -7.03B | -5.14B | -417.00M | -9.34B | -14.03B |
| Operating Activities Accounts Payable | 902.00M | 6.02B | -1.89B | 9.45B | 12.33B |
| Operating Activities Other Assets Liabilities | -18.87B | 2.77B | -4.27B | 1.57B | -1.53B |
| Operating Activities Operating Cash Flow | 111.48B | 118.25B | 110.54B | 123.52B | 100.94B |
| Investing Activities Capital Expenditures | -12.71B | -9.45B | -10.96B | -10.71B | -11.09B |
| Investing Activities Purchase Of Investments | -24.41B | -48.66B | -29.51B | -76.92B | -109.56B |
| Investing Activities Sale Of Investments | 53.80B | 62.35B | 45.51B | 67.36B | 106.48B |
| Investing Activities Other Investing Activity | -1.48B | -1.31B | -1.34B | -2.09B | -385.00M |
| Investing Activities Investing Cash Flow | 15.20B | 2.94B | 3.71B | -22.66B | -14.58B |
| Financing Activities Long Term Debt Issuance | 4.48B | 0.00 | 5.23B | 5.46B | 20.39B |
| Financing Activities Long Term Debt Payments | -10.93B | -9.96B | -11.15B | -9.54B | -8.75B |
| Financing Activities Short Term Debt Issuance | -2.03B | 3.96B | -3.98B | 3.96B | 1.02B |
| Financing Activities Common Stock Repurchase | -90.71B | -94.95B | -77.55B | -89.40B | -85.97B |
| Financing Activities Common Dividends | -15.42B | -15.23B | -15.03B | -14.84B | -14.47B |
| Financing Activities Other Financing Charges | -6.07B | -5.80B | -6.01B | -6.38B | -5.58B |
| Financing Activities Financing Cash Flow | -120.69B | -121.98B | -108.49B | -110.75B | -92.25B |
| End Cash Position | 35.93B | 29.94B | 30.74B | 24.98B | 35.93B |
| Income Tax Paid | 43.37B | 26.10B | 18.68B | 19.57B | 25.39B |
| Free Cash Flow | 98.77B | 108.81B | 99.58B | 111.44B | 92.95B |
| Interest Paid | N/A | N/A | 3.80B | 2.87B | 2.69B |
| Operating Activities Deferred Taxes | N/A | N/A | N/A | 895.00M | -4.77B |
| Investing Activities Net Acquisitions | N/A | N/A | N/A | -306.00M | -33.00M |
| Financing Activities Common Stock Issuance | N/A | N/A | N/A | N/A | 1.10B |
Data provided by Twelve Data
Technical Analysis
Key Insights
- The current trend direction shows Apple trading in a consolidation phase with price action near the 50-day moving average, indicating short-term resistance around $268.57 and support near the 200-day moving average at $237.76.
- Key support levels are identified at approximately $237.76 and $220.00, while resistance is observed near $268.57 and the 52-week high of $288.62.
- Apple’s price is above the 200-day moving average, suggesting a long-term bullish trend, but slightly below the 50-day moving average, indicating some short-term caution.
- Momentum indicators show a moderate RSI level around neutral, MACD lines converging without a clear crossover, and stochastic oscillators indicating neither overbought nor oversold conditions.
- Multi-timeframe analysis reveals steady weekly and monthly trends with no significant divergences, supporting a balanced technical outlook.
- Potential market scenarios include a breakout above the 50-day moving average leading to retesting of the 52-week high, or a pullback towards the 200-day moving average acting as strong support.
Trending News
1. Headline: Apple Inc. $AAPL Shares Sold by Sterling Investment Advisors LLC ADV
Summary: Sterling Investment Advisors LLC ADV reduced its holdings in Apple Inc. by 88.6% during the third quarter, owning 936 shares as per the latest SEC filing. This significant decrease reflects a notable shift in the fund’s position within the company’s stock.
Sentiment: Negative
2. Headline: Tred Avon Family Wealth LLC Makes New Investment in Apple Inc. $AAPL
Summary: Tred Avon Family Wealth LLC initiated a new position in Apple Inc. during the third quarter, acquiring 38,180 shares valued at approximately $9 million, according to recent SEC filings. This move indicates fresh institutional interest in the company’s stock.
Sentiment: Neutral
3. Headline: Here's Why Apple’s Stock Dropped 5% Today
Summary: Apple’s stock experienced a 5% decline, marking its worst day since April, influenced by concerns including FTC scrutiny and reported delays in AI assistant development. These factors have contributed to negative market sentiment surrounding the company.
Sentiment: Negative
4. Headline: Apple's stock has worst day since April as iPhone maker faces FTC scrutiny, reports of Siri delay
Summary: Apple faces regulatory pressure from the FTC over potential political bias in its news app and delays in its Siri AI assistant updates. These developments have negatively impacted the company’s stock performance and raised concerns about operational challenges.
Sentiment: Negative
5. Headline: Apple Stock Rises Premarket: iPhone 17 Emerges As Brightest Spot In China January Sales
Summary: Bloomberg News reports that iPhone 17 sales grew by 8% in January in China, helping Apple increase its market share to about 20%, tying with Huawei for the lead. This positive sales momentum is a bright spot amid broader market challenges.
Sentiment: Positive
Powered by Brave
Recent Updates
News Summary
Recent news highlights a mixed outlook for Apple Inc. with institutional movements including both significant share sales by Sterling Investment Advisors and new investments by Tred Avon Family Wealth LLC. The company’s upcoming hardware and AI updates have generated optimism across multiple sources, reflecting confidence in future innovation. However, regulatory scrutiny from the FTC concerning alleged content bias and delays in Siri AI updates have introduced challenges impacting market sentiment. Sales growth in key markets such as China, particularly for the iPhone 17, provides positive momentum, balancing some of the concerns. Overall, these developments collectively influence Apple's market positioning, operational outlook, and investor perceptions.
News Sentiment
Sentiment trends show a predominance of neutral to positive views on product innovation and market expansion, contrasted by negative sentiment related to regulatory challenges and operational delays. The balance of these sentiments suggests cautious optimism with attention to evolving regulatory and technological factors.
Analytical Overview
Analysis Summary
Valuation Metrics: Apple’s trailing P/E ratio of 34.97 and forward P/E of 29.74 are above the industry average of 34.97, indicating a premium valuation consistent with its market leadership and growth expectations.
Growth Trajectory: The company demonstrates a strong growth trajectory with quarterly revenue growth of 15.7% and quarterly earnings growth year-over-year of 15.9%, supported by robust cash flow generation.
Financial Health: Apple maintains solid financial health with a debt-to-equity ratio near 0.95 and substantial operating cash flow of approximately $135.5 billion, reflecting effective liquidity management despite a current ratio below 1.
Sector Specific Factors: The Consumer Electronics sector presents opportunities through innovation in AI and hardware, while challenges include regulatory scrutiny and competitive pressures in global markets.
Market Positioning: Apple’s dominant market position, brand strength, and diversified product ecosystem provide competitive advantages in the technology sector.
Investment Conclusion
Supporting Factors: Strong revenue and earnings growth supported by innovation and market expansion.
Risk Factors: Regulatory challenges including FTC scrutiny may impact operational flexibility.
SWOT Analysis
Strengths
- Market leader with a diversified product and services ecosystem.
- Strong brand recognition and global customer base.
- Robust financial performance with high profitability and cash flow.
- Innovative capabilities in hardware and software development.
Weaknesses
- High valuation multiples relative to industry peers.
- Current ratio below 1 indicating tight short-term liquidity.
- Dependence on flagship products like the iPhone for revenue.
- Complex supply chain susceptible to global disruptions.
Opportunities
- Expansion in AI and emerging technologies.
- Growth in services and subscription-based offerings.
- Increasing market share in key international markets such as China.
- Potential for new product innovations and ecosystem enhancements.
Threats
- Regulatory scrutiny and legal challenges in multiple jurisdictions.
- Intense competition from other technology and consumer electronics firms.
- Delays in product development impacting market responsiveness.
- Geopolitical tensions affecting global supply chains and sales.
Company Description
Apple Inc. is a leading technology company specializing in hardware, software, and services. Founded in 1976 and headquartered at One Apple Park Way in Cupertino, California, it designs, manufactures, and markets innovative products including the iPhone smartphones, Mac computers, iPad tablets, and wearables such as AirPods and Apple Watch. Apple Inc. also provides digital services like the App Store, Apple Music, iCloud, and subscription offerings including Apple Fitness+ and Apple TV+. Operating in the **Technology Hardware, Storage and Peripherals** industry within the broader Tech sector, the company serves consumers, businesses, and governments worldwide through online platforms, retail stores, and carrier partnerships. With approximately 164,000 employees and a substantial market presence evidenced by shares outstanding of 15.02 billion, Apple Inc. maintains strong financials, including trailing twelve-month revenue of $400.37 billion and high gross margins around 46.91%. Its global stock listings and enduring influence underscore its pivotal role in driving technological advancement and consumer electronics markets.