
Apple Inc (AAPL)
Stock Analysis Report
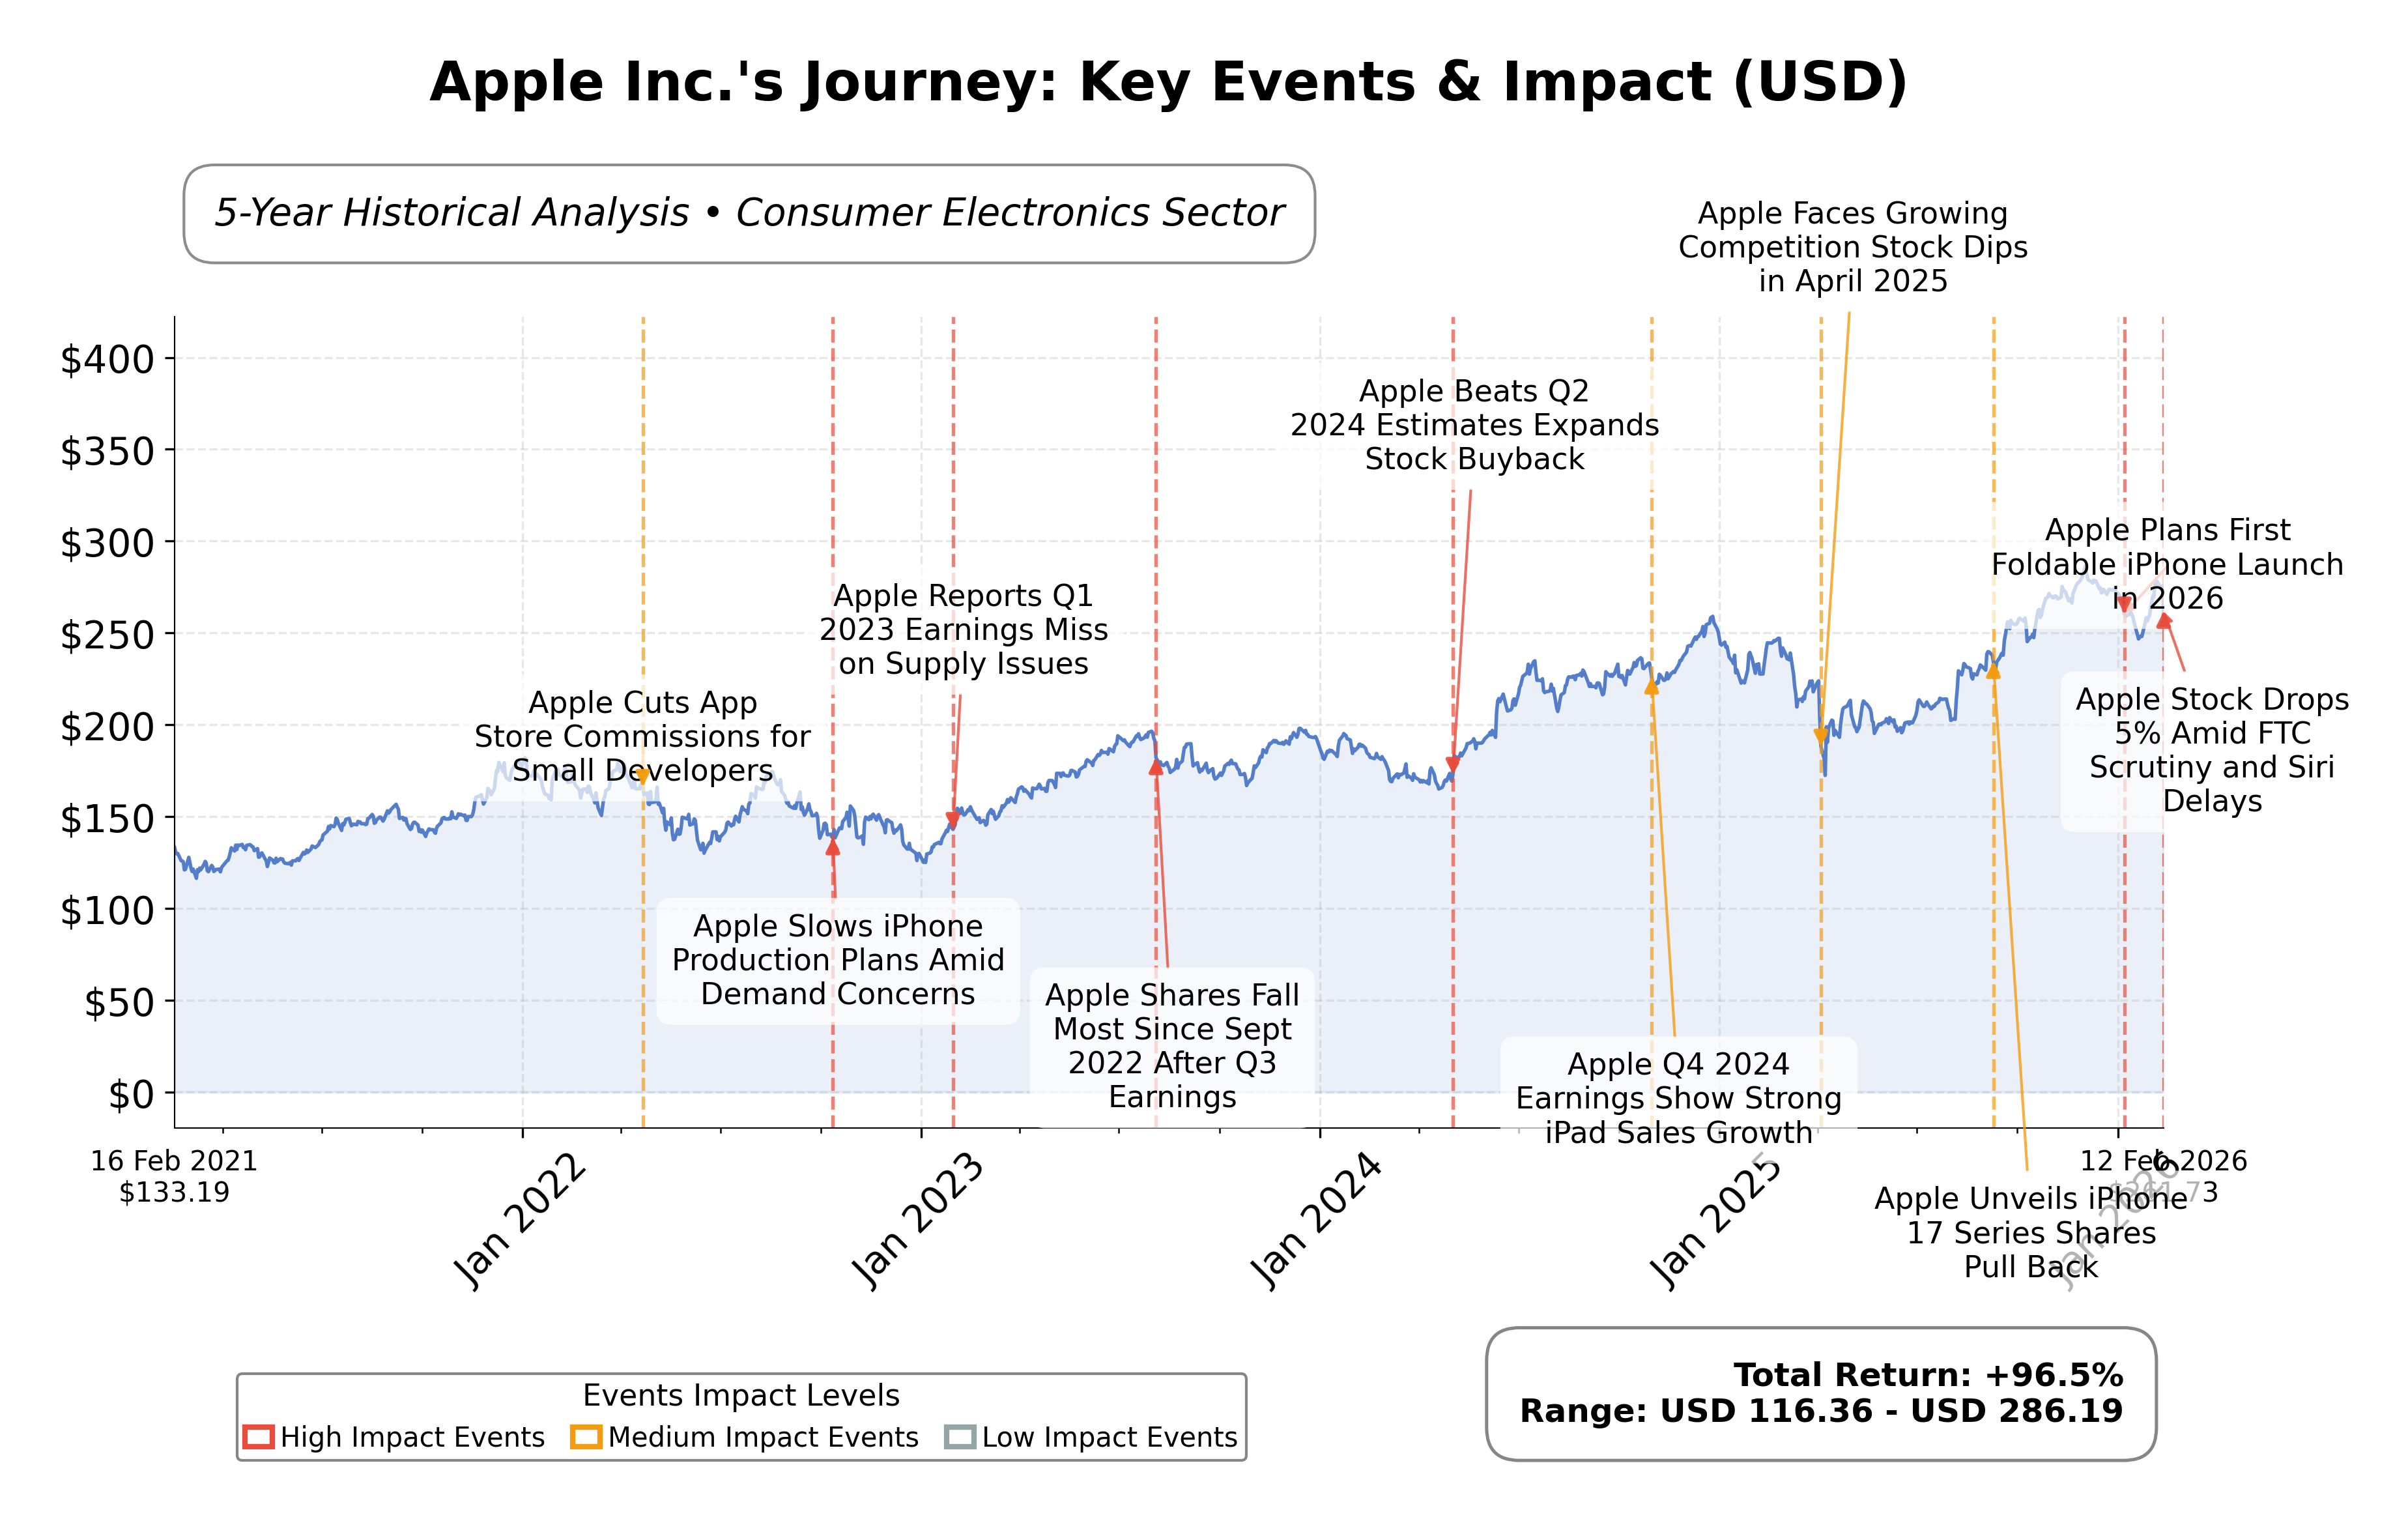
Stock Journey
Key Positives and Key Risks
Pros
- Strong revenue growth of 15.7% quarterly and earnings growth of 15.9% year-over-year indicate robust operational performance.
- Significant operating cash flow of $135.5 billion and free cash flow of $106.3 billion demonstrate strong liquidity and financial health.
- High institutional ownership at approximately 65% reflects confidence from major asset managers and stability in governance.
Cons
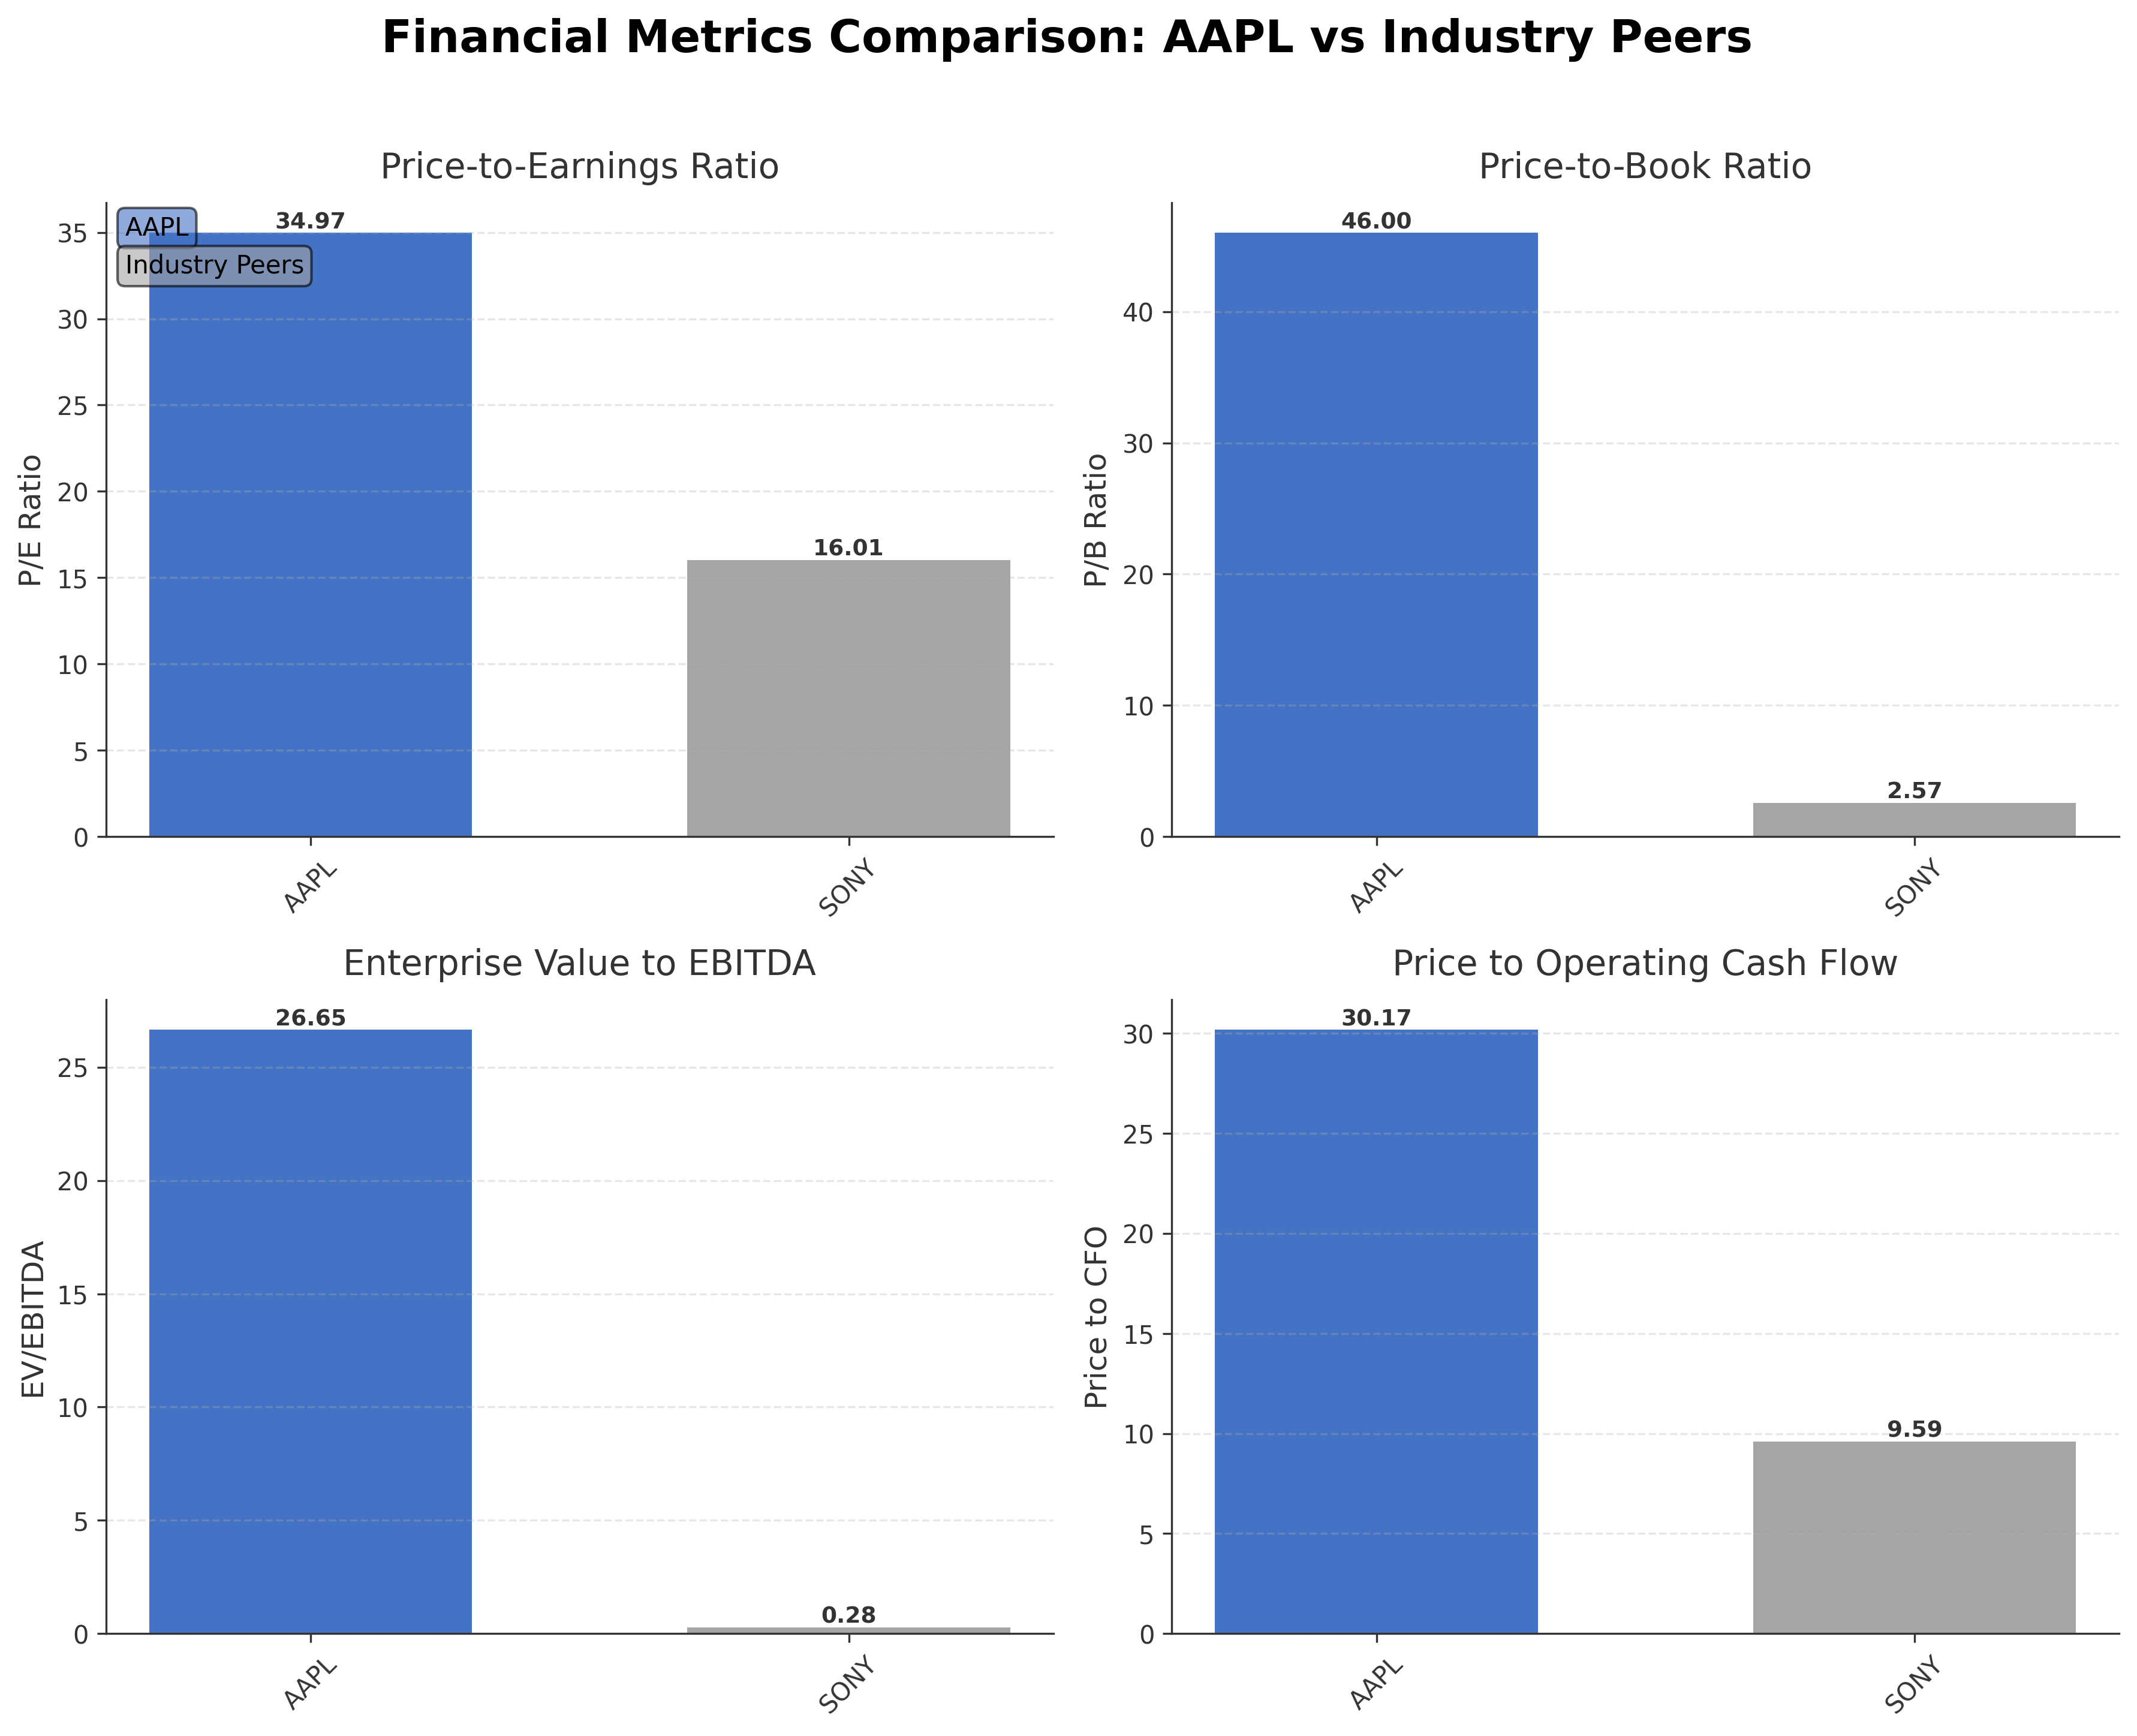
- Elevated trailing P/E ratio of 34.97 and price-to-book ratio of 46.00 suggest premium valuation with potential downside risk.
- Regulatory scrutiny by the FTC regarding content bias and product delays such as the Siri upgrade introduce operational and reputational risks.
- Current ratio below 1 (0.974) indicates tight short-term liquidity, which may pose challenges in managing immediate obligations.
Disclosure: This information is for general awareness and does not constitute investment advice
Report Summary
Apple Inc. is a leading technology company operating in the Consumer Electronics industry, specializing in designing, manufacturing, and marketing innovative hardware products such as iPhones, Macs, iPads, and wearables, alongside digital services including the App Store and Apple Music. Headquartered in Cupertino, California, Apple holds a strong market position globally, serving consumers, businesses, and governments with a diversified product and services portfolio.
Financially, Apple demonstrates robust performance with a trailing twelve-month revenue of approximately $435.6 billion and a net income of $117.8 billion, reflecting a profit margin of 27.0%. The companyâs valuation metrics include a trailing P/E ratio of 34.97 and a forward P/E of 29.74, with a market capitalization exceeding $4 trillion. Apple maintains a strong gross margin near 48.2% and solid cash flow generation, with operating cash flow of $135.5 billion and free cash flow of $106.3 billion over the trailing twelve months.
Technically, Appleâs stock price currently trades above its 200-day moving average, indicating a sustained upward trend, though recent momentum indicators show mixed signals. Recent strategic developments include continued investment in AI and services, while leadership remains stable. Notable strengths include strong brand equity and cash reserves, balanced against risks such as regulatory scrutiny from the FTC and competitive pressures in the technology sector.
In peer comparison within the Consumer Electronics industry and U.S. region, Appleâs valuation metrics are significantly higher than peers such as Sony Group Corporation, which exhibits a market cap of $132.74 billion and a P/E ratio of 16.01. Appleâs premium valuation reflects its dominant market share and growth prospects but also suggests higher expectations relative to regional competitors.
Apple navigates a complex industry landscape marked by rapid innovation, regulatory challenges, and evolving consumer preferences. Recent achievements include strong revenue growth and institutional accumulation, while ongoing challenges involve regulatory scrutiny and product development delays. The company stands at a pivotal moment where strategic execution and market conditions will influence its capacity to sustain leadership. Given the current data, a balanced stance that monitors developments while acknowledging both strengths and risks may align with the perspectives of those evaluating the stock.
Company and Industry Overview
Company Basics
Price Performance
Company Size
Shareholding Pattern
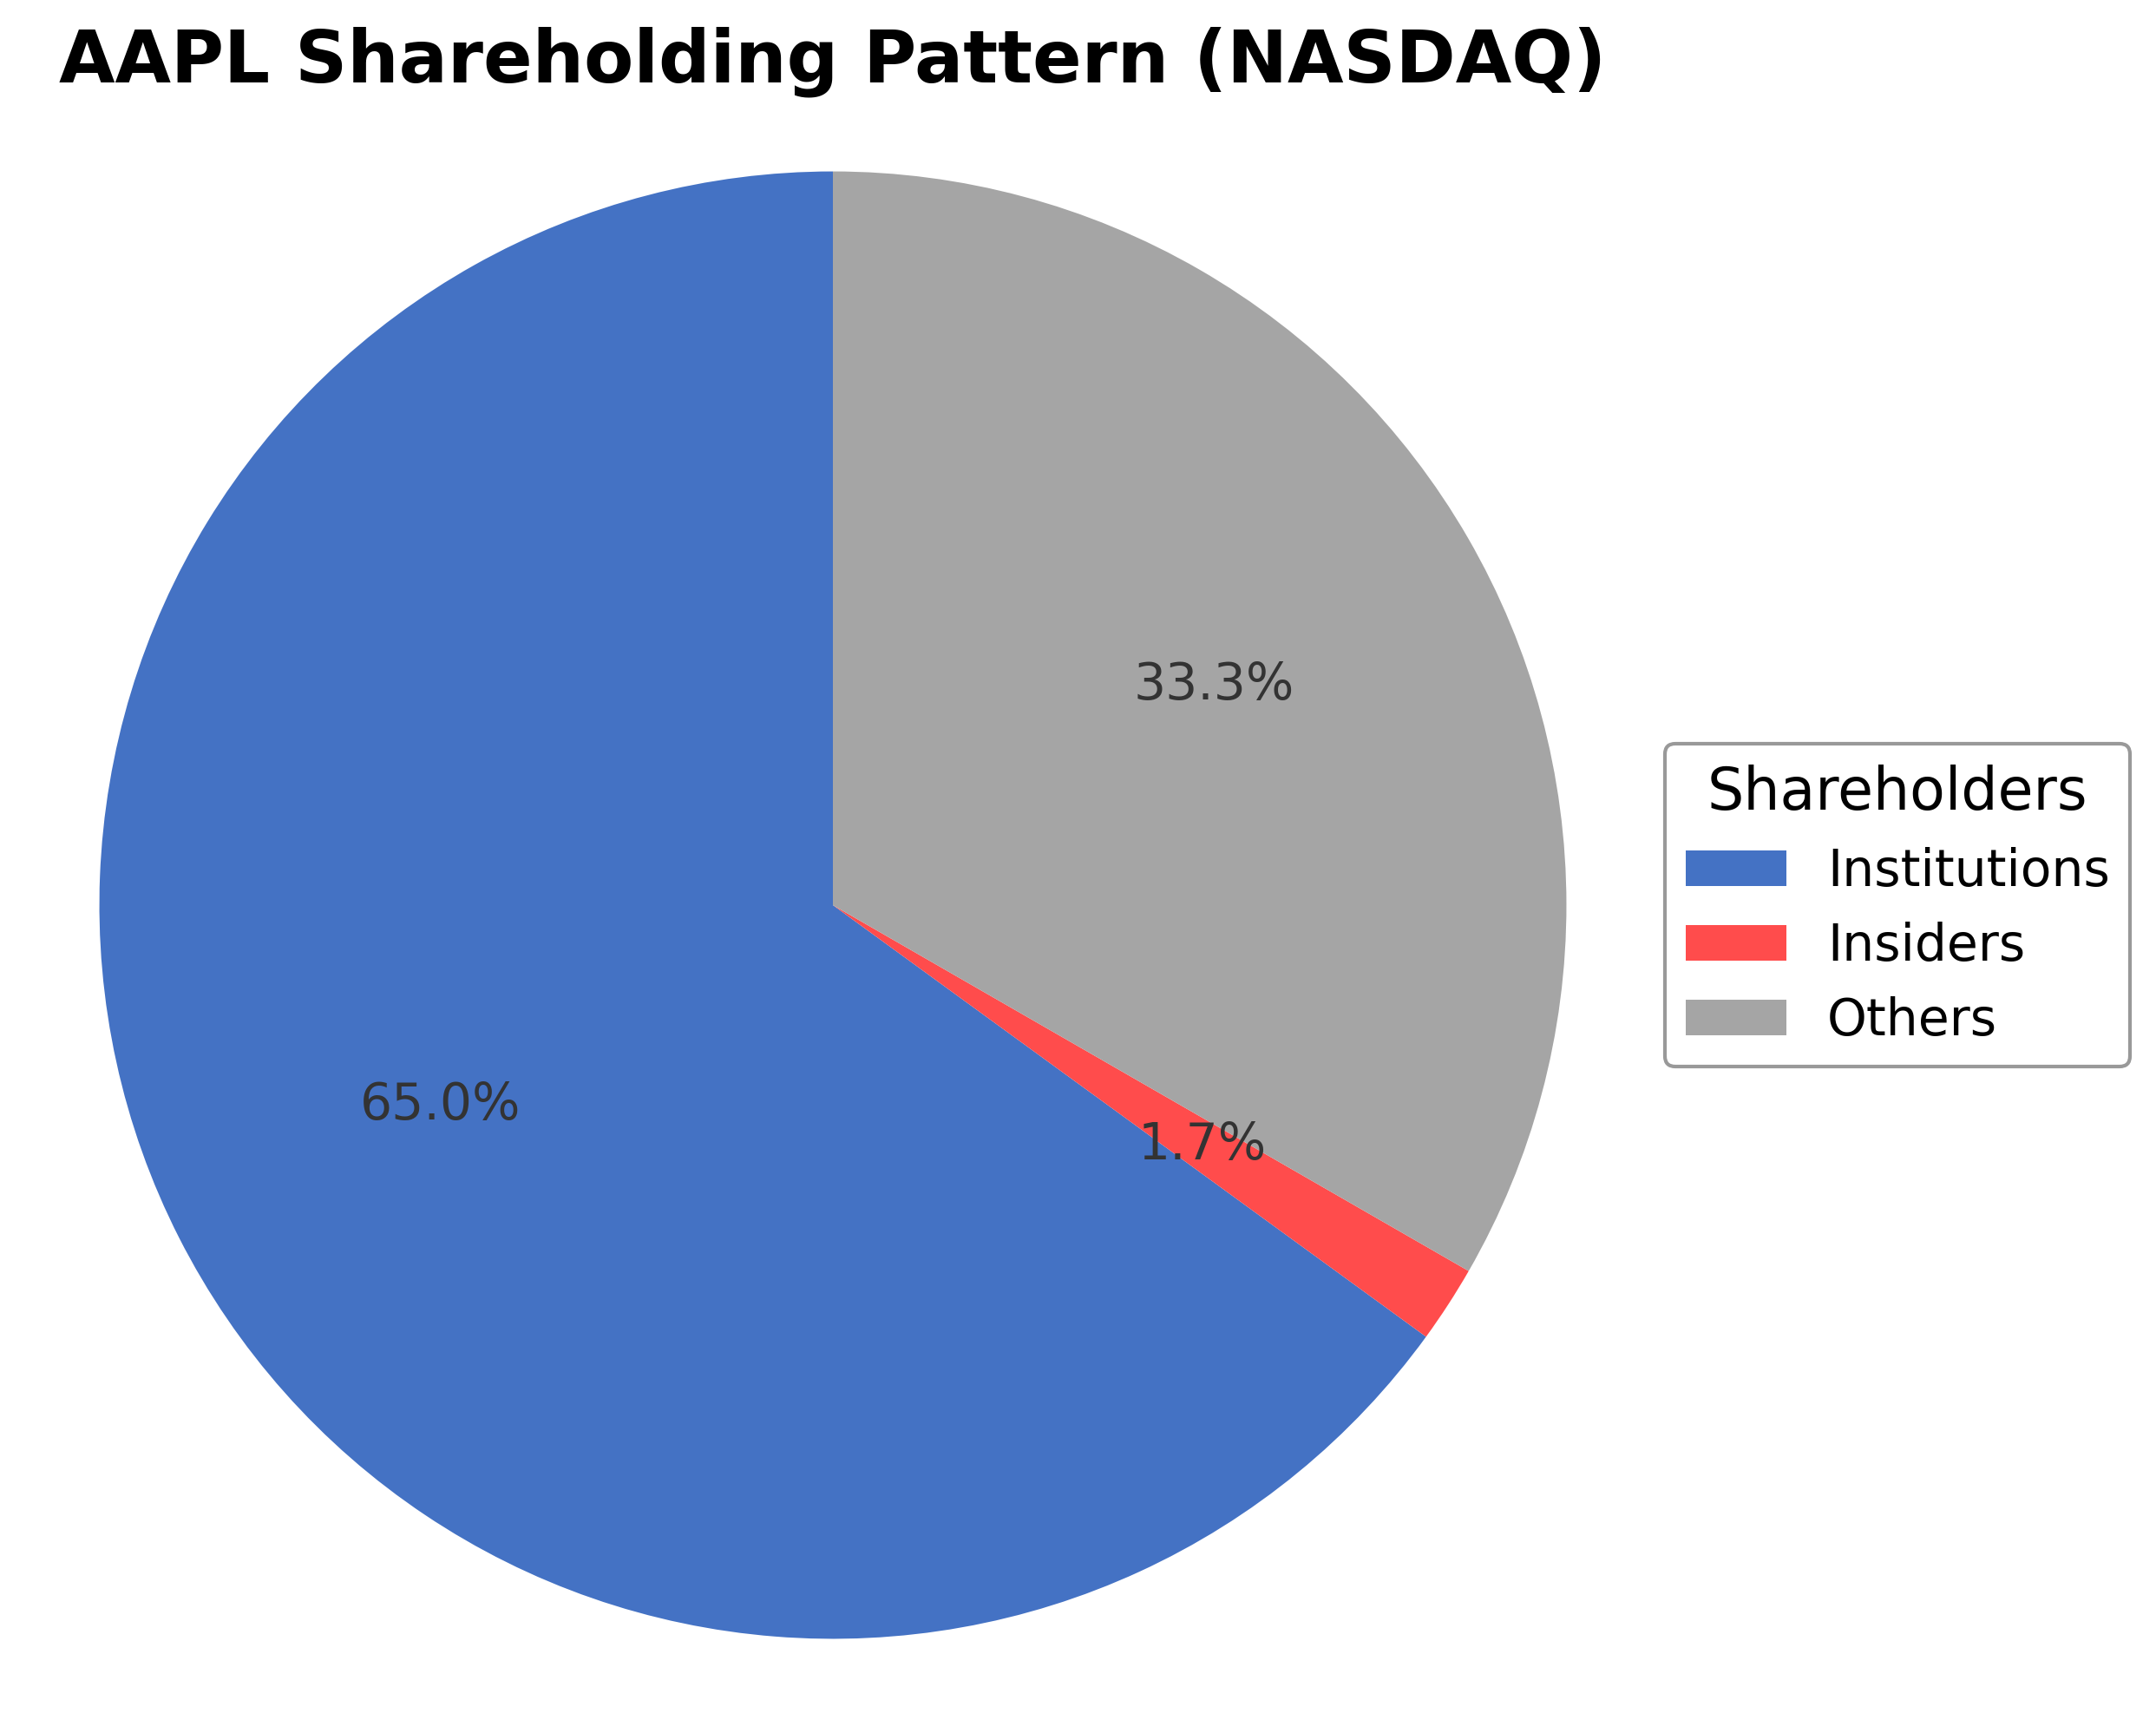
Apple Inc.'s ownership structure is characterized by a significant institutional investor presence at approximately 64.99%, complemented by public shareholders holding around 34.48%, and insiders accounting for about 1.70%. Over the past 12-24 months, institutional accumulation has been notable, with funds such as Mirova US LLC and Rather & Kittrell Inc. increasing their stakes, reflecting sustained confidence from major asset managers. These shareholding patterns suggest a stable governance environment with strong institutional oversight, which may influence strategic decisions and corporate actions. The company's position within the Consumer Electronics industry in the United States underscores its role as a market leader with substantial financial resources and innovation capabilities.
Sector and Industry Analysis
Apple Inc. (AAPL) operates primarily within the Technology sector, specifically in the Consumer Electronics and Software industries. This sector is characterized by rapid innovation, significant capital investment, and a broad global market. The global consumer electronics market alone is valued in the trillions of USD, driven by continuous demand for smartphones, personal computing devices, wearables, and digital services. Major players alongside Apple include Samsung, Google, Microsoft, and Huawei, each competing across hardware, software ecosystems, and service offerings. The sector’s growth trajectory remains robust, fueled by technological advancements such as 5G, artificial intelligence (AI), augmented reality (AR), and the Internet of Things (IoT), which expand the addressable market and create new revenue streams.
Industry trends highlight a shift towards integrated ecosystems that combine hardware, software, and cloud-based services. Apple’s business model exemplifies this with its iPhone-centric product line complemented by Macs, iPads, Apple Watch, and a growing suite of services including streaming, subscriptions, and AR applications. Consumer behavior increasingly favors seamless user experiences, privacy, and device interoperability, driving demand for tightly integrated platforms. Additionally, emerging opportunities lie in augmented reality, health and fitness technologies, and subscription-based digital content, where Apple is actively investing. The semiconductor industry’s evolution, including Apple’s in-house chip design and partnerships with foundries like TSMC, also underscores the importance of vertical integration and supply chain control in maintaining competitive advantage.
The regulatory landscape for Apple and its peers is complex and multifaceted, encompassing data privacy laws (e.g., GDPR in Europe, CCPA in California), antitrust scrutiny, intellectual property protections, and trade policies affecting global supply chains. Compliance with these regulations is critical, as governments worldwide intensify oversight on technology companies’ market power, data handling, and cross-border operations. For example, antitrust investigations into app store practices and digital marketplace fairness could impact Apple’s service revenues and ecosystem control. Additionally, export controls and tariffs influence manufacturing costs and sourcing strategies, necessitating agile compliance frameworks and risk management.
Competitive dynamics in the consumer technology industry are shaped by high barriers to entry, including substantial R&D expenditure, brand equity, global distribution networks, and ecosystem lock-in effects. Apple’s competitive positioning benefits from its strong brand loyalty, proprietary software-hardware integration, and scale economies. The market structure is oligopolistic, with a few dominant firms controlling significant market share and innovation leadership. New entrants face challenges in matching the incumbents’ technological capabilities, supply chain sophistication, and capital resources. However, competition remains intense, particularly in emerging segments like wearables and digital services, where agility and innovation speed are critical. Strategic partnerships, acquisitions, and continuous product innovation are essential for maintaining market leadership in this dynamic environment.
Note: Analysis synthesized from industry research, market reports, and regulatory filings. Information is subject to change based on market conditions.
Illustrative Scenario Analysis
DCF Assumptions:
Method: Two-Stage EPS-Priority Model
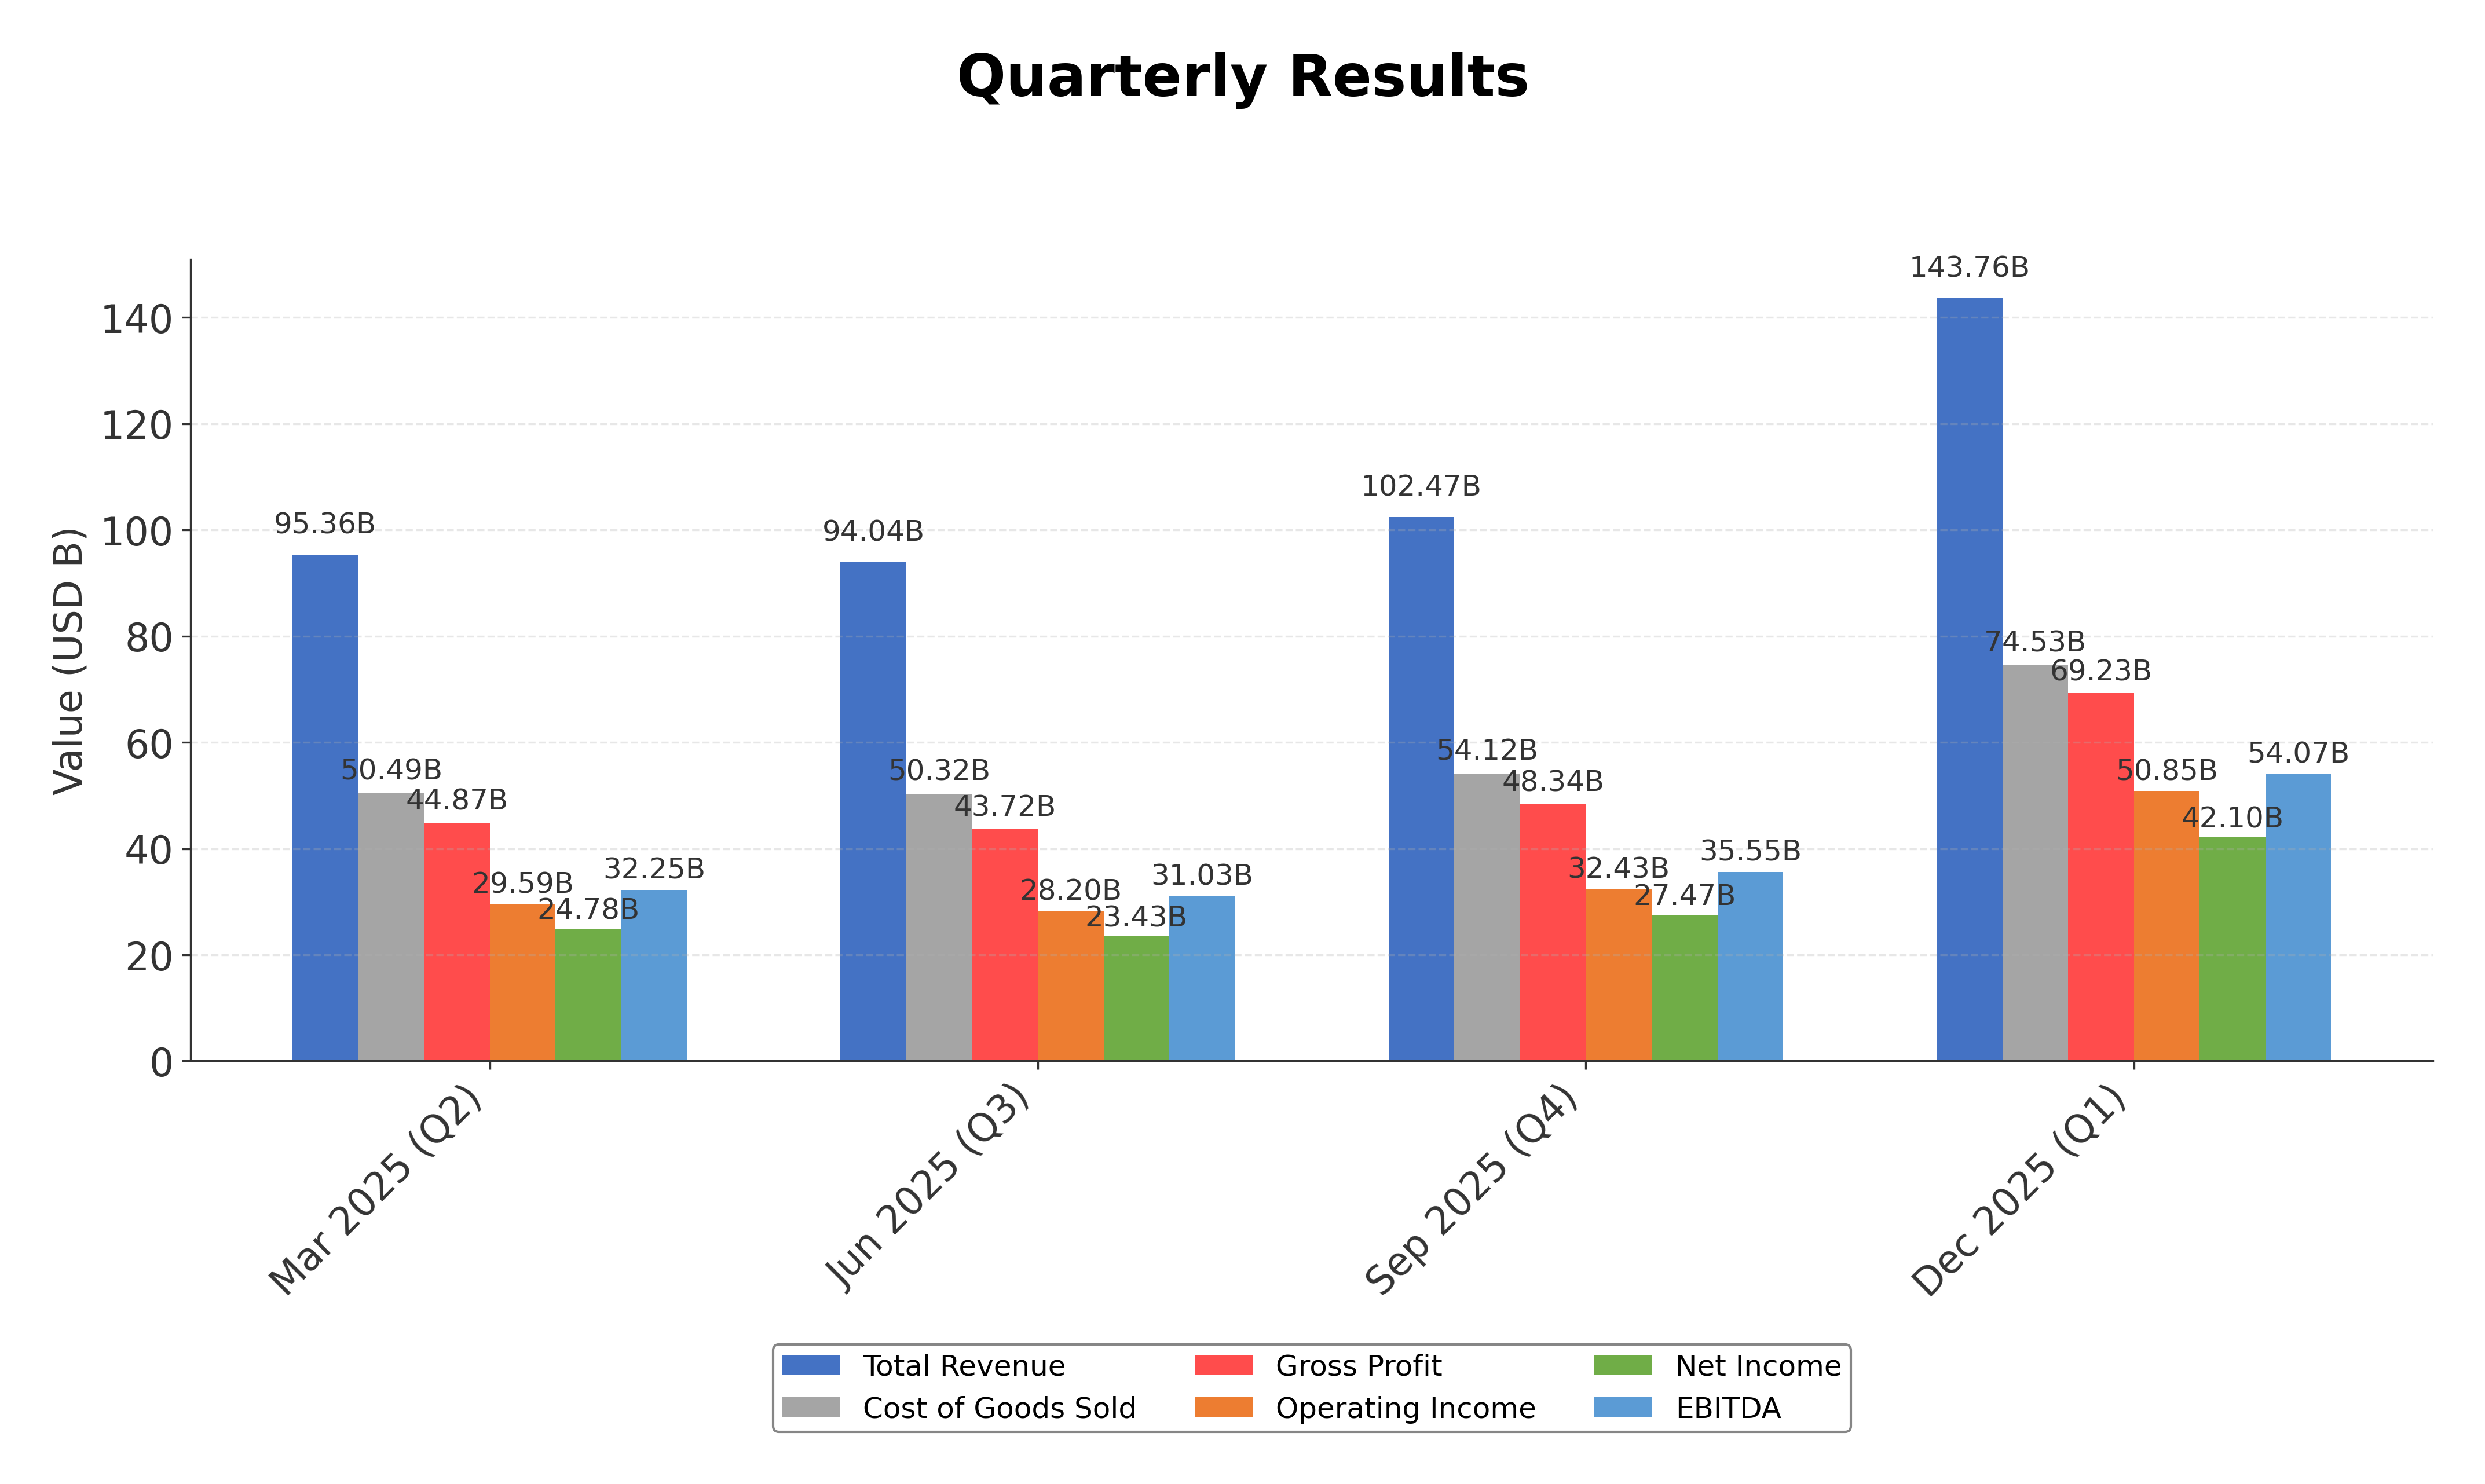
Financials
Peer Analysis
| Company Name | Market Cap | P/E Ratio | P/B Ratio | EV/EBITDA | Price to CFO |
|---|---|---|---|---|---|
| Apple Inc. | $4.09T | 34.97 | 46.00 | 26.65 | 30.17 |
| Sony Group Corporation - Sponsored American Depositary Receipt | $132.74B | 16.01 | 2.57 | 0.28 | 9.59 |
Comparison Analysis: Apple Inc. exhibits a substantially larger market capitalization and higher valuation multiples compared to its regional peer Sony Group Corporation. Apple's P/E ratio of 34.97 and price-to-book ratio of 46.00 considerably exceed Sony's 16.01 and 2.57 respectively, indicating a premium valuation aligned with its dominant market position and growth expectations. The enterprise value to EBITDA and price to CFO ratios also reflect Apple's higher valuation relative to peers, underscoring its strong profitability and cash flow generation within the Consumer Electronics industry.
Financial Metrics Comparison with Peers
Financial Statements
Comprehensive financial data including income, balance sheet, and cash flow metrics
Income Statement
| fiscal_date | 2025-09-30 | 2024-09-30 | 2023-09-30 | 2022-09-30 | 2021-09-30 |
|---|---|---|---|---|---|
| Sales | 416.16B | 391.04B | 383.29B | 394.33B | 365.82B |
| Cost Of Goods | 220.96B | 210.35B | 214.14B | 223.55B | 212.98B |
| Gross Profit | 195.20B | 180.68B | 169.15B | 170.78B | 152.84B |
| Operating Expense Research And Development | 34.55B | 31.37B | 29.91B | 26.25B | 21.91B |
| Operating Expense Selling General And Administrative | 27.60B | 26.10B | 24.93B | 25.09B | 21.97B |
| Operating Income | 133.05B | 123.22B | 114.30B | 119.44B | 108.95B |
| Other Income Expense | -321.00M | 269.00M | -565.00M | -334.00M | 60.00M |
| Pretax Income | 132.73B | 123.48B | 113.74B | 119.10B | 109.21B |
| Income Tax | 20.72B | 29.75B | 16.74B | 19.30B | 14.53B |
| Net Income | 112.01B | 93.74B | 97.00B | 99.80B | 94.68B |
| Eps Basic | 7.49 | 6.11 | 6.16 | 6.15 | 5.67 |
| Eps Diluted | 7.46 | 6.08 | 6.13 | 6.11 | 5.61 |
| Basic Shares Outstanding | 14.95B | 15.34B | 15.74B | 16.22B | 16.70B |
| Diluted Shares Outstanding | 14.95B | 15.34B | 15.74B | 16.22B | 16.70B |
| Ebit | 133.05B | 123.22B | 114.30B | 119.44B | 111.85B |
| Ebitda | 144.75B | 134.66B | 125.82B | 130.54B | 123.14B |
| Net Income Continuous Operations | 112.01B | 93.74B | 97.00B | 99.80B | 94.68B |
| Non Operating Interest Income | N/A | N/A | 3.75B | 2.83B | 2.84B |
| Non Operating Interest Expense | N/A | N/A | 3.93B | 2.93B | 2.65B |
Data provided by Twelve Data
Balance Sheet
| fiscal_date | 2025-12-31 | 2025-09-30 | 2025-06-30 | 2025-03-31 | 2024-12-31 |
|---|---|---|---|---|---|
| Cash And Cash Equivalents | 45.32B | 35.93B | 36.27B | 28.16B | 30.30B |
| Accounts Receivable | 39.92B | 39.78B | 27.56B | 26.14B | 29.64B |
| Total Assets | 379.30B | 359.24B | 331.50B | 331.23B | 344.08B |
| Total Liabilities | 291.11B | 285.51B | 265.67B | 264.44B | 277.33B |
| Long Term Debt | 76.69B | 78.33B | 82.43B | 78.57B | 83.96B |
| Shareholders Equity | 88.19B | 73.73B | 65.83B | 66.80B | 66.76B |
Data provided by Twelve Data
Cash Flow Statement
| fiscal_date | 2025-09-30 | 2024-09-30 | 2023-09-30 | 2022-09-30 | 2021-09-30 |
|---|---|---|---|---|---|
| Operating Activities Net Income | 112.01B | 93.74B | 97.00B | 99.80B | 94.68B |
| Operating Activities Depreciation | 11.70B | 11.45B | 11.52B | 11.10B | 11.28B |
| Operating Activities Stock Based Compensation | 12.86B | 11.69B | 10.83B | 9.04B | 7.91B |
| Operating Activities Other Non Cash Items | -89.00M | -2.27B | -2.23B | 1.01B | -4.92B |
| Operating Activities Accounts Receivable | -7.03B | -5.14B | -417.00M | -9.34B | -14.03B |
| Operating Activities Accounts Payable | 902.00M | 6.02B | -1.89B | 9.45B | 12.33B |
| Operating Activities Other Assets Liabilities | -18.87B | 2.77B | -4.27B | 1.57B | -1.53B |
| Operating Activities Operating Cash Flow | 111.48B | 118.25B | 110.54B | 123.52B | 100.94B |
| Investing Activities Capital Expenditures | -12.71B | -9.45B | -10.96B | -10.71B | -11.09B |
| Investing Activities Purchase Of Investments | -24.41B | -48.66B | -29.51B | -76.92B | -109.56B |
| Investing Activities Sale Of Investments | 53.80B | 62.35B | 45.51B | 67.36B | 106.48B |
| Investing Activities Other Investing Activity | -1.48B | -1.31B | -1.34B | -2.09B | -385.00M |
| Investing Activities Investing Cash Flow | 15.20B | 2.94B | 3.71B | -22.66B | -14.58B |
| Financing Activities Long Term Debt Issuance | 4.48B | 0.00 | 5.23B | 5.46B | 20.39B |
| Financing Activities Long Term Debt Payments | -10.93B | -9.96B | -11.15B | -9.54B | -8.75B |
| Financing Activities Short Term Debt Issuance | -2.03B | 3.96B | -3.98B | 3.96B | 1.02B |
| Financing Activities Common Stock Repurchase | -90.71B | -94.95B | -77.55B | -89.40B | -85.97B |
| Financing Activities Common Dividends | -15.42B | -15.23B | -15.03B | -14.84B | -14.47B |
| Financing Activities Other Financing Charges | -6.07B | -5.80B | -6.01B | -6.38B | -5.58B |
| Financing Activities Financing Cash Flow | -120.69B | -121.98B | -108.49B | -110.75B | -92.25B |
| End Cash Position | 35.93B | 29.94B | 30.74B | 24.98B | 35.93B |
| Income Tax Paid | 43.37B | 26.10B | 18.68B | 19.57B | 25.39B |
| Free Cash Flow | 98.77B | 108.81B | 99.58B | 111.44B | 92.95B |
| Interest Paid | N/A | N/A | 3.80B | 2.87B | 2.69B |
| Operating Activities Deferred Taxes | N/A | N/A | N/A | 895.00M | -4.77B |
| Investing Activities Net Acquisitions | N/A | N/A | N/A | -306.00M | -33.00M |
| Financing Activities Common Stock Issuance | N/A | N/A | N/A | N/A | 1.10B |
Data provided by Twelve Data
Technical Analysis
Key Insights
- Apple's stock is currently in an overall uptrend, trading above its 200-day moving average, reflecting sustained bullish price action over the long term.
- Key support levels are identified near $237.76 (200-day MA) and $268.57 (50-day MA), while resistance is observed around the recent 52-week high of $288.62.
- The stock price is positioned above the 10-day, 50-day, and 200-day moving averages, indicating positive momentum across short, medium, and long-term timeframes.
- Momentum indicators show mixed signals: RSI is moderate, MACD indicates a potential slowdown in bullish momentum, and Stochastic oscillators suggest the stock is neither overbought nor oversold.
- Multi-timeframe analysis reveals consistent upward trends on daily, weekly, and monthly charts, though recent price consolidation suggests a pause in momentum.
- Current technical setup suggests scenarios of either continuation of the uptrend if support levels hold or potential correction if resistance near the 52-week high proves strong.
Trending News
1. Headline: Mirova US LLC Boosts Apple Inc Stake by 15,420 Shares
Summary: Mirova US LLC, managed by Philippe Zaouati, recently increased its holdings in Apple Inc. by 15,420 shares, signaling confidence in the company's prospects. This institutional accumulation reflects positive sentiment among asset managers and may influence market perception of Apple's growth potential.
Sentiment: Positive
2. Headline: Here's Why Apple’s Stock Dropped 5% Today
Summary: Apple's shares experienced a 5% decline, marking the worst day since April, driven by a series of negative news including regulatory scrutiny and product delays. The drop reflects market concerns about near-term challenges facing the company despite its strong fundamentals.
Sentiment: Negative
3. Headline: Apple's stock has worst day since April as iPhone maker faces FTC scrutiny, reports of Siri delay
Summary: Apple faces regulatory pressure from the FTC concerning potential political bias in its services, alongside reported delays in the Siri virtual assistant upgrade. These developments have contributed to increased market volatility and investor caution.
Sentiment: Negative
4. Headline: Apple Is Facing FTC Scrutiny Over Apple News Content Bias Claims
Summary: The FTC has raised concerns regarding alleged ideological bias in Apple News content curation, with public statements condemning censorship efforts. This regulatory scrutiny poses reputational and operational risks for Apple as it navigates content moderation challenges.
Sentiment: Negative
5. Headline: Here are Thursday's biggest analyst calls of the day: Nvidia, Apple, Shopify, McDonald's, Kraft Heinz & more
Summary: Wall Street analysts released key calls on major stocks including Apple, reflecting a range of perspectives on the company's valuation and growth prospects amid current market conditions.
Sentiment: Neutral
Powered by Brave
Recent Updates
News Summary
Recent news highlights a mix of regulatory scrutiny and institutional interest surrounding Apple Inc. The U.S. Federal Trade Commission has expressed concerns about alleged political bias in Apple News, while Apple's planned Siri upgrade faces delays during internal testing. Despite these challenges, institutional investors such as Mirova US LLC have increased their holdings, signaling confidence in the company's long-term prospects. Market reactions have been mixed, with Apple's stock experiencing notable declines amid the negative news flow. These developments underscore the dynamic environment Apple operates within, balancing innovation and regulatory pressures while maintaining strong investor support.
News Sentiment
Sentiment analysis reveals a predominantly neutral to negative tone in recent news, driven by regulatory investigations and product development delays. Positive signals emerge from institutional accumulation and analyst commentary emphasizing Apple's resilience. The juxtaposition of these sentiments suggests cautious market sentiment with attention to both risks and underlying strengths.
Analytical Overview
Analysis Summary
Valuation Metrics: Apple's P/E ratio of 34.97 and forward P/E of 29.74 are elevated relative to the industry average of 34.97, reflecting premium valuation consistent with its market leadership and growth expectations.
Growth Trajectory: The company exhibits strong growth with quarterly revenue growth of 15.7% and earnings growth of 15.9% year-over-year, supported by robust cash flow generation.
Financial Health: Apple maintains a healthy financial position with a debt-to-equity ratio near 0.95 and significant operating cash flow of $135.5 billion, indicating solid liquidity and manageable leverage.
Sector Specific Factors: The Consumer Electronics sector faces challenges including regulatory scrutiny and supply chain constraints, while opportunities exist in expanding digital services and AI integration.
Market Positioning: Apple's strong brand, diversified product ecosystem, and substantial institutional ownership provide competitive advantages in a dynamic technology landscape.
Investment Conclusion
Supporting Factors: Robust revenue and earnings growth with strong cash flow generation.
Risk Factors: Ongoing regulatory scrutiny by the FTC impacting operations.
SWOT Analysis
Strengths
- Market leadership with a diversified product and services ecosystem.
- Strong financial performance with high profit margins and cash flow.
- Robust institutional ownership supporting governance and stability.
- Global brand recognition and innovation capabilities.
Weaknesses
- High valuation multiples relative to industry peers.
- Dependence on flagship products like the iPhone for revenue.
- Current ratio below 1 indicating tight short-term liquidity.
- Exposure to product development delays impacting timelines.
Opportunities
- Expansion of digital services and subscription offerings.
- Integration of artificial intelligence across product lines.
- Growth in emerging markets and enterprise segments.
- Potential for strategic partnerships and acquisitions.
Threats
- Regulatory scrutiny and investigations by the FTC.
- Competitive pressures from other technology and electronics firms.
- Supply chain disruptions affecting product availability.
- Negative market sentiment driven by news and delays.
Company Description
Apple Inc. is a leading technology company specializing in hardware, software, and services. Founded in 1976 and headquartered at One Apple Park Way in Cupertino, California, it designs, manufactures, and markets innovative products including the iPhone smartphones, Mac computers, iPad tablets, and wearables such as AirPods and Apple Watch. Apple Inc. also provides digital services like the App Store, Apple Music, iCloud, and subscription offerings including Apple Fitness+ and Apple TV+. Operating in the **Technology Hardware, Storage and Peripherals** industry within the broader Tech sector, the company serves consumers, businesses, and governments worldwide through online platforms, retail stores, and carrier partnerships. With approximately 164,000 employees and a substantial market presence evidenced by shares outstanding of 15.02 billion, Apple Inc. maintains strong financials, including trailing twelve-month revenue of $400.37 billion and high gross margins around 46.91%. Its global stock listings and enduring influence underscore its pivotal role in driving technological advancement and consumer electronics markets.