
Apple Inc (AAPL)
Stock Analysis Report
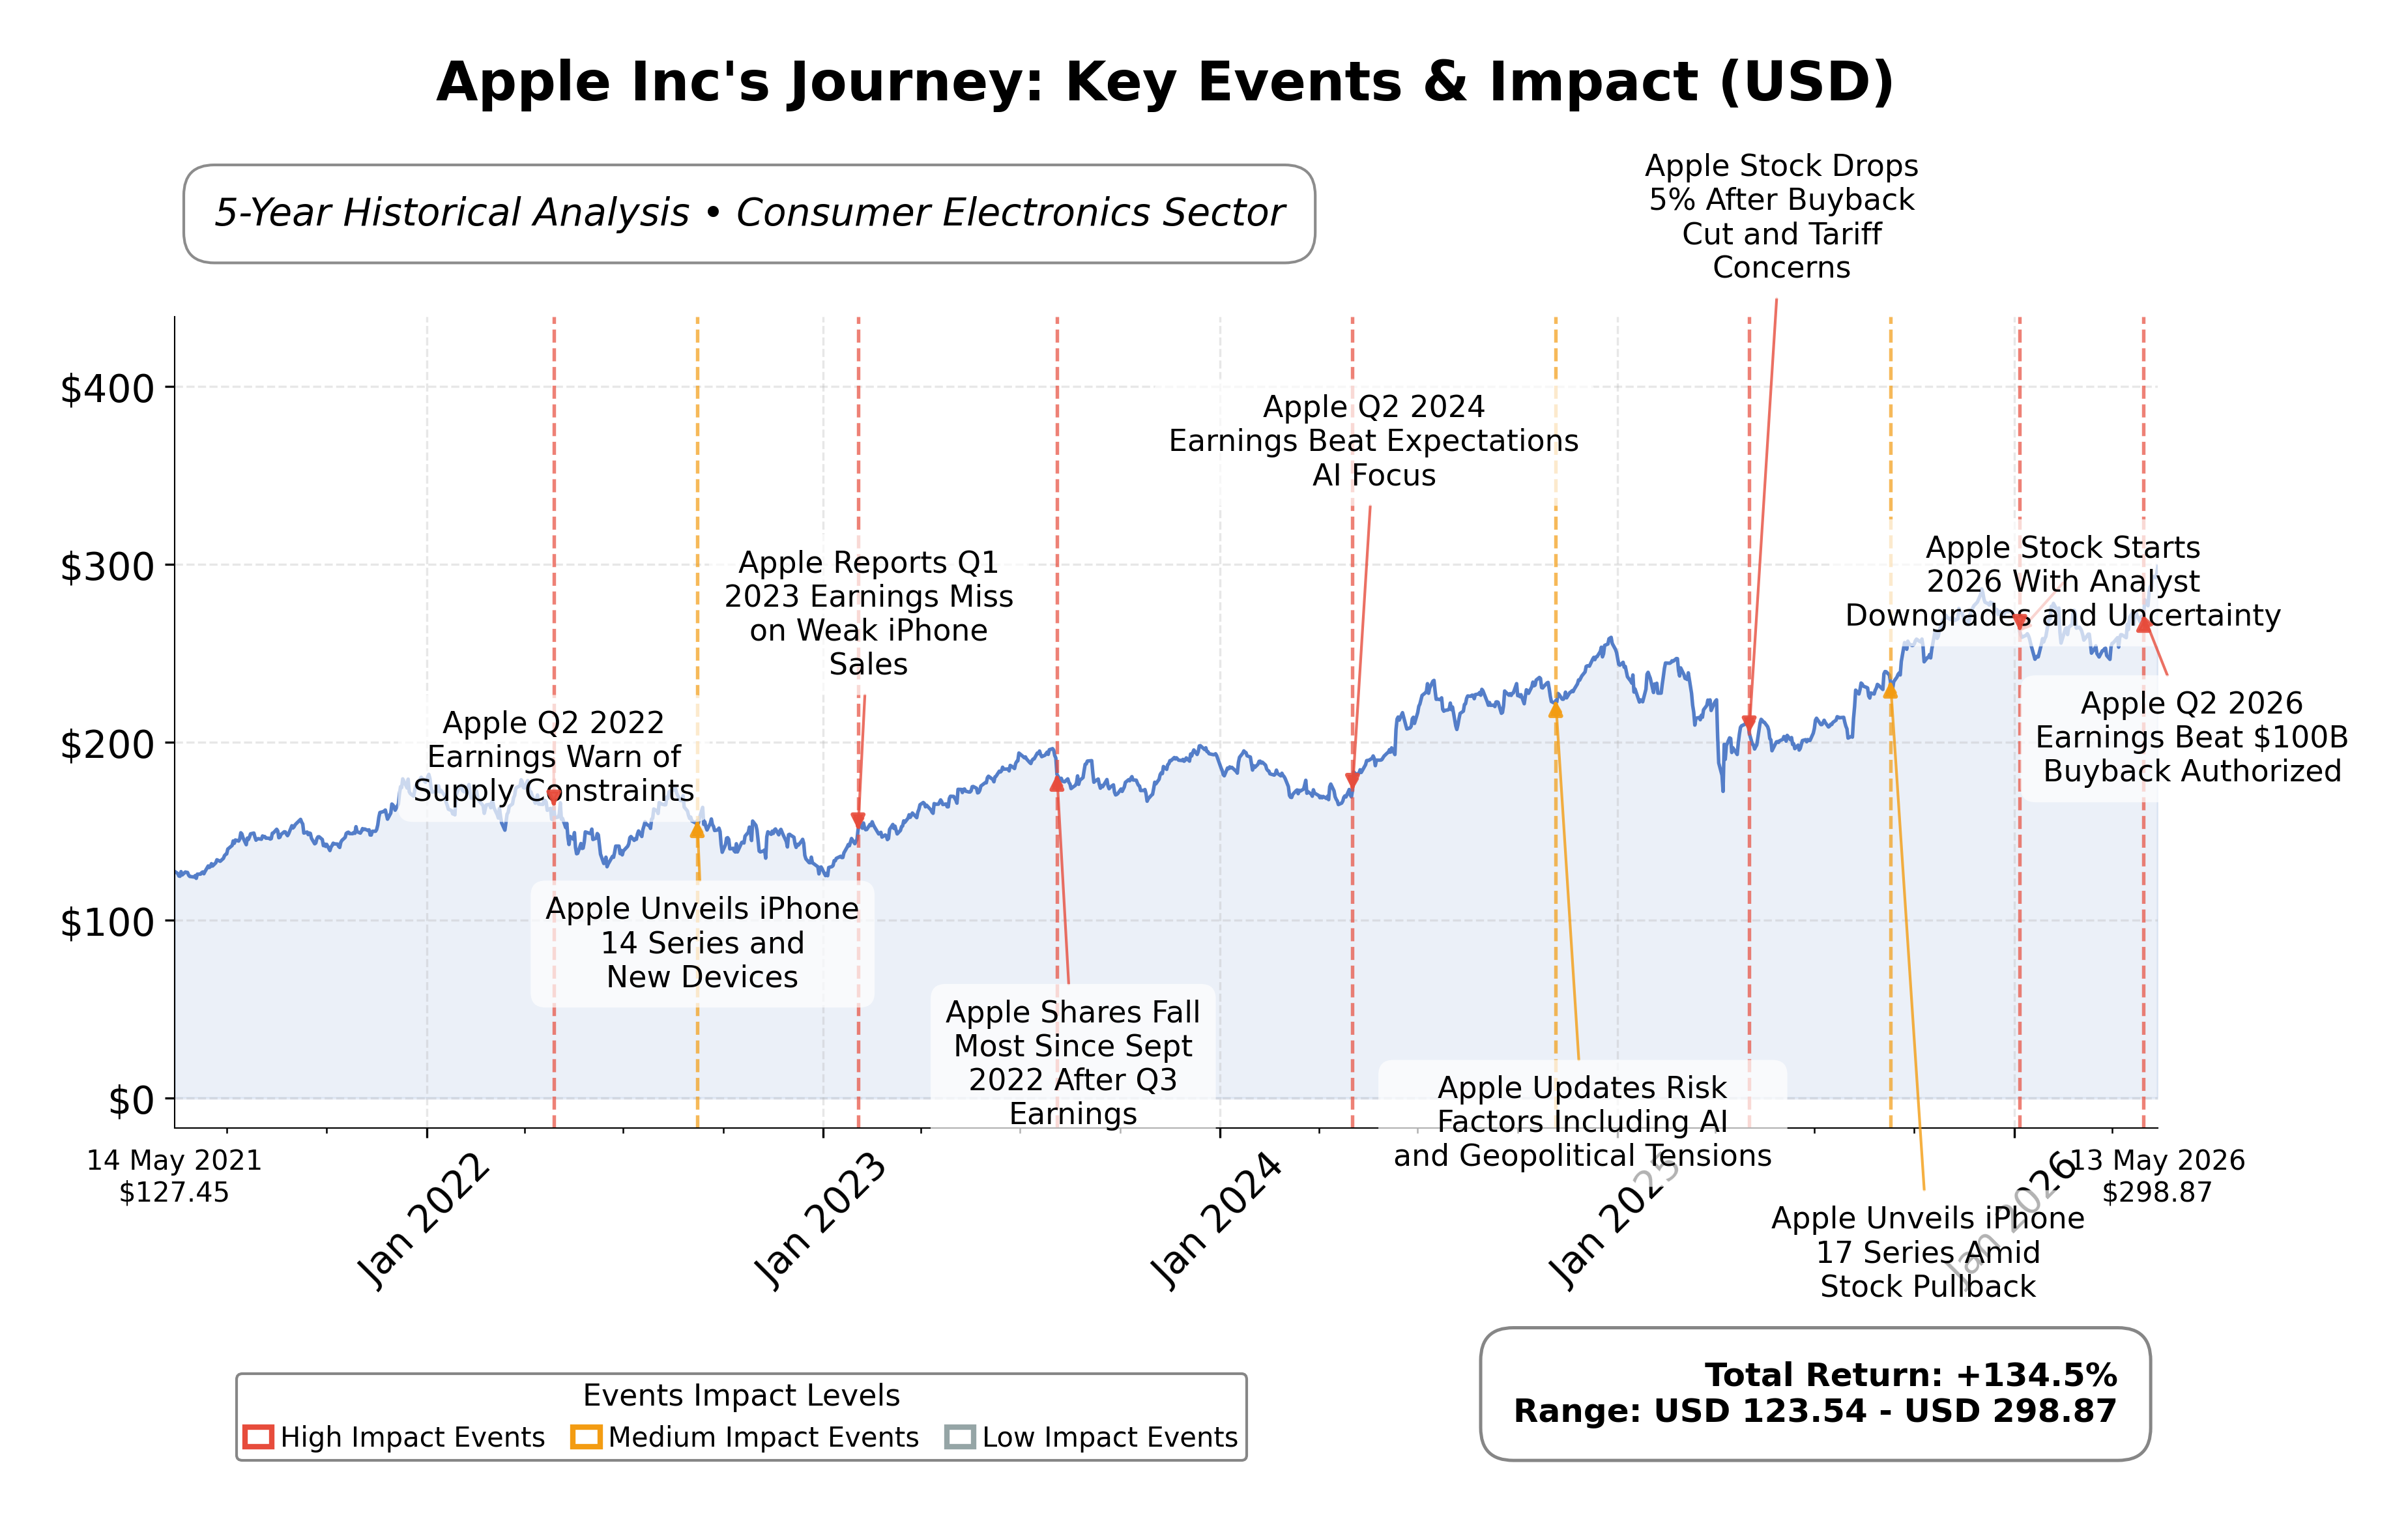
Stock Journey
Key Positives and Key Risks
Pros
- Strong free cash flow of $101.1 billion supports operational flexibility and shareholder returns.
- Robust profitability with a net profit margin of 27.15% and return on equity of 141.47%.
- Market capitalization of $4.31 trillion reflects dominant industry position and investor confidence.
Cons
- High price-to-book ratio of 40.40 indicates premium valuation that may limit upside.
- Execution risk due to reliance on Intel for chip manufacturing with delayed production timelines.
- Total debt of $84.7 billion and debt-to-equity ratio of 79.55% introduce leverage considerations.
Disclosure: This information is for general awareness and does not constitute investment advice
Report Summary
Apple Inc. operates as a leading technology company primarily engaged in designing, manufacturing, and marketing consumer electronics and software products. Listed on NASDAQ under the technology sector, Apple’s flagship product, the iPhone, dominates its revenue streams, complemented by Mac computers, iPads, wearables, and a growing services segment including the App Store and Apple Music. The company maintains a significant global footprint with a workforce of approximately 166,000 employees and a vast distribution network spanning online and physical retail channels.
Financially, Apple reported trailing twelve months (TTM) revenue of approximately $451.4 billion with a gross margin of 49.27%, operating margin of 32.28%, and net profit margin of 27.15%. The company’s return on equity (ROE) stands at 141.47%, and return on assets (ROA) at 26.23%, indicating exceptional profitability and efficient asset utilization. Operating cash flow for the TTM is $140.2 billion, with free cash flow at $101.1 billion, underscoring robust cash generation capabilities supporting ongoing investments and shareholder returns.
Apple’s valuation metrics reflect a trailing price-to-earnings (P/E) ratio of 35.47 and a forward P/E of 30.68, with a price-to-book (P/B) ratio of 40.40 and an enterprise value to EBITDA (EV/EBITDA) multiple of 27.03. The market capitalization is approximately $4.31 trillion, with the stock trading near its 52-week high of $294.76, currently priced at $298.40. These multiples suggest a premium valuation relative to fundamentals, consistent with its market leadership and growth prospects.
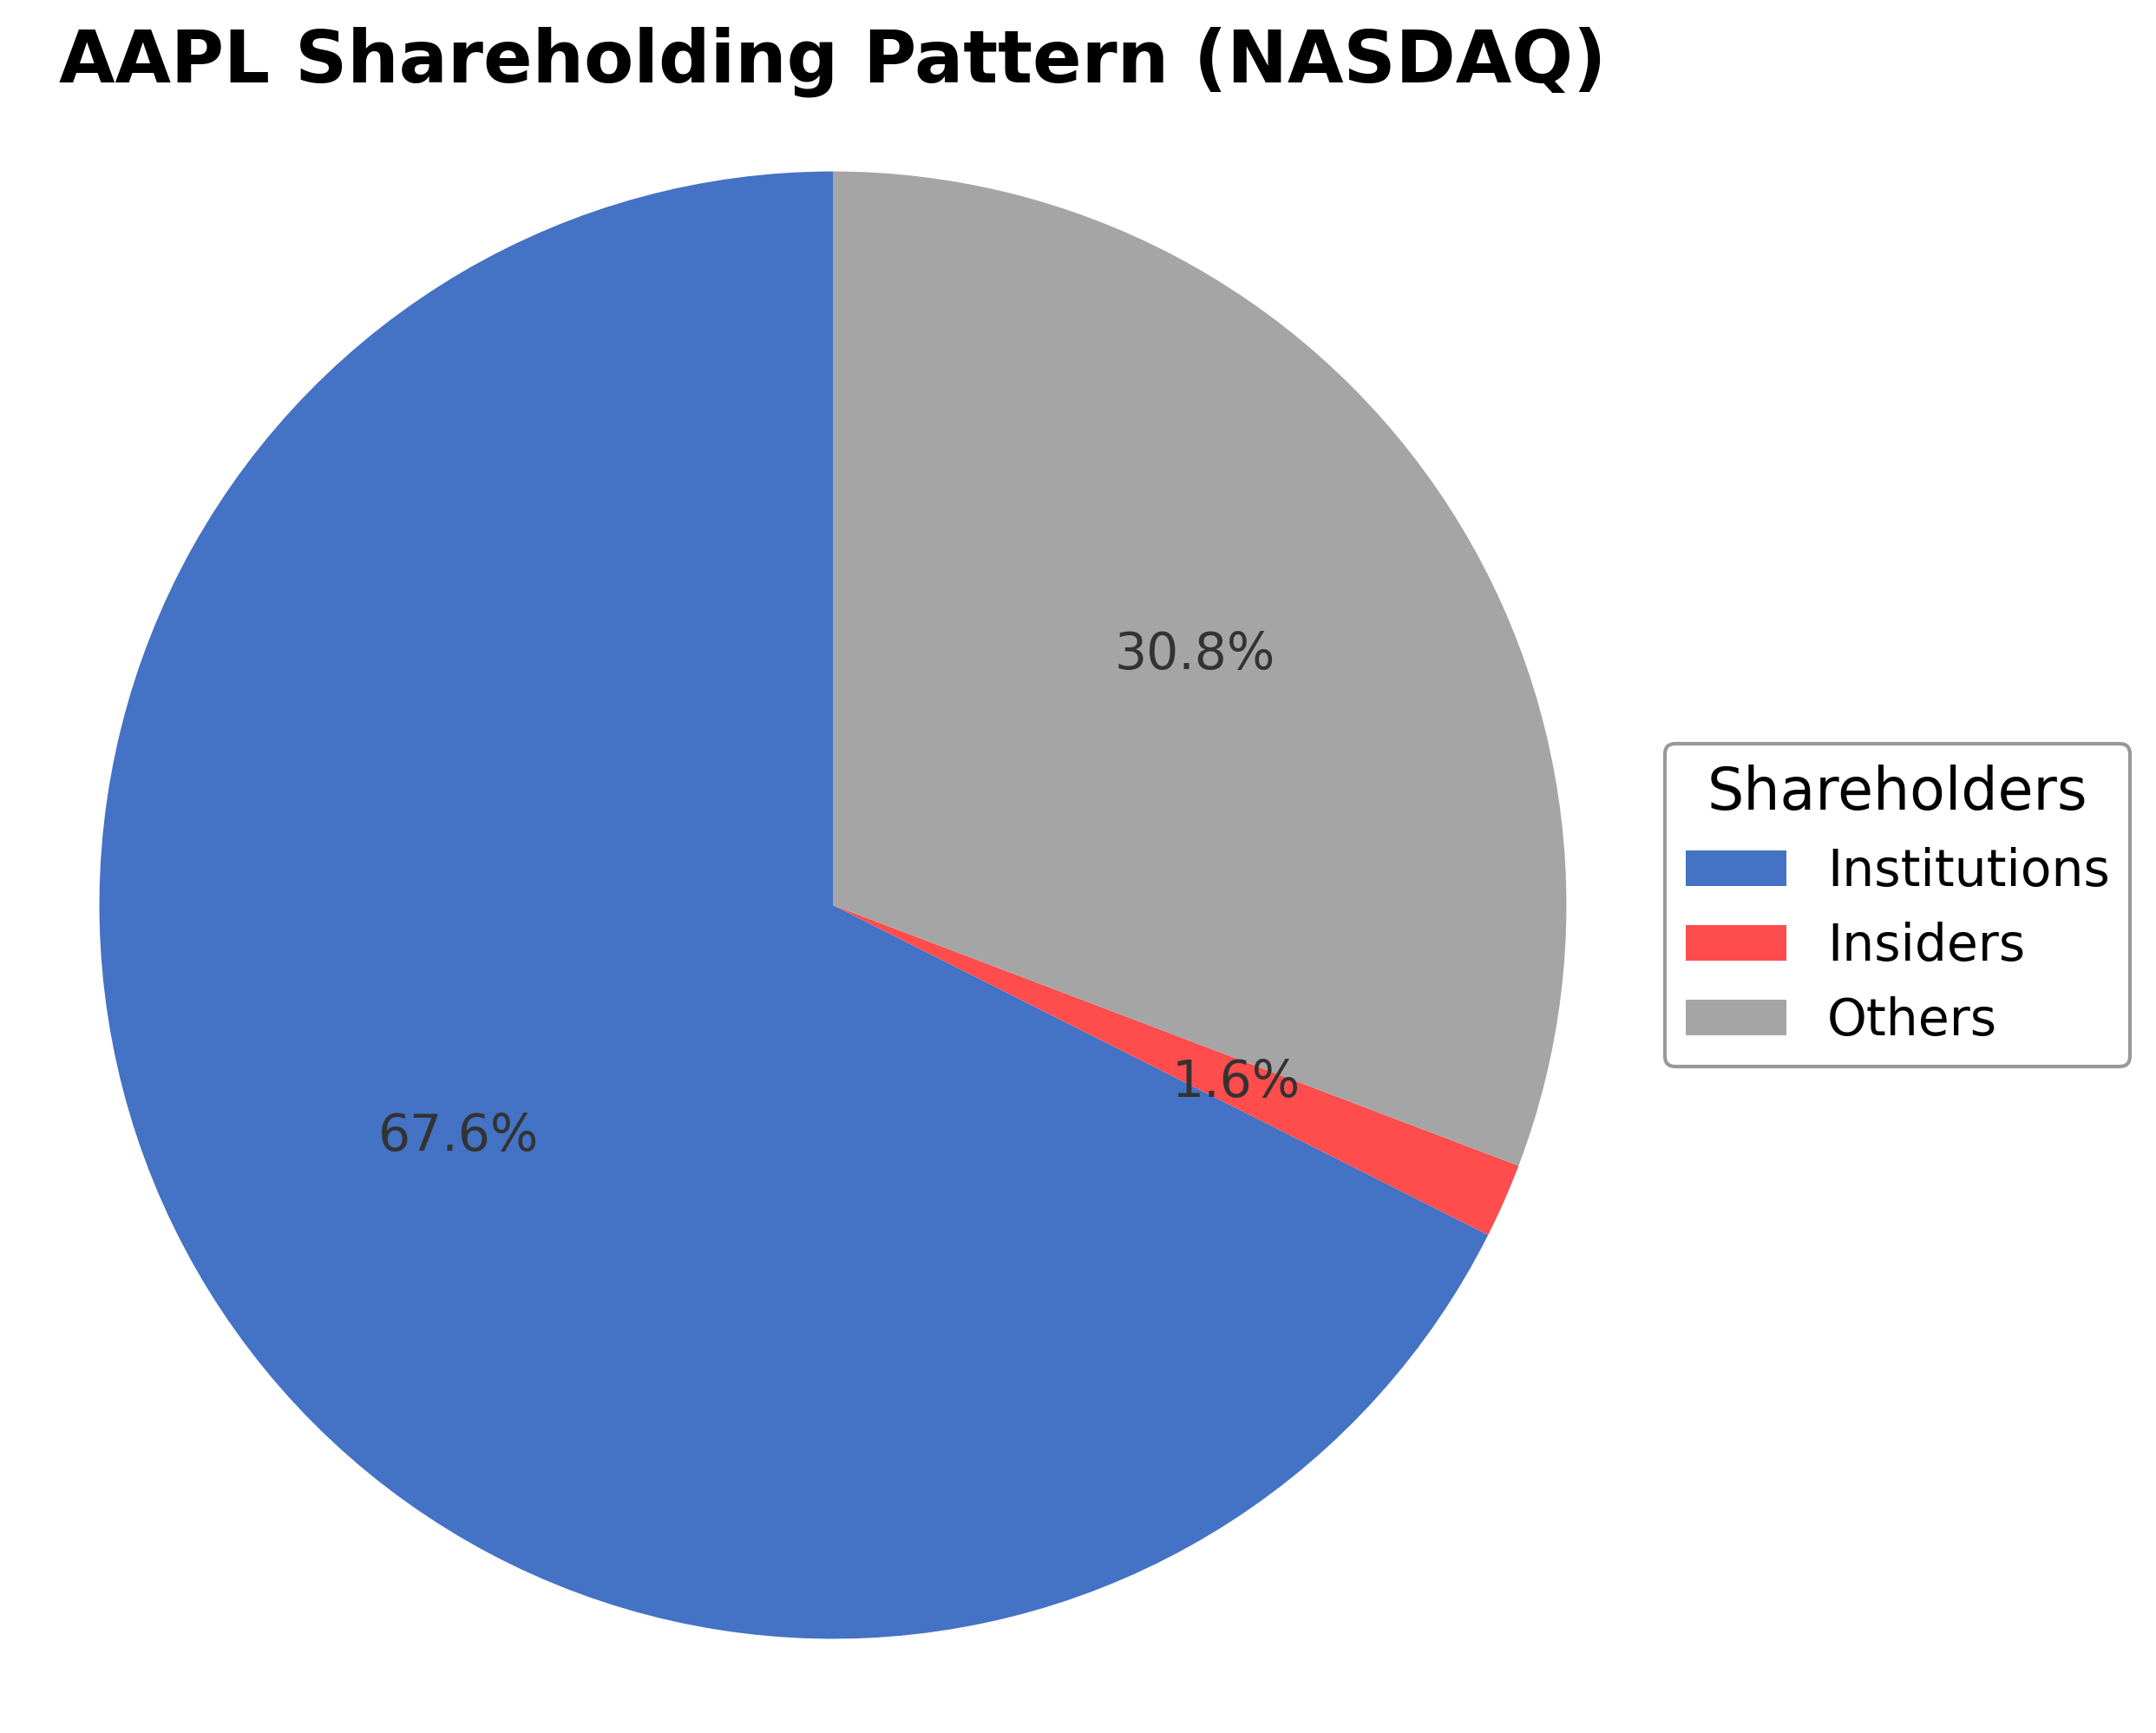
Key strengths include strong free cash flow generation, a dominant market position in consumer electronics, and a diversified product and services ecosystem. Risks involve supply chain execution challenges highlighted by the recent decision to partner with Intel for chip manufacturing, which carries execution risk given Intel’s delayed production timelines. Recent strategic moves include AI-focused software updates announced for the upcoming WWDC26 and acquisitions that reinforce innovation priorities. Institutional ownership remains significant, although some recent portfolio adjustments by investors were noted.
Technically, Apple’s stock exhibits an upward trend, trading above its 50-day and 200-day moving averages, with momentum indicators reflecting positive price action. The stock’s recent record highs and strong volume support a continuation of bullish sentiment, tempered by the need to monitor supply chain developments and broader macroeconomic factors. Overall, market conditions suggest a balanced environment for monitoring performance and potential portfolio adjustments.
Company and Industry Overview
Company Basics
Price Performance
Company Size
Shareholding Pattern
Sector and Industry Analysis
The global apple market is projected to grow by USD 15.94 billion from 2024 to 2029, with a compound annual growth rate (CAGR) of 3.4%. This growth is supported by increasing consumer demand driven by health benefits and the introduction of new apple varieties. The market features around 25 key vendors, including Auvil Fruit Co. Inc., Batlow Fruit Co. Pty Ltd, and Stemilt Growers LLC, which collectively shape the competitive landscape.
Industry trends highlight the rising popularity of urban farming and the expansion of retail channels, including both offline and online distribution. Private-label brands are gaining traction, intensifying competition among established players. Barriers to entry remain moderate due to the need for extensive supply chain networks and brand recognition, while innovation in product offerings and marketing strategies continues to influence market positioning.
The regulatory environment impacting the apple market includes food safety standards and import-export regulations that vary by region, influencing supply chain operations and market access. Compliance with these regulations is critical for maintaining market presence and consumer trust. The outlook suggests that evolving regulatory frameworks will continue to shape operational practices and may affect cost structures within the industry.
Note: Analysis synthesized from industry research, market reports, and regulatory filings. Information is subject to change based on market conditions.
Financial Ratios Dashboard
Illustrative Scenario Analysis
DCF Assumptions:
Method: Two-Stage EPS-Priority Model
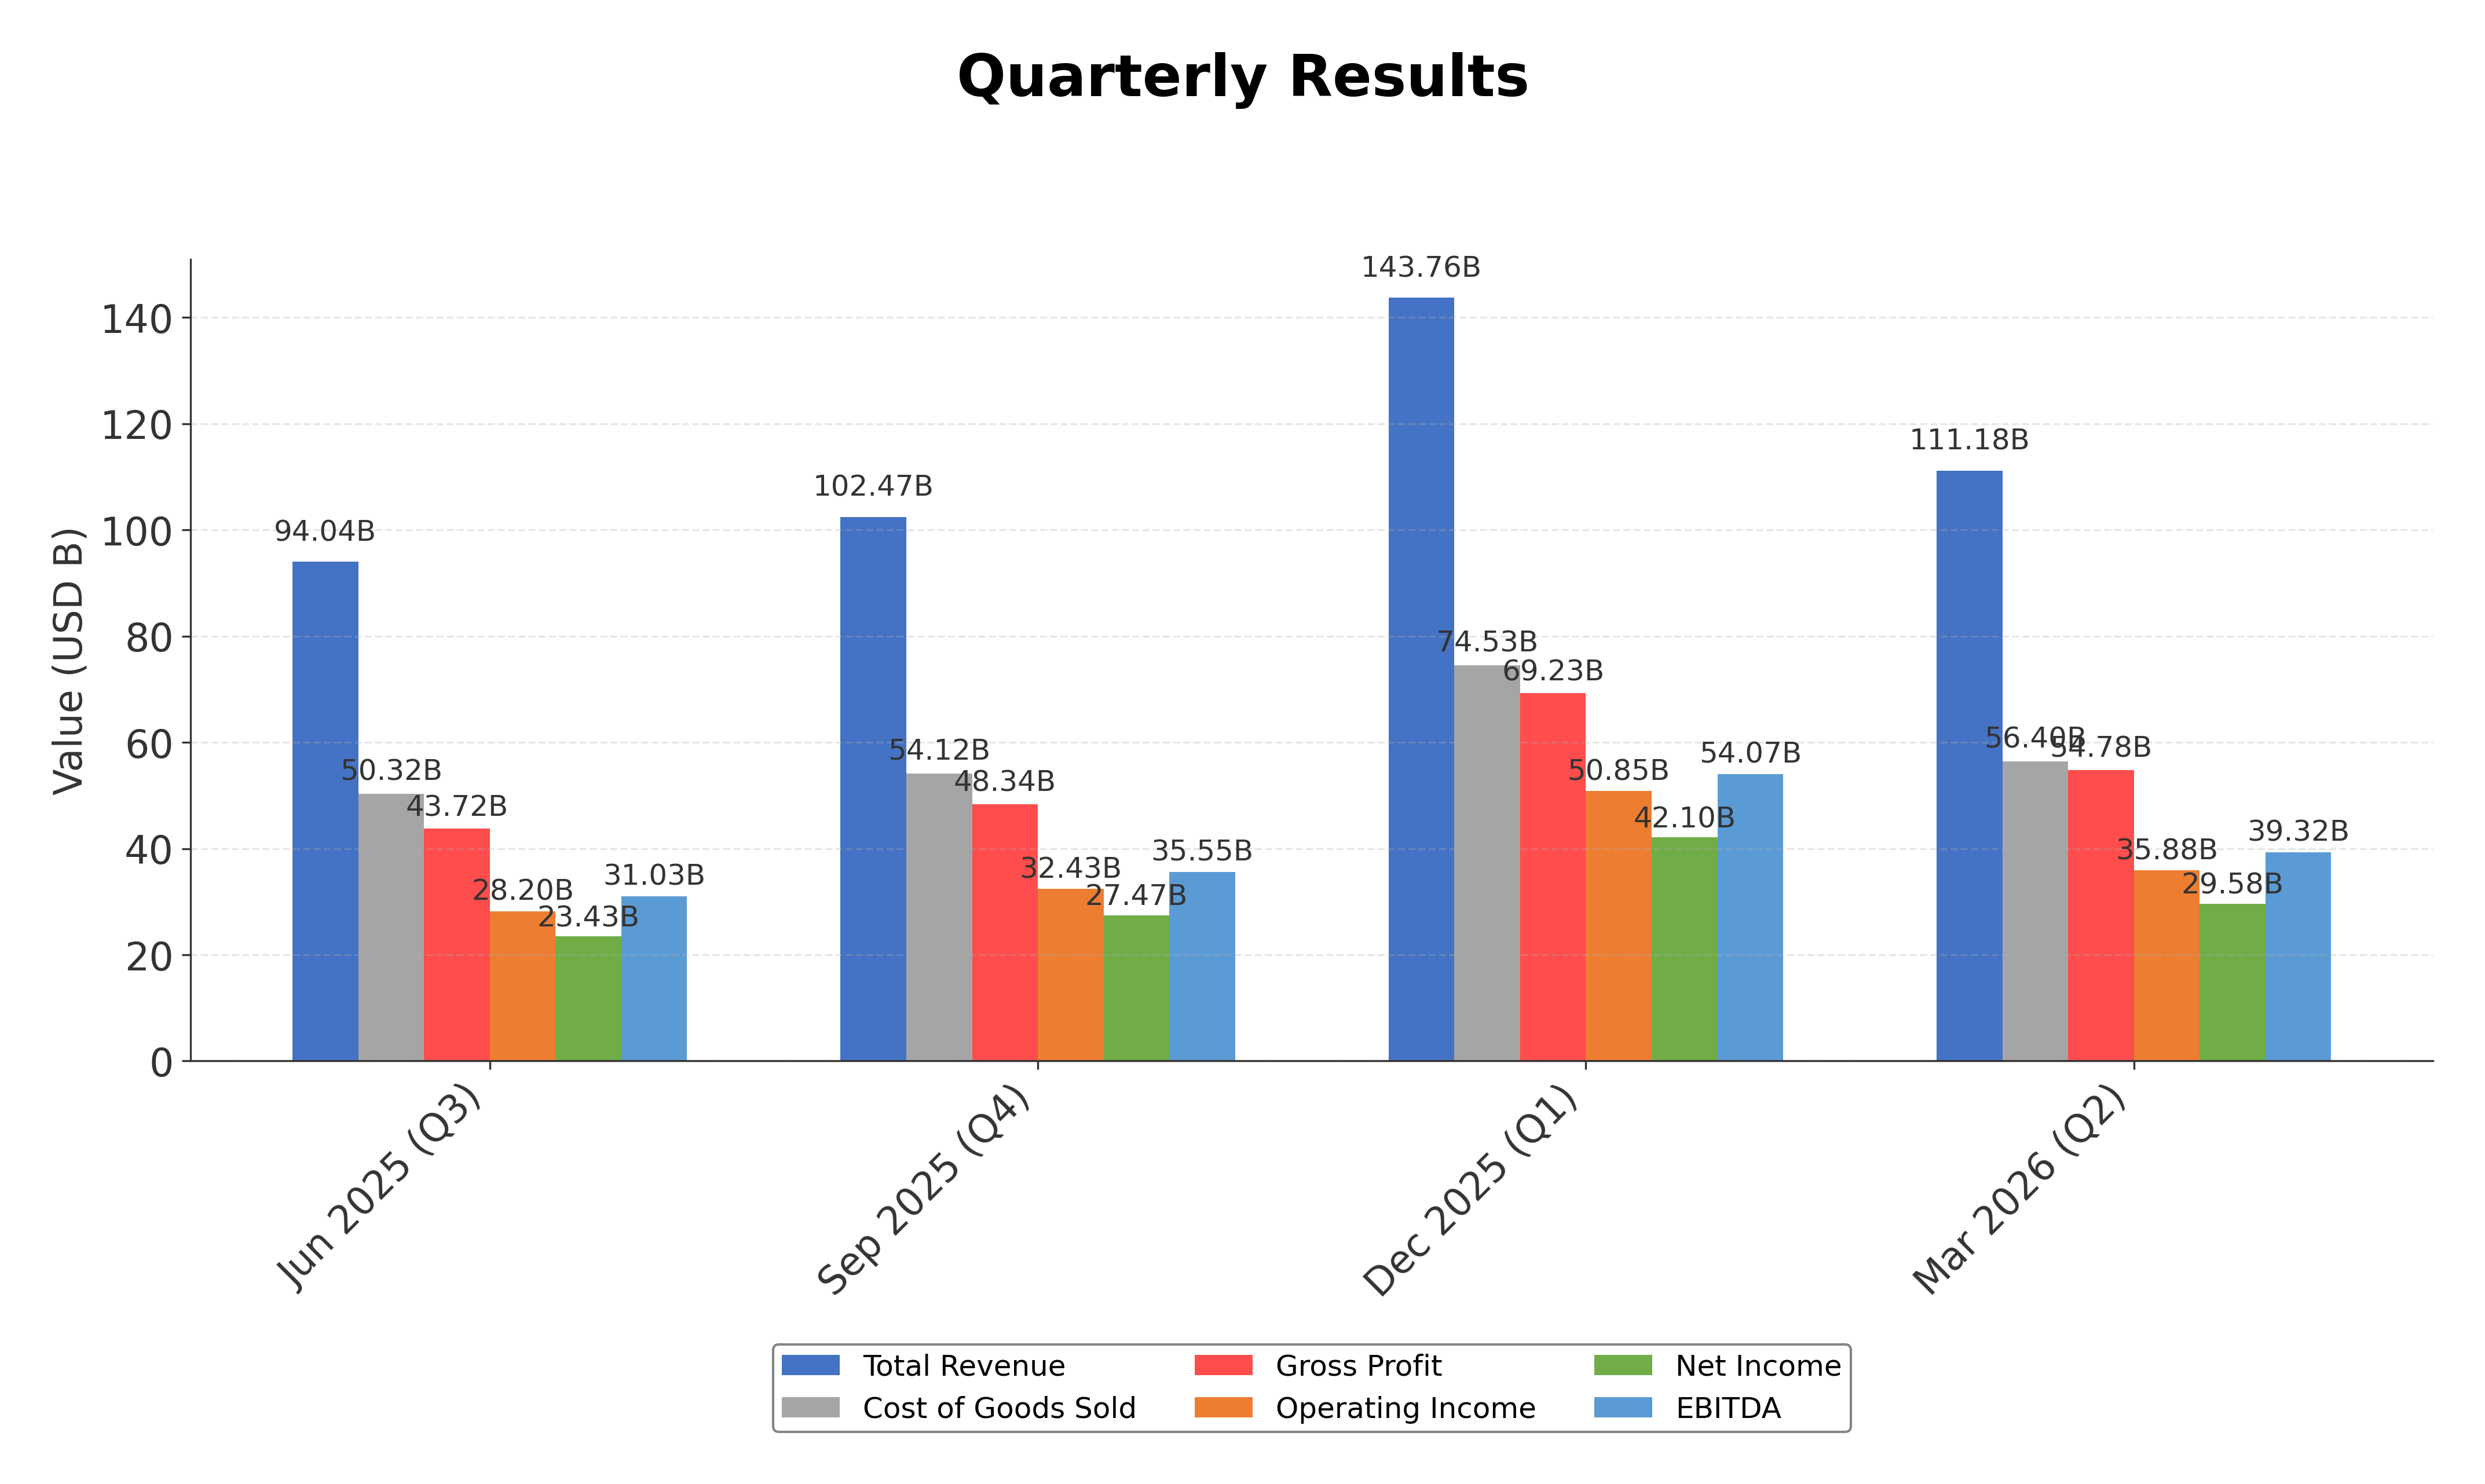
Financials
Peer Analysis
| Company Name | Market Cap | P/E Ratio | P/B Ratio | EV/EBITDA | Price to CFO |
|---|---|---|---|---|---|
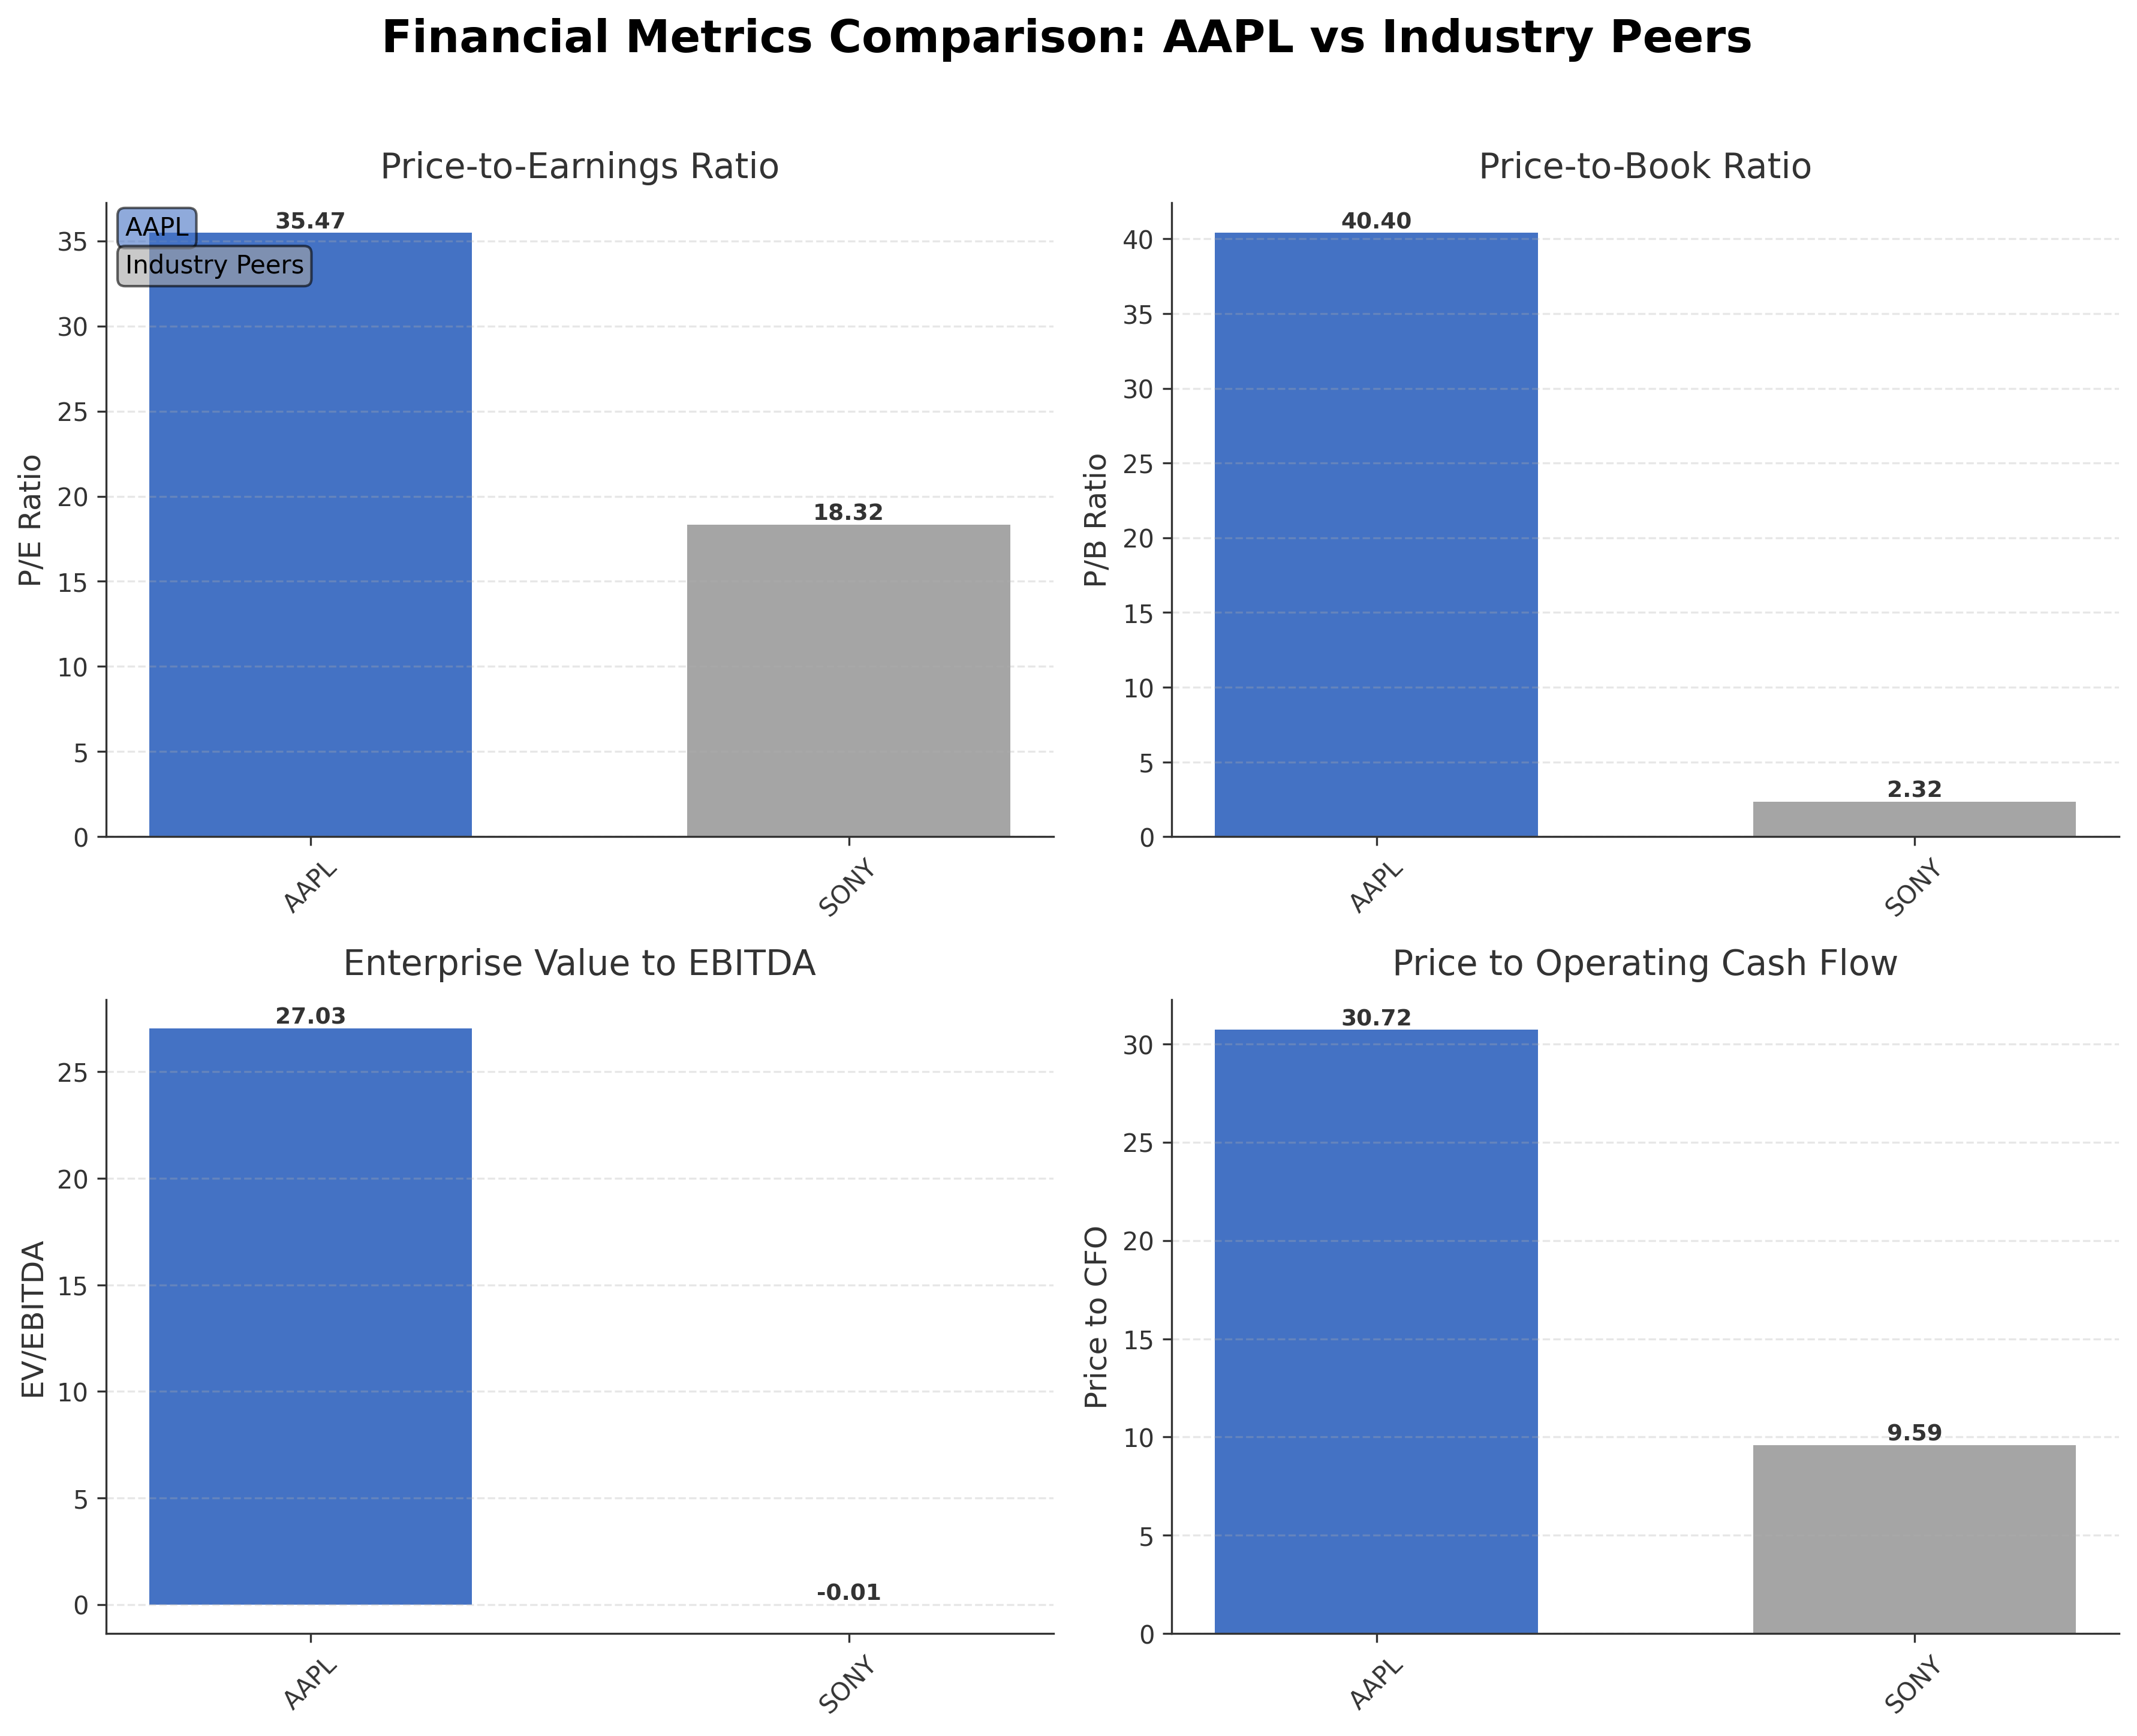
| Apple Inc | $4.31T | 35.47 | 40.40 | 27.03 | 30.72 |
| Sony Group Corporation - Sponsored American Depositary Receipt | $119.04B | 18.32 | 2.32 | -0.01 | 9.59 |
Comparison Analysis: Apple Inc. significantly outpaces its peer Sony Group Corporation in market capitalization, trading at approximately $4.31 trillion compared to Sony’s $119.04 billion. Apple’s valuation multiples, including a P/E ratio of 35.47 and P/B ratio of 40.40, are substantially higher than Sony’s 18.32 and 2.32 respectively, reflecting a premium market positioning. The EV/EBITDA multiple of 27.03 for Apple contrasts with Sony’s negative figure, indicating stronger earnings before interest, taxes, depreciation, and amortization. Apple also demonstrates superior cash flow valuation with a price to CFO of 30.72 versus Sony’s 9.59. Return on equity further highlights Apple’s efficiency at 1.41% compared to Sony’s 0.12%, underscoring Apple’s dominant profitability and operational effectiveness within the consumer electronics sector.
Financial Metrics Comparison with Peers
Financial Statements
Comprehensive financial data including income, balance sheet, and cash flow metrics
Income Statement
| fiscal_date | 2025-09-30 | 2024-09-30 | 2023-09-30 | 2022-09-30 | 2021-09-30 |
|---|---|---|---|---|---|
| Sales | 416.16B | 391.04B | 383.29B | 394.33B | 365.82B |
| Cost Of Goods | 220.96B | 210.35B | 214.14B | 223.55B | 212.98B |
| Gross Profit | 195.20B | 180.68B | 169.15B | 170.78B | 152.84B |
| Operating Expense Research And Development | 34.55B | 31.37B | 29.91B | 26.25B | 21.91B |
| Operating Expense Selling General And Administrative | 27.60B | 26.10B | 24.93B | 25.09B | 21.97B |
| Operating Income | 133.05B | 123.22B | 114.30B | 119.44B | 108.95B |
| Other Income Expense | -321.00M | 269.00M | -565.00M | -334.00M | 60.00M |
| Pretax Income | 132.73B | 123.48B | 113.74B | 119.10B | 109.21B |
| Income Tax | 20.72B | 29.75B | 16.74B | 19.30B | 14.53B |
| Net Income | 112.01B | 93.74B | 97.00B | 99.80B | 94.68B |
| Eps Basic | 7.49 | 6.11 | 6.16 | 6.15 | 5.67 |
| Eps Diluted | 7.46 | 6.08 | 6.13 | 6.11 | 5.61 |
| Basic Shares Outstanding | 14.95B | 15.34B | 15.74B | 16.22B | 16.70B |
| Diluted Shares Outstanding | 14.95B | 15.34B | 15.74B | 16.22B | 16.70B |
| Ebit | 133.05B | 123.22B | 114.30B | 119.44B | 111.85B |
| Ebitda | 144.75B | 134.66B | 125.82B | 130.54B | 123.14B |
| Net Income Continuous Operations | 112.01B | 93.74B | 97.00B | 99.80B | 94.68B |
| Non Operating Interest Income | N/A | N/A | 3.75B | 2.83B | 2.84B |
| Non Operating Interest Expense | N/A | N/A | 3.93B | 2.93B | 2.65B |
Source: Financial statements and regulatory filings
Balance Sheet
| fiscal_date | 2025-09-30 | 2024-09-30 | 2023-09-30 | 2022-09-30 | 2021-09-30 |
|---|---|---|---|---|---|
| Cash And Cash Equivalents | 35.93B | 29.94B | 29.96B | 23.65B | 34.94B |
| Accounts Receivable | 39.78B | 33.41B | 29.51B | 28.18B | 26.28B |
| Total Assets | 359.24B | 364.98B | 352.58B | 352.75B | 351.00B |
| Total Liabilities | 285.51B | 308.03B | 290.44B | 302.08B | 287.91B |
| Long Term Debt | 78.33B | 85.75B | 95.28B | 109.71B | 119.38B |
| Shareholders Equity | 73.73B | 56.95B | 62.15B | 50.67B | 63.09B |
Source: Financial statements and regulatory filings
Cash Flow Statement
| fiscal_date | 2025-09-30 | 2024-09-30 | 2023-09-30 | 2022-09-30 | 2021-09-30 |
|---|---|---|---|---|---|
| Operating Activities Net Income | 112.01B | 93.74B | 97.00B | 99.80B | 94.68B |
| Operating Activities Depreciation | 11.70B | 11.45B | 11.52B | 11.10B | 11.28B |
| Operating Activities Stock Based Compensation | 12.86B | 11.69B | 10.83B | 9.04B | 7.91B |
| Operating Activities Other Non Cash Items | -89.00M | -2.27B | -2.23B | 1.01B | -4.92B |
| Operating Activities Accounts Receivable | -7.03B | -5.14B | -417.00M | -9.34B | -14.03B |
| Operating Activities Accounts Payable | 902.00M | 6.02B | -1.89B | 9.45B | 12.33B |
| Operating Activities Other Assets Liabilities | -18.87B | 2.77B | -4.27B | 1.57B | -1.53B |
| Operating Activities Operating Cash Flow | 111.48B | 118.25B | 110.54B | 123.52B | 100.94B |
| Investing Activities Capital Expenditures | -12.71B | -9.45B | -10.96B | -10.71B | -11.09B |
| Investing Activities Purchase Of Investments | -24.41B | -48.66B | -29.51B | -76.92B | -109.56B |
| Investing Activities Sale Of Investments | 53.80B | 62.35B | 45.51B | 67.36B | 106.48B |
| Investing Activities Other Investing Activity | -1.48B | -1.31B | -1.34B | -2.09B | -385.00M |
| Investing Activities Investing Cash Flow | 15.20B | 2.94B | 3.71B | -22.66B | -14.58B |
| Financing Activities Long Term Debt Issuance | 4.48B | 0.00 | 5.23B | 5.46B | 20.39B |
| Financing Activities Long Term Debt Payments | -10.93B | -9.96B | -11.15B | -9.54B | -8.75B |
| Financing Activities Short Term Debt Issuance | -2.03B | 3.96B | -3.98B | 3.96B | 1.02B |
| Financing Activities Common Stock Repurchase | -90.71B | -94.95B | -77.55B | -89.40B | -85.97B |
| Financing Activities Common Dividends | -15.42B | -15.23B | -15.03B | -14.84B | -14.47B |
| Financing Activities Other Financing Charges | -6.07B | -5.80B | -6.01B | -6.38B | -5.58B |
| Financing Activities Financing Cash Flow | -120.69B | -121.98B | -108.49B | -110.75B | -92.25B |
| End Cash Position | 35.93B | 29.94B | 30.74B | 24.98B | 35.93B |
| Income Tax Paid | 43.37B | 26.10B | 18.68B | 19.57B | 25.39B |
| Free Cash Flow | 98.77B | 108.81B | 99.58B | 111.44B | 92.95B |
| Interest Paid | N/A | N/A | 3.80B | 2.87B | 2.69B |
| Operating Activities Deferred Taxes | N/A | N/A | N/A | 895.00M | -4.77B |
| Investing Activities Net Acquisitions | N/A | N/A | N/A | -306.00M | -33.00M |
| Financing Activities Common Stock Issuance | N/A | N/A | N/A | N/A | 1.10B |
Source: Financial statements and regulatory filings
Technical Analysis
Key Insights
- Apple’s stock is currently in a strong uptrend, trading near all-time highs with consistent higher highs and higher lows observed in recent price action.
- Key support levels are identified around $260 and $250, while resistance is near the 52-week high at approximately $295.
- The stock price is above the 10-day, 50-day ($262.80), and 200-day ($257.02) moving averages, indicating sustained bullish momentum across short and long-term timeframes.
- Momentum indicators show the Relative Strength Index (RSI) in the upper range, suggesting strong buying pressure; MACD is positive with a bullish crossover; Stochastic oscillator confirms overbought conditions but with potential continuation.
- Multi-timeframe analysis reveals daily and weekly charts supporting the bullish trend, while monthly charts indicate a longer-term upward trajectory with occasional consolidation phases.
- Potential market scenarios include continuation of the upward trend supported by strong fundamentals and technicals, with possible short-term pullbacks to support levels for consolidation before further advances.
Trending News
1. Headline: Local Pensions Partnership Investment Ltd Cuts Stock Position in Apple Inc. $AAPL
Summary: Local Pensions Partnership Investment Ltd decreased its holdings in shares of Apple Inc. (NASDAQ:AAPL - Free Report) by 7.6% in the fourth quarter, according to its most recent Form 13F filing with the Securities & Exchange Commission. The institutional investor owned 860,880 shares of the iPh
Sentiment: negative
2. Headline: Apple Stock Forecast: Wedbush Raises Apple Target to $400 on AI Push | AAPL - TheStreet
Summary: Apple stock bull makes towering new call on AI potential
Sentiment: positive
3. Headline: Apple stock notches fresh record as tech rebounds
Summary: Wednesday’s market action comes as Apple CEO Tim Cook travels to China with President Trump’s delegation for a summit with Chinese leader Xi Jinping. Nasdaq 100 year-to-date chart. Ines Ferre is a senior business reporter for Yahoo Finance. Follow her on X at @ines_ferre. Click here for in-depth analysis of the latest stock market news and events moving stock prices · Read the latest financial and business news from Yahoo Finance ... CSCO Cisco Systems, Inc...
Sentiment: positive
4. Headline: Apple Stock Is Gaining Today: What's Happening Behind The Scenes? - Apple (NASDAQ:AAPL) - Benzinga
Summary: The stock is trading at a new 52-week high, according to Benzinga Pro. ... To add Benzinga News as your preferred source on Google, click here. ... A newsletter built for market enthusiasts by market enthusiasts. Top stories, top movers, and trade ideas delivered to your inbox every weekday before and after the market closes. ... Apple Inc ...
Sentiment: positive
Summary: Apple is back at the top of every watchlist after the latest quarter showed iPhone revenue rebounding and CEO Tim Cook touting “extraordinary demand for iPhone 17 lineup”. The setup beneath the headline numbers is more interesting. Nintendo just raised hardware prices to offset rising memory ...
Sentiment: positive
Recent Updates
News Summary
As of 2026-05-14. Apple has selected Intel to manufacture its chips, marking a strategic shift in its supply chain. However, Intel's foundry segment faces challenges including a sizable net loss and delayed production timelines, with volume production for the 14A node expected only by 2029, implying Apple will not receive Intel-made chips for at least two to three years. This introduces execution risk given Intel's history of underdelivering on promised process technology. Additionally, Apple announced its upcoming WWDC26 conference will spotlight significant AI and software updates, emphasizing the company's focus on integrating artificial intelligence and enhancing its platform ecosystem. These developments highlight Apple's ongoing innovation efforts amid supply chain adjustments.
News Sentiment
The overall sentiment from recent updates is mixed to neutral. The partnership with Intel introduces execution risks and supply chain uncertainties, which temper enthusiasm. Conversely, the upcoming WWDC26 event focusing on AI and software enhancements reflects positive momentum in innovation and strategic growth areas. Institutional portfolio adjustments, such as reductions by some investors, add a cautious tone. Collectively, the news underscores a balance between operational challenges and forward-looking technology initiatives shaping Apple's near-term outlook.
Source List
Analytical Overview
Analysis Summary
Apple’s valuation metrics, including a trailing P/E of 35.47 and forward P/E of 30.68, are elevated compared to the industry average P/E of 35.47, reflecting a premium valuation consistent with its market leadership. The company’s revenue growth of 16.6% quarterly and strong operating cash flow of $140.2 billion demonstrate a robust growth trajectory supported by consistent cash generation. Financial health is solid with a total debt to equity ratio of 79.55%, manageable given the company’s substantial cash reserves of $68.5 billion and strong free cash flow of $101.1 billion. Sector-specific opportunities include expanding AI integration and services growth, while challenges involve supply chain execution risks, particularly related to Intel chip manufacturing. Market positioning and competitive advantages remain strong, supported by a diversified product ecosystem and global brand recognition.
Overall Business and Market Assessment
Supporting Factors: No data
Risk Factors: supply chain execution uncertainties linked to the Intel partnership and potential valuation pressures given the premium multiples
SWOT Analysis
Strengths
- Market leadership in consumer electronics with a diversified product portfolio.
- Strong profitability with a net profit margin of 27.15% and high return on equity.
- Robust free cash flow generation exceeding $100 billion annually.
- Extensive global presence and a loyal customer ecosystem.
Weaknesses
- High price-to-book ratio indicating premium valuation.
- Dependence on iPhone sales for a significant portion of revenue.
- Execution risk related to new chip manufacturing partnerships.
- Relatively high debt-to-equity ratio compared to cash reserves.
Opportunities
- Expansion of AI capabilities and software services.
- Growth potential in wearable and subscription-based segments.
- Increased focus on emerging markets and international expansion.
- Strategic acquisitions to enhance technology and product offerings.
Threats
- Supply chain disruptions impacting product availability.
- Intense competition in consumer electronics and technology sectors.
- Regulatory scrutiny and geopolitical tensions affecting global operations.
- Execution risks associated with reliance on third-party chip manufacturers.
Company Description
Apple Inc. is a leading technology company renowned for designing, manufacturing, and marketing innovative hardware and software products for consumers and businesses worldwide. Its flagship product, the iPhone, accounts for the majority of sales, serving as the central hub of an expansive ecosystem that includes Mac computers, iPad tablets, Apple Watch wearables, and accessories like AirPods. Apple Inc. also offers a suite of services such as the App Store, Apple Music, iCloud, Apple TV+, and Apple Fitness+, providing digital content, cloud storage, and subscription-based platforms. Operating in the consumer electronics industry within the technology sector, the company employs approximately 166,000 people and maintains a broad global presence through online stores, retail outlets, and partnerships with carriers and resellers. With a substantial market capitalization reflecting its scale, Apple Inc. plays a pivotal role in shaping consumer technology trends, emphasizing seamless integration across devices and services to enhance user experience and productivity.