


Apple Inc (AAPL)
Stock Analysis Report
Stock Journey
Key Positives and Key Risks
Pros
- Revenue growth of 16.4% over the trailing twelve months demonstrates strong top-line expansion.
- Free cash flow of approximately $106.9 billion supports capital returns and operational flexibility.
- Market capitalization of $4.54 trillion reflects dominant market position and investor confidence.
Cons
- High trailing P/E ratio of 35.34 and P/B ratio of 42.55 indicate elevated valuation levels.
- Regulatory risks in the European Union may impact the App Store revenue and business model.
- Debt-to-equity ratio of 78.45% suggests a relatively leveraged capital structure compared to peers.
Disclosure: This information is for general awareness and does not constitute investment advice
Report Summary
Apple Inc. is a leading global technology company listed on the NASDAQ exchange under the symbol AAPL, operating primarily in the consumer electronics sector within the broader technology industry. The company designs, manufactures, and markets a diverse range of products including the iPhone, Mac computers, iPad tablets, and various wearables and accessories such as AirPods and Apple Watch. Additionally, Apple operates service platforms like the App Store and Apple Music, serving consumers, businesses, and government sectors worldwide. Its market positioning is characterized by strong brand recognition and integration of hardware, software, and services into a cohesive ecosystem.
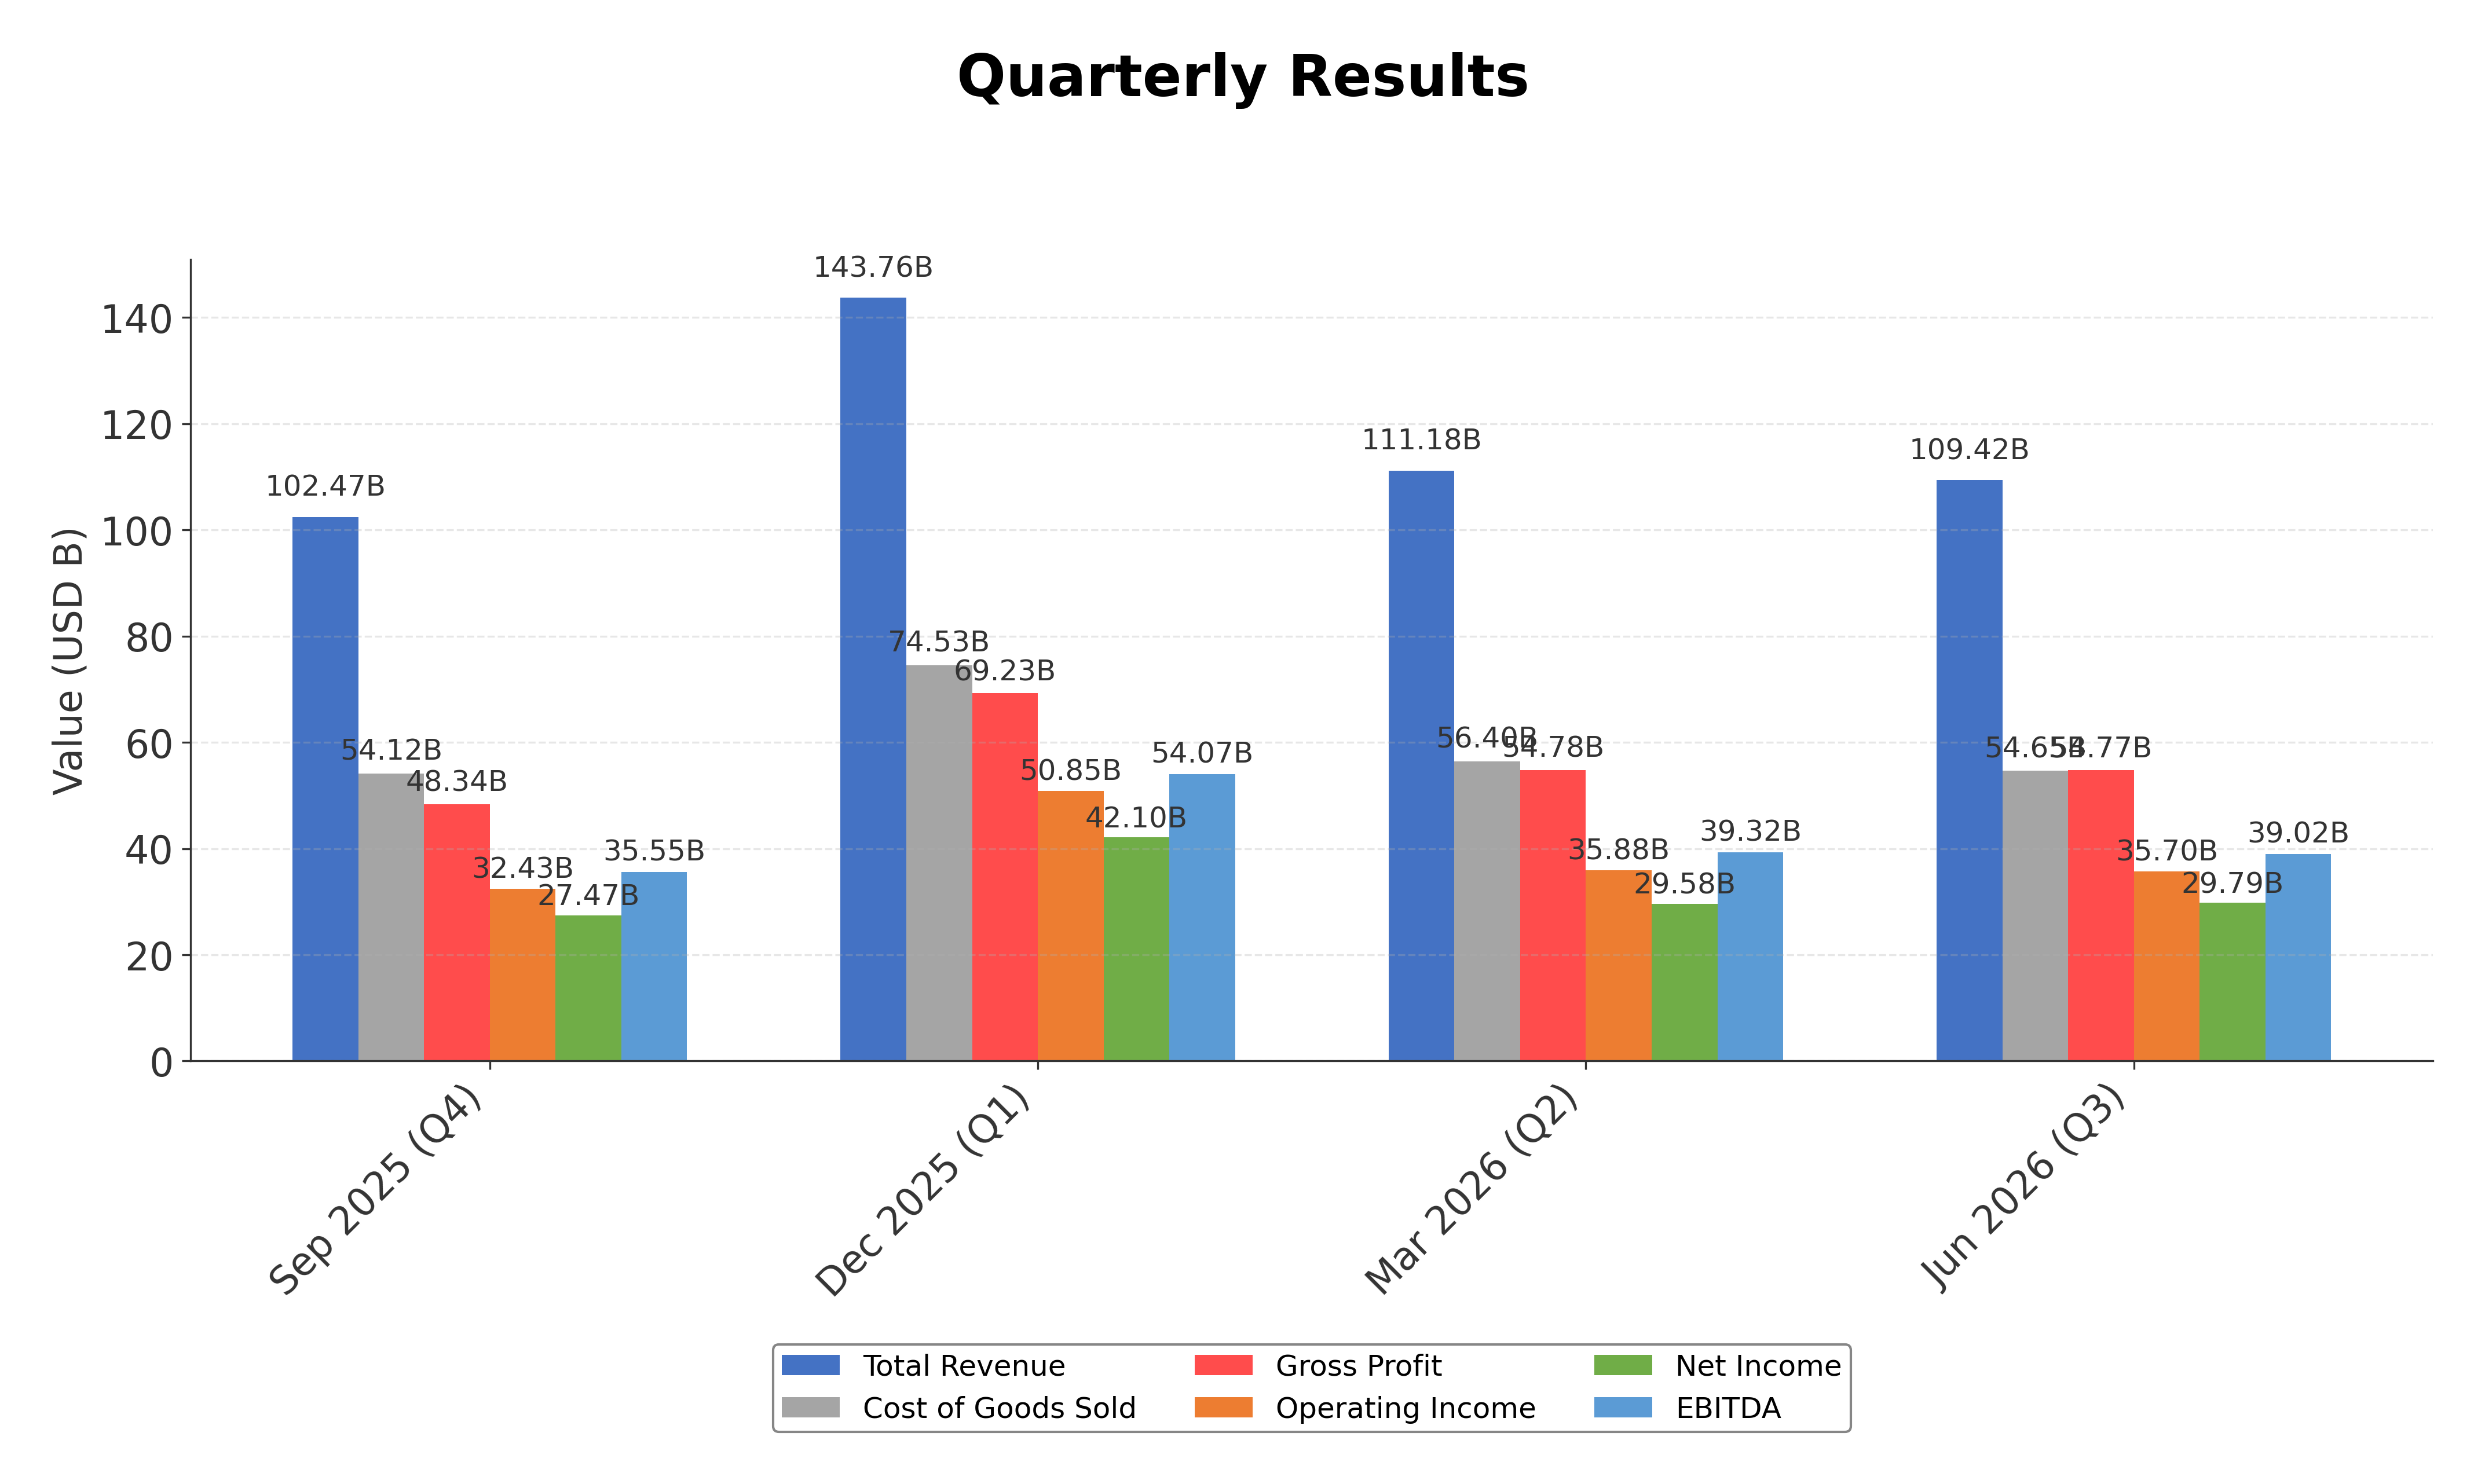
Financially, Apple reported trailing twelve-month revenue of approximately $466.8 billion with a gross margin of 50.06%, an operating margin of 32.62%, and a net profit margin of 27.62%, indicating robust profitability and operational efficiency. The company’s return on equity (ROE) stands at 148.75%, and return on assets (ROA) at 27.08%, reflecting highly effective capital utilization. Its return on invested capital (ROIC) is similarly strong, supported by substantial operating cash flow of $146.7 billion and free cash flow of $106.9 billion over the trailing twelve months.
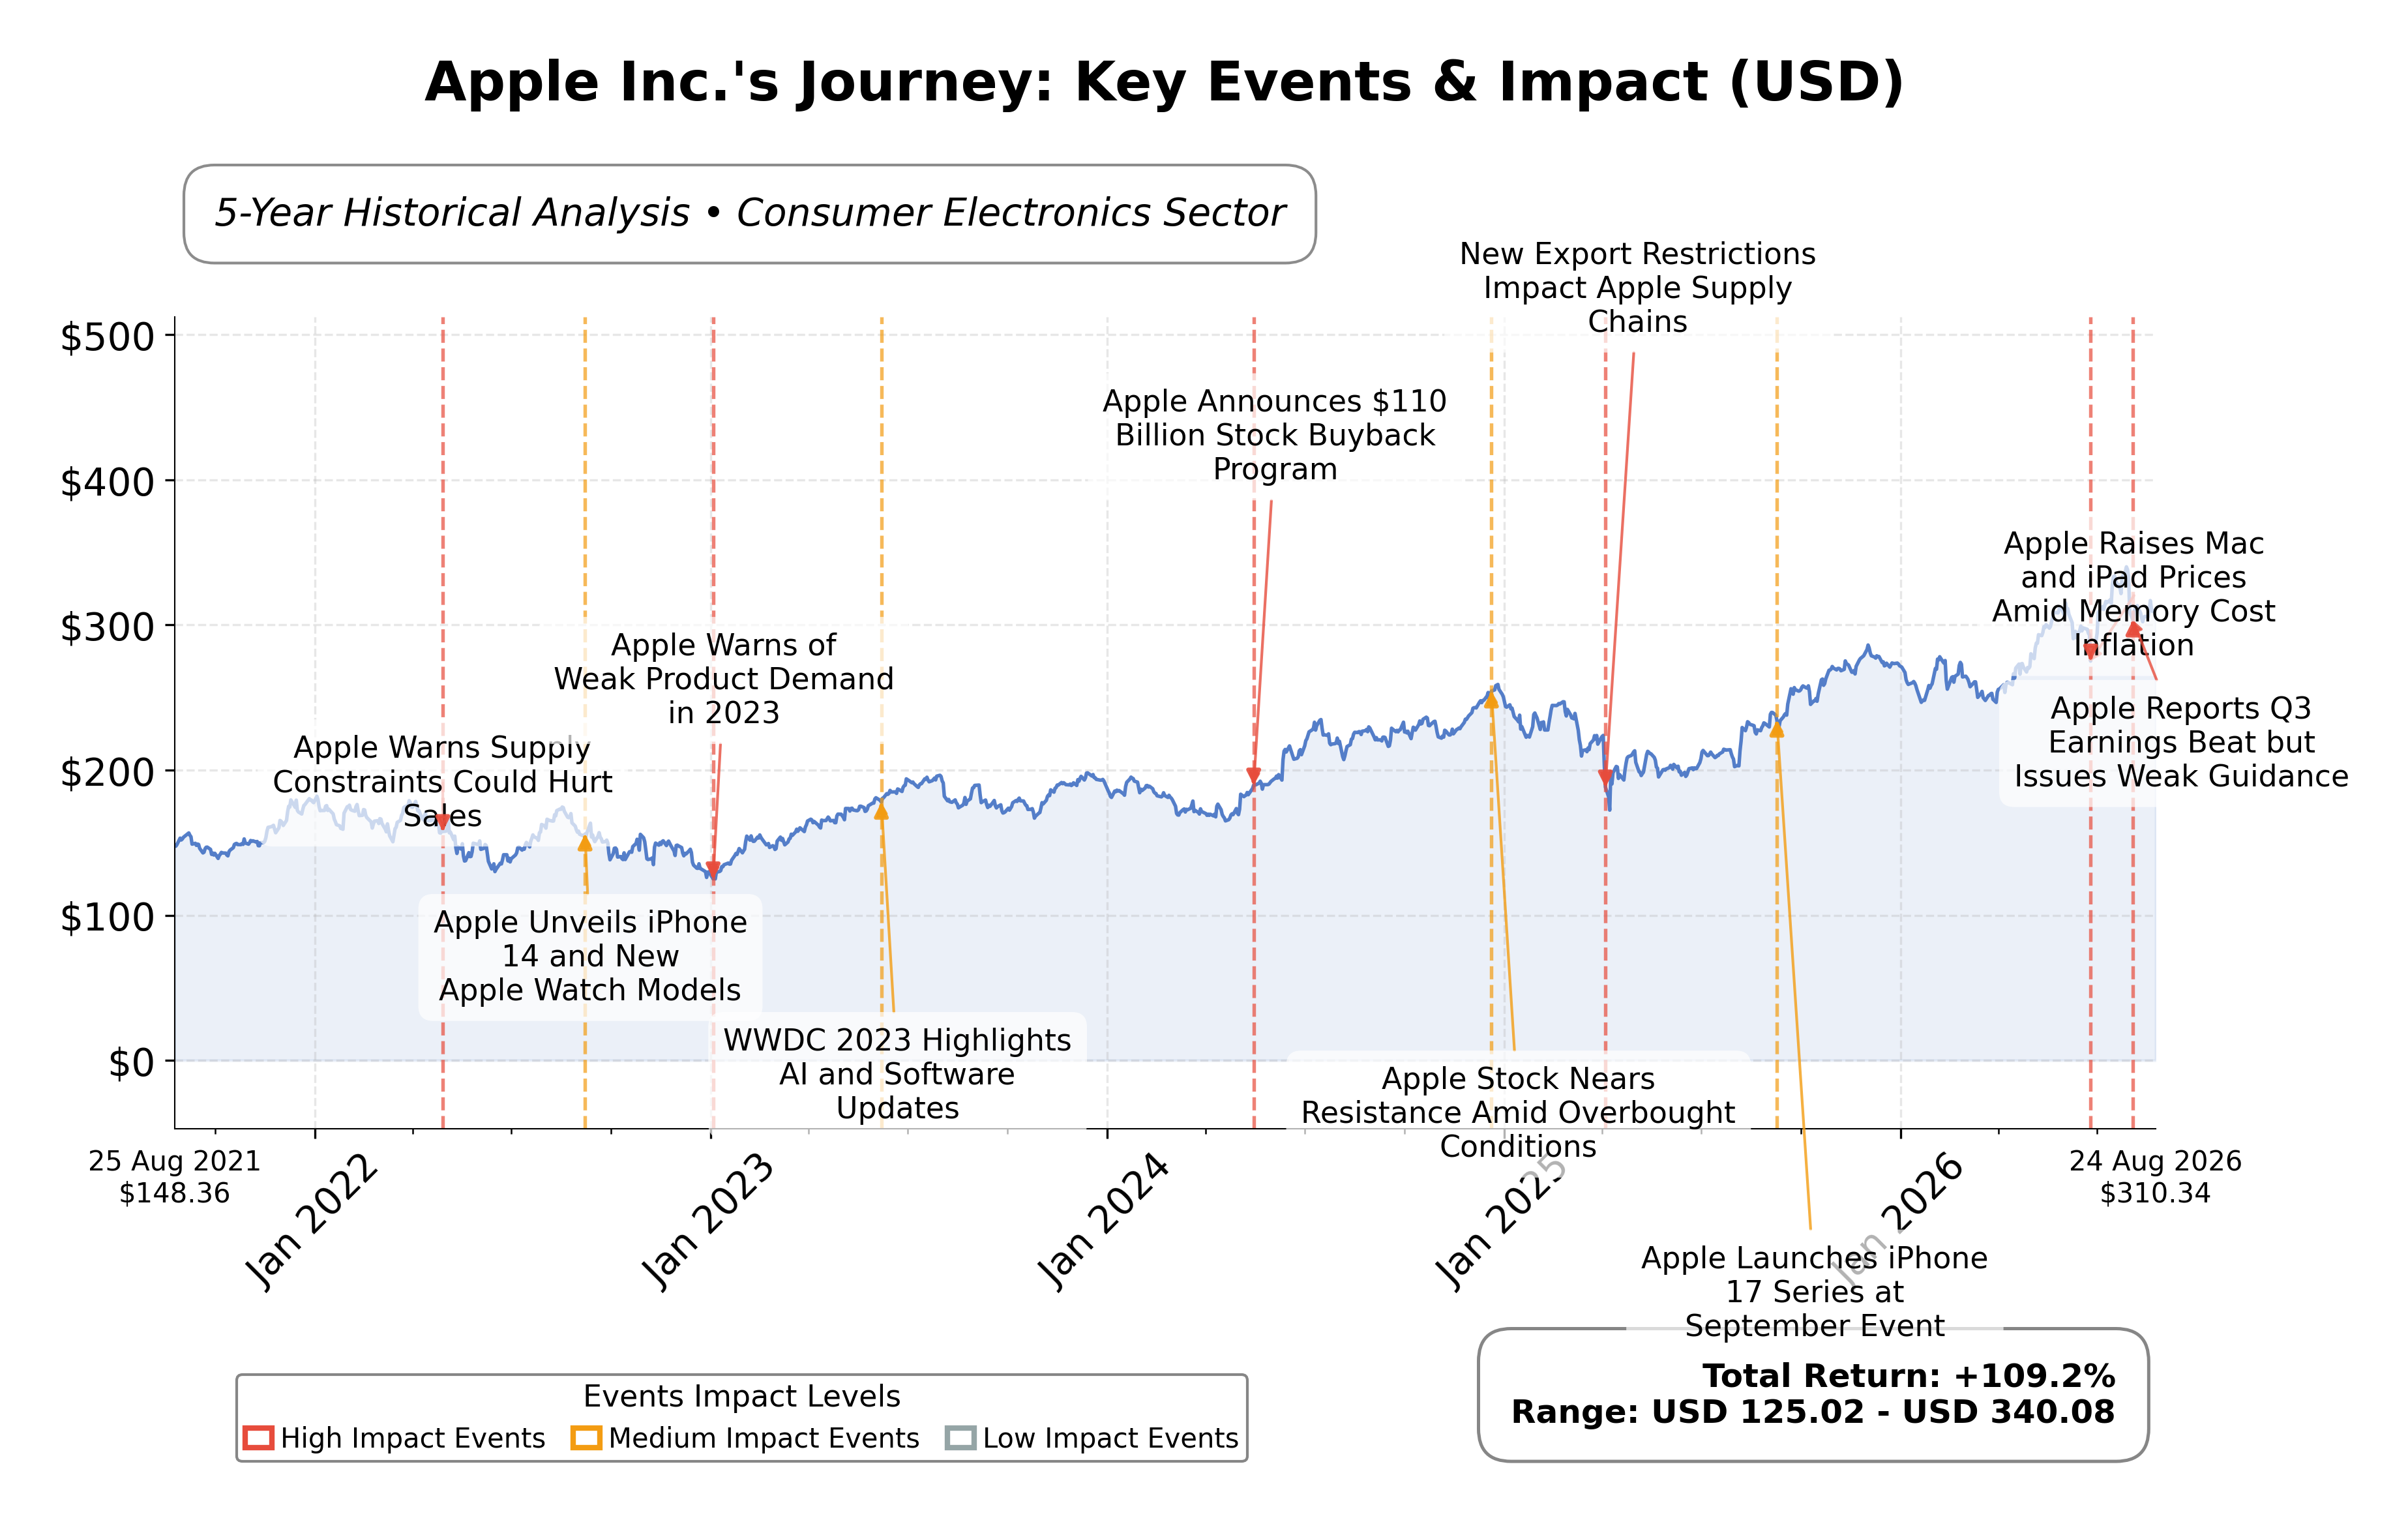
Apple’s valuation metrics include a trailing price-to-earnings (P/E) ratio of 35.34, a forward P/E of 32.28, and an enterprise value to EBITDA (EV/EBITDA) ratio of 27.00, positioning the stock at a premium relative to industry averages. The market capitalization is approximately $4.54 trillion, with the stock trading near $310.35, within a 52-week range of $344.57 (high) to $201.68 (low). The current price reflects a downside risk of about 11.5% from the 52-week high, suggesting the stock is priced near its upper valuation levels.
Key strengths include Apple’s substantial cash reserves of $62.4 billion, manageable debt levels with a debt-to-equity ratio of 78.45%, and a consistent history of large-scale share buybacks that have reduced outstanding shares by approximately 44% over recent years. Risks involve regulatory challenges in the European Union impacting its App Store business, competitive pressures in the smartphone and AI markets, and potential leadership transitions. Recent strategic actions include the largest-ever stock buyback authorization under CEO Tim Cook and adjustments to EU app business terms following regulatory collaboration.
Technically, Apple’s stock maintains an upward trend supported by strong quarterly revenue growth of 16% and earnings per share growth of 29%, trading above its 50-day and 200-day moving averages. Momentum indicators show positive readings across multiple timeframes. The data suggests a market environment where accumulation and cautious monitoring are warranted, given valuation premiums and regulatory uncertainties.
Company and Industry Overview
Company Basics
Price Performance
Company Size
Shareholding Pattern
Sector and Industry Analysis
The technology sector, particularly consumer electronics and digital services, continues to exhibit robust growth driven by innovation and expanding global demand. With market leaders like Apple, Microsoft, and Google, the sector commands trillions in market capitalization and benefits from a large installed base of devices exceeding billions worldwide. Growth is propelled by evolving hardware ecosystems and the increasing monetization of high-margin services, contributing to steady revenue increases year over year.
Within this sector, the consumer electronics industry is marked by rapid innovation cycles and intense competition, especially in smartphone and AI-enabled device markets. Companies are focusing on ecosystem integration, AI, and spatial computing to differentiate offerings and drive recurring revenue streams. Barriers to entry remain high due to the need for advanced semiconductor technology, extensive R&D, and established brand loyalty, with incumbents leveraging supply chain diversification and emerging market expansion to maintain competitive positioning.
Regulatory scrutiny is intensifying globally, with antitrust actions and digital market regulations, such as the EU’s Digital Markets Act, targeting dominant platform practices and commission models. These regulations pose challenges to service revenue models and ecosystem exclusivity, requiring proactive compliance and adaptation by industry players. Additionally, geopolitical tensions affecting semiconductor supply chains introduce operational risks, prompting companies to diversify manufacturing and sourcing to mitigate potential disruptions.
Note: Analysis synthesized from industry research, market reports, and regulatory filings. Information is subject to change based on market conditions.
Financial Ratios Dashboard
Illustrative Scenario Analysis
DCF Assumptions:
Method: Two-Stage EPS-Priority Model
Financials
Peer Analysis
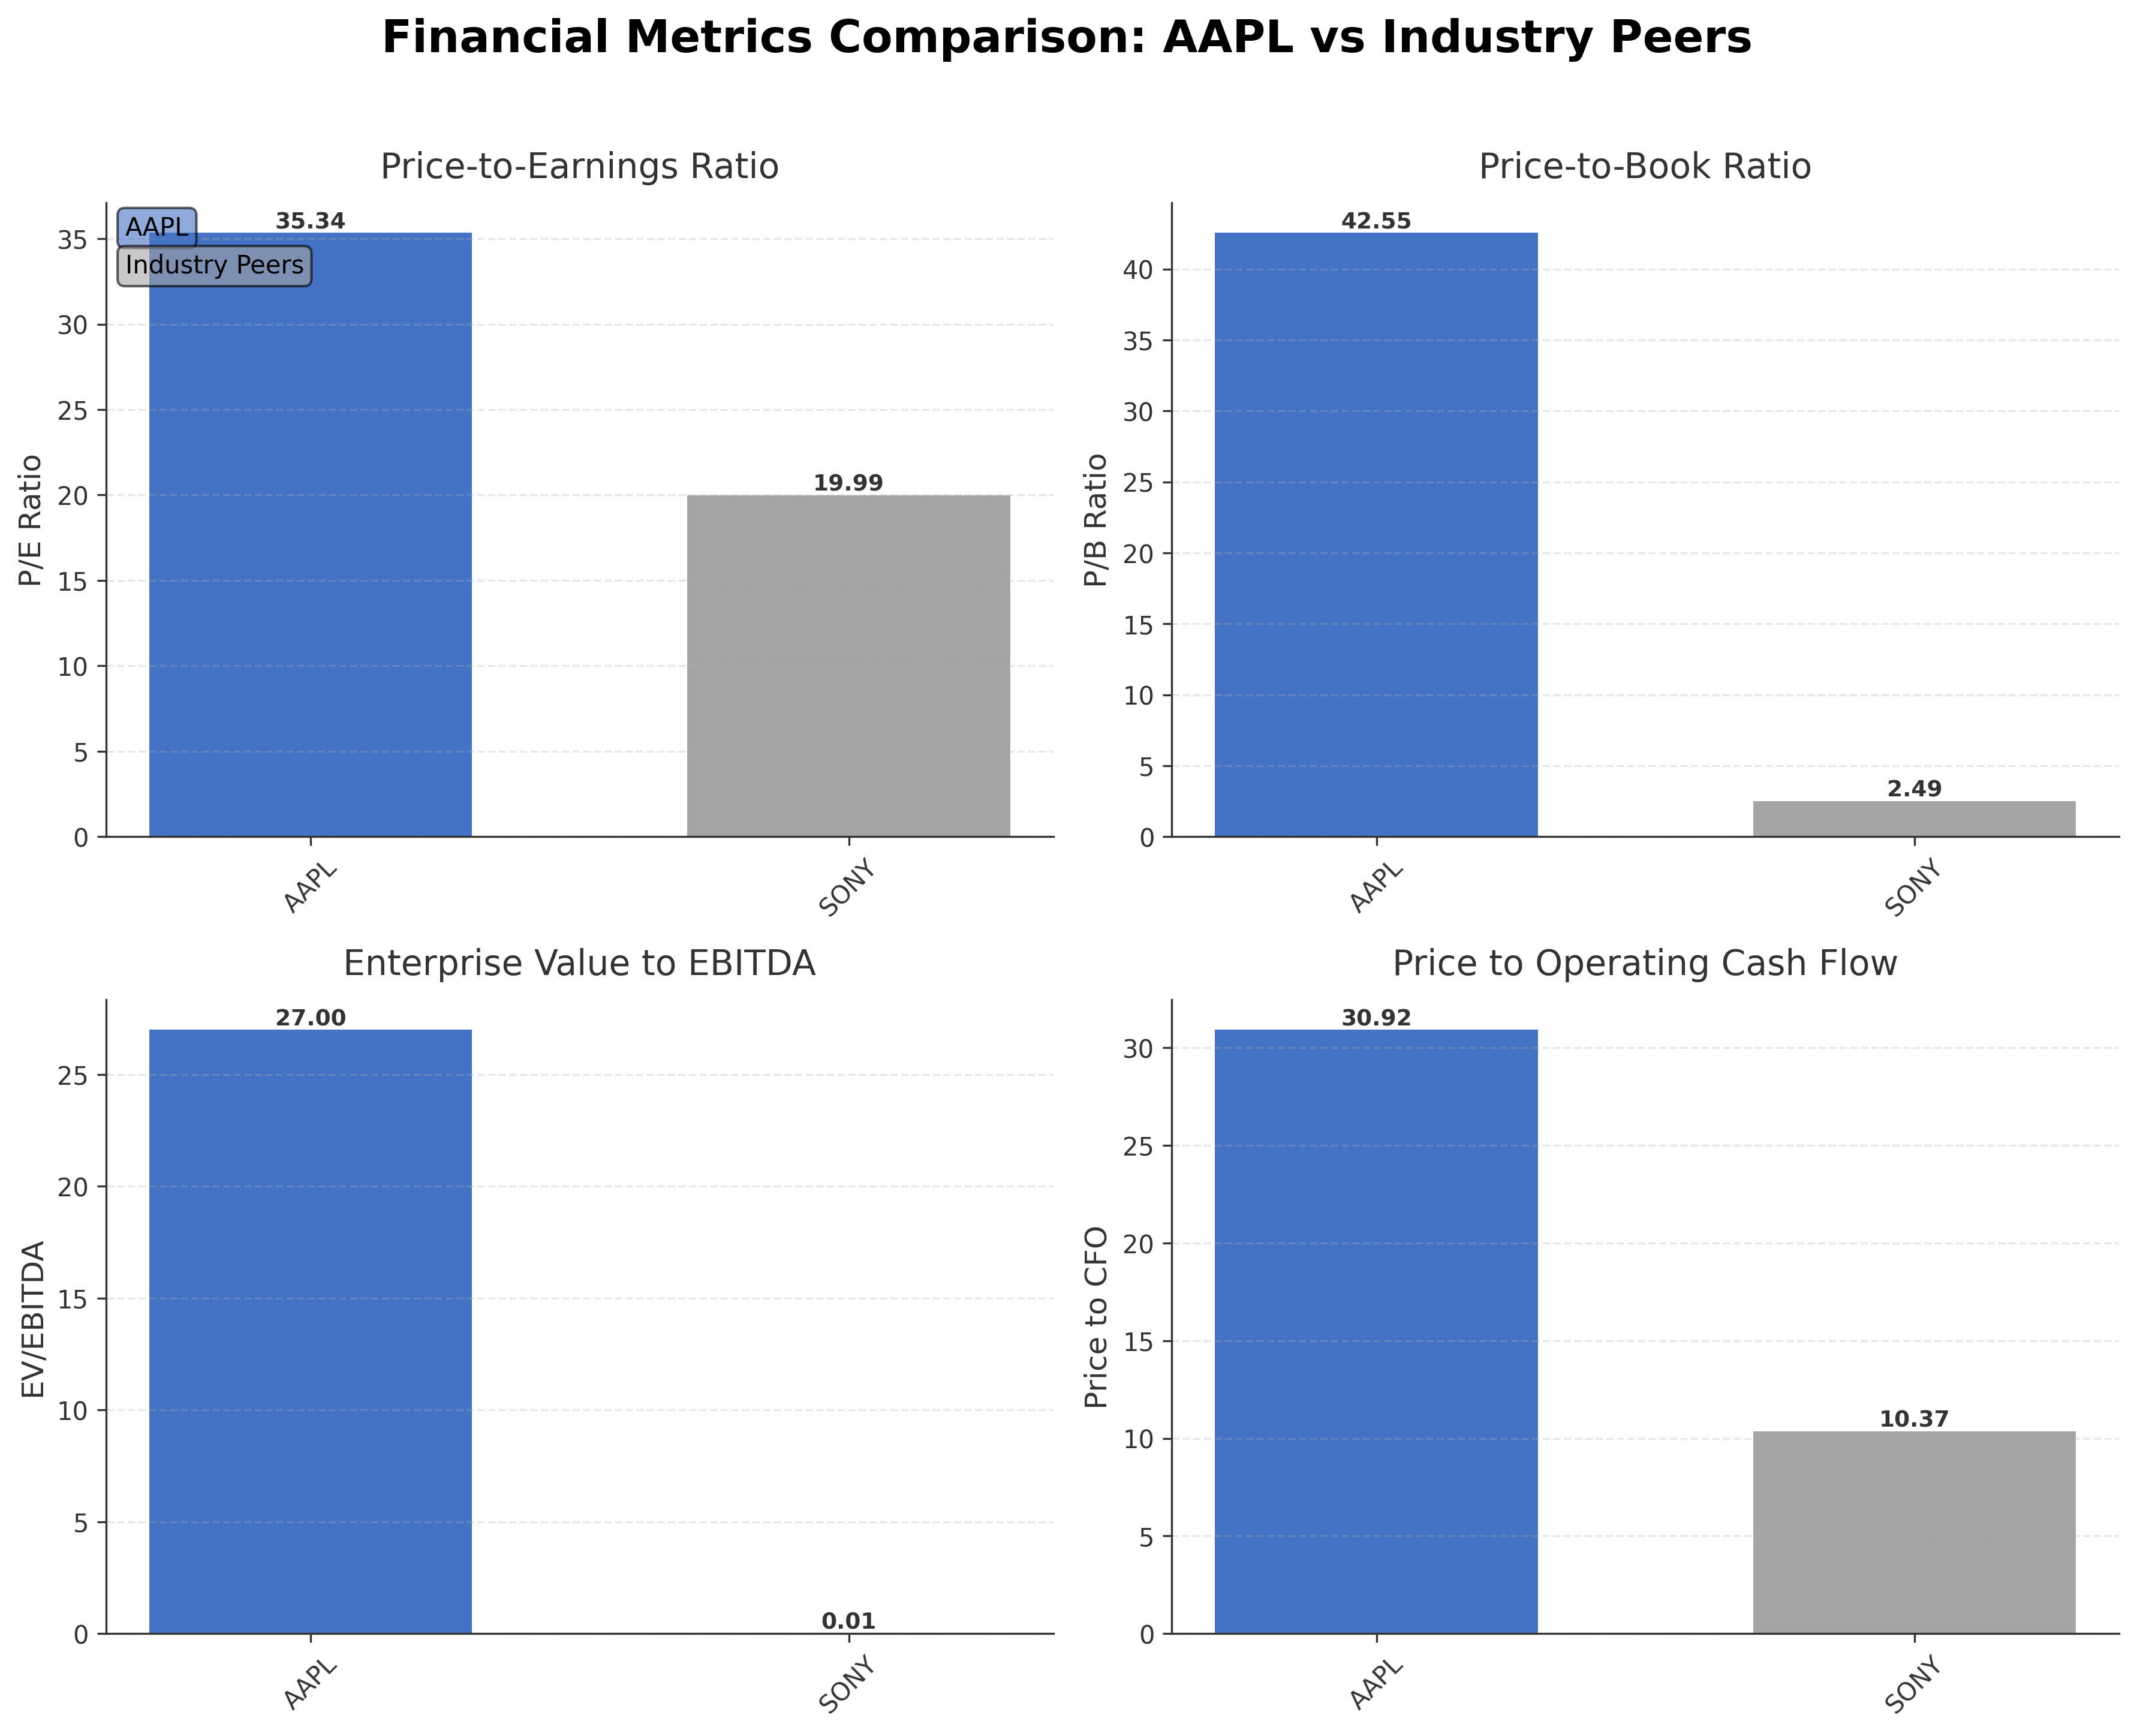
| Company Name | Market Cap | P/E Ratio | P/B Ratio | EV/EBITDA | Price to CFO |
|---|---|---|---|---|---|
| Apple Inc. | $4.54T | 35.34 | 42.55 | 27.00 | 30.92 |
| Sony Group Corporation - Sponsored American Depositary Receipt | $123.20B | 19.99 | 2.49 | 0.01 | 10.37 |
Comparison Analysis: Apple Inc. significantly surpasses its peer Sony Group Corporation in market capitalization, trading at $4.54 trillion compared to Sony's $123.20 billion. Apple's valuation ratios, including a P/E of 35.34 and P/B of 42.55, are substantially higher than Sony's 19.99 and 2.49 respectively, reflecting a premium pricing based on growth expectations and brand strength. The EV/EBITDA ratio of 27.00 for Apple contrasts with Sony's minimal 0.01, indicating different capital structures and profitability profiles. Apple's price to CFO ratio of 30.92 also exceeds Sony's 10.37, while return on equity is lower at 1.49% versus Sony's 12.34%, suggesting differing efficiency metrics. Overall, Apple commands a dominant market position with elevated valuation multiples relative to regional industry peers.
Financial Metrics Comparison with Peers
Financial Statements
Comprehensive financial data including income, balance sheet, and cash flow metrics
Income Statement
| fiscal_date | 2025-09-30 | 2024-09-30 | 2023-09-30 | 2022-09-30 | 2021-09-30 |
|---|---|---|---|---|---|
| Sales | 416.16B | 391.04B | 383.29B | 394.33B | 365.82B |
| Cost Of Goods | 220.96B | 210.35B | 214.14B | 223.55B | 212.98B |
| Gross Profit | 195.20B | 180.68B | 169.15B | 170.78B | 152.84B |
| Operating Expense Research And Development | 34.55B | 31.37B | 29.91B | 26.25B | 21.91B |
| Operating Expense Selling General And Administrative | 27.60B | 26.10B | 24.93B | 25.09B | 21.97B |
| Operating Income | 133.05B | 123.22B | 114.30B | 119.44B | 108.95B |
| Other Income Expense | -321.00M | 269.00M | -565.00M | -334.00M | 60.00M |
| Pretax Income | 132.73B | 123.48B | 113.74B | 119.10B | 109.21B |
| Income Tax | 20.72B | 29.75B | 16.74B | 19.30B | 14.53B |
| Net Income | 112.01B | 93.74B | 97.00B | 99.80B | 94.68B |
| Eps Basic | 7.49 | 6.11 | 6.16 | 6.15 | 5.67 |
| Eps Diluted | 7.46 | 6.08 | 6.13 | 6.11 | 5.61 |
| Basic Shares Outstanding | 14.95B | 15.34B | 15.74B | 16.22B | 16.70B |
| Diluted Shares Outstanding | 14.95B | 15.34B | 15.74B | 16.22B | 16.70B |
| Ebit | 133.05B | 123.22B | 114.30B | 119.44B | 111.85B |
| Ebitda | 144.75B | 134.66B | 125.82B | 130.54B | 123.14B |
| Net Income Continuous Operations | 112.01B | 93.74B | 97.00B | 99.80B | 94.68B |
| Non Operating Interest Income | N/A | N/A | 3.75B | 2.83B | 2.84B |
| Non Operating Interest Expense | N/A | N/A | 3.93B | 2.93B | 2.65B |
Data provided by Twelve Data
Balance Sheet
| fiscal_date | 2025-09-30 | 2024-09-30 | 2023-09-30 | 2022-09-30 | 2021-09-30 |
|---|---|---|---|---|---|
| Cash And Cash Equivalents | 35.93B | 29.94B | 29.96B | 23.65B | 34.94B |
| Accounts Receivable | 39.78B | 33.41B | 29.51B | 28.18B | 26.28B |
| Total Assets | 359.24B | 364.98B | 352.58B | 352.75B | 351.00B |
| Total Liabilities | 285.51B | 308.03B | 290.44B | 302.08B | 287.91B |
| Long Term Debt | 78.33B | 85.75B | 95.28B | 109.71B | 119.38B |
| Shareholders Equity | 73.73B | 56.95B | 62.15B | 50.67B | 63.09B |
Data provided by Twelve Data
Cash Flow Statement
| fiscal_date | 2025-09-30 | 2024-09-30 | 2023-09-30 | 2022-09-30 | 2021-09-30 |
|---|---|---|---|---|---|
| Operating Activities Net Income | 112.01B | 93.74B | 97.00B | 99.80B | 94.68B |
| Operating Activities Depreciation | 11.70B | 11.45B | 11.52B | 11.10B | 11.28B |
| Operating Activities Stock Based Compensation | 12.86B | 11.69B | 10.83B | 9.04B | 7.91B |
| Operating Activities Other Non Cash Items | -89.00M | -2.27B | -2.23B | 1.01B | -4.92B |
| Operating Activities Accounts Receivable | -7.03B | -5.14B | -417.00M | -9.34B | -14.03B |
| Operating Activities Accounts Payable | 902.00M | 6.02B | -1.89B | 9.45B | 12.33B |
| Operating Activities Other Assets Liabilities | -18.87B | 2.77B | -4.27B | 1.57B | -1.53B |
| Operating Activities Operating Cash Flow | 111.48B | 118.25B | 110.54B | 123.52B | 100.94B |
| Investing Activities Purchase Of Investments | -24.41B | -48.66B | -29.51B | -76.92B | -109.56B |
| Investing Activities Sale Of Investments | 53.80B | 62.35B | 45.51B | 67.36B | 106.48B |
| Investing Activities Other Investing Activity | -1.48B | -1.31B | -1.34B | -2.09B | -385.00M |
| Investing Activities Investing Cash Flow | 27.91B | 2.94B | 3.71B | -22.66B | -14.58B |
| Financing Activities Long Term Debt Issuance | 4.48B | 0.00 | 5.23B | 5.46B | 20.39B |
| Financing Activities Long Term Debt Payments | -10.93B | -9.96B | -11.15B | -9.54B | -8.75B |
| Financing Activities Short Term Debt Issuance | -2.03B | 3.96B | -3.98B | 3.96B | 1.02B |
| Financing Activities Common Stock Repurchase | -90.71B | -94.95B | -77.55B | -89.40B | -85.97B |
| Financing Activities Common Dividends | -15.42B | -15.23B | -15.03B | -14.84B | -14.47B |
| Financing Activities Other Financing Charges | -6.07B | -5.80B | -6.01B | -6.38B | -5.58B |
| Financing Activities Financing Cash Flow | -120.69B | -121.98B | -108.49B | -110.75B | -92.25B |
| End Cash Position | 35.93B | 29.94B | 30.74B | 24.98B | 35.93B |
| Income Tax Paid | 43.37B | 26.10B | 18.68B | 19.57B | 25.39B |
| Free Cash Flow | 98.77B | 108.81B | 99.58B | 111.44B | 92.95B |
| Investing Activities Capital Expenditures | N/A | -9.45B | -10.96B | -10.71B | -11.09B |
| Interest Paid | N/A | N/A | 3.80B | 2.87B | 2.69B |
| Operating Activities Deferred Taxes | N/A | N/A | N/A | 895.00M | -4.77B |
| Investing Activities Net Acquisitions | N/A | N/A | N/A | -306.00M | -33.00M |
| Financing Activities Common Stock Issuance | N/A | N/A | N/A | N/A | 1.10B |
Data provided by Twelve Data
Technical Analysis
Key Insights
- Apple's current trend is upward with price action showing resilience above key moving averages, supported by a 16% quarterly revenue growth.
- Key support levels are near $300, with resistance around the 52-week high of $344.57.
- The stock trades above its 10-day, 50-day ($309.30), and 200-day ($277.65) moving averages, indicating sustained bullish momentum.
- Momentum indicators show RSI in a neutral to slightly overbought range, MACD positive, and Stochastic oscillators confirming upward momentum.
- Multi-timeframe analysis reveals consistent strength across daily, weekly, and monthly charts, reinforcing the prevailing positive trend.
- Current technical setup suggests potential continuation of upward movement with caution advised near resistance levels and monitoring for any reversal signals.
Trending News
1. Headline: Apple stock price ended at $310.34 on Monday, after gaining 0.320%
Summary: We, therefore, hold a negative evaluation of this stock. Check full Apple forecast and analysis here. ... Securities trading offered by eToro USA Securities, Inc. (“the BD”), member of FINRA and SIPC. Cryptocurrency offered by eToro USA LLC (“the MSB”) (NMLS: 1769299) and is not FDIC ...
Sentiment: neutral
2. Headline: What's Going On With Apple Stock Monday? — TradingView News
Summary: Apple Inc. www.benzinga.com/quote/AAPL(NASDAQ:AAPL) stock traded higher Monday as investors favored mega-cap technology stocks during a broader market decline. The stock gained about 1%, while the Nasdaq fell 1.37% and the S&P 500 lost 0.36%.The stock’s gain during a weak market points to ...
Sentiment: positive
3. Headline: AAPL Stock Ticks Up Premarket As New Foldable iPhone Details Emerge
Summary: Bloomberg reports key details about the form factor based on interaction with people who have used it.
Sentiment: positive
4. Headline: Apple stock holds above $300 as Q3 2026 earnings show 16 percent revenue growth
Summary: Apple stock trades just below recent highs as investors digest record June-quarter results with 16 percent revenue growth, a 29 percent EPS jump and a market value above $4.5 trillion. Editorial-Fotografie zeigt Börsenhändler am Trading-Floor mit Technologie-Aktiencharts für Apple Inc., ISIN ...
Sentiment: positive
5. Headline: Jim Cramer Defends Apple Inc. (NASDAQ: AAPL) Amid Memory Shortage Pressure And Mixed Earnings Results
Summary: Apple Inc. (NASDAQ: AAPL) remains one of Jim Cramer's favored holdings, with shares climbing 35.8% over the past year and 14% year-to-date.
Sentiment: positive
Powered by Brave
Recent Updates
News Summary
As of August 22, 2026. Apple reported Q3 2026 earnings showing a 16% revenue growth, reinforcing its strong financial performance with a market capitalization above $4.5 trillion. The company announced its largest-ever stock buyback program under CEO Tim Cook, continuing a decade-long trend of share repurchases that have significantly reduced outstanding shares and enhanced shareholder value. Additionally, Apple implemented changes to its app business terms in the European Union following collaboration with the European Commission, adjusting commission structures and payment options to comply with regulatory requirements. These developments highlight Apple's ongoing strategic initiatives in capital management and regulatory adaptation.
News Sentiment
The overall sentiment across recent updates is predominantly positive, driven by strong earnings growth and proactive capital return strategies such as the record stock buyback program. Regulatory adjustments in the EU are managed collaboratively, mitigating potential negative impacts. However, some concerns remain regarding competitive pressures and regulatory scrutiny, which temper the outlook. The balance of positive financial results and strategic responses to external challenges suggests a stable operational environment with cautious optimism.
Source List
Analytical Overview
Analysis Summary
Apple's valuation metrics, including a trailing P/E of 35.34 and forward P/E of 32.28, are elevated relative to the consumer electronics industry average P/E of 35.34, indicating a premium valuation consistent with its market leadership. The company's revenue growth of 16.4% and strong operating cash flow of $146.7 billion demonstrate a solid growth trajectory supported by robust cash generation. Financial health is maintained with a manageable debt-to-equity ratio of 78.45% and ample cash reserves of $62.4 billion, supporting liquidity and capital flexibility. Sector-specific challenges include regulatory scrutiny in the European Union and intensifying competition in AI and smartphone markets. Market positioning and competitive advantages are underscored by Apple's integrated ecosystem, brand strength, and consistent innovation.
Overall Business and Market Assessment
Supporting Factors: Key supporting factors include Apple's strong revenue and earnings growth, substantial free cash flow generation, and disciplined capital return programs such as significant share buybacks. Risks to monitor encompass regulatory developments in the EU affecting app business models and competitive pressures from emerging technologies. The appropriate investment timeframe aligns with medium to long-term horizons, given the company's established market position and ongoing innovation pipeline. Overall, the analysis reflects a balanced outlook with premium valuation metrics offset by solid fundamentals and strategic initiatives.
Risk Factors: No data
SWOT Analysis
Strengths
- Strong brand recognition and integrated ecosystem of hardware, software, and services.
- Robust profitability with a 27.62% net profit margin and high return on equity.
- Substantial cash reserves of $62.4 billion and consistent free cash flow generation.
- Significant share repurchase program reducing outstanding shares and enhancing shareholder value.
Weaknesses
- High valuation multiples with a P/B ratio of 42.55 may limit upside potential.
- Relatively high debt-to-equity ratio of 78.45% compared to some peers.
- Dependence on iPhone sales exposes revenue to smartphone market cyclicality.
- Limited diversification outside core consumer electronics and services segments.
Opportunities
- Expansion of services segment including App Store and subscription models.
- Introduction of innovative products such as foldable iPhones and augmented reality devices.
- Regulatory adaptations in the EU may open new business models for app payments.
- Growing demand for wearables and health monitoring technologies.
Threats
- Regulatory challenges in the European Union impacting App Store commissions and business terms.
- Intense competition in smartphone, AI, and technology sectors.
- Global supply chain disruptions affecting product availability and costs.
- Potential leadership changes creating uncertainty in strategic direction.
Company Description
Apple Inc. designs, manufactures, and markets a wide range of technology products worldwide. These include the iPhone, a line of smartphones; Mac, a line of personal computers; iPad, a line of multi-purpose tablets; and wearables, home, and accessories such as AirPods, Apple Vision Pro, Apple TV, Apple Watch, Beats products, HomePod, as well as Apple branded and third-party accessories. The company operates service platforms including the App Store, Apple Music, and subscription models that provide curated content, cloud services, and digital offerings. Apple Inc. serves individual consumers, businesses, and government sectors through online stores, retail outlets, and partnerships with cellular carriers and resellers. Its products span the information technology sector, impacting mobile communication, personal computing, entertainment, and health monitoring. Founded in 1976 and headquartered in Cupertino, California, Apple Inc. plays a pivotal role in the global technology market by integrating hardware, software, and services into seamless ecosystems.