


Apple Inc (AAPL)
Stock Analysis Report
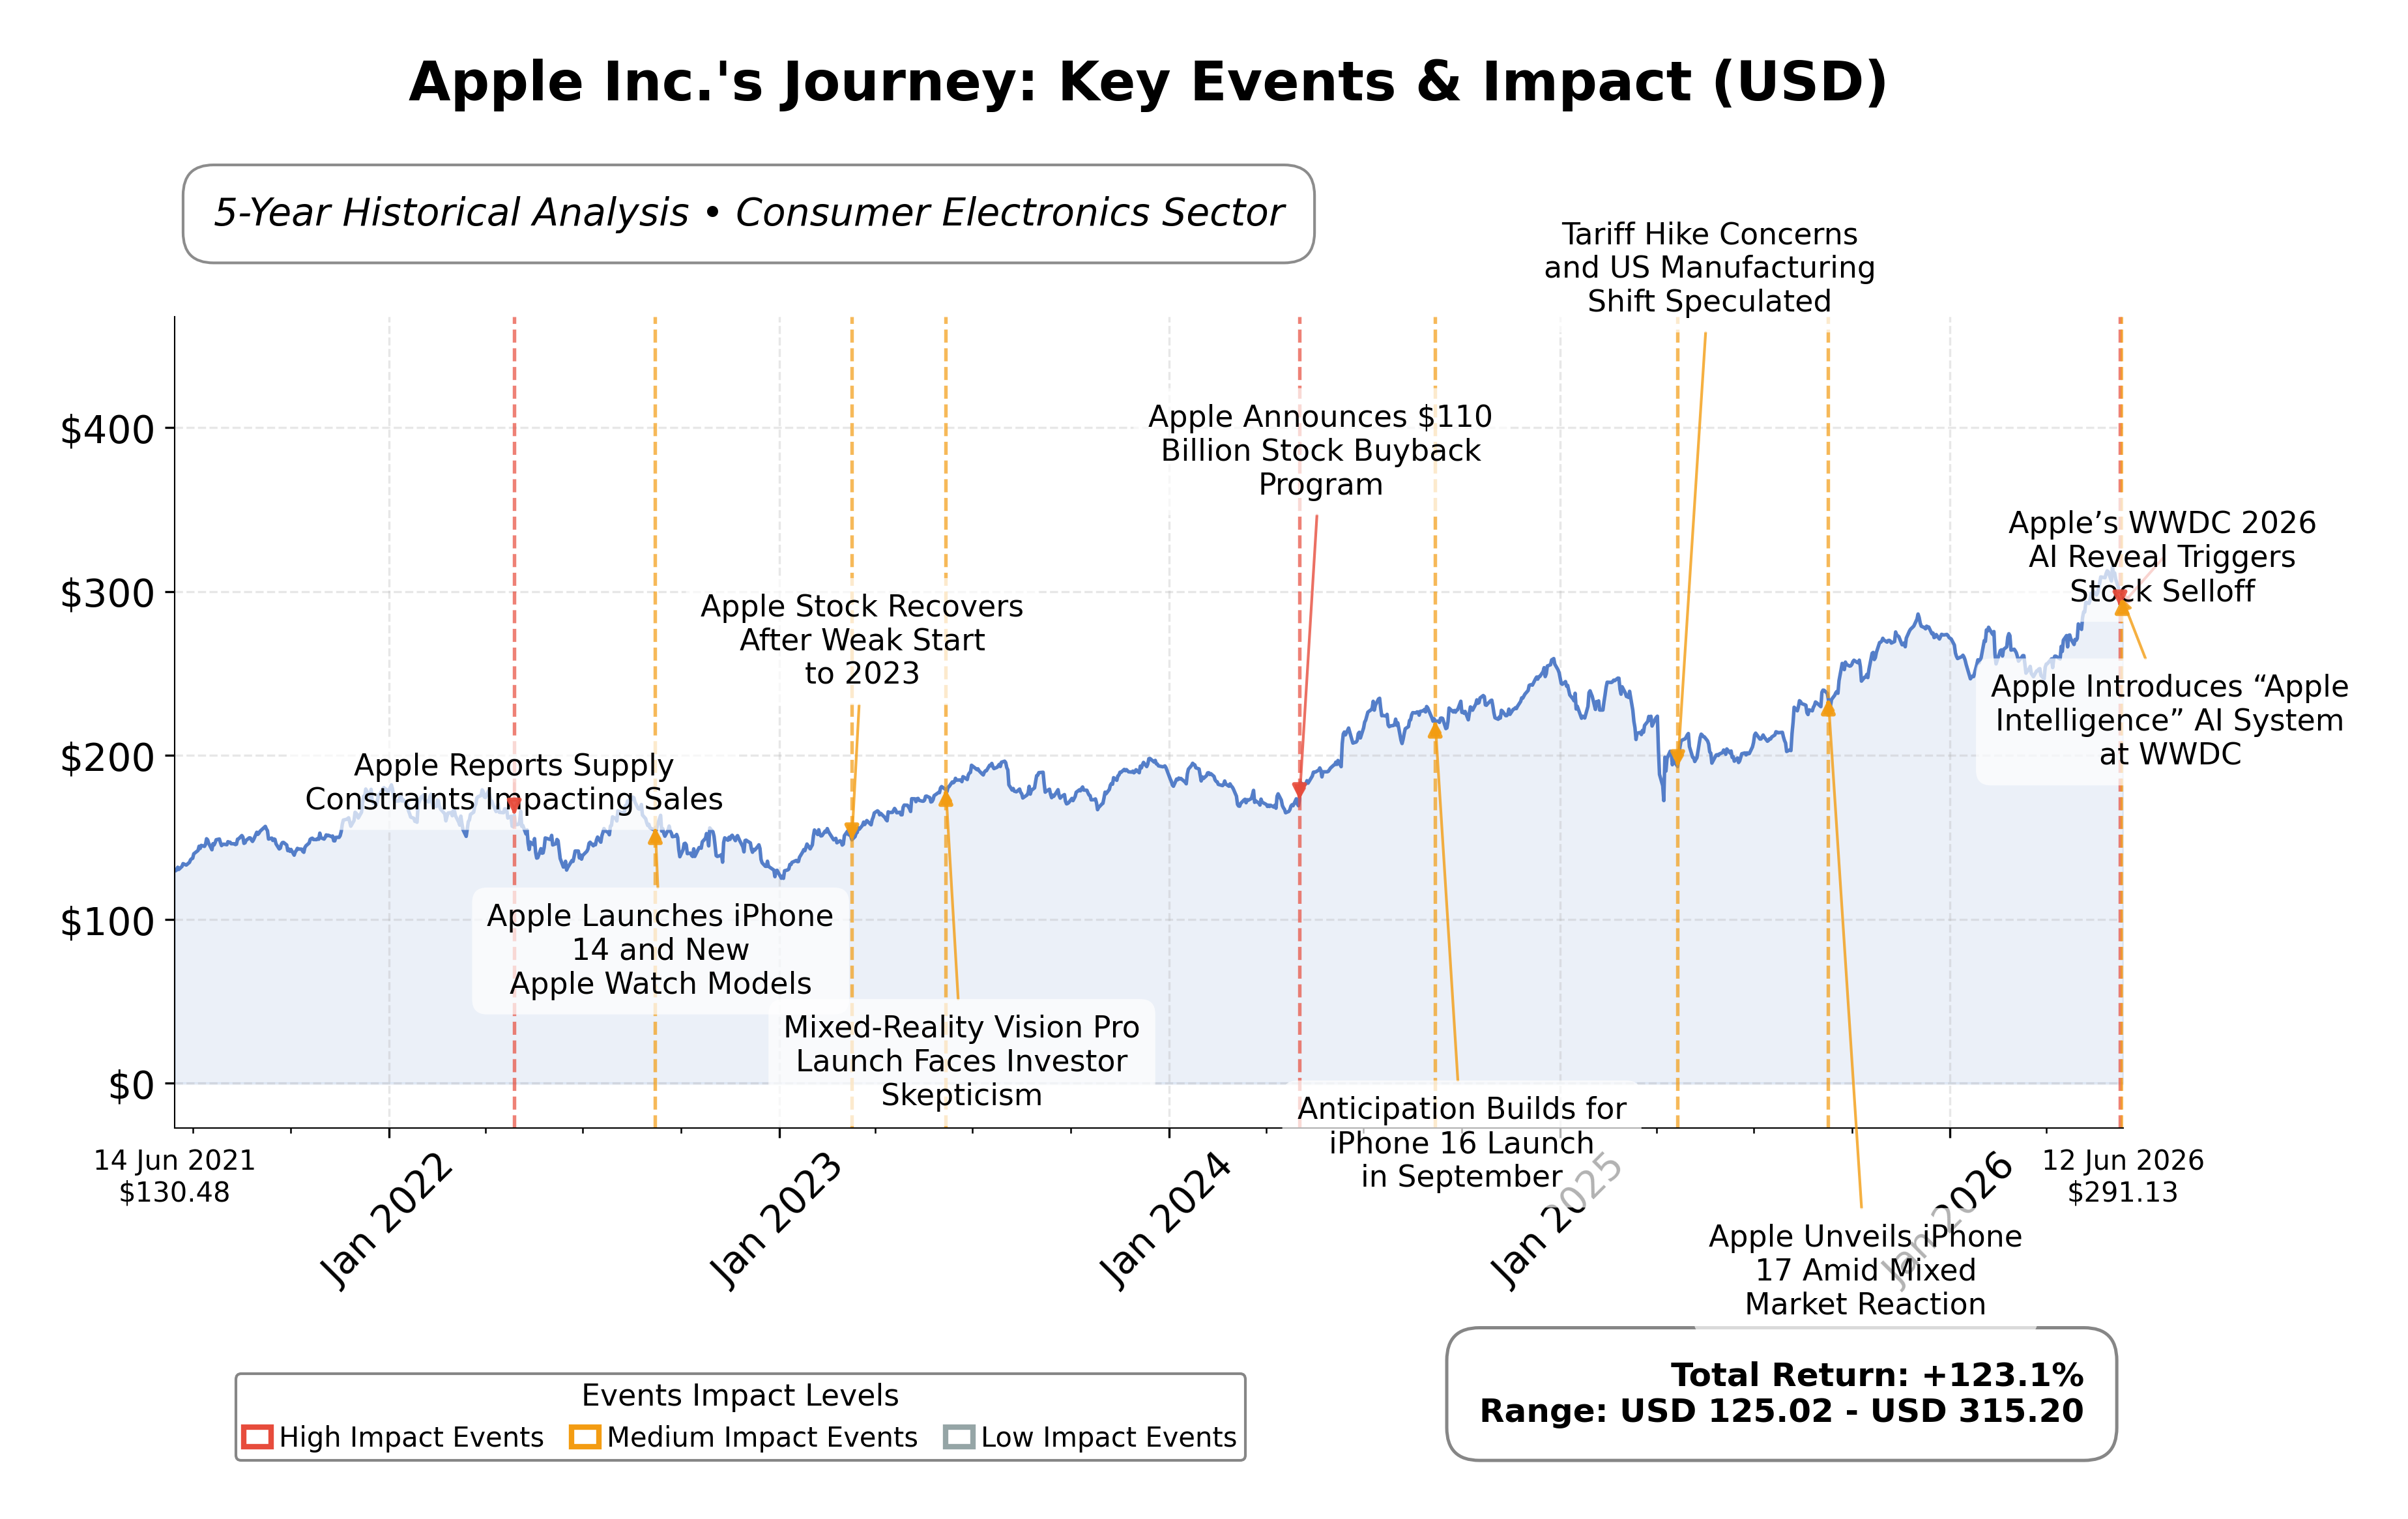
Stock Journey
Key Positives and Key Risks
Pros
- Strong profitability with a net margin of 27.2% indicating efficient operations.
- Robust cash flow generation with operating cash flow of $140.2 billion supporting innovation and shareholder returns.
- Market capitalization of $4.51 trillion reflects dominant industry position and investor confidence.
Cons
- High valuation multiples including a P/E ratio of 37.16 and P/B ratio of 42.33 may constrain near-term upside.
- Total debt to equity ratio of 79.5% indicates moderate leverage that could impact financial flexibility.
- Recent stock volatility and mixed technical momentum suggest potential short-term price fluctuations.
Disclosure: This information is for general awareness and does not constitute investment advice
Report Summary
Apple Inc. operates as a leading technology company listed on the NASDAQ exchange under the symbol AAPL. It designs, manufactures, and markets a broad portfolio of consumer electronics including the iPhone, Mac computers, iPad tablets, and a range of wearables and accessories such as AirPods and Apple Watch. The company also provides digital services through platforms like the App Store and Apple Music, positioning itself as a dominant player in the global consumer electronics and technology sector. Apple’s integrated ecosystem and strong brand presence support its market leadership in the technology sector.
Financially, Apple reported trailing twelve-month revenue of approximately $451.4 billion with a gross margin of 49.3%, an operating margin of 32.3%, and a net profit margin of 27.2%. The company’s return on equity (ROE) stands at 141.47%, and return on assets (ROA) at 26.23%, reflecting exceptional profitability and efficient asset utilization. Operating cash flow totaled $140.2 billion with free cash flow at $101.1 billion, underscoring strong cash generation capabilities. These metrics indicate robust operational performance and financial health.
Apple’s valuation metrics show a trailing price-to-earnings (P/E) ratio of 37.16, a price-to-book (P/B) ratio of 42.33, and an enterprise value to EBITDA (EV/EBITDA) multiple of 28.32. The market capitalization is approximately $4.51 trillion, positioning Apple as one of the largest publicly traded companies globally. The stock trades near $291, within a 52-week range of $195.07 to $316.94, indicating it is currently closer to its high-end valuation range. Forward P/E is 31.99, suggesting expectations of continued earnings growth.
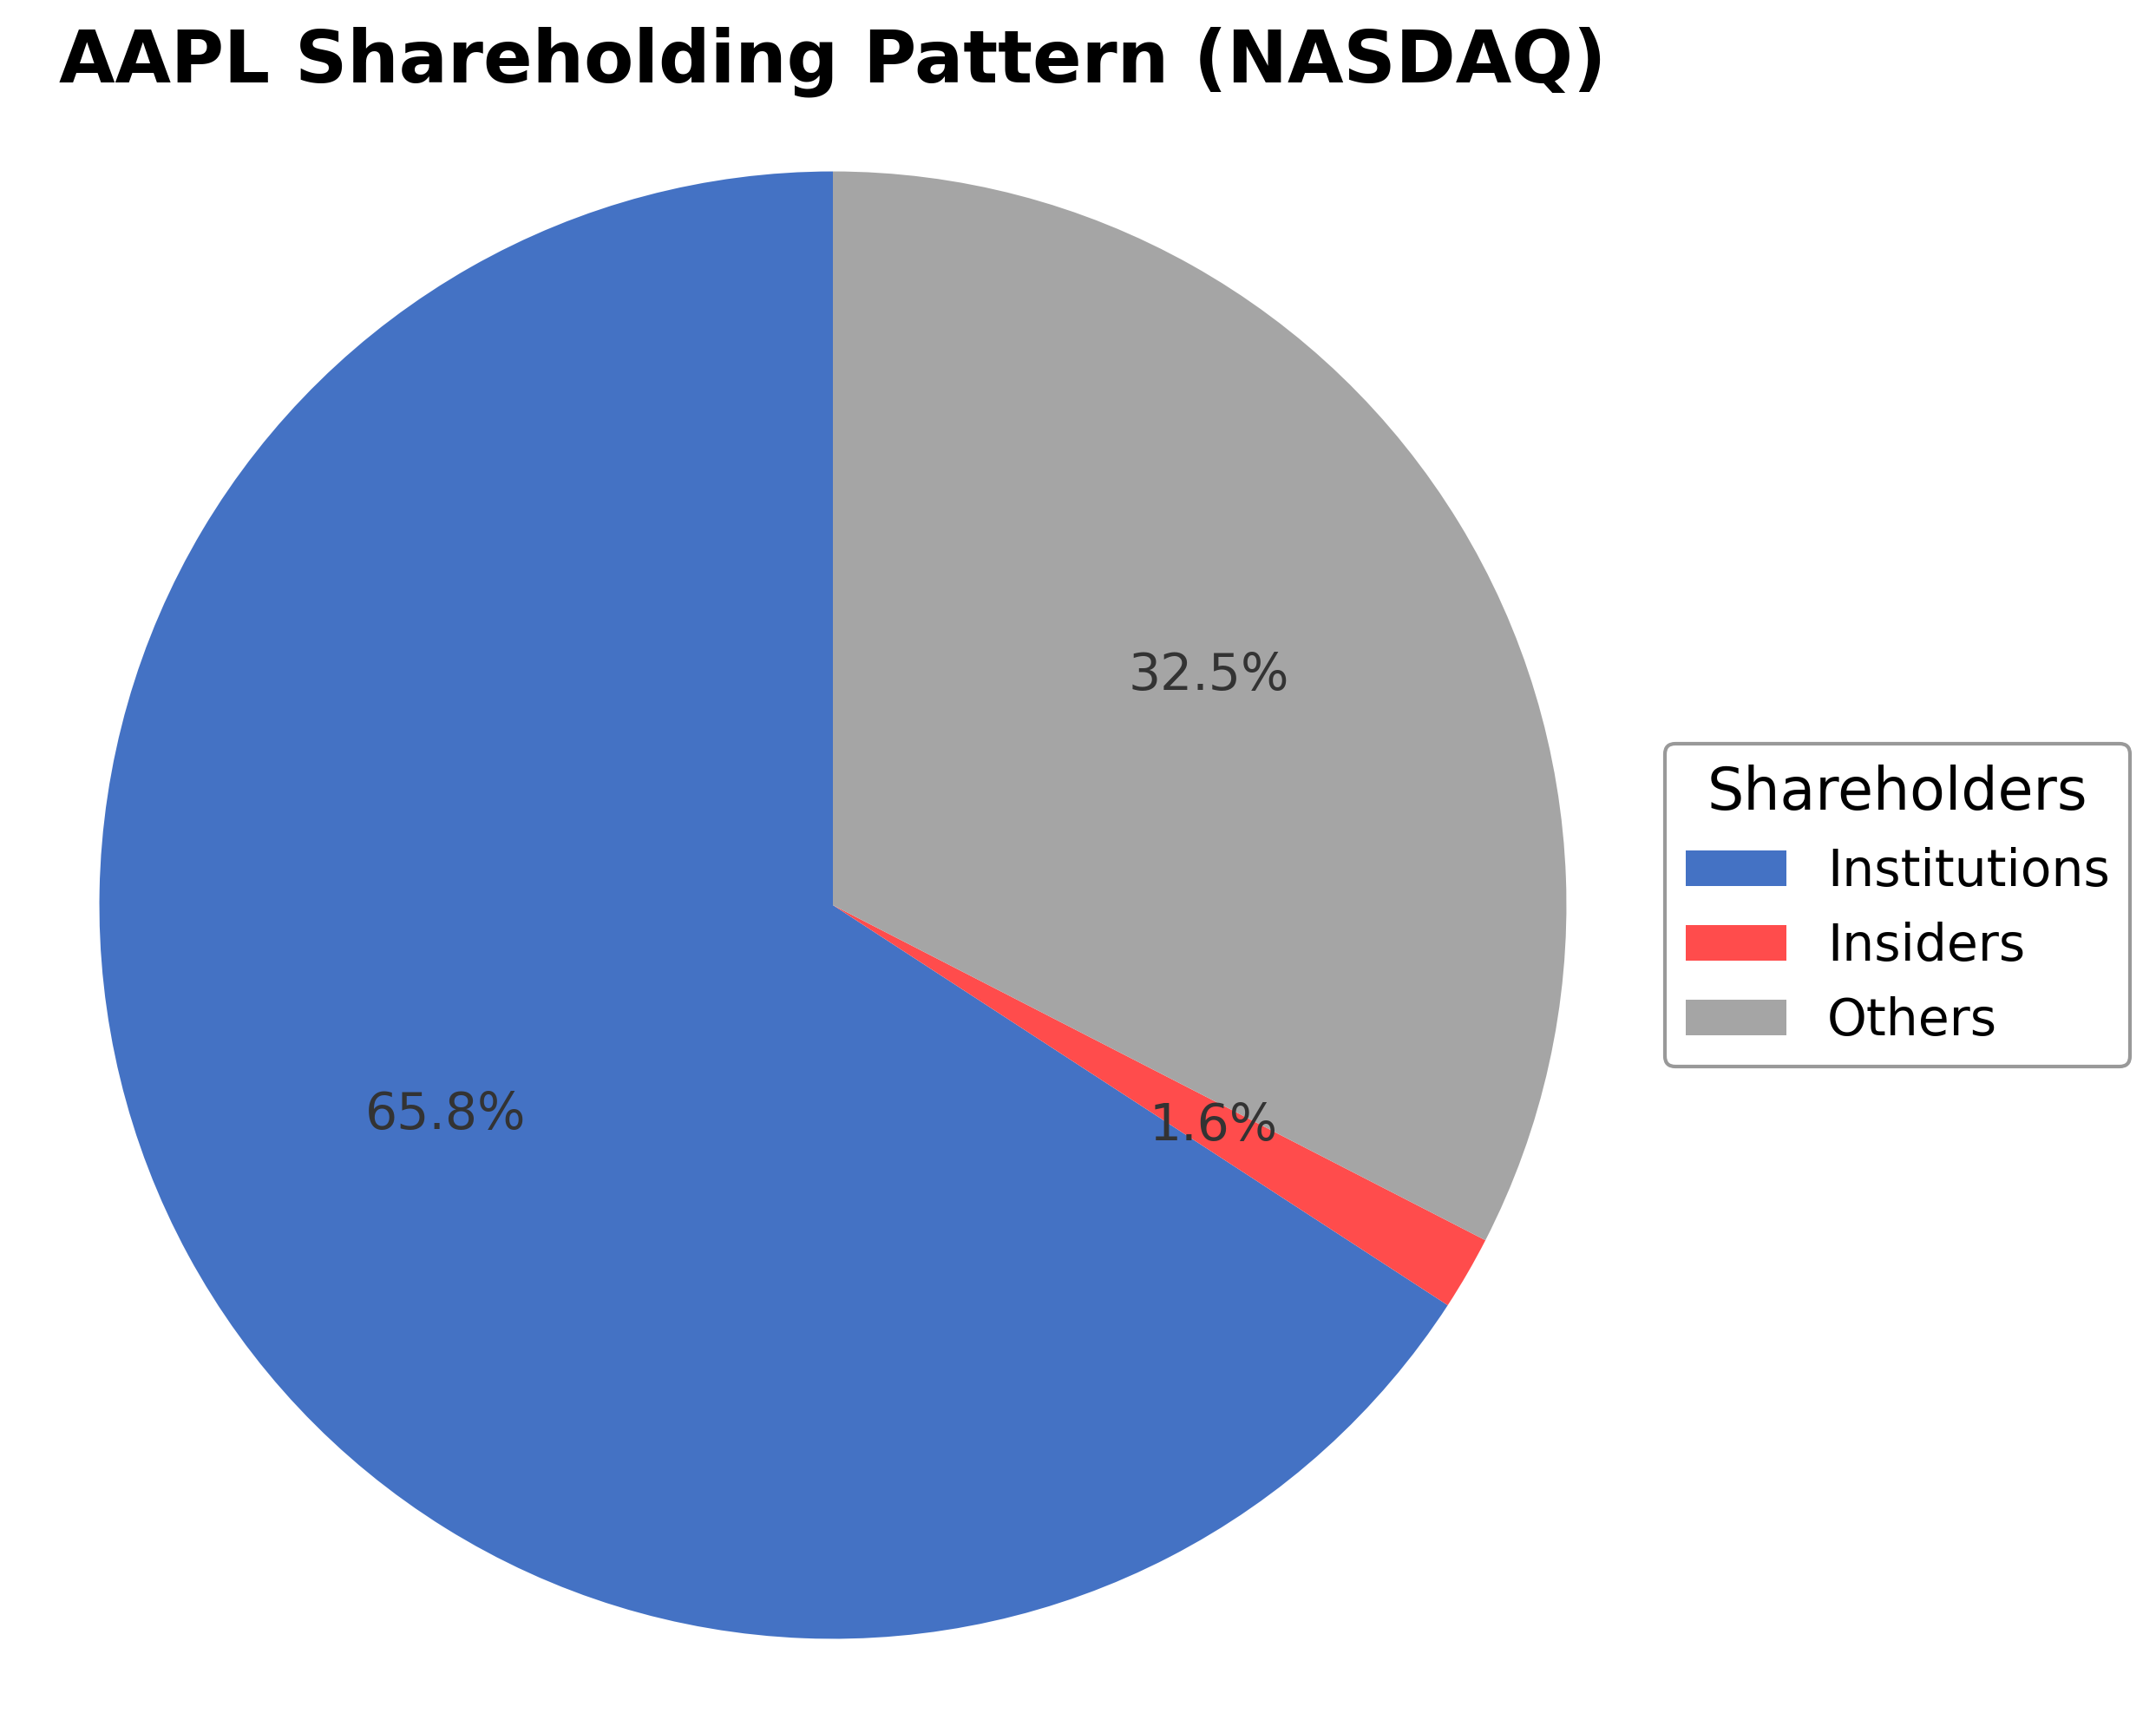
Key strengths include Apple’s massive cash reserves of $68.5 billion, moderate debt level with a total debt to equity ratio of 79.5%, and strong institutional ownership at 65.8%. The company’s market leadership, diversified product portfolio, and ongoing innovation initiatives such as AI integration and software updates support its competitive position. Risks involve regulatory scrutiny, competitive pressures in technology and AI sectors, and potential supply chain cost increases. Recent strategic actions include significant software platform updates and AI enhancements, notably the Siri AI upgrade.
Technically, Apple’s stock is in an overall uptrend trading above its 50-day and 200-day moving averages, with momentum indicators showing mixed signals amid recent volatility. The stock’s proximity to recent highs and ongoing news flow around AI and product innovation suggest a dynamic environment. Overall, the data supports a cautious stance with attention to valuation and market developments, reflecting a balanced view of opportunity and risk.
Company and Industry Overview
Company Basics
Price Performance
Company Size
Shareholding Pattern
Sector and Industry Analysis
The global apple market is a significant segment within the agricultural sector, encompassing cultivation, harvesting, distribution, and retail of various apple varieties. It serves both fresh consumption and processed product demands, with growth driven by rising health awareness and organic produce popularity. The market is projected to expand steadily through 2034, supported by technological advancements and increasing disposable incomes, with major players including multinational corporations and numerous local producers across key regions such as Asia, Europe, and North America.
Emerging trends in the apple industry include a growing preference for organic and locally sourced apples, innovations in packaging and storage technologies, and the adoption of smart farming techniques to improve yield and sustainability. Competitive dynamics are shaped by intensified rivalry between global and regional producers, with barriers including climate-related production risks and stringent food safety standards. Strategic partnerships and technology collaborations are increasingly important for market penetration and differentiation amid fluctuating trade tariffs and evolving consumer preferences.
The regulatory environment is characterized by tightening food safety and quality standards, which influence production practices and market access. Policies related to carbon pricing and energy security also affect operational costs and sustainability initiatives within the sector. Trade agreements and geopolitical developments continue to impact export-import flows and pricing, necessitating adaptive strategies by industry participants to navigate compliance and capitalize on emerging regional opportunities.
Note: Analysis synthesized from industry research, market reports, and regulatory filings. Information is subject to change based on market conditions.
Financial Ratios Dashboard
Illustrative Scenario Analysis
DCF Assumptions:
Method: Two-Stage EPS-Priority Model
Financials
Peer Analysis
| Company Name | Market Cap | P/E Ratio | P/B Ratio | EV/EBITDA | Price to CFO |
|---|---|---|---|---|---|
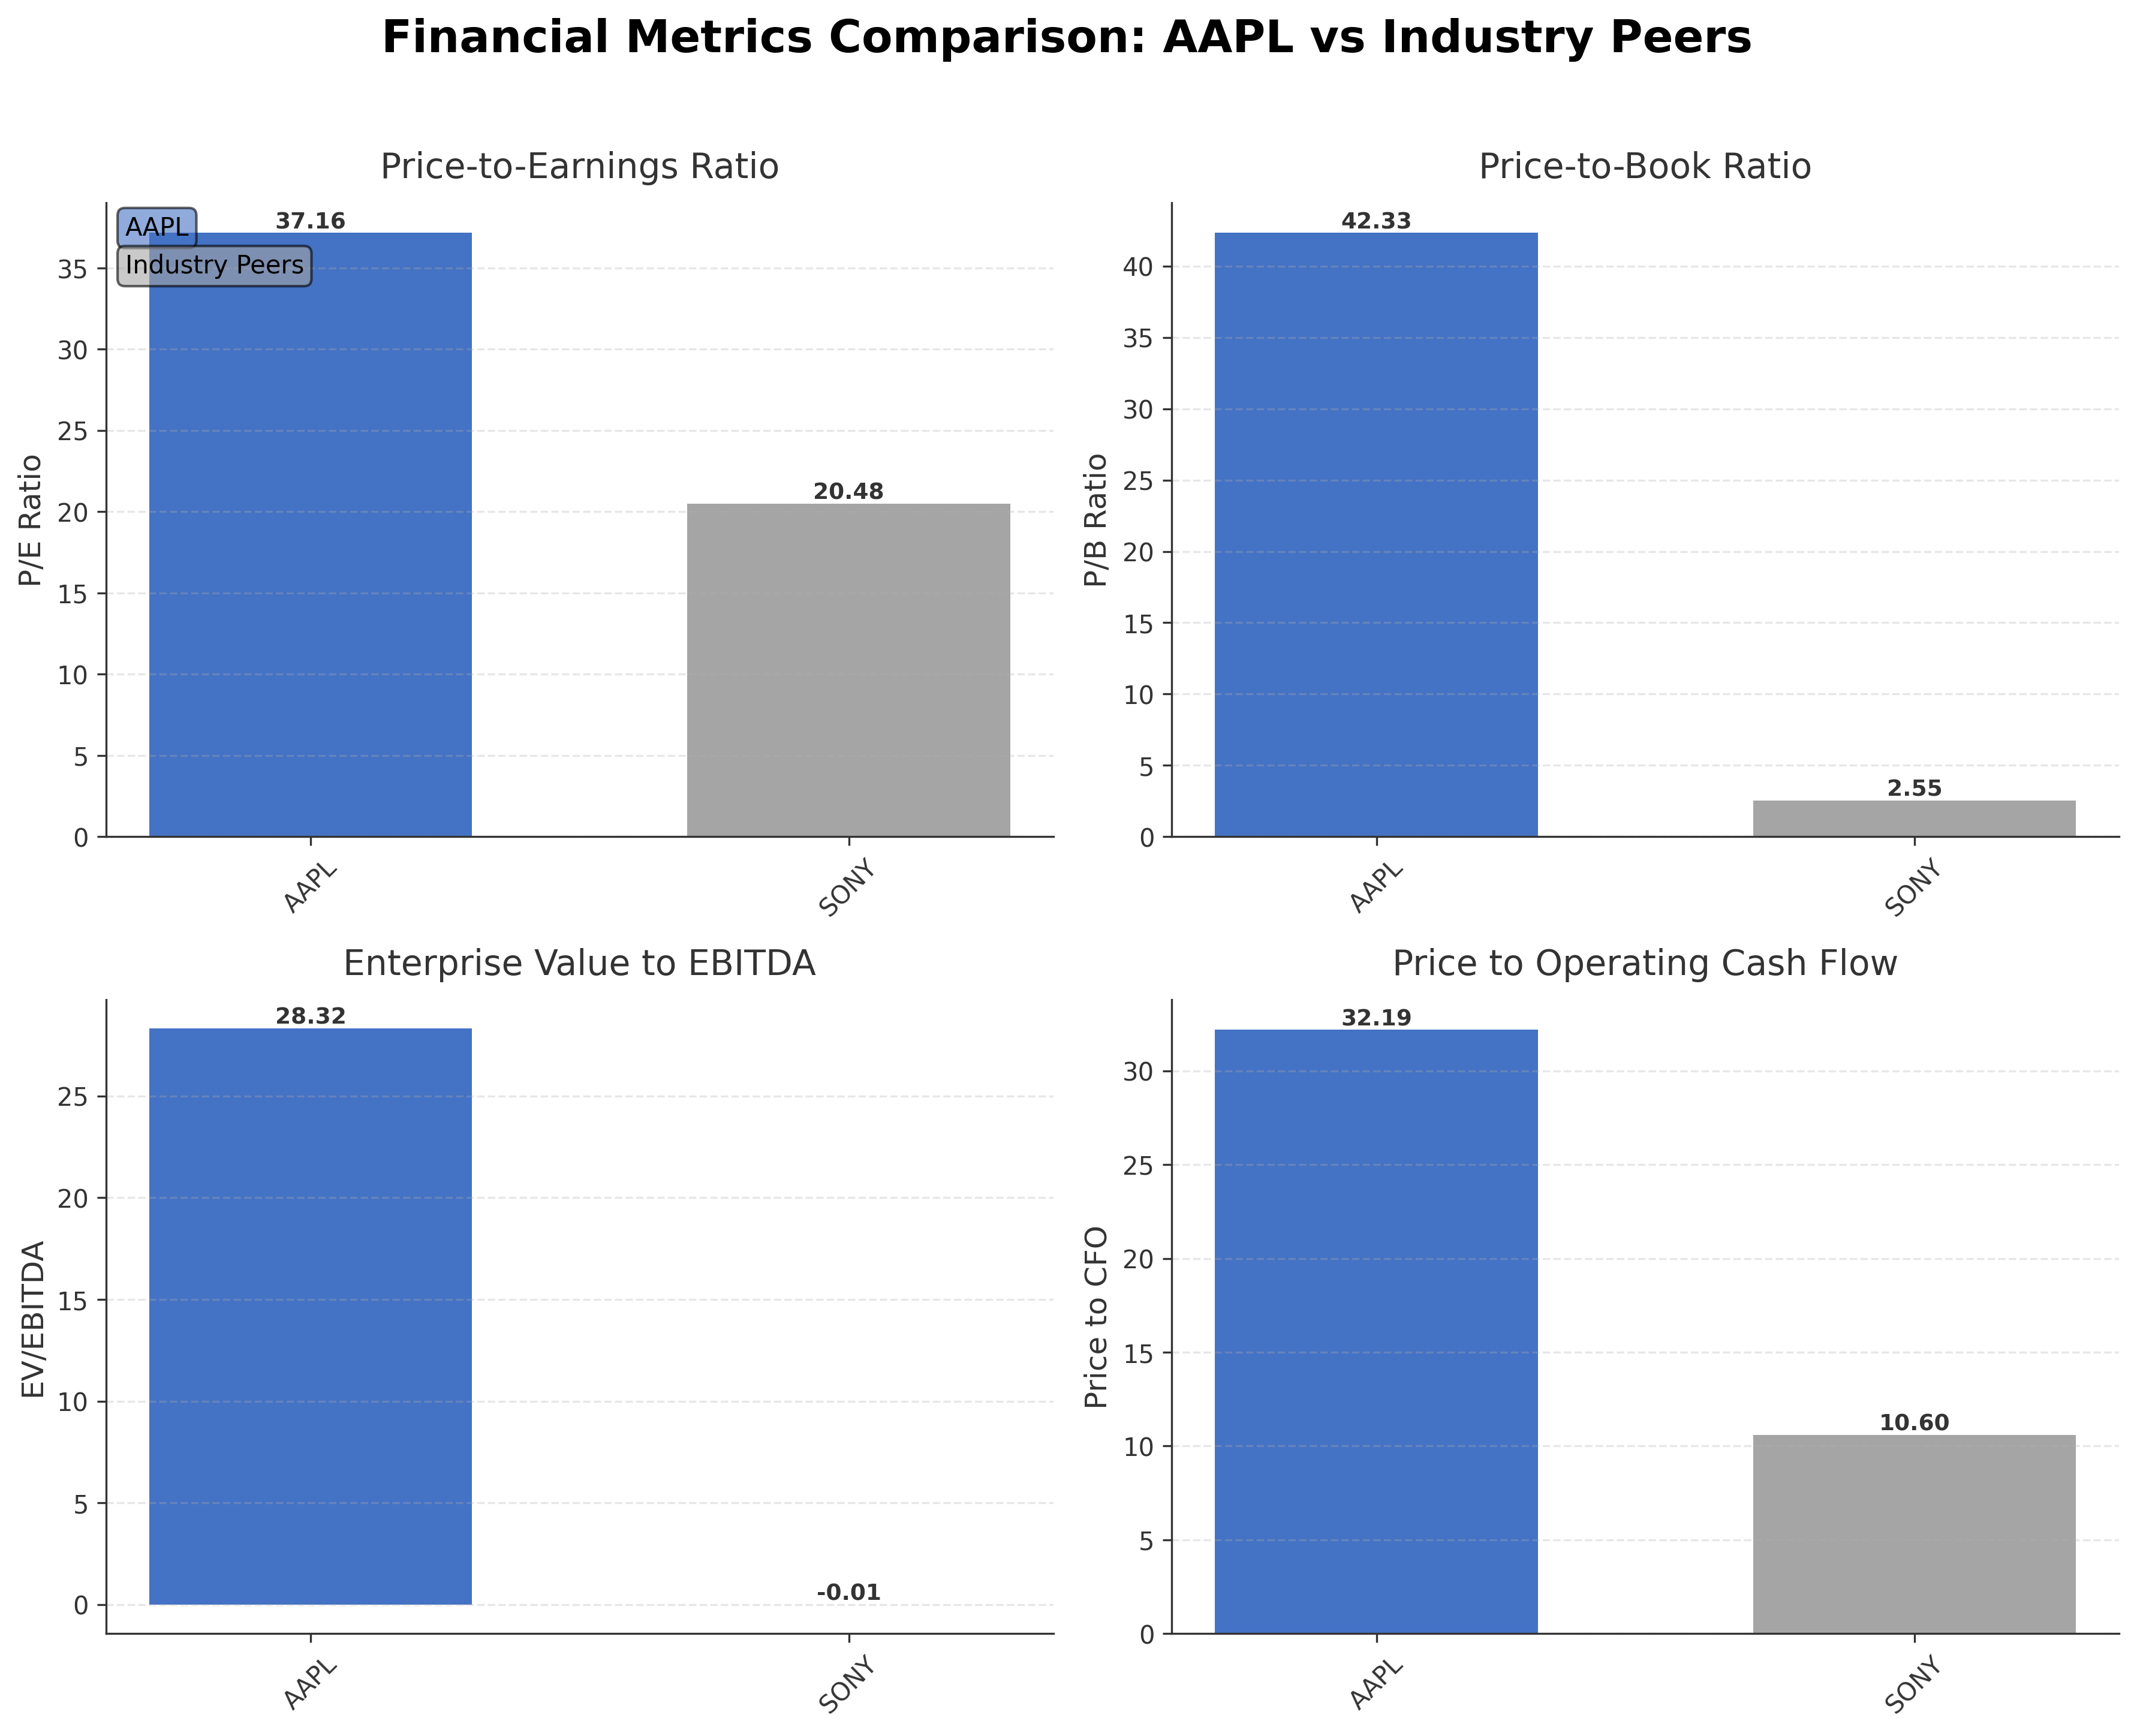
| Apple Inc. | $4.51T | 37.16 | 42.33 | 28.32 | 32.19 |
| Sony Group Corporation - Sponsored American Depositary Receipt | $128.91B | 20.48 | 2.55 | -0.01 | 10.60 |
Comparison Analysis: Apple Inc. significantly surpasses its peer Sony Group Corporation in market capitalization, reflecting its status as a global technology leader. Apple's valuation multiples such as P/E and P/B ratios are substantially higher, indicating a premium pricing relative to fundamentals compared to Sony. While Sony exhibits a stronger return on equity at 12.37% versus Apple's 1.41%, Apple’s scale and cash flow metrics demonstrate robust financial strength. The EV/EBITDA and price to CFO ratios further highlight Apple's higher valuation multiples, consistent with market expectations for growth and innovation leadership in the consumer electronics sector.
Financial Metrics Comparison with Peers
Financial Statements
Comprehensive financial data including income, balance sheet, and cash flow metrics
Income Statement
| fiscal_date | 2025-09-30 | 2024-09-30 | 2023-09-30 | 2022-09-30 | 2021-09-30 |
|---|---|---|---|---|---|
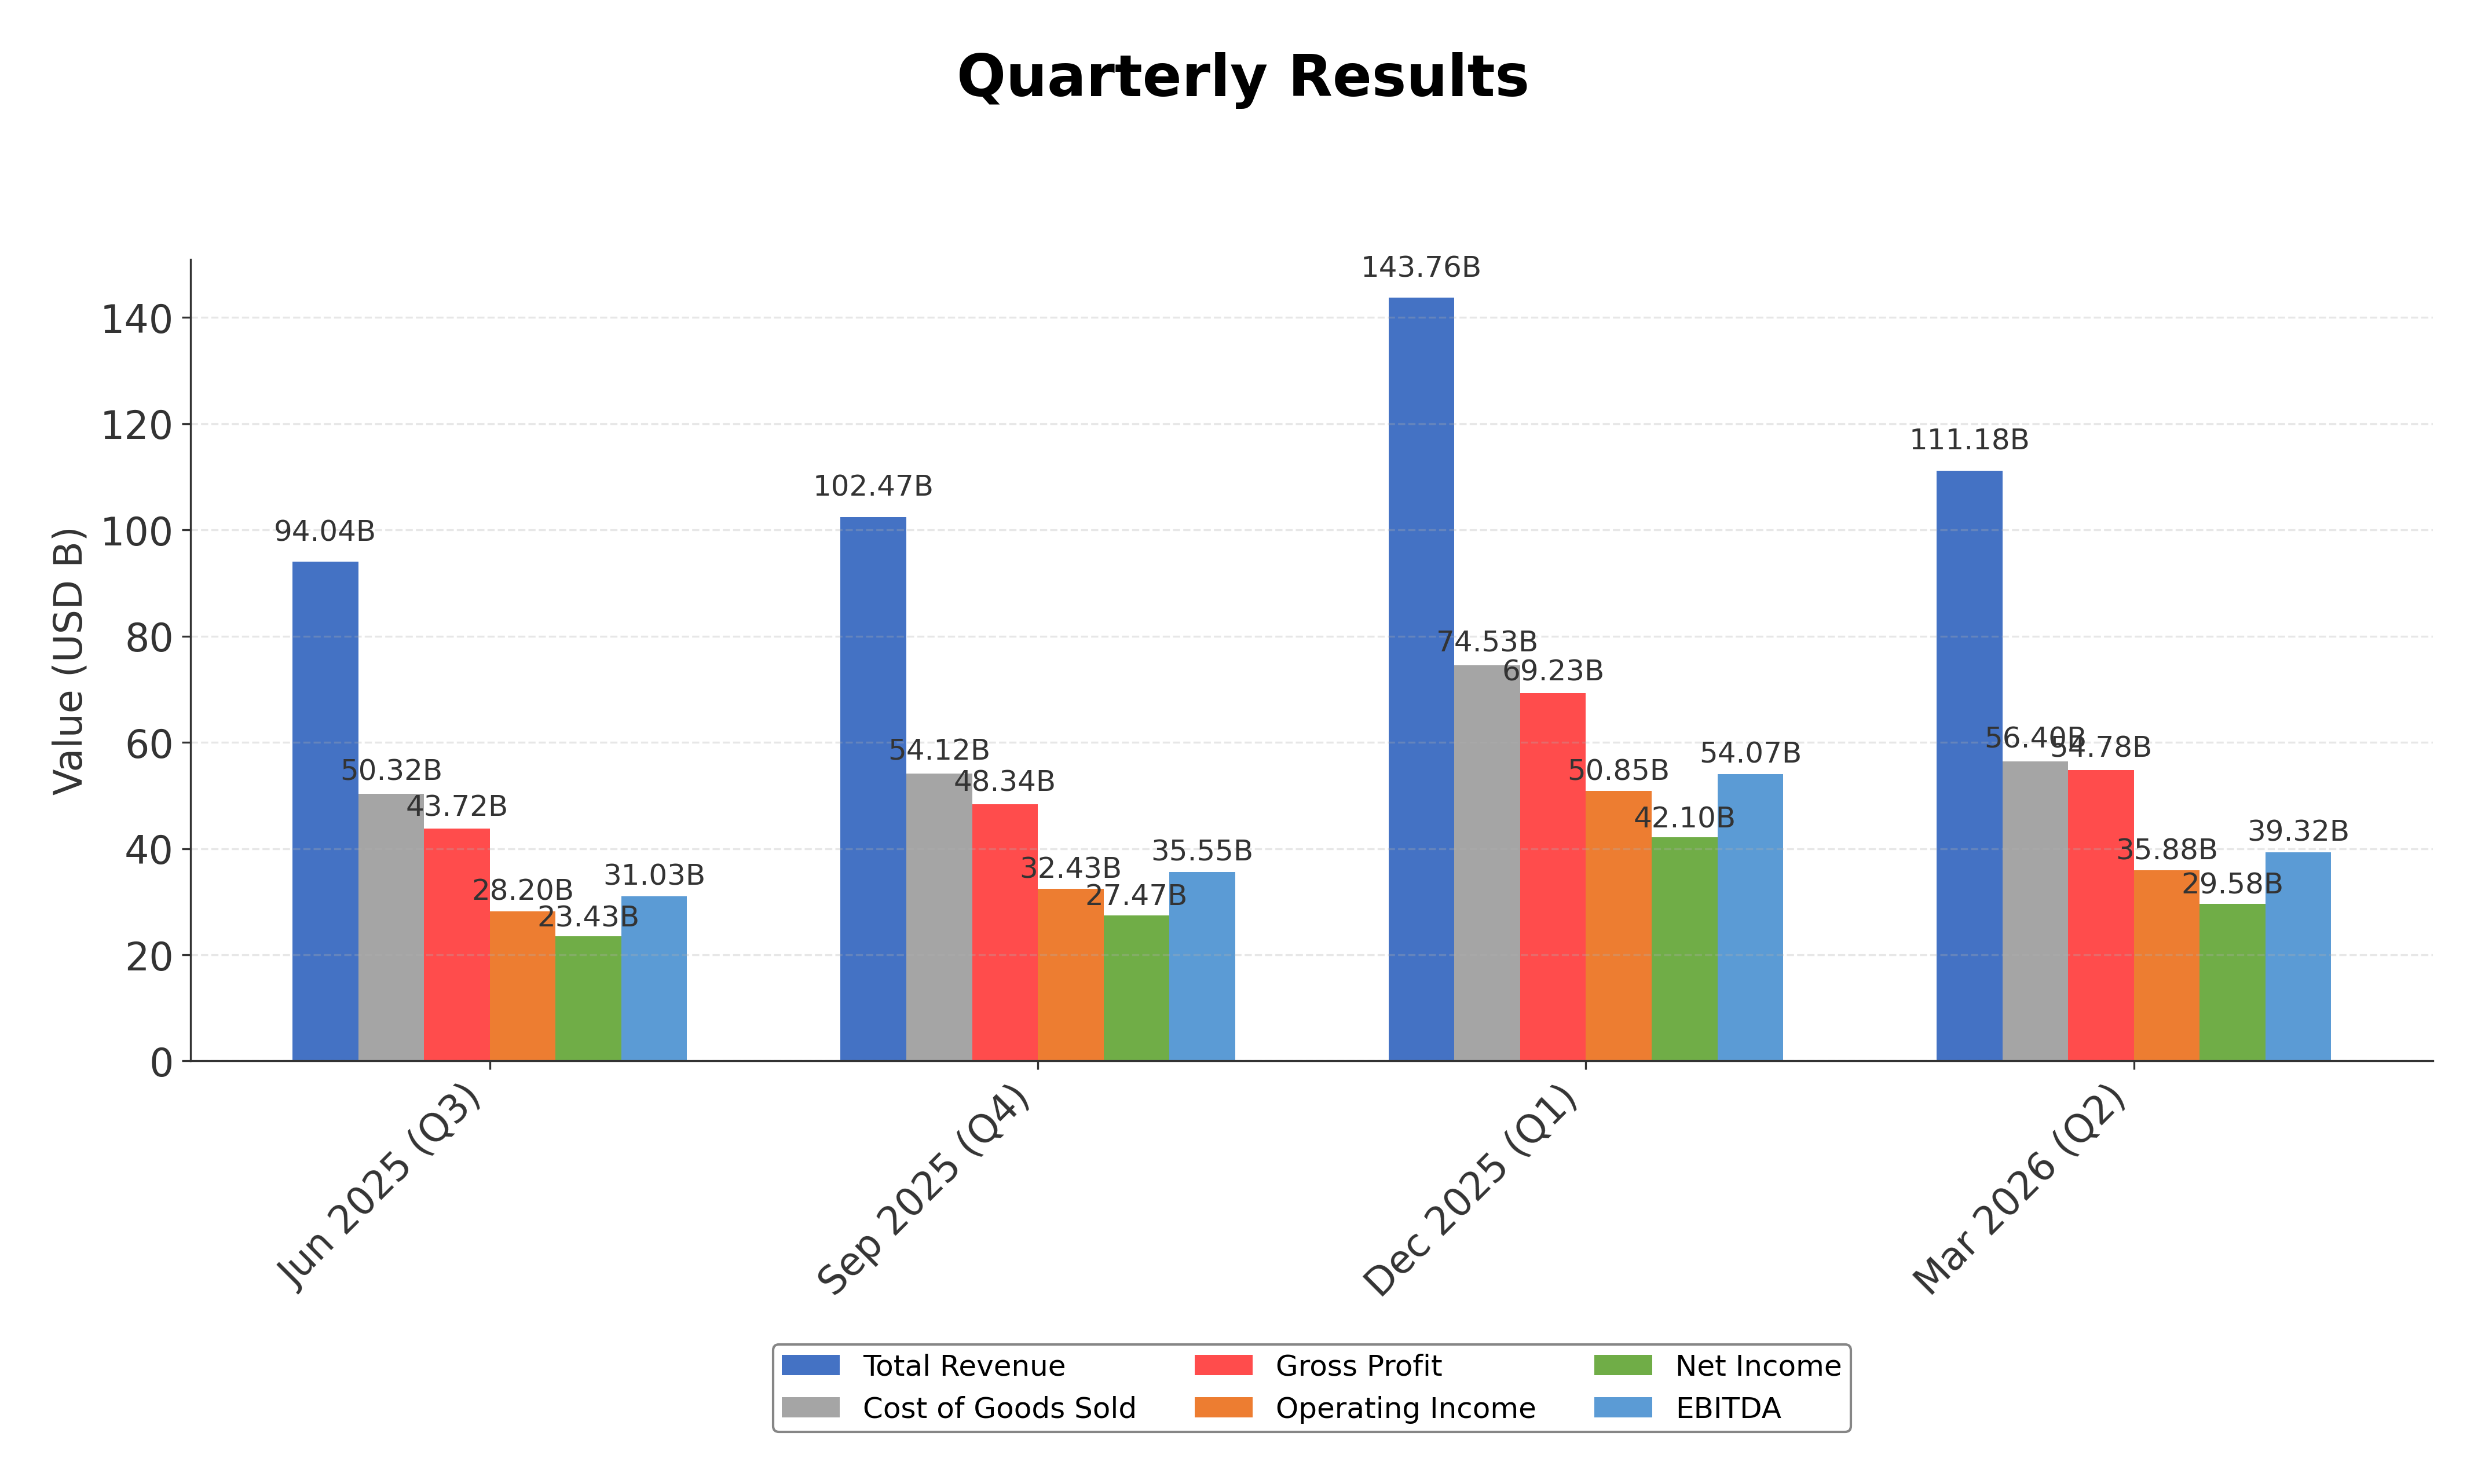
| Sales | 416.16B | 391.04B | 383.29B | 394.33B | 365.82B |
| Cost Of Goods | 220.96B | 210.35B | 214.14B | 223.55B | 212.98B |
| Gross Profit | 195.20B | 180.68B | 169.15B | 170.78B | 152.84B |
| Operating Expense Research And Development | 34.55B | 31.37B | 29.91B | 26.25B | 21.91B |
| Operating Expense Selling General And Administrative | 27.60B | 26.10B | 24.93B | 25.09B | 21.97B |
| Operating Income | 133.05B | 123.22B | 114.30B | 119.44B | 108.95B |
| Other Income Expense | -321.00M | 269.00M | -565.00M | -334.00M | 60.00M |
| Pretax Income | 132.73B | 123.48B | 113.74B | 119.10B | 109.21B |
| Income Tax | 20.72B | 29.75B | 16.74B | 19.30B | 14.53B |
| Net Income | 112.01B | 93.74B | 97.00B | 99.80B | 94.68B |
| Eps Basic | 7.49 | 6.11 | 6.16 | 6.15 | 5.67 |
| Eps Diluted | 7.46 | 6.08 | 6.13 | 6.11 | 5.61 |
| Basic Shares Outstanding | 14.95B | 15.34B | 15.74B | 16.22B | 16.70B |
| Diluted Shares Outstanding | 14.95B | 15.34B | 15.74B | 16.22B | 16.70B |
| Ebit | 133.05B | 123.22B | 114.30B | 119.44B | 111.85B |
| Ebitda | 144.75B | 134.66B | 125.82B | 130.54B | 123.14B |
| Net Income Continuous Operations | 112.01B | 93.74B | 97.00B | 99.80B | 94.68B |
| Non Operating Interest Income | N/A | N/A | 3.75B | 2.83B | 2.84B |
| Non Operating Interest Expense | N/A | N/A | 3.93B | 2.93B | 2.65B |
Data provided by Twelve Data
Balance Sheet
| fiscal_date | 2025-09-30 | 2024-09-30 | 2023-09-30 | 2022-09-30 | 2021-09-30 |
|---|---|---|---|---|---|
| Cash And Cash Equivalents | 35.93B | 29.94B | 29.96B | 23.65B | 34.94B |
| Accounts Receivable | 39.78B | 33.41B | 29.51B | 28.18B | 26.28B |
| Total Assets | 359.24B | 364.98B | 352.58B | 352.75B | 351.00B |
| Total Liabilities | 285.51B | 308.03B | 290.44B | 302.08B | 287.91B |
| Long Term Debt | 78.33B | 85.75B | 95.28B | 109.71B | 119.38B |
| Shareholders Equity | 73.73B | 56.95B | 62.15B | 50.67B | 63.09B |
Data provided by Twelve Data
Cash Flow Statement
| fiscal_date | 2025-09-30 | 2024-09-30 | 2023-09-30 | 2022-09-30 | 2021-09-30 |
|---|---|---|---|---|---|
| Operating Activities Net Income | 112.01B | 93.74B | 97.00B | 99.80B | 94.68B |
| Operating Activities Depreciation | 11.70B | 11.45B | 11.52B | 11.10B | 11.28B |
| Operating Activities Stock Based Compensation | 12.86B | 11.69B | 10.83B | 9.04B | 7.91B |
| Operating Activities Other Non Cash Items | -89.00M | -2.27B | -2.23B | 1.01B | -4.92B |
| Operating Activities Accounts Receivable | -7.03B | -5.14B | -417.00M | -9.34B | -14.03B |
| Operating Activities Accounts Payable | 902.00M | 6.02B | -1.89B | 9.45B | 12.33B |
| Operating Activities Other Assets Liabilities | -18.87B | 2.77B | -4.27B | 1.57B | -1.53B |
| Operating Activities Operating Cash Flow | 111.48B | 118.25B | 110.54B | 123.52B | 100.94B |
| Investing Activities Capital Expenditures | -12.71B | -9.45B | -10.96B | -10.71B | -11.09B |
| Investing Activities Purchase Of Investments | -24.41B | -48.66B | -29.51B | -76.92B | -109.56B |
| Investing Activities Sale Of Investments | 53.80B | 62.35B | 45.51B | 67.36B | 106.48B |
| Investing Activities Other Investing Activity | -1.48B | -1.31B | -1.34B | -2.09B | -385.00M |
| Investing Activities Investing Cash Flow | 15.20B | 2.94B | 3.71B | -22.66B | -14.58B |
| Financing Activities Long Term Debt Issuance | 4.48B | 0.00 | 5.23B | 5.46B | 20.39B |
| Financing Activities Long Term Debt Payments | -10.93B | -9.96B | -11.15B | -9.54B | -8.75B |
| Financing Activities Short Term Debt Issuance | -2.03B | 3.96B | -3.98B | 3.96B | 1.02B |
| Financing Activities Common Stock Repurchase | -90.71B | -94.95B | -77.55B | -89.40B | -85.97B |
| Financing Activities Common Dividends | -15.42B | -15.23B | -15.03B | -14.84B | -14.47B |
| Financing Activities Other Financing Charges | -6.07B | -5.80B | -6.01B | -6.38B | -5.58B |
| Financing Activities Financing Cash Flow | -120.69B | -121.98B | -108.49B | -110.75B | -92.25B |
| End Cash Position | 35.93B | 29.94B | 30.74B | 24.98B | 35.93B |
| Income Tax Paid | 43.37B | 26.10B | 18.68B | 19.57B | 25.39B |
| Free Cash Flow | 98.77B | 108.81B | 99.58B | 111.44B | 92.95B |
| Interest Paid | N/A | N/A | 3.80B | 2.87B | 2.69B |
| Operating Activities Deferred Taxes | N/A | N/A | N/A | 895.00M | -4.77B |
| Investing Activities Net Acquisitions | N/A | N/A | N/A | -306.00M | -33.00M |
| Financing Activities Common Stock Issuance | N/A | N/A | N/A | N/A | 1.10B |
Data provided by Twelve Data
Technical Analysis
Key Insights
- Apple's stock is currently in a sustained uptrend, trading near recent highs with price action showing consolidation after a brief pullback.
- Key support levels are identified around $270 and $260, while resistance is near the 52-week high at $317.
- The price is above the 10-day, 50-day (approximately $279), and 200-day (approximately $264) moving averages, indicating bullish medium- and long-term momentum.
- Momentum indicators show the RSI near neutral levels around 55, MACD is slightly positive but flattening, and Stochastic oscillators suggest a mixed momentum environment.
- Across daily, weekly, and monthly timeframes, the trend remains positive though short-term volatility is evident following recent earnings and product announcements.
- Potential market scenarios include continuation of the uptrend if support holds, or a correction toward $260-$270 if momentum weakens amid valuation concerns.
Trending News
1. Headline: Apple Inc. Stock (US0378331005): Valuation metrics in focus after steady share price
Summary: Apple shares trade broadly steady while investors reassess valuation, margins and cash returns after the latest run-up in the stock.
Sentiment: positive
2. Headline: The Tariff Threat To Apple Stock Vanished. Its Replacement Is A Bigger Worry. | Trefis
Summary: But the new, loud warnings on memory costs land directly on Apple’s stunning profitability. The company’s net margin just hit a 3-year peak of 27.2%. That incredible efficiency is what powers the stock, and it’s now facing a direct, “increasing” threat.
Sentiment: positive
3. Headline: Apple Inc. Stock (US0378331005): Shares Hover Near Recent Highs After Volatile Stretch
Summary: Apple's Nasdaq-listed stock is trading just below recent highs after a sharp two-day pullback, as investors weigh AI expectations and valuation following a strong spring rally.
Sentiment: negative
4. Headline: How Apple rebuilt Siri with Google's AI
Summary: Apple's new smarter version of Siri gets its brains from Google.
Sentiment: neutral
5. Headline: Apple Just Delivered Bad News for OpenAI and Anthropic, but Alphabet Could Be a Winner | The Motley Fool
Summary: For the past two years, the market has been expecting significant artificial intelligence (AI) developments from Apple's Apple Intelligence, but it hasn't been satisfied, and the stock has dropped. Image source: Apple. However, this year's updates might spell bad news for OpenAI and Anthropic, ...
Sentiment: negative
Powered by Brave
Recent Updates
News Summary
As of 2026-06-10. At its WWDC 2026 keynote, Apple announced 250 new features and enhancements across its major operating systems including iOS 27, macOS 27 Golden Gate, watchOS 27, tvOS 27, and visionOS 27, currently in developer beta. This extensive software update highlights Apple's commitment to innovation and improving user experience. Additionally, Apple unveiled a major update to its Siri AI, marking a significant advancement in its artificial intelligence capabilities. Despite the positive technological developments, the stock experienced a decline following the Siri announcement, reflecting investor caution regarding the immediate impact of AI enhancements. These updates underscore Apple's strategic focus on software and AI integration within its ecosystem.
News Sentiment
The overall sentiment from recent updates is cautiously positive, driven by significant software innovation and AI advancements showcased at WWDC 2026. While the unveiling of 250 new features across multiple platforms reinforces Apple's innovation leadership, the mixed market reaction to the Siri AI update indicates some investor skepticism about near-term benefits. The stock's decline post-Siri reveal tempers enthusiasm but does not overshadow the broader positive narrative of product and software evolution. This balanced sentiment reflects recognition of Apple's strengths alongside prudent market appraisal of competitive and technological challenges.
Source List
Analytical Overview
Analysis Summary
Apple's valuation metrics, including a trailing P/E of 37.16 and forward P/E of 31.99, are elevated relative to the consumer electronics industry average, reflecting premium market expectations. The company exhibits a strong growth trajectory with quarterly revenue growth of 16.6% and solid cash flow generation, evidenced by operating cash flow of $140.2 billion and free cash flow of $101.1 billion. Financial health is robust, with a manageable total debt to equity ratio of 79.5% and a current ratio of 1.07, indicating sufficient liquidity to meet short-term obligations. Sector-specific opportunities include advancements in AI and software ecosystems, while challenges encompass rising component costs and regulatory scrutiny. Given Apple’s global market positioning and competitive advantages, the company is well-placed to navigate evolving technology trends.
Overall Business and Market Assessment
Supporting Factors: Apple’s substantial cash reserves, strong profitability with a net margin of 27.2%, and ongoing innovation in AI and software platforms
Risk Factors: No data
SWOT Analysis
Strengths
- Market leadership with a diversified product and services ecosystem.
- Strong profitability with a net margin of 27.2% and high return on equity.
- Robust cash flow generation supporting innovation and shareholder returns.
- Extensive global brand recognition and loyal customer base.
Weaknesses
- High valuation multiples may limit near-term price appreciation.
- Moderate debt levels with a total debt to equity ratio of 79.5%.
- Dependence on iPhone sales for a significant portion of revenue.
- Limited exposure to emerging markets compared to some peers.
Opportunities
- Expansion of AI capabilities and integration across product lines.
- Growth in services segment including subscriptions and digital content.
- Increased adoption of wearables and health-related technologies.
- Potential for new product innovations and ecosystem enhancements.
Threats
- Rising component and memory costs impacting profit margins.
- Intense competition in consumer electronics and AI sectors.
- Regulatory scrutiny in multiple jurisdictions including the EU.
- Supply chain disruptions and geopolitical uncertainties.
Company Description
Apple Inc. designs, manufactures, and markets a wide range of technology products worldwide. These include the iPhone, a line of smartphones; Mac, a line of personal computers; iPad, a line of multi-purpose tablets; and wearables, home, and accessories such as AirPods, Apple Vision Pro, Apple TV, Apple Watch, Beats products, HomePod, as well as Apple branded and third-party accessories. The company operates service platforms including the App Store, Apple Music, and subscription models that provide curated content, cloud services, and digital offerings. Apple Inc. serves individual consumers, businesses, and government sectors through online stores, retail outlets, and partnerships with cellular carriers and resellers. Its products span the information technology sector, impacting mobile communication, personal computing, entertainment, and health monitoring. Founded in 1976 and headquartered in Cupertino, California, Apple Inc. plays a pivotal role in the global technology market by integrating hardware, software, and services into seamless ecosystems.