
Apple Inc (AAPL)
Stock Analysis Report
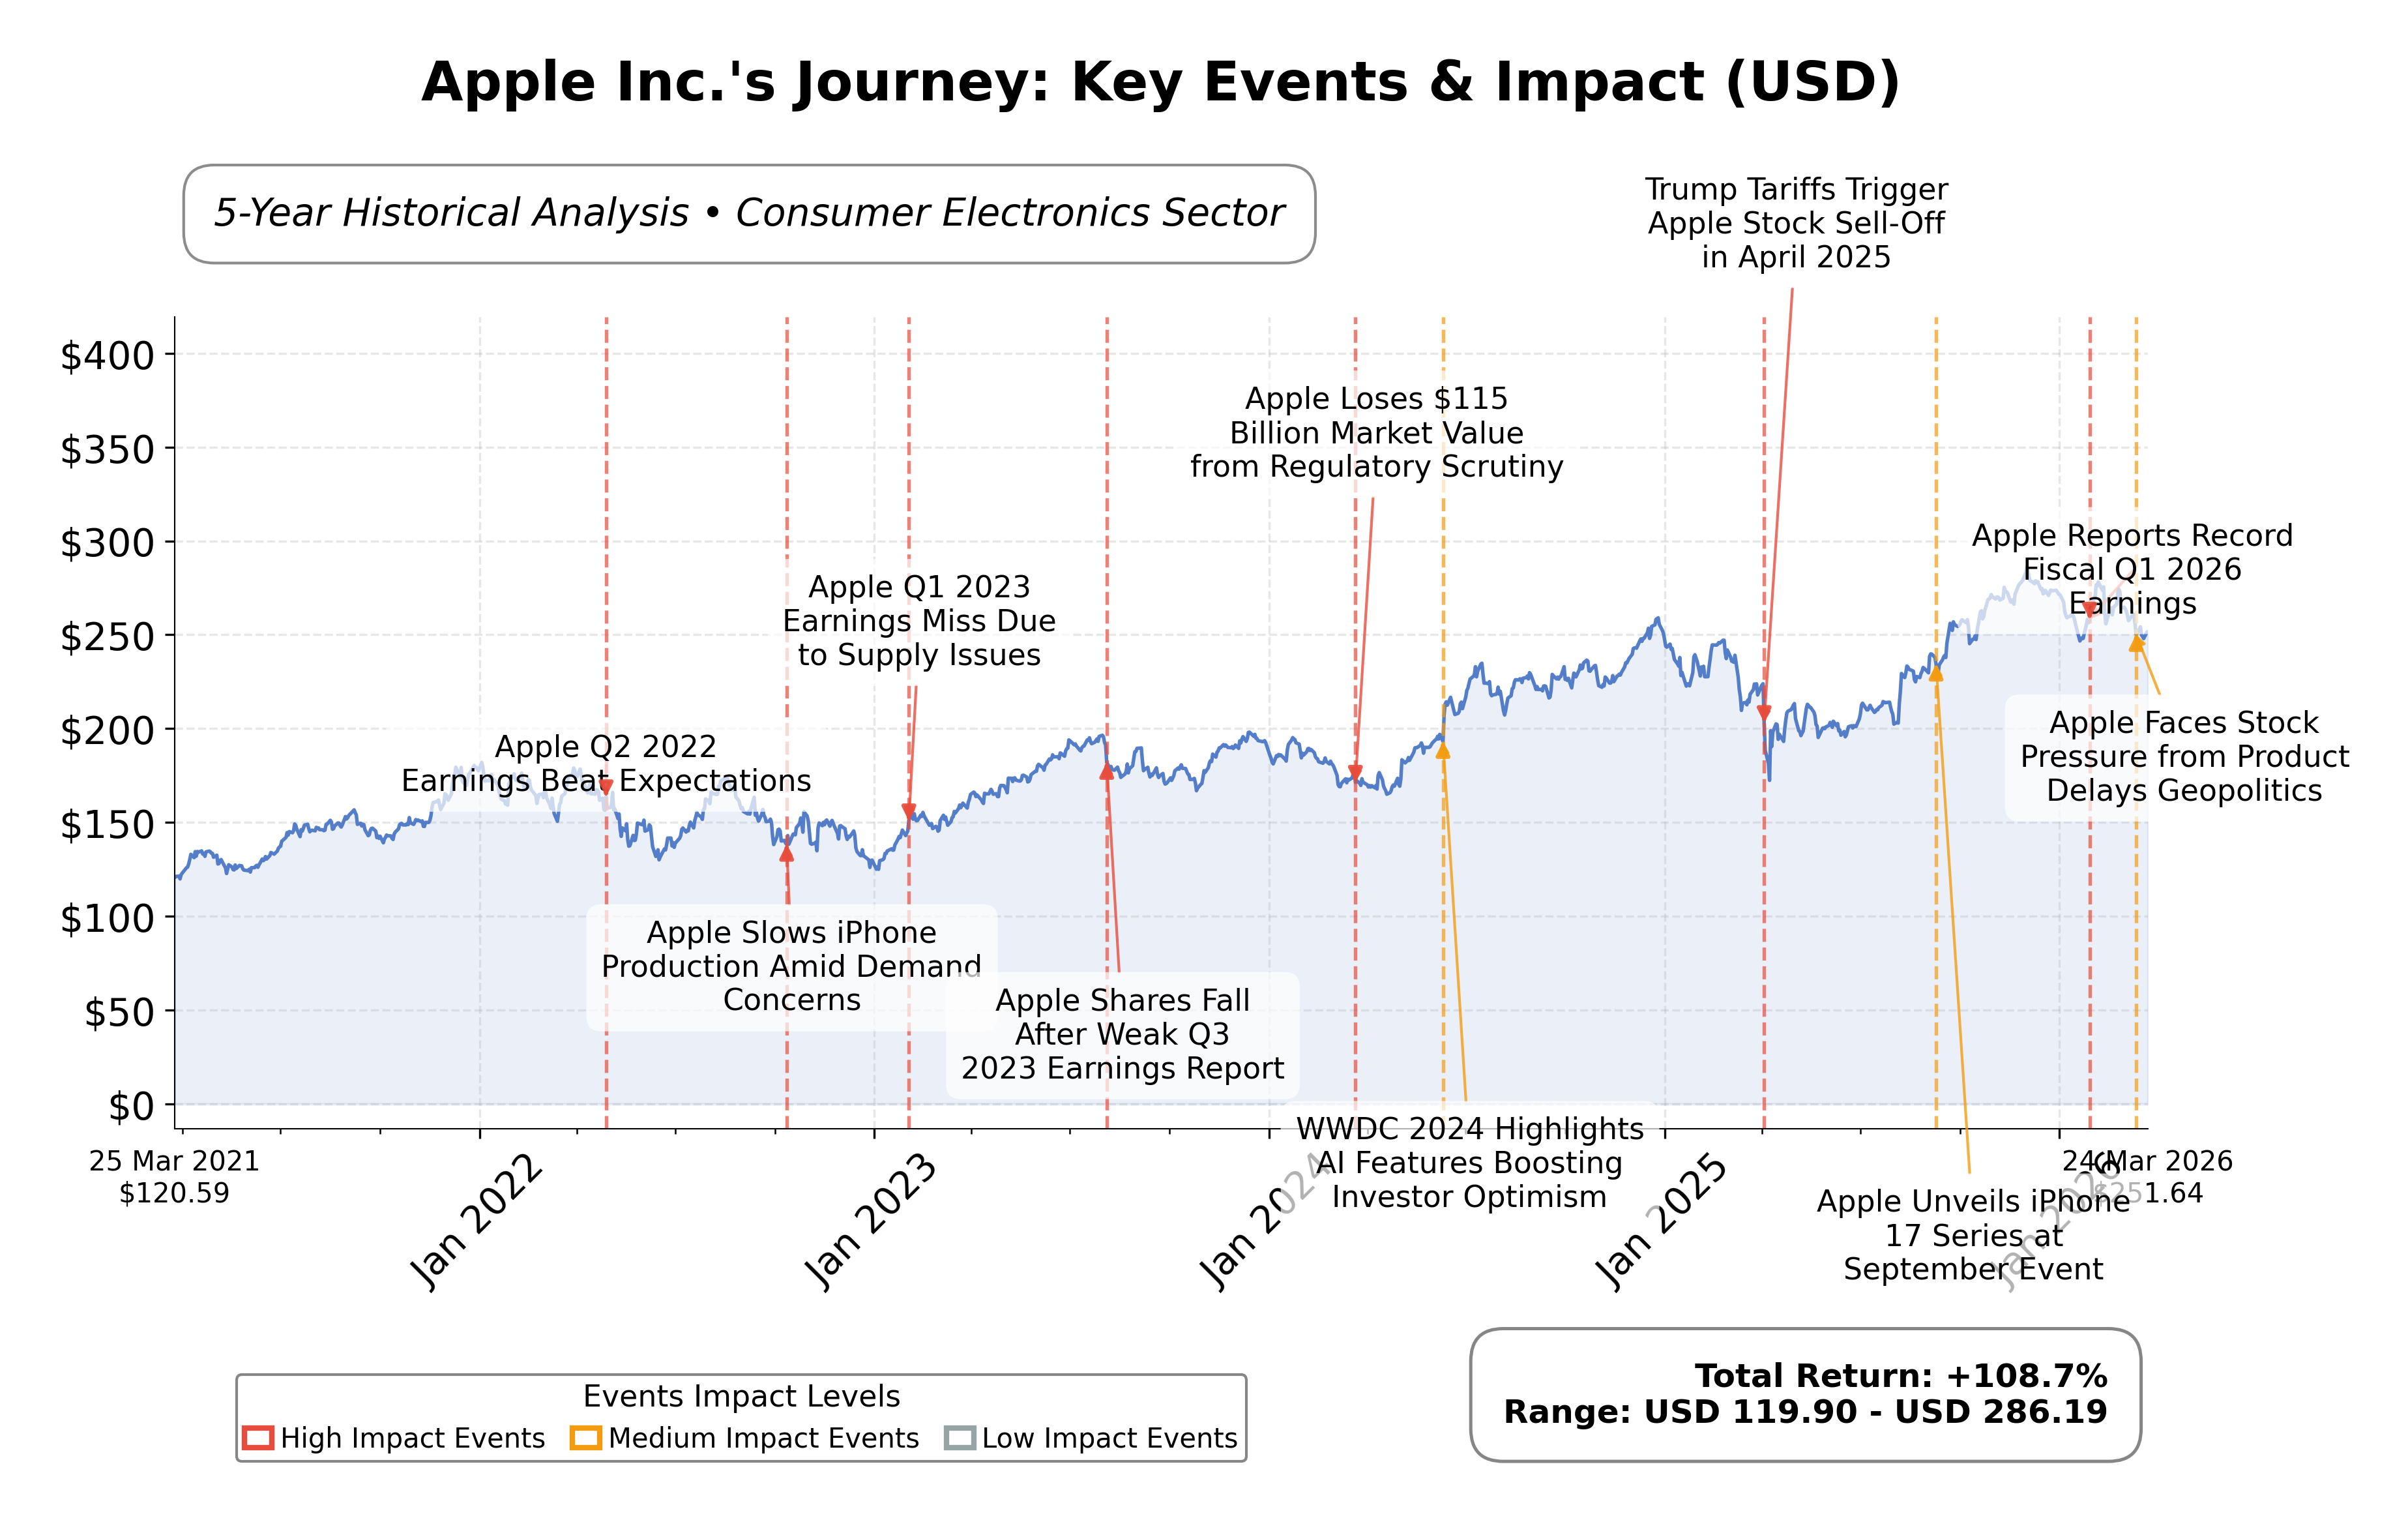
Stock Journey
Key Positives and Key Risks
Pros
- Market capitalization of $3.64 trillion underscores Apple’s scale and market dominance.
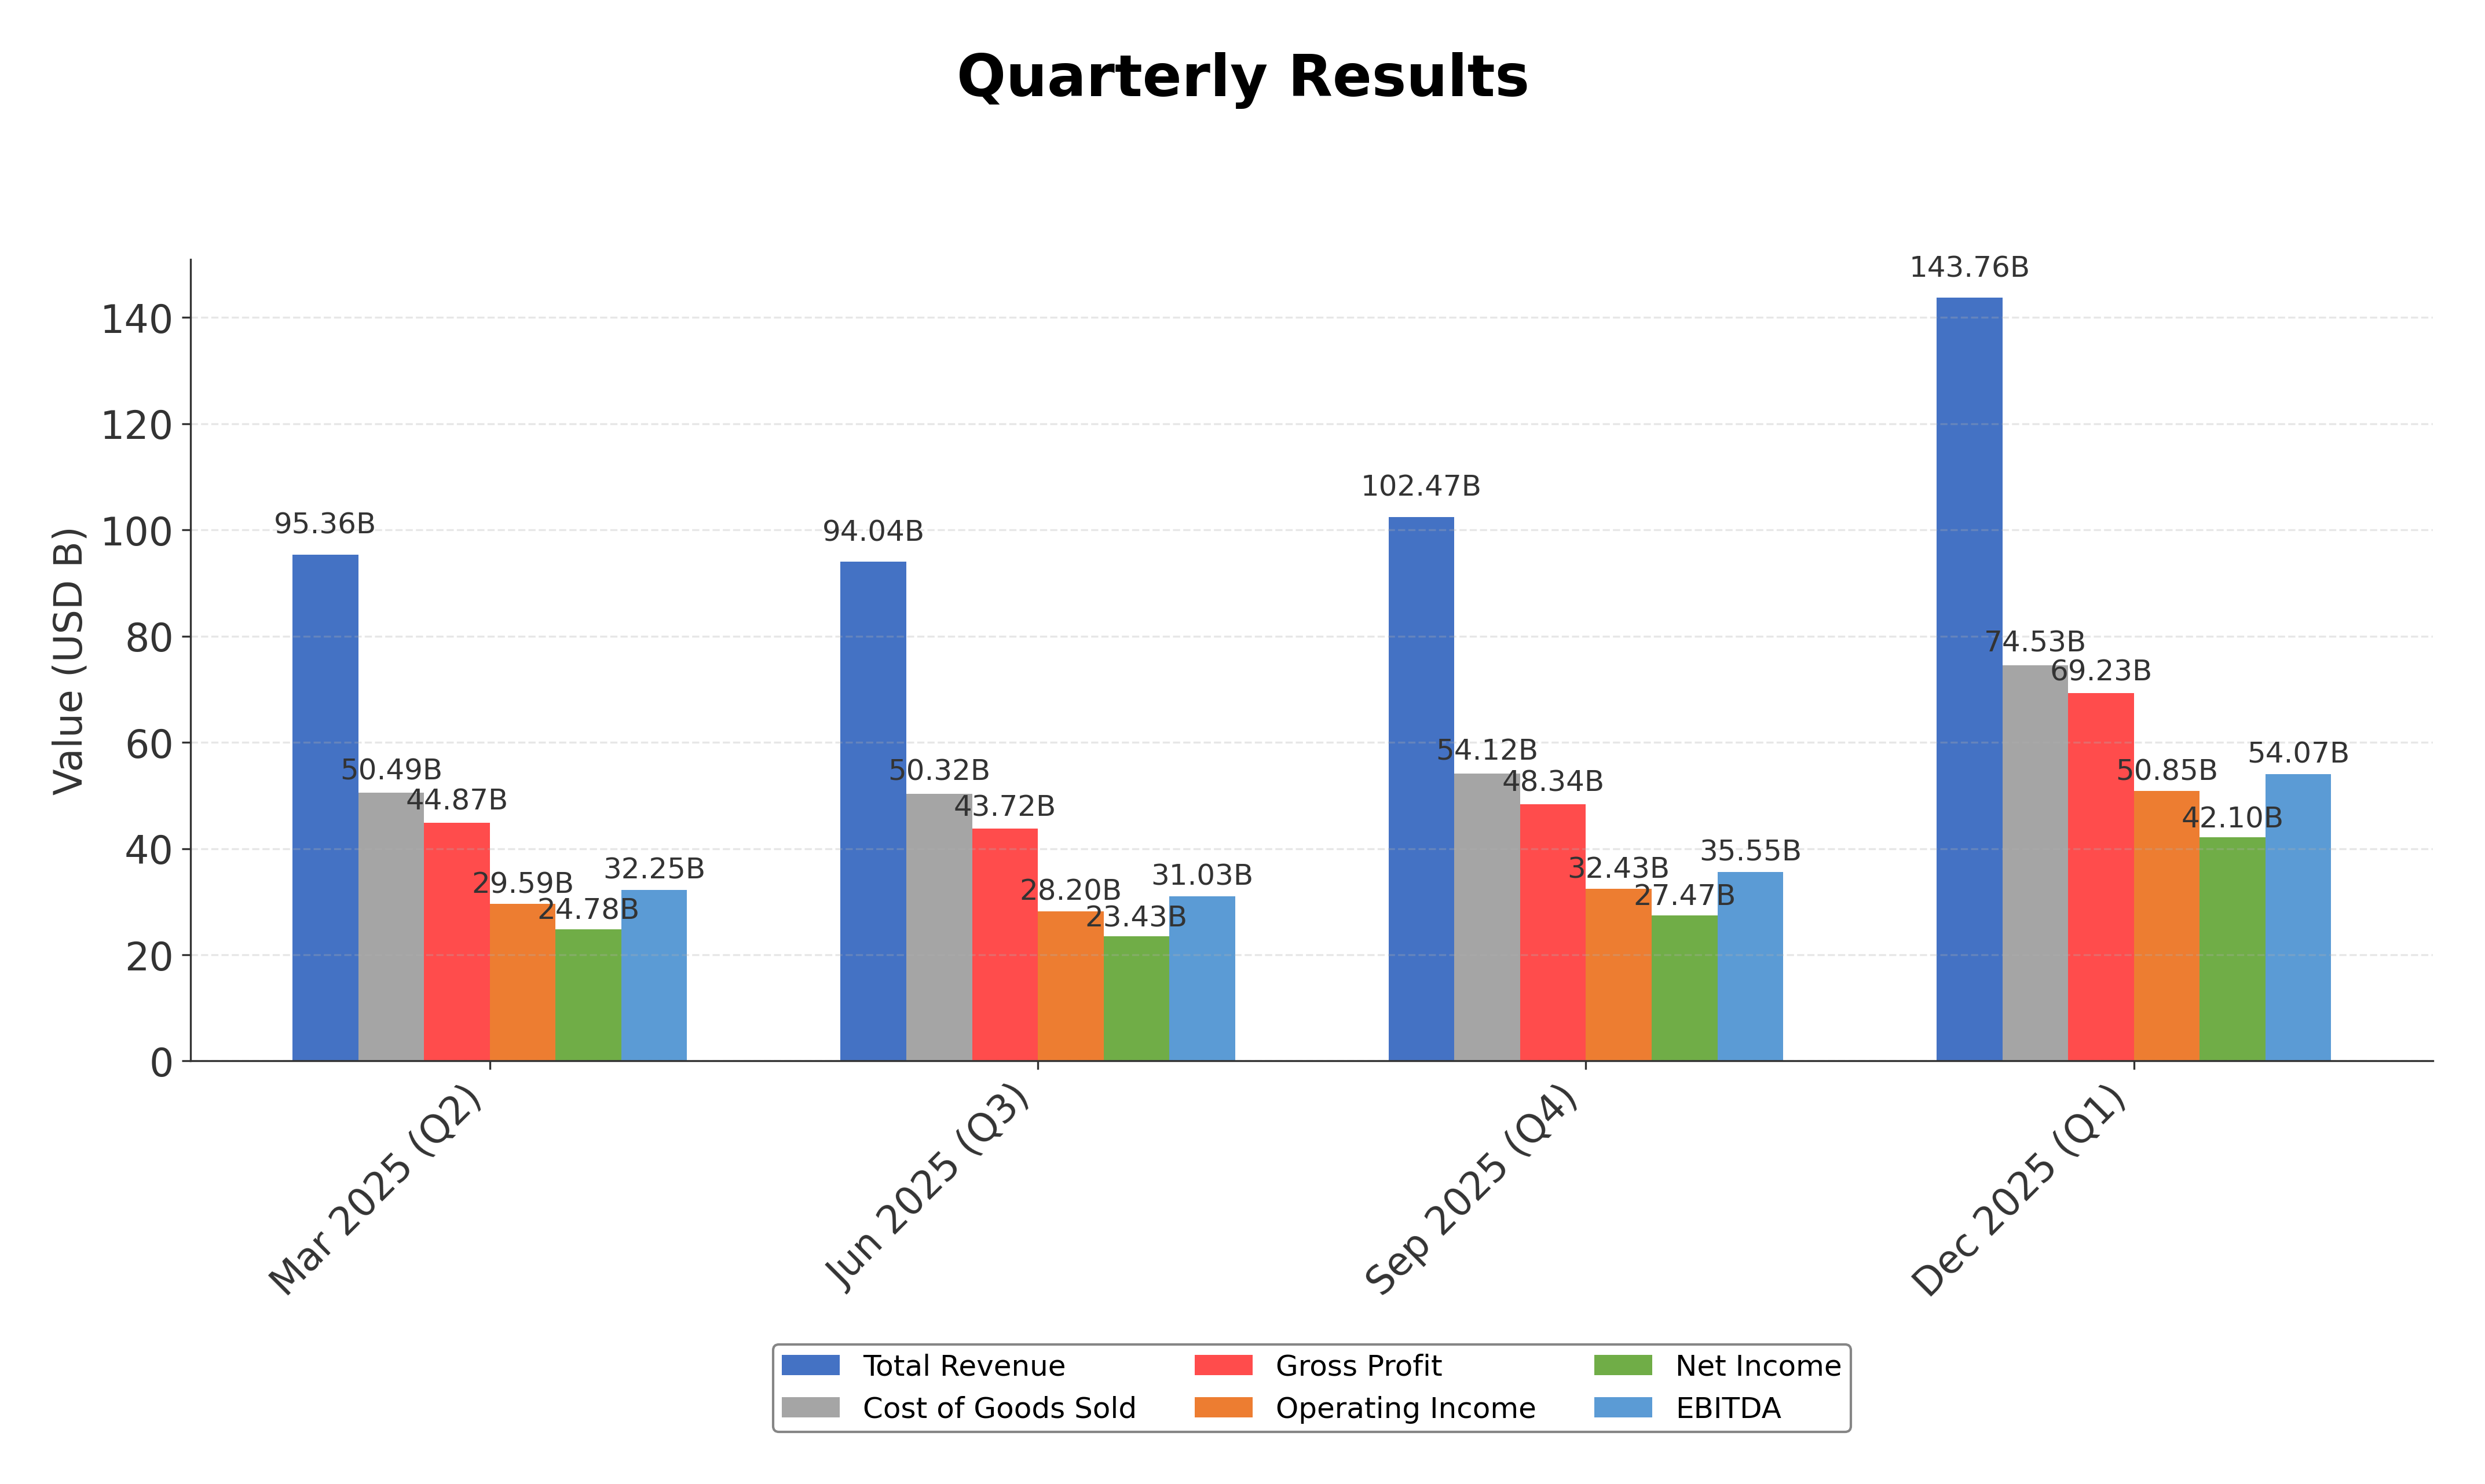
- Quarterly revenue growth of 15.7% and earnings growth of 15.9% indicate strong financial momentum.
- Free cash flow of approximately $106.3 billion supports operational flexibility and shareholder returns.
Cons
- Price-to-book ratio of 41.51 reflects a high valuation premium relative to book value.
- Debt-to-equity ratio of 102.63% suggests elevated leverage levels that may impact financial risk.
- Current ratio of 0.974 indicates tight liquidity, potentially limiting short-term financial flexibility.
Disclosure: This information is for general awareness and does not constitute investment advice
Report Summary
Apple Inc. operates as a leading technology company specializing in the design, manufacturing, and marketing of consumer electronics and software products globally. Its core offerings include the iPhone, Mac computers, iPad tablets, Apple Watch, and a broad range of services such as the App Store, Apple Music, and iCloud. Positioned prominently in the consumer electronics industry within the technology sector, Apple maintains a significant market presence supported by a vast ecosystem that integrates hardware and services.
Financially, Apple demonstrates robust performance with a trailing twelve-month revenue of approximately $435.6 billion and a net income of about $117.8 billion. The companyâs valuation metrics include a trailing P/E ratio of 31.51 and a forward P/E of 26.71, reflecting market expectations for continued earnings growth. Appleâs market capitalization stands at $3.64 trillion, supported by strong profitability margins including a gross margin of 48.16% and an operating margin of 35.37%. The company also maintains substantial cash reserves of $66.9 billion against total debt of $90.5 billion.
Key technical indicators reveal Appleâs stock trading above its 200-day moving average at $246.36 and 50-day moving average at $261.64, suggesting a generally positive price trend. Recent strategic initiatives include the launch of Apple Business, a platform aimed at enterprise customers, and ongoing developments in AI and Siri functionalities. Institutional ownership remains significant at 65.27%, with insider holdings at 1.64%. Notable risks include regulatory pressures in key markets such as China and competitive dynamics in consumer technology. Strengths include a diversified product portfolio and strong free cash flow generation.
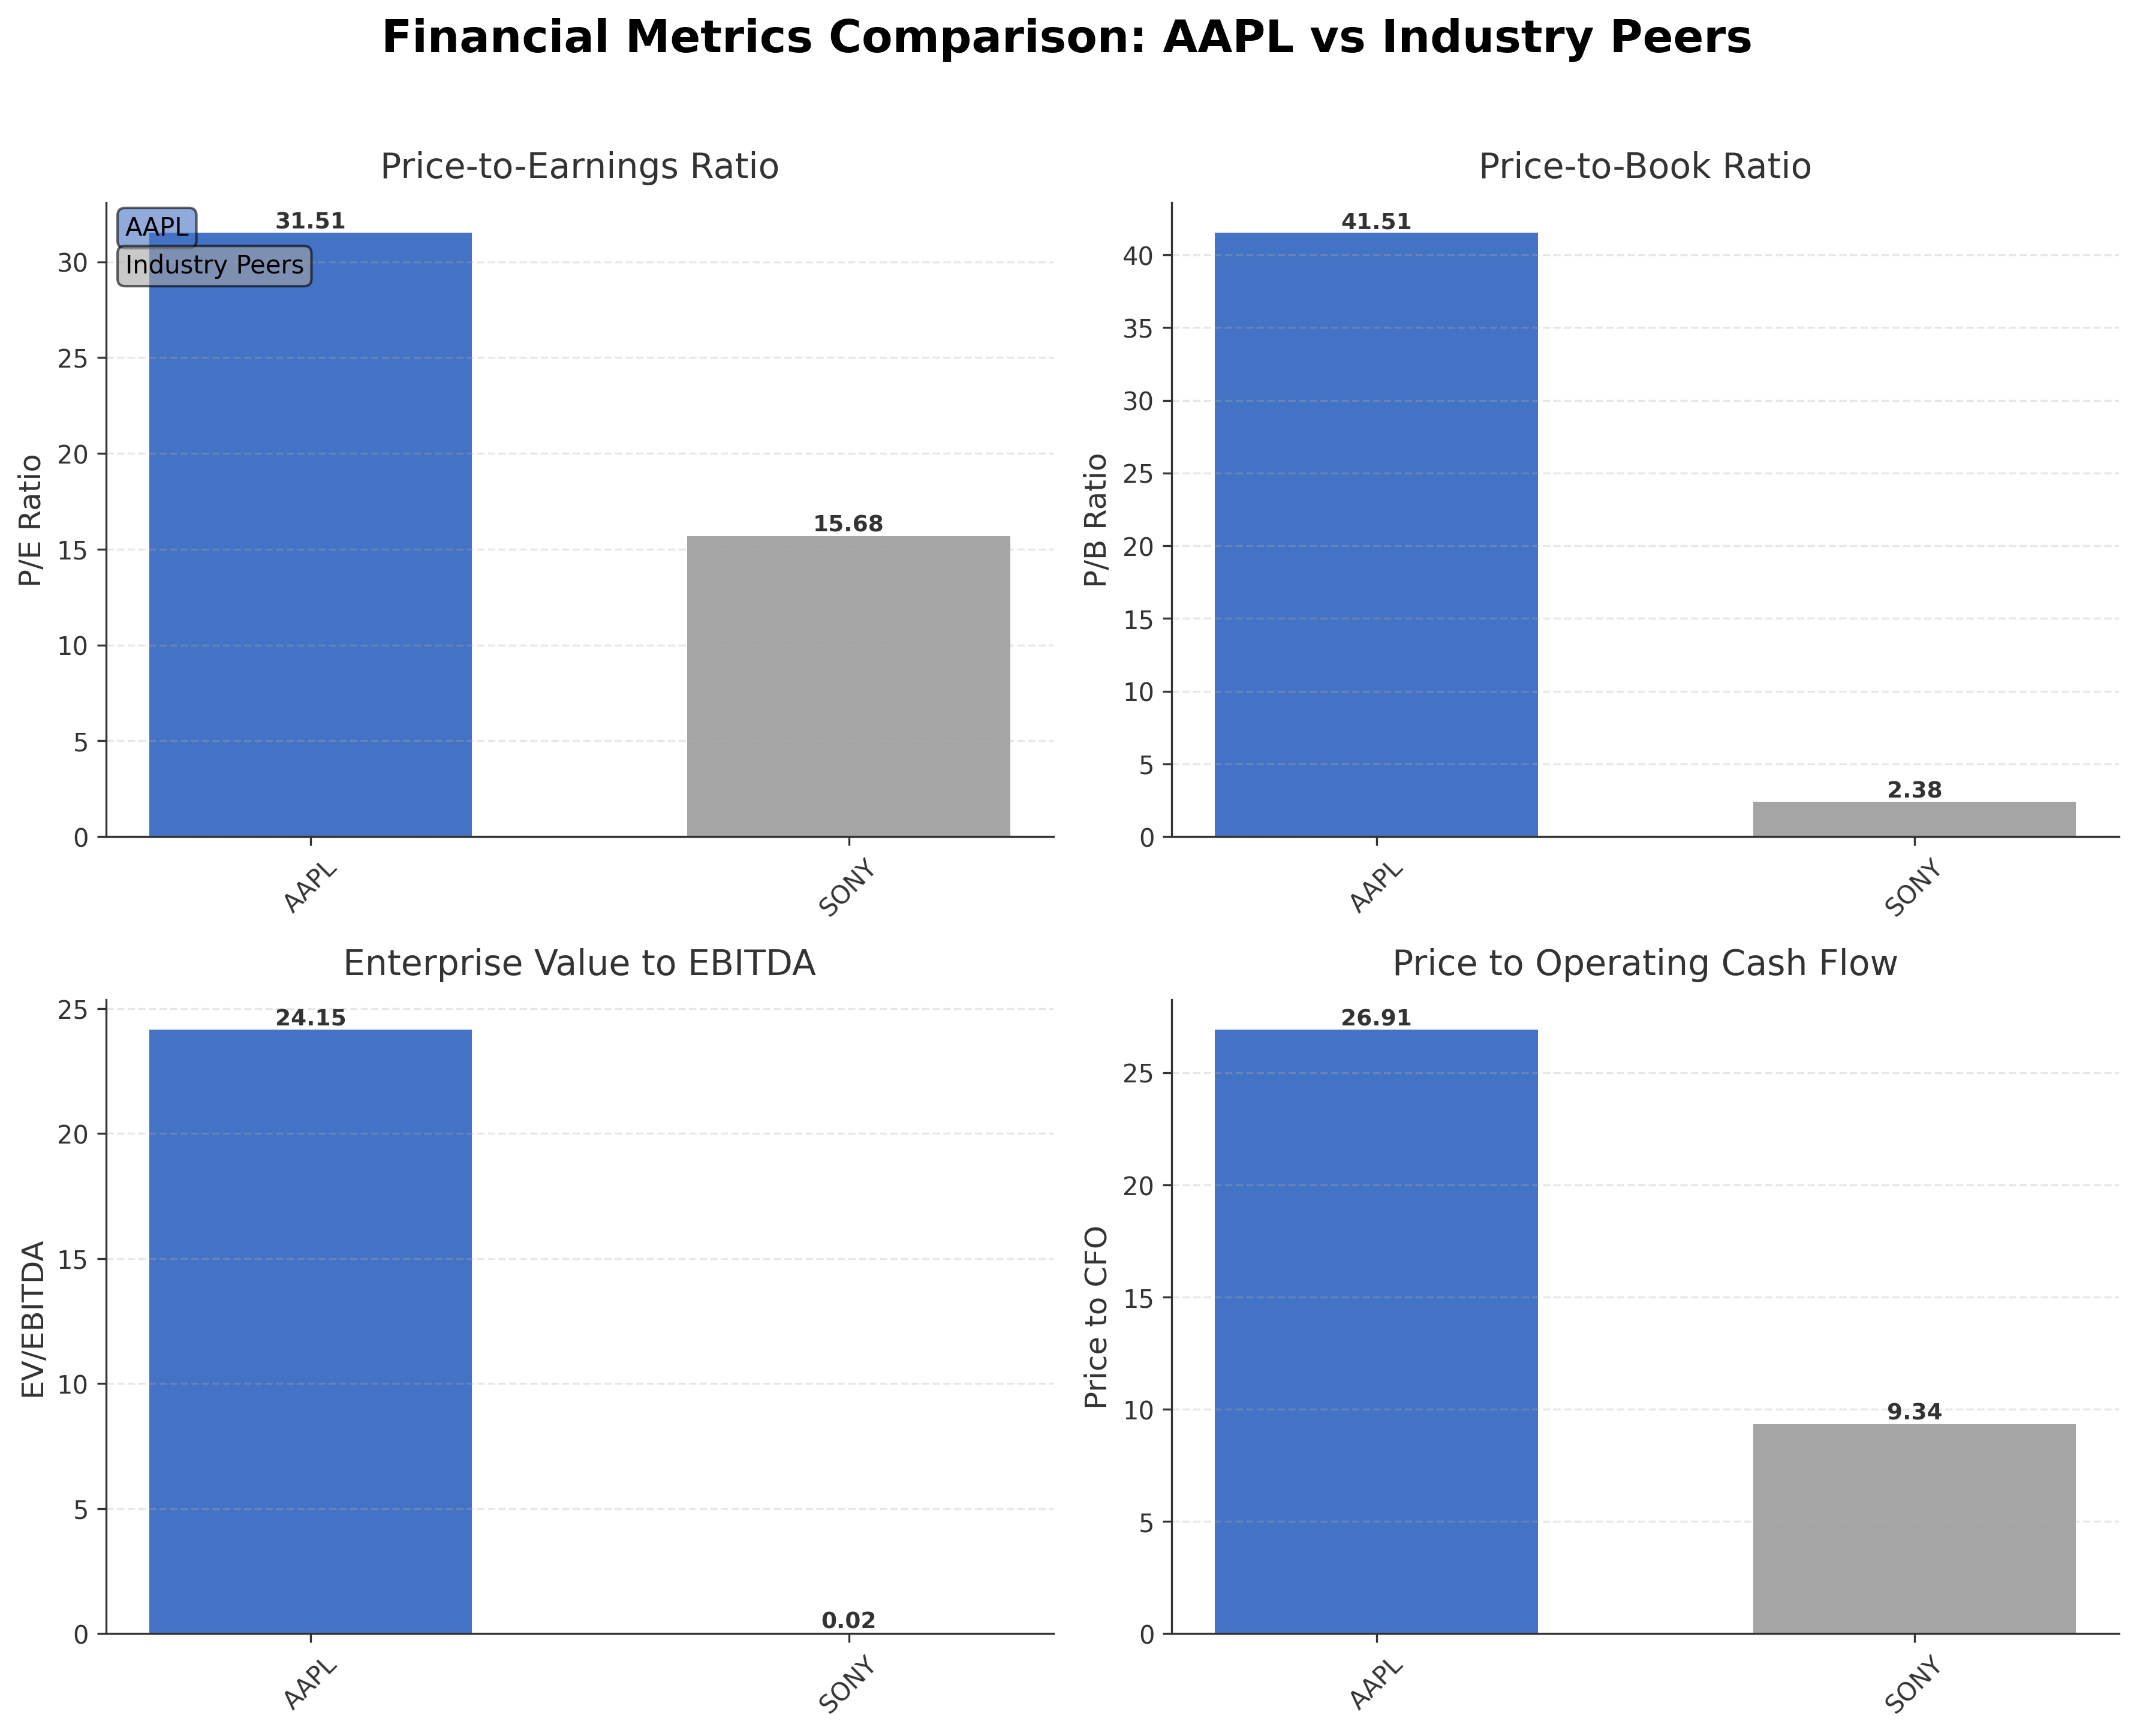
In peer comparison within the consumer electronics industry and U.S. market, Appleâs market capitalization and valuation multiples substantially exceed those of competitors such as Sony Group Corporation, which has a market cap of approximately $120.12 billion and a P/E ratio of 15.68. Appleâs return on equity (1.52%) also surpasses that of Sony (0.15%), highlighting its superior profitability. However, Appleâs price-to-book ratio of 41.51 is notably higher, reflecting premium market valuation relative to peers.
Apple navigates a complex industry landscape characterized by rapid technological innovation and evolving consumer preferences. Recent achievements include strong quarterly revenue growth and strategic platform expansions, while challenges persist in regulatory environments and market competition. The companyâs current strategies and market positioning present pivotal moments with significant implications for its future growth trajectory and valuation. Observers assessing the stock may find merit in monitoring ongoing developments and valuation metrics to determine appropriate engagement levels.
Company and Industry Overview
Company Basics
Price Performance
Company Size
Shareholding Pattern
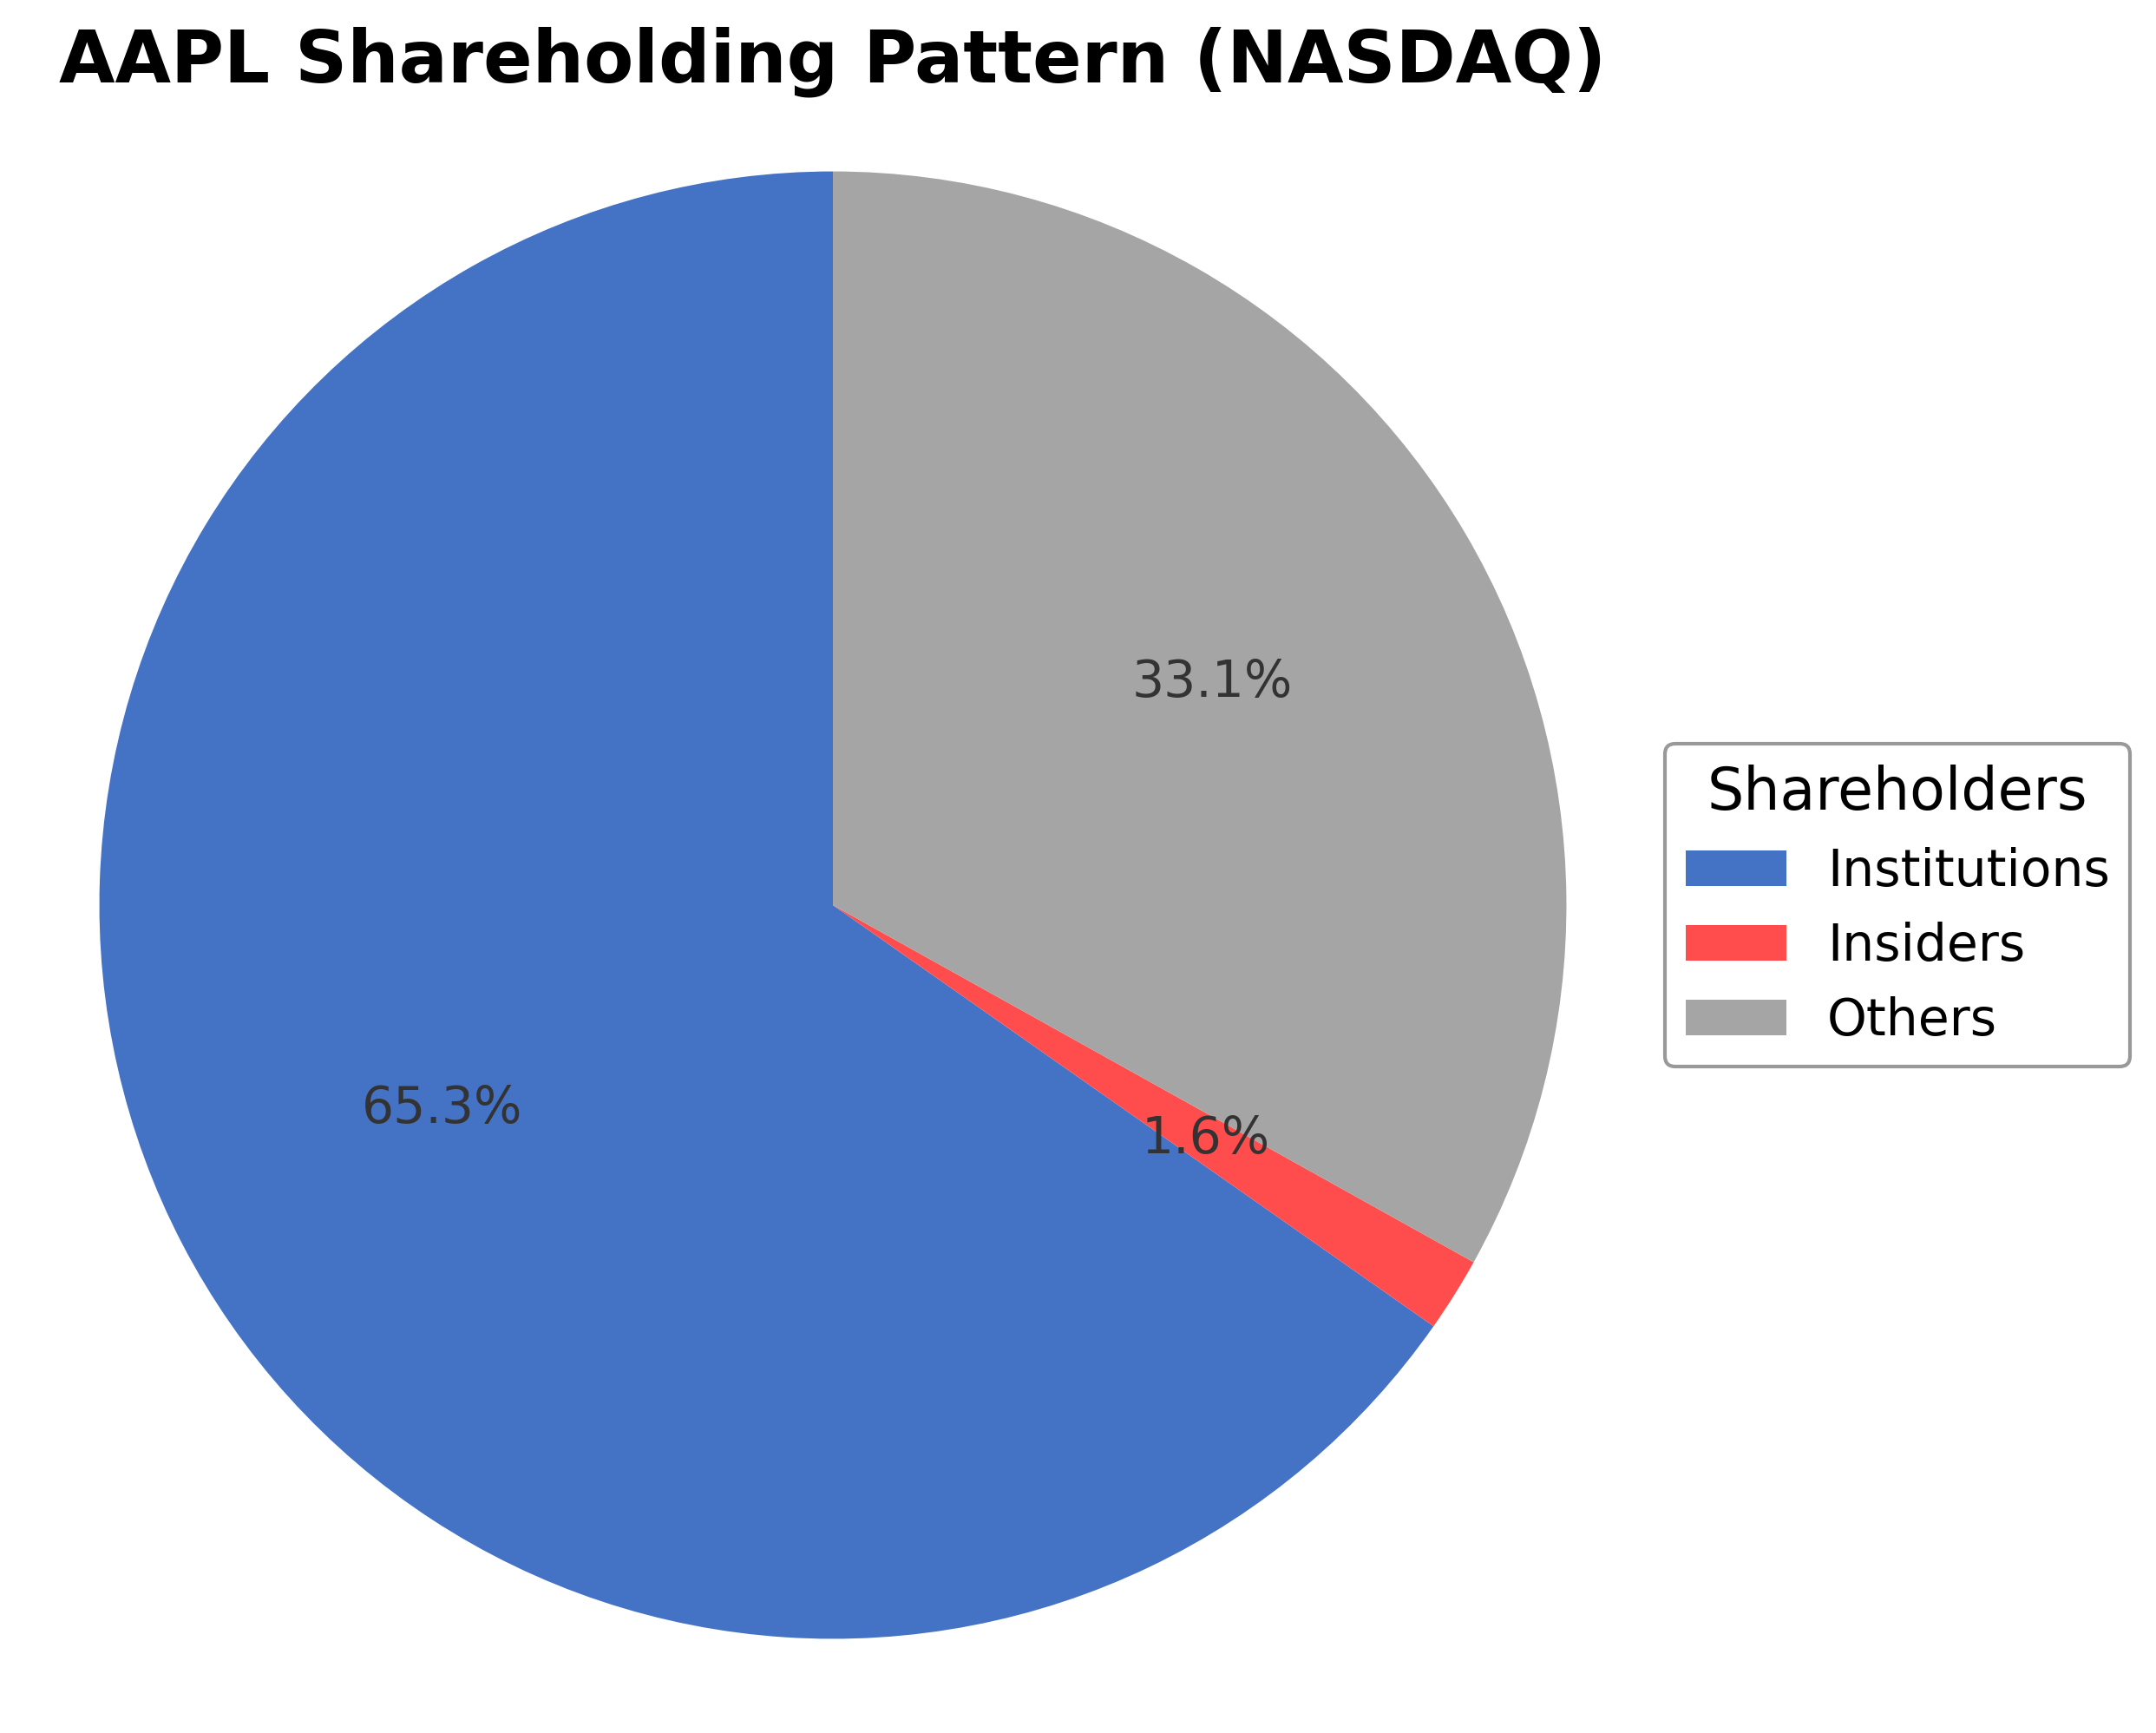
Apple Inc.'s ownership structure features approximately 1.64% held by insiders including executives and board members, 65.27% by institutional investors such as mutual funds and asset managers, and 33.09% by other shareholders including retail investors. Over the past 12-24 months, institutional holdings have shown modest accumulation, with notable increases by firms like Riversedge Advisors LLC and Everhart Financial Group Inc. These patterns suggest sustained institutional confidence and active portfolio management. The ownership distribution supports robust governance frameworks and strategic continuity, with institutional investors playing a significant role in oversight and capital allocation decisions.
Sector and Industry Analysis
Apple Inc. (AAPL) operates primarily within the Technology sector, specifically in the Hardware industry, which encompasses consumer electronics, computing devices, and related software ecosystems. The sector is characterized by a large and rapidly evolving market, with global hardware sales reaching trillions of dollars annually. Growth is driven by continuous innovation in devices such as smartphones, tablets, personal computers, and wearables, alongside expanding software and services ecosystems. Key players include Apple, Samsung, Microsoft, and Google, each leveraging integrated hardware-software models to capture consumer and enterprise demand. Apple's dominant position is underscored by its extensive product portfolio centered on the iPhone, complemented by Mac, iPad, Apple Watch, and services like streaming and subscription bundles, contributing to a diversified revenue base.
Industry trends are shaped by rapid technological advancements and shifting consumer preferences. The proliferation of 5G connectivity, augmented reality (AR), and artificial intelligence (AI) integration are significant drivers reshaping product capabilities and user experiences. Consumers increasingly demand seamless interoperability across devices and personalized digital ecosystems, which benefits companies like Apple that control both hardware and software layers. Additionally, subscription-based services and digital content delivery are emerging growth avenues, enhancing recurring revenue streams beyond traditional hardware sales. Sustainability and supply chain transparency are gaining prominence, influencing product design and corporate responsibility initiatives.
The regulatory environment in the technology hardware industry is complex and multifaceted, encompassing data privacy laws, intellectual property protections, trade policies, and environmental regulations. Compliance with global standards such as the EU’s GDPR, U.S. export controls, and evolving antitrust scrutiny affects operational strategies and market access. For Apple and peers, regulatory challenges include navigating cross-border supply chains, ensuring user data security, and responding to governmental inquiries on competitive practices. Environmental regulations also compel manufacturers to adopt sustainable sourcing and recycling programs, impacting cost structures and innovation priorities.
Competitive dynamics in the hardware industry are intense, with high barriers to entry due to significant capital requirements, advanced technological expertise, and established brand loyalty. Market structure is oligopolistic, dominated by a few multinational corporations with integrated supply chains and proprietary technologies. Apple’s competitive positioning benefits from its ecosystem lock-in, premium brand perception, and vertical integration, including in-house chip design and strategic partnerships with manufacturers like Foxconn and TSMC. However, the industry faces constant pressure from rapid innovation cycles, price competition in emerging markets, and the need to anticipate disruptive technologies. Maintaining differentiation through design, user experience, and service integration remains critical for sustaining market leadership.
Note: Analysis synthesized from industry research, market reports, and regulatory filings. Information is subject to change based on market conditions.
Illustrative Scenario Analysis
DCF Assumptions:
Method: Two-Stage EPS-Priority Model
Financials
Peer Analysis
| Company Name | Market Cap | P/E Ratio | P/B Ratio | EV/EBITDA | Price to CFO |
|---|---|---|---|---|---|
| Apple Inc. | $3.64T | 31.51 | 41.51 | 24.15 | 26.91 |
| Sony Group Corporation - Sponsored American Depositary Receipt | $120.12B | 15.68 | 2.38 | 0.02 | 9.34 |
Comparison Analysis: Apple Inc. significantly outpaces its regional peer Sony Group Corporation in market capitalization, with a valuation exceeding $3.6 trillion compared to Sony's $120 billion. Apple's P/E ratio of 31.51 is more than double Sony's 15.68, reflecting higher market expectations for earnings growth. The price-to-book ratio for Apple at 41.51 contrasts sharply with Sony's 2.38, indicating a premium valuation. Return on equity also favors Apple at 1.52%, compared to Sony's 0.15%, underscoring stronger profitability. These metrics collectively highlight Apple's dominant market position and premium valuation within the consumer electronics sector.
Financial Metrics Comparison with Peers
Financial Statements
Comprehensive financial data including income, balance sheet, and cash flow metrics
Income Statement
| fiscal_date | 2025-09-30 | 2024-09-30 | 2023-09-30 | 2022-09-30 | 2021-09-30 |
|---|---|---|---|---|---|
| Sales | 416.16B | 391.04B | 383.29B | 394.33B | 365.82B |
| Cost Of Goods | 220.96B | 210.35B | 214.14B | 223.55B | 212.98B |
| Gross Profit | 195.20B | 180.68B | 169.15B | 170.78B | 152.84B |
| Operating Expense Research And Development | 34.55B | 31.37B | 29.91B | 26.25B | 21.91B |
| Operating Expense Selling General And Administrative | 27.60B | 26.10B | 24.93B | 25.09B | 21.97B |
| Operating Income | 133.05B | 123.22B | 114.30B | 119.44B | 108.95B |
| Other Income Expense | -321.00M | 269.00M | -565.00M | -334.00M | 60.00M |
| Pretax Income | 132.73B | 123.48B | 113.74B | 119.10B | 109.21B |
| Income Tax | 20.72B | 29.75B | 16.74B | 19.30B | 14.53B |
| Net Income | 112.01B | 93.74B | 97.00B | 99.80B | 94.68B |
| Eps Basic | 7.49 | 6.11 | 6.16 | 6.15 | 5.67 |
| Eps Diluted | 7.46 | 6.08 | 6.13 | 6.11 | 5.61 |
| Basic Shares Outstanding | 14.95B | 15.34B | 15.74B | 16.22B | 16.70B |
| Diluted Shares Outstanding | 14.95B | 15.34B | 15.74B | 16.22B | 16.70B |
| Ebit | 133.05B | 123.22B | 114.30B | 119.44B | 111.85B |
| Ebitda | 144.75B | 134.66B | 125.82B | 130.54B | 123.14B |
| Net Income Continuous Operations | 112.01B | 93.74B | 97.00B | 99.80B | 94.68B |
| Non Operating Interest Income | N/A | N/A | 3.75B | 2.83B | 2.84B |
| Non Operating Interest Expense | N/A | N/A | 3.93B | 2.93B | 2.65B |
Source: Financial statements and regulatory filings
Balance Sheet
| fiscal_date | 2025-09-30 | 2024-09-30 | 2023-09-30 | 2022-09-30 | 2021-09-30 |
|---|---|---|---|---|---|
| Cash And Cash Equivalents | 35.93B | 29.94B | 29.96B | 23.65B | 34.94B |
| Accounts Receivable | 39.78B | 33.41B | 29.51B | 28.18B | 26.28B |
| Total Assets | 359.24B | 364.98B | 352.58B | 352.75B | 351.00B |
| Total Liabilities | 285.51B | 308.03B | 290.44B | 302.08B | 287.91B |
| Long Term Debt | 78.33B | 85.75B | 95.28B | 109.71B | 119.38B |
| Shareholders Equity | 73.73B | 56.95B | 62.15B | 50.67B | 63.09B |
Source: Financial statements and regulatory filings
Cash Flow Statement
| fiscal_date | 2025-09-30 | 2024-09-30 | 2023-09-30 | 2022-09-30 | 2021-09-30 |
|---|---|---|---|---|---|
| Operating Activities Net Income | 112.01B | 93.74B | 97.00B | 99.80B | 94.68B |
| Operating Activities Depreciation | 11.70B | 11.45B | 11.52B | 11.10B | 11.28B |
| Operating Activities Stock Based Compensation | 12.86B | 11.69B | 10.83B | 9.04B | 7.91B |
| Operating Activities Other Non Cash Items | -89.00M | -2.27B | -2.23B | 1.01B | -4.92B |
| Operating Activities Accounts Receivable | -7.03B | -5.14B | -417.00M | -9.34B | -14.03B |
| Operating Activities Accounts Payable | 902.00M | 6.02B | -1.89B | 9.45B | 12.33B |
| Operating Activities Other Assets Liabilities | -18.87B | 2.77B | -4.27B | 1.57B | -1.53B |
| Operating Activities Operating Cash Flow | 111.48B | 118.25B | 110.54B | 123.52B | 100.94B |
| Investing Activities Capital Expenditures | -12.71B | -9.45B | -10.96B | -10.71B | -11.09B |
| Investing Activities Purchase Of Investments | -24.41B | -48.66B | -29.51B | -76.92B | -109.56B |
| Investing Activities Sale Of Investments | 53.80B | 62.35B | 45.51B | 67.36B | 106.48B |
| Investing Activities Other Investing Activity | -1.48B | -1.31B | -1.34B | -2.09B | -385.00M |
| Investing Activities Investing Cash Flow | 15.20B | 2.94B | 3.71B | -22.66B | -14.58B |
| Financing Activities Long Term Debt Issuance | 4.48B | 0.00 | 5.23B | 5.46B | 20.39B |
| Financing Activities Long Term Debt Payments | -10.93B | -9.96B | -11.15B | -9.54B | -8.75B |
| Financing Activities Short Term Debt Issuance | -2.03B | 3.96B | -3.98B | 3.96B | 1.02B |
| Financing Activities Common Stock Repurchase | -90.71B | -94.95B | -77.55B | -89.40B | -85.97B |
| Financing Activities Common Dividends | -15.42B | -15.23B | -15.03B | -14.84B | -14.47B |
| Financing Activities Other Financing Charges | -6.07B | -5.80B | -6.01B | -6.38B | -5.58B |
| Financing Activities Financing Cash Flow | -120.69B | -121.98B | -108.49B | -110.75B | -92.25B |
| End Cash Position | 35.93B | 29.94B | 30.74B | 24.98B | 35.93B |
| Income Tax Paid | 43.37B | 26.10B | 18.68B | 19.57B | 25.39B |
| Free Cash Flow | 98.77B | 108.81B | 99.58B | 111.44B | 92.95B |
| Interest Paid | N/A | N/A | 3.80B | 2.87B | 2.69B |
| Operating Activities Deferred Taxes | N/A | N/A | N/A | 895.00M | -4.77B |
| Investing Activities Net Acquisitions | N/A | N/A | N/A | -306.00M | -33.00M |
| Financing Activities Common Stock Issuance | N/A | N/A | N/A | N/A | 1.10B |
Source: Financial statements and regulatory filings
Technical Analysis
Key Insights
- The current trend for Apple Inc. shows a generally upward price movement, with the stock trading above its 200-day moving average at $246.36 and near the 50-day moving average at $261.64, indicating sustained bullish momentum.
- Key support levels are identified near $246.36 (200-day moving average) and $169.21 (52-week low), while resistance is observed around $288.62 (52-week high).
- The stock price is positioned above the 10-day, 50-day, and 200-day moving averages, suggesting positive medium- to long-term trend strength.
- Momentum indicators such as RSI and MACD currently reflect moderate strength without overbought conditions, supporting the continuation of the current trend.
- Multi-timeframe analysis across daily, weekly, and monthly charts confirms consistent upward momentum with occasional consolidation phases.
- Potential market scenarios include continuation of the upward trend if support levels hold, or a corrective pullback if resistance near the 52-week high proves strong.
Trending News
1. Headline: Riversedge Advisors LLC Has $25.63 Million Stock Holdings in Apple Inc. $AAPL
Summary: Riversedge Advisors LLC grew its position in shares of Apple Inc. (NASDAQ:AAPL - Free Report) by 2.2% during the 4th quarter, according to its most recent 13F filing with the Securities and Exchange Commission (SEC). The firm owned 94,290 shares of the iPhone maker's stock after buying an additiona
Sentiment: positive
2. Headline: Everhart Financial Group Inc. Acquires 9,038 Shares of Apple Inc. $AAPL
Summary: Everhart Financial Group Inc. grew its holdings in shares of Apple Inc. (NASDAQ:AAPL - Free Report) by 7.9% during the 4th quarter, according to its most recent 13F filing with the Securities and Exchange Commission (SEC). The institutional investor owned 124,008 shares of the iPhone maker's stock
Sentiment: positive
3. Headline: AAFMAA Wealth Management & Trust LLC Acquires 2,398 Shares of Apple Inc. $AAPL
Summary: AAFMAA Wealth Management & Trust LLC lifted its holdings in shares of Apple Inc. (NASDAQ:AAPL - Free Report) by 14.1% during the fourth quarter, according to the company in its most recent Form 13F filing with the SEC. The firm owned 19,438 shares of the iPhone maker's stock after purchasing an add
Sentiment: positive
4. Headline: Apple Maps Is Getting Ads. It's Apple's Riskiest Bet Yet
Summary: Inc. PremiumMoneyCoterie Turned a Dirty Product Into a Premium Brand, Then Scored a Major Sale · LeadMove Over, Unlimited PTO: The New Must-Have AI Perk Taking Over Silicon Valley · GrowShe Lost $75,000 on a Startup—Then Built Mrs. Meyer’s Into a Category-Defining Brand · MoneyIf These 3 Big IPOs Happen, No One Else May Have a Shot ... Apple...
Sentiment: neutral
5. Headline: You Should Download Apple’s Latest iOS Update Now: Fun New Emojis Are Just the Start
Summary: Inc. PremiumMoneyCoterie Turned a Dirty Product Into a Premium Brand, Then Scored a Major Sale · LeadMove Over, Unlimited PTO: The New Must-Have AI Perk Taking Over Silicon Valley · GrowShe Lost $75,000 on a Startup—Then Built Mrs. Meyer’s Into a Category-Defining Brand · MoneyIf These 3 Big IPOs Happen, No One Else May Have a Shot ... Apple...
Sentiment: neutral
6. Headline: Apple Stock Is Moving Higher: What's Happening? - Apple (NASDAQ:AAPL)
Summary: Apple Inc. shares are trading higher Tuesday. The company unveiled Apple Business, a platform for managing devices, customers and operations.
Sentiment: positive
7. Headline: Apple Inc. $AAPL Shares Sold by Chemistry Wealth Management LLC
Summary: Chemistry Wealth Management LLC trimmed its stake in shares of Apple Inc. (NASDAQ:AAPL - Free Report) by 5.7% during the 4th quarter, according to the company in its most recent Form 13F filing with the Securities & Exchange Commission. The institutional investor owned 92,146 shares of the iPh
Sentiment: negative
8. Headline: AFG Fiduciary Services Limited Partnership Acquires 4,636,438 Shares of Apple Inc. $AAPL
Summary: AFG Fiduciary Services Limited Partnership boosted its holdings in Apple Inc. (NASDAQ:AAPL - Free Report) by 79,636.5% in the fourth quarter, according to its most recent Form 13F filing with the SEC. The fund owned 4,642,260 shares of the iPhone maker's stock after purchasing an additional 4,636,4
Sentiment: positive
9. Headline: Rep. Thomas R. Suozzi Sells Apple Inc. (NASDAQ:AAPL) Stock
Summary: Representative Thomas R. Suozzi (Democratic-New York) recently sold shares of Apple Inc. (NASDAQ:AAPL). In a filing disclosed on March 17th, the Representative disclosed that they had sold between $15,001 and $50,000 in Apple stock on February 18th. The trade occurred in the Representative's "THOMAS
Sentiment: neutral
10. Headline: Introducing Apple Business — a new all-in-one platform for businesses of all sizes - Apple
Summary: Apple today announced Apple Business, a new all-in-one platform that includes key services companies need to effortlessly manage devices, reach more customers, equip team members with essential apps and tools, and get support from experts to run and grow efficiently and securely.
Sentiment: neutral
Recent Updates
News Summary
Recent news highlights include reflections on Apple's 50th anniversary and cautious perspectives on AI from co-founder Steve Wozniak, signaling ongoing discourse on technological evolution. The introduction of advertisements in Apple Maps marks a strategic pivot with potential revenue implications. Upcoming events such as the Worldwide Developers Conference (WWDC) scheduled for June 8-12 are anticipated to showcase new AI features and a standalone Siri app, indicating a focus on artificial intelligence integration. Additionally, Apple CEO Tim Cook has publicly acknowledged Chinese partners amidst regulatory pressures, underscoring geopolitical considerations in the company's operational landscape.
News Sentiment
Sentiment across recent updates is predominantly neutral, reflecting measured market and public responses to product innovations, strategic developments, and regulatory environments. Positive institutional buying activity contrasts with cautious commentary on AI and regulatory challenges, suggesting a balanced outlook with attention to both opportunities and risks.
Analytical Overview
Analysis Summary
Valuation Metrics: Apple's trailing P/E ratio of 31.51 is aligned with the industry average of 31.51, while its forward P/E of 26.71 suggests moderate earnings growth expectations relative to peers.
Growth Trajectory: The company exhibits a strong growth trajectory with quarterly revenue growth of 15.7% and quarterly earnings growth year-over-year of 15.9%, supported by substantial operating and free cash flows.
Financial Health: Apple maintains a solid financial position with total cash of $66.9 billion and total debt of $90.5 billion, resulting in a debt-to-equity ratio of approximately 102.63%, alongside a current ratio near 0.974, indicating balanced liquidity.
Sector Specific Factors: The consumer electronics sector faces challenges including regulatory scrutiny and competitive innovation pressures, while opportunities arise from expanding service platforms and AI integration.
Market Positioning: Apple's dominant market position, extensive ecosystem, and strong brand recognition provide competitive advantages in the global technology landscape.
Investment Conclusion
Supporting Factors: No data
Risk Factors: No data
SWOT Analysis
Strengths
- Market leadership with a diversified product and services ecosystem.
- Strong profitability margins and robust free cash flow generation.
- Significant institutional ownership supporting governance and strategy.
- Global brand recognition and customer loyalty.
Weaknesses
- High price-to-book ratio indicating premium valuation.
- Debt-to-equity ratio above 100%, reflecting leverage considerations.
- Current ratio below 1, suggesting tight short-term liquidity.
- Dependence on flagship products like the iPhone for majority of revenue.
Opportunities
- Expansion of service platforms including Apple Business and AI integrations.
- Growth potential in emerging markets and enterprise segments.
- Development of new product categories and software innovations.
- Increasing adoption of subscription-based digital services.
Threats
- Regulatory pressures and geopolitical tensions in key markets.
- Intense competition in consumer electronics and technology sectors.
- Potential user resistance to advertising within core applications.
- Rapid technological changes requiring continuous innovation.
Company Description
Apple Inc. is a leading technology company renowned for designing, manufacturing, and marketing innovative hardware and software products for consumers and businesses worldwide. Its flagship product, the iPhone, accounts for the majority of sales, serving as the central hub of an expansive ecosystem that includes Mac computers, iPad tablets, Apple Watch wearables, and accessories like AirPods. Apple Inc. also offers a suite of services such as the App Store, Apple Music, iCloud, Apple TV+, and Apple Fitness+, providing digital content, cloud storage, and subscription-based platforms. Operating in the consumer electronics industry within the technology sector, the company employs approximately 166,000 people and maintains a broad global presence through online stores, retail outlets, and partnerships with carriers and resellers. With a substantial market capitalization reflecting its scale, Apple Inc. plays a pivotal role in shaping consumer technology trends, emphasizing seamless integration across devices and services to enhance user experience and productivity.