
Apple Inc (AAPL)
Stock Analysis Report
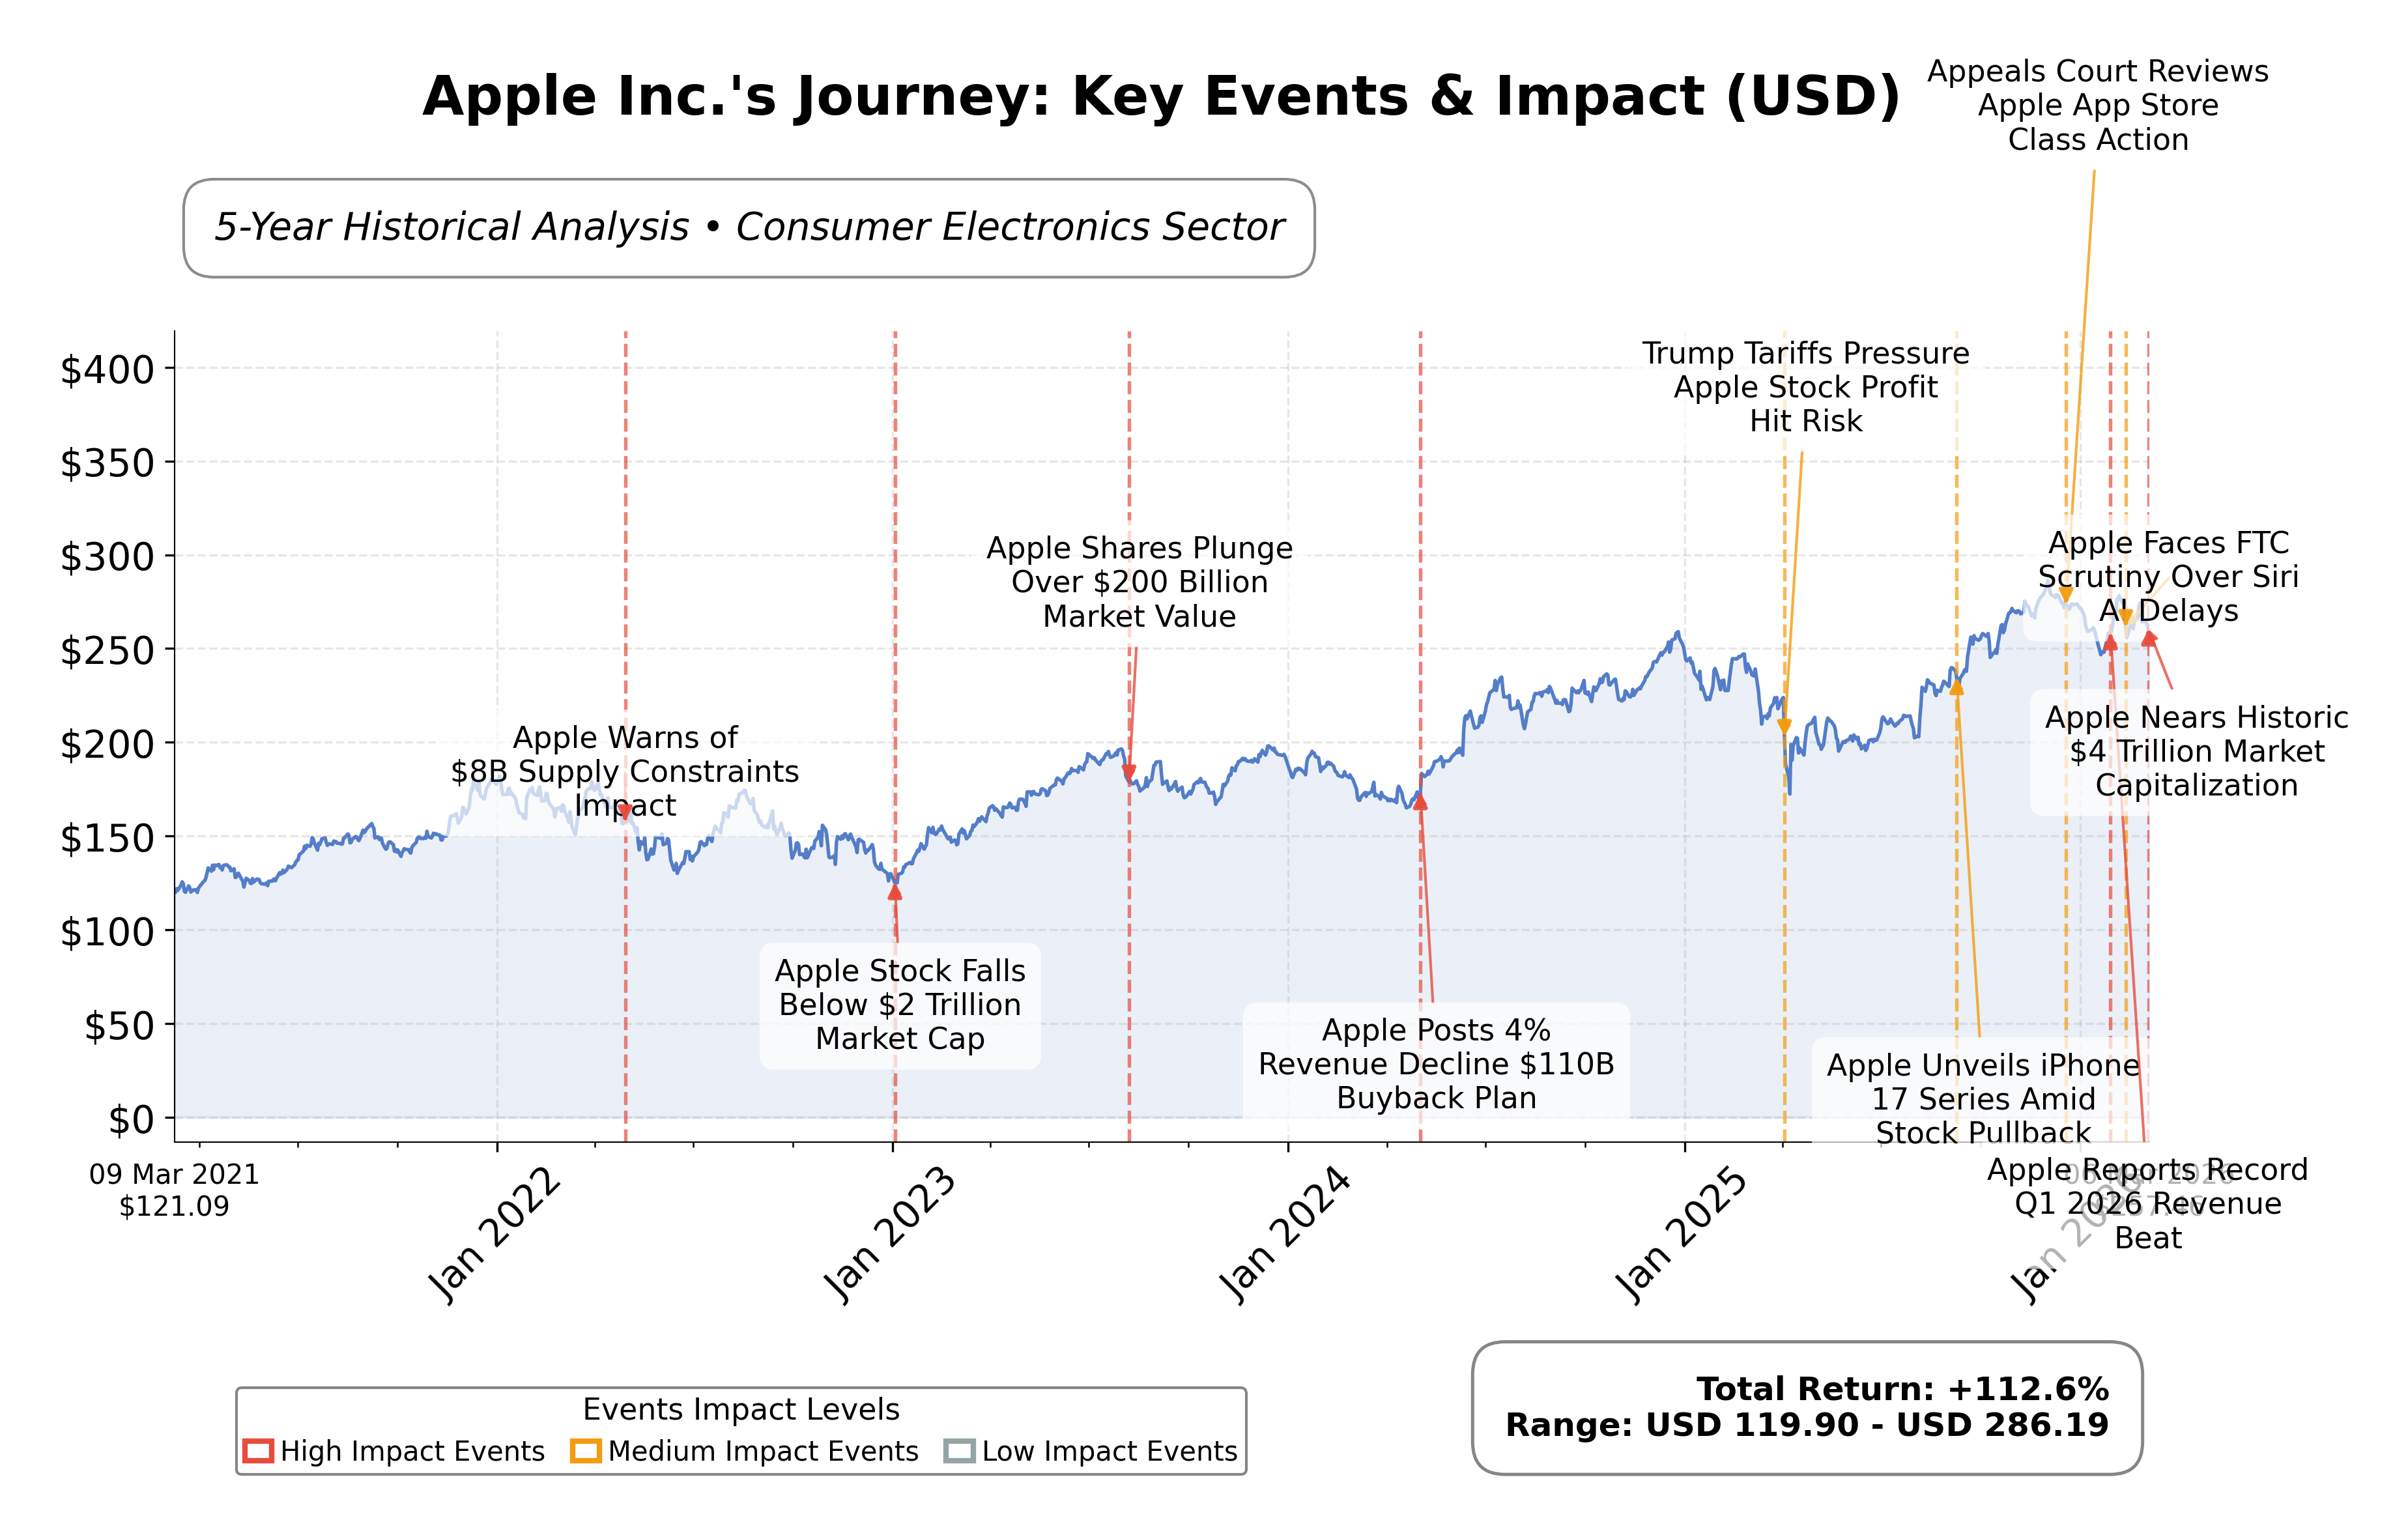
Stock Journey
Key Positives and Key Risks
Pros
- Market capitalization of $3.78 trillion reflects dominant industry position and scale.
- Quarterly revenue growth of 15.7% and earnings growth of 15.9% indicate strong operational performance.
- Operating cash flow of $135.5 billion and free cash flow of $106.3 billion demonstrate robust cash generation supporting strategic initiatives.
Cons
- Trailing P/E ratio of 32.55 is above the industry average, suggesting a premium valuation.
- Debt-to-equity ratio of 102.63% indicates moderate leverage that may impact financial flexibility.
- Current ratio of 0.974 points to tight short-term liquidity conditions.
Disclosure: This information is for general awareness and does not constitute investment advice
Report Summary
Apple Inc. operates as a global leader in the technology sector, specializing in the design, manufacture, and marketing of consumer electronics, software, and digital services. Its core products include the iPhone, Mac computers, iPad tablets, Apple Watch, and various accessories, complemented by a growing services segment featuring the App Store, Apple Music, iCloud, and subscription platforms. Positioned as a premium brand, Apple maintains a broad global footprint through retail stores, online platforms, and partnerships, emphasizing seamless integration across its ecosystem.
Financially, Apple demonstrates robust performance with a market capitalization exceeding $3.78 trillion and trailing P/E ratio of approximately 32.55, slightly above the industry average. The company reported trailing twelve months (TTM) revenue of $435.6 billion and net income of $117.8 billion, reflecting strong profitability with a profit margin near 27%. Operating cash flow and free cash flow remain substantial at $135.5 billion and $106.3 billion respectively, supporting ongoing investments and shareholder returns. The balance sheet shows total assets of $359.2 billion and a debt-to-equity ratio of 102.63%, indicating moderate leverage.
From a technical perspective, Appleâs stock trades above its 50-day and 200-day moving averages, suggesting an upward trend. Recent strategic initiatives include the launch of the MacBook Neo targeting the affordable laptop segment and leadership updates, signaling ongoing innovation and management evolution. Key strengths include a diversified product portfolio and strong cash generation, while risks encompass high valuation multiples and competitive pressures in consumer electronics. Institutional ownership remains significant at approximately 65%, reflecting broad market confidence.
In peer comparison within the consumer electronics industry in the United States, Appleâs market capitalization dwarfs competitors such as Sony Group Corporation, which has a market cap of approximately $128 billion. Appleâs valuation multiples, including P/E and EV/EBITDA, are higher than peers, reflecting its premium market positioning and growth expectations. Return on equity for Apple stands at 1.52%, notably higher than Sonyâs 0.15%, underscoring superior profitability metrics relative to regional industry counterparts.
Apple navigates a dynamic technology landscape marked by rapid innovation and evolving consumer preferences. Recent product launches like the MacBook Neo and expansion into services represent pivotal moments that could influence future growth trajectories. The company faces challenges related to maintaining its premium brand appeal while expanding into more price-sensitive segments. The stakes involve balancing innovation, market share expansion, and valuation sustainability. Given the comprehensive financial and operational profile, a measured stance that monitors ongoing developments and market conditions may align with the current environment.
Company and Industry Overview
Company Basics
Price Performance
Company Size
Shareholding Pattern
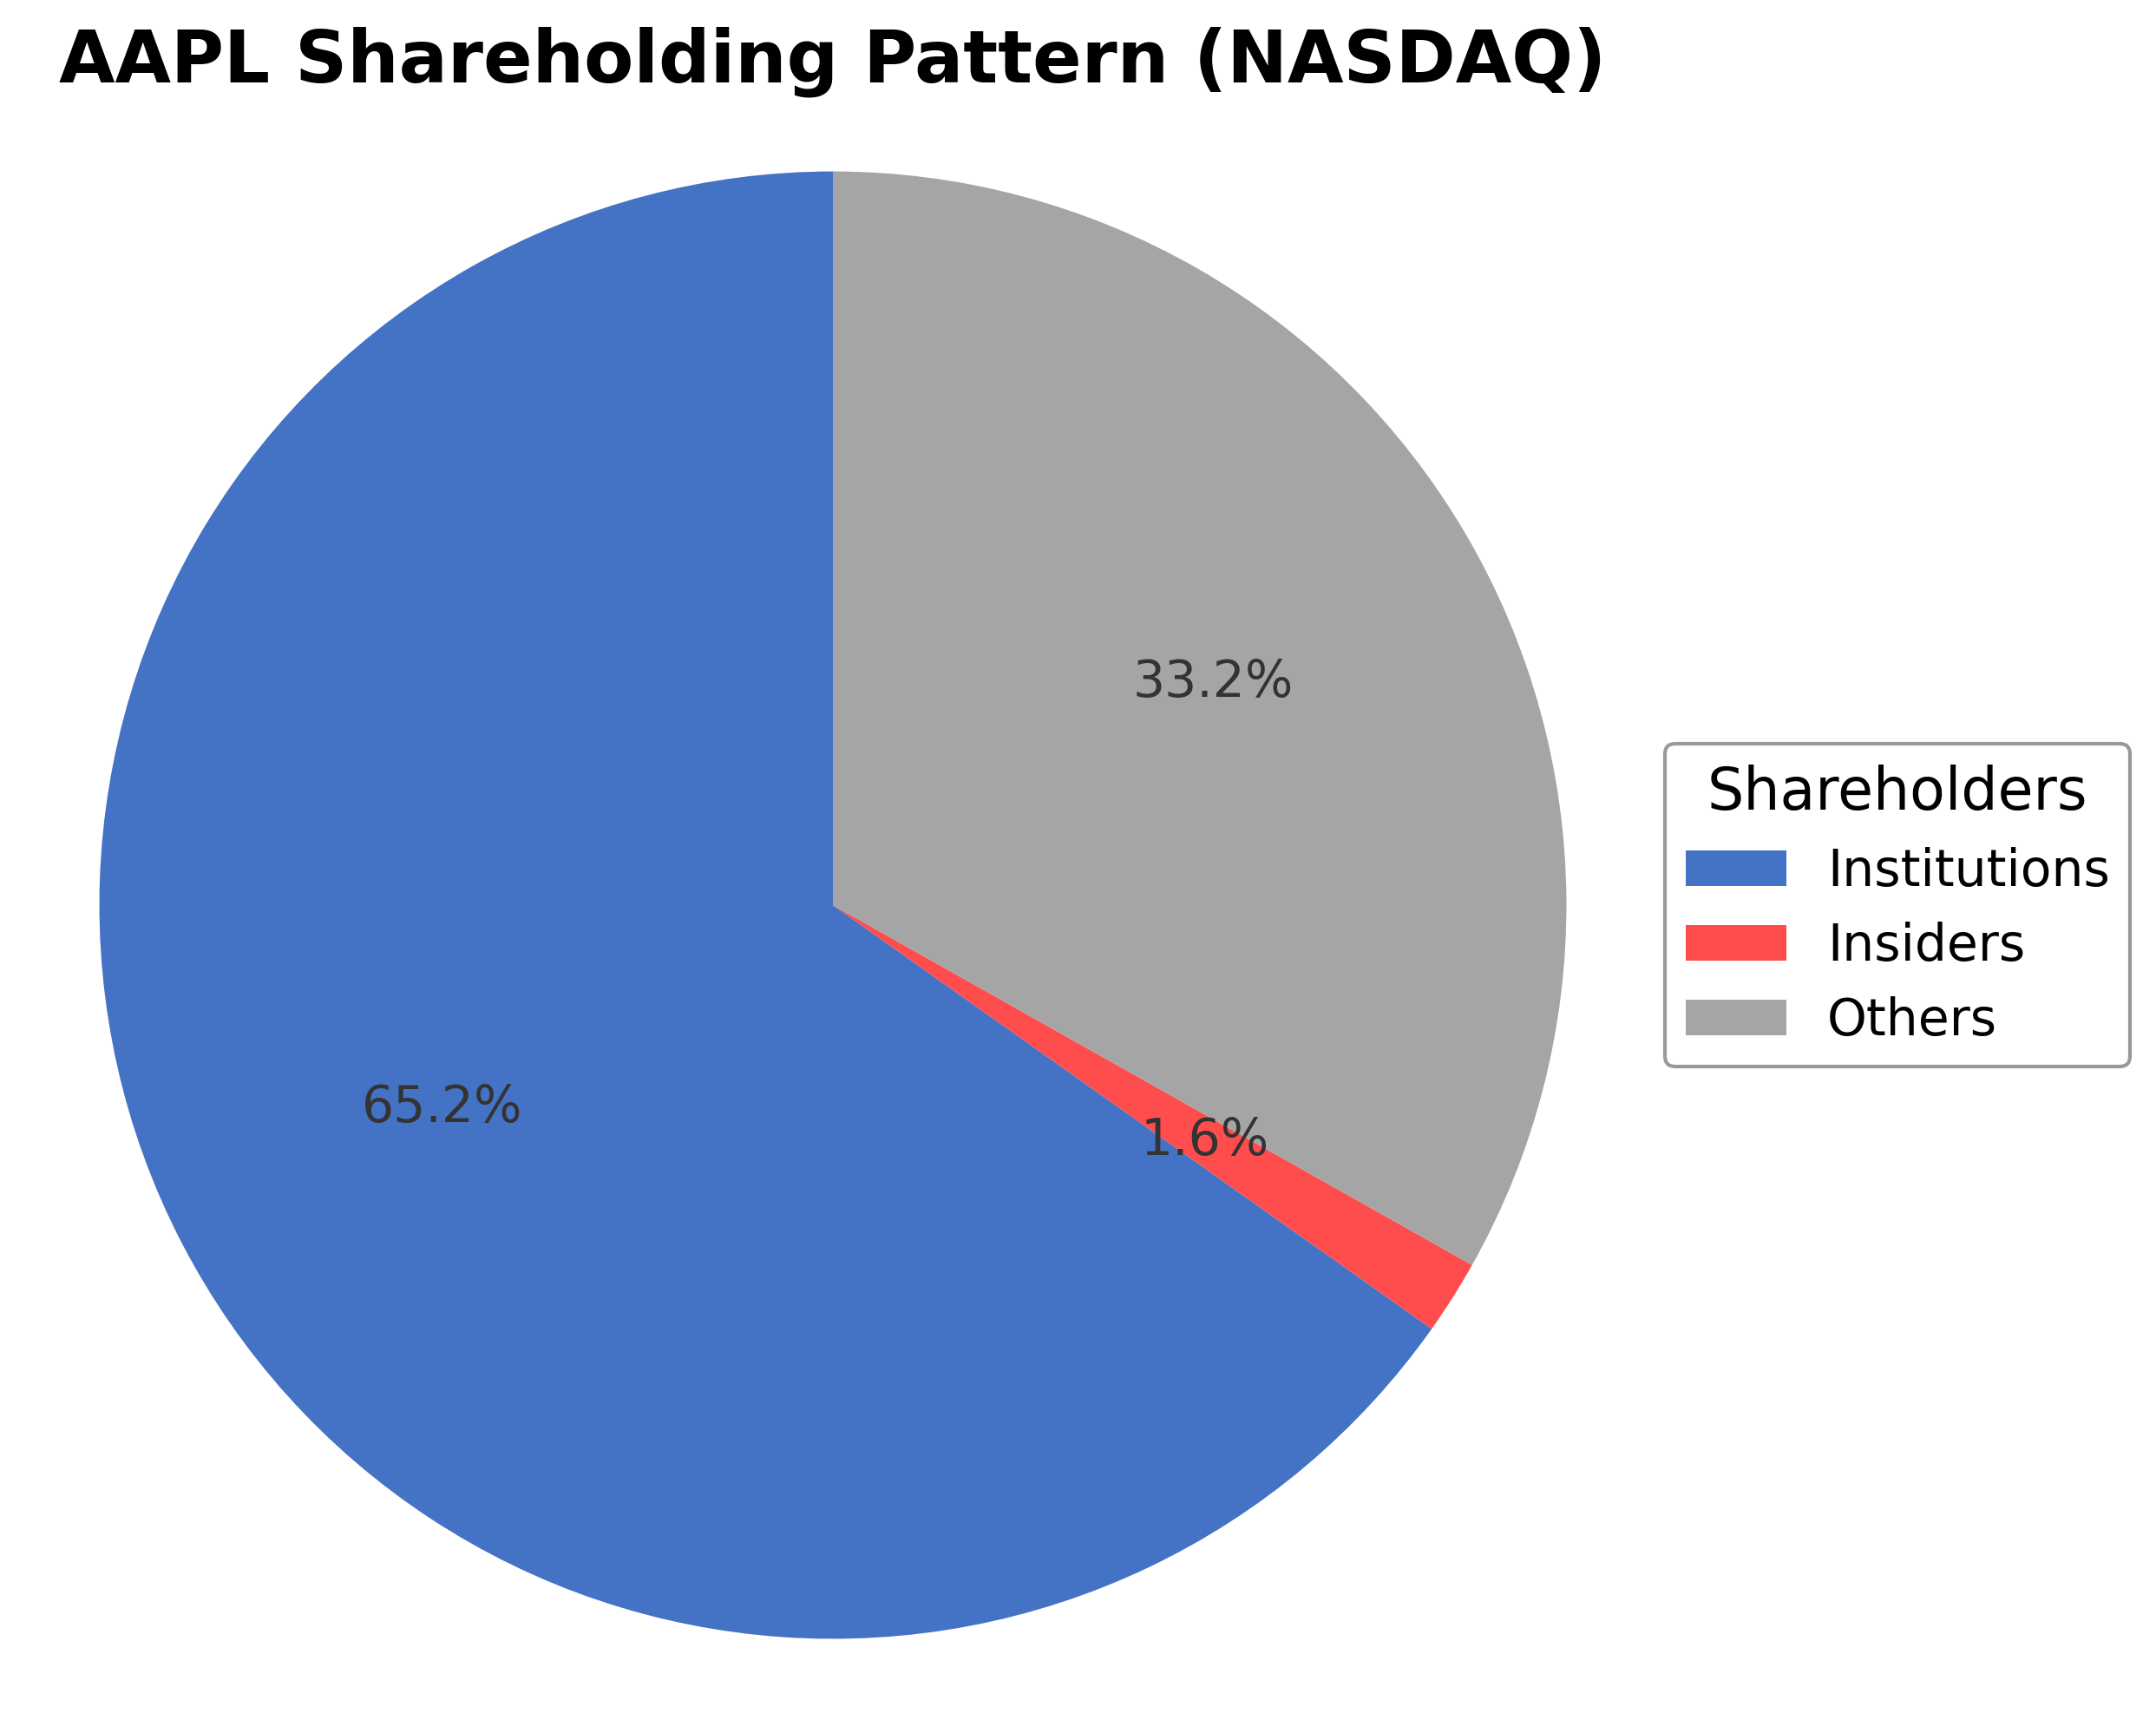
Apple Inc.'s ownership structure features insiders holding 1.64%, institutional investors controlling 65.20%, and other shareholders comprising roughly 33.16%. Over the past 12-24 months, institutional ownership has remained relatively stable with slight adjustments, including a 0.7% reduction by TCTC Holdings LLC in the third quarter. The significant institutional presence indicates sustained market confidence and influences governance and strategic decisions. This ownership distribution supports a balance between executive oversight and broad market participation, which may impact future corporate initiatives and shareholder engagement.
Sector and Industry Analysis
Apple Inc. (AAPL) operates primarily within the Technology sector, specifically in the Hardware industry, which encompasses consumer electronics, computing devices, and related software ecosystems. The global hardware market is substantial, with a multi-trillion-dollar valuation driven by ongoing digital transformation, increasing consumer adoption of smart devices, and enterprise demand for integrated technology solutions. Apple is a dominant player, with a market capitalization exceeding $3.7 trillion as of early 2026, reflecting its scale and influence. Key competitors include Samsung, Microsoft, Google (Alphabet), and emerging Chinese manufacturers such as Xiaomi and Huawei, each competing across segments like smartphones, personal computing, wearables, and software services.
Industry trends are shaped by rapid technological innovation and evolving consumer preferences. The proliferation of 5G connectivity, augmented reality (AR), and artificial intelligence (AI) integration into devices is driving product differentiation and new use cases. Consumers increasingly favor ecosystems that offer seamless interoperability, privacy, and subscription-based services, areas where Apple’s tightly integrated hardware-software model and expanding services portfolio (including streaming, cloud, and AR applications) provide competitive advantages. Additionally, sustainability and supply chain transparency are becoming critical, influencing product design and corporate strategy. The semiconductor shortage and geopolitical tensions have also underscored the importance of diversified manufacturing and chip design capabilities, prompting Apple’s investment in proprietary silicon and strategic partnerships with foundries like TSMC.
The regulatory environment for the hardware and technology sector is complex and evolving. Key regulatory considerations include data privacy laws (e.g., GDPR in Europe, CCPA in California), antitrust scrutiny, and trade policies affecting global supply chains and market access. Apple faces ongoing investigations and litigation related to its App Store practices and ecosystem control, which could impact its revenue models and platform openness. Compliance with environmental regulations, such as electronic waste directives and carbon emission targets, also shapes operational practices. Moreover, export controls and tariffs, particularly between the U.S. and China, influence sourcing strategies and cost structures. Companies must navigate these multifaceted regulatory frameworks to maintain market access and avoid penalties.
Competitive dynamics in the hardware industry are characterized by high capital intensity, rapid innovation cycles, and significant economies of scale. Barriers to entry are substantial due to the need for advanced R&D, global supply chain management, brand equity, and software ecosystem development. Apple’s competitive positioning is strengthened by its integrated approach—designing proprietary chips, operating systems, and applications—creating high switching costs and customer loyalty. The company’s retail footprint and direct-to-consumer sales channels further enhance control over the customer experience and margins. However, competition remains fierce, with rivals investing heavily in innovation and aggressive pricing strategies. Strategic partnerships, intellectual property portfolios, and continuous product ecosystem expansion are critical to sustaining competitive advantage in this dynamic market.
Note: Analysis synthesized from industry research, market reports, and regulatory filings. Information is subject to change based on market conditions.
Illustrative Scenario Analysis
DCF Assumptions:
Method: Two-Stage EPS-Priority Model
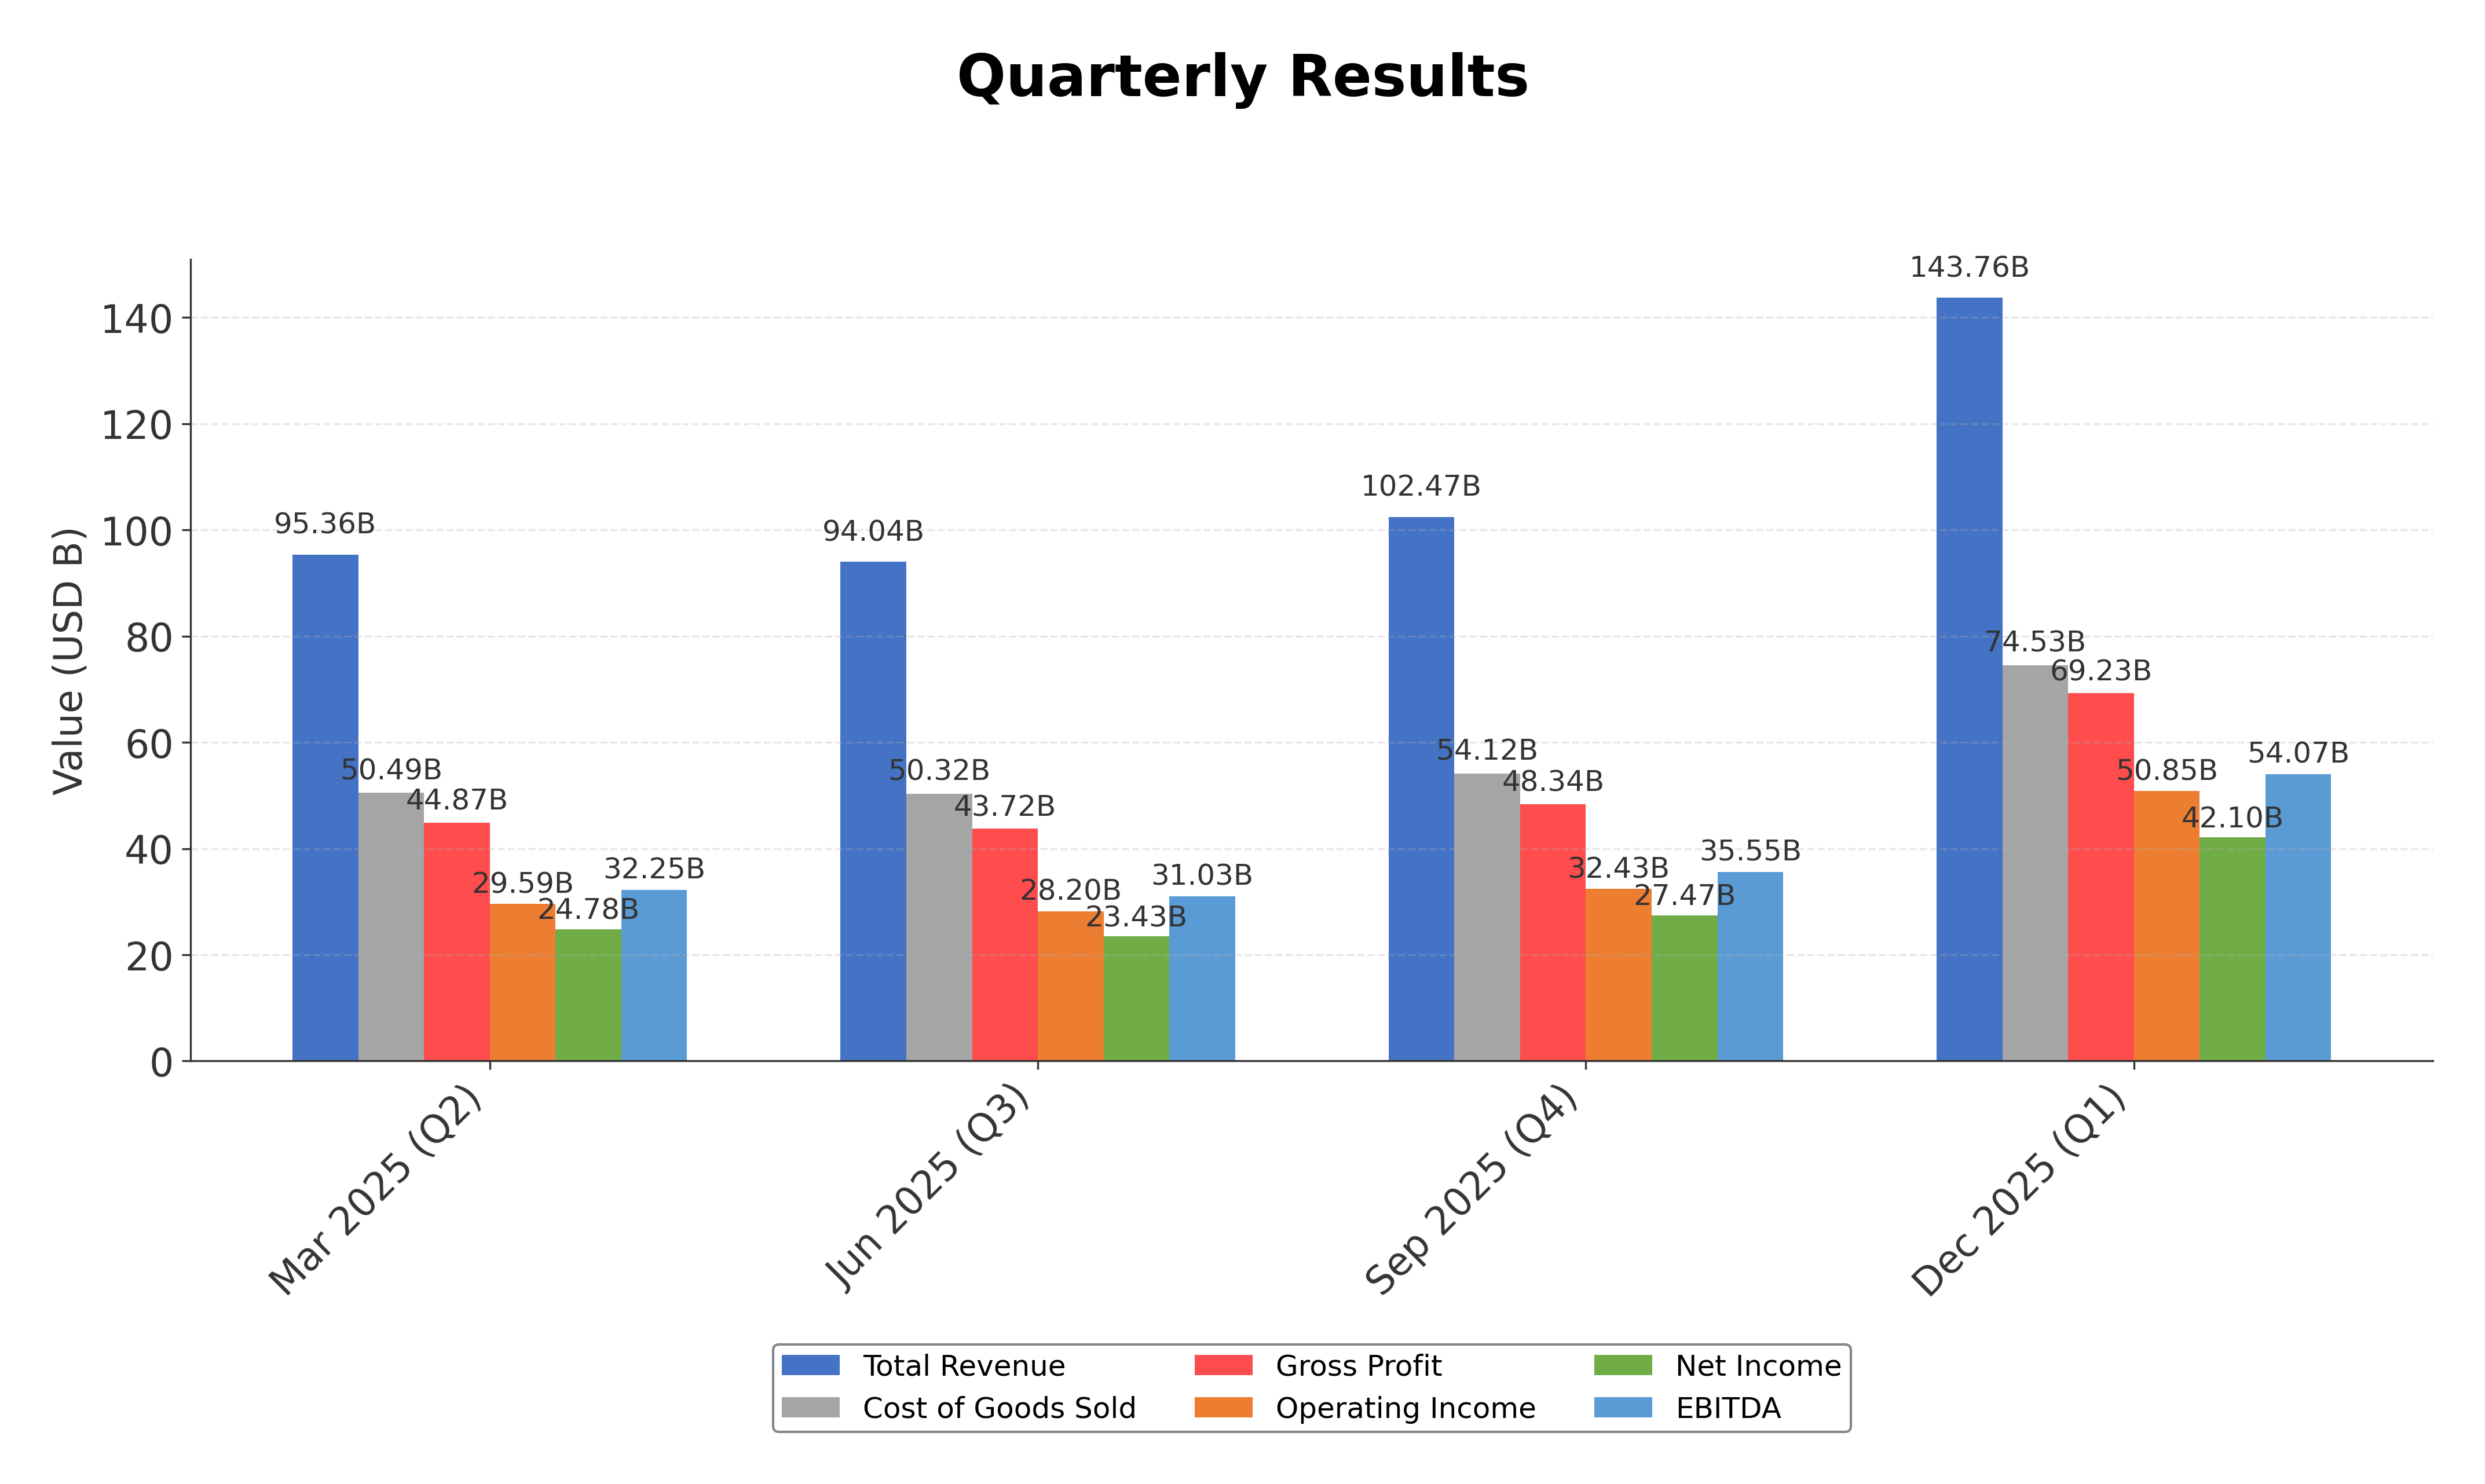
Financials
Peer Analysis
| Company Name | Market Cap | P/E Ratio | P/B Ratio | EV/EBITDA | Price to CFO |
|---|---|---|---|---|---|
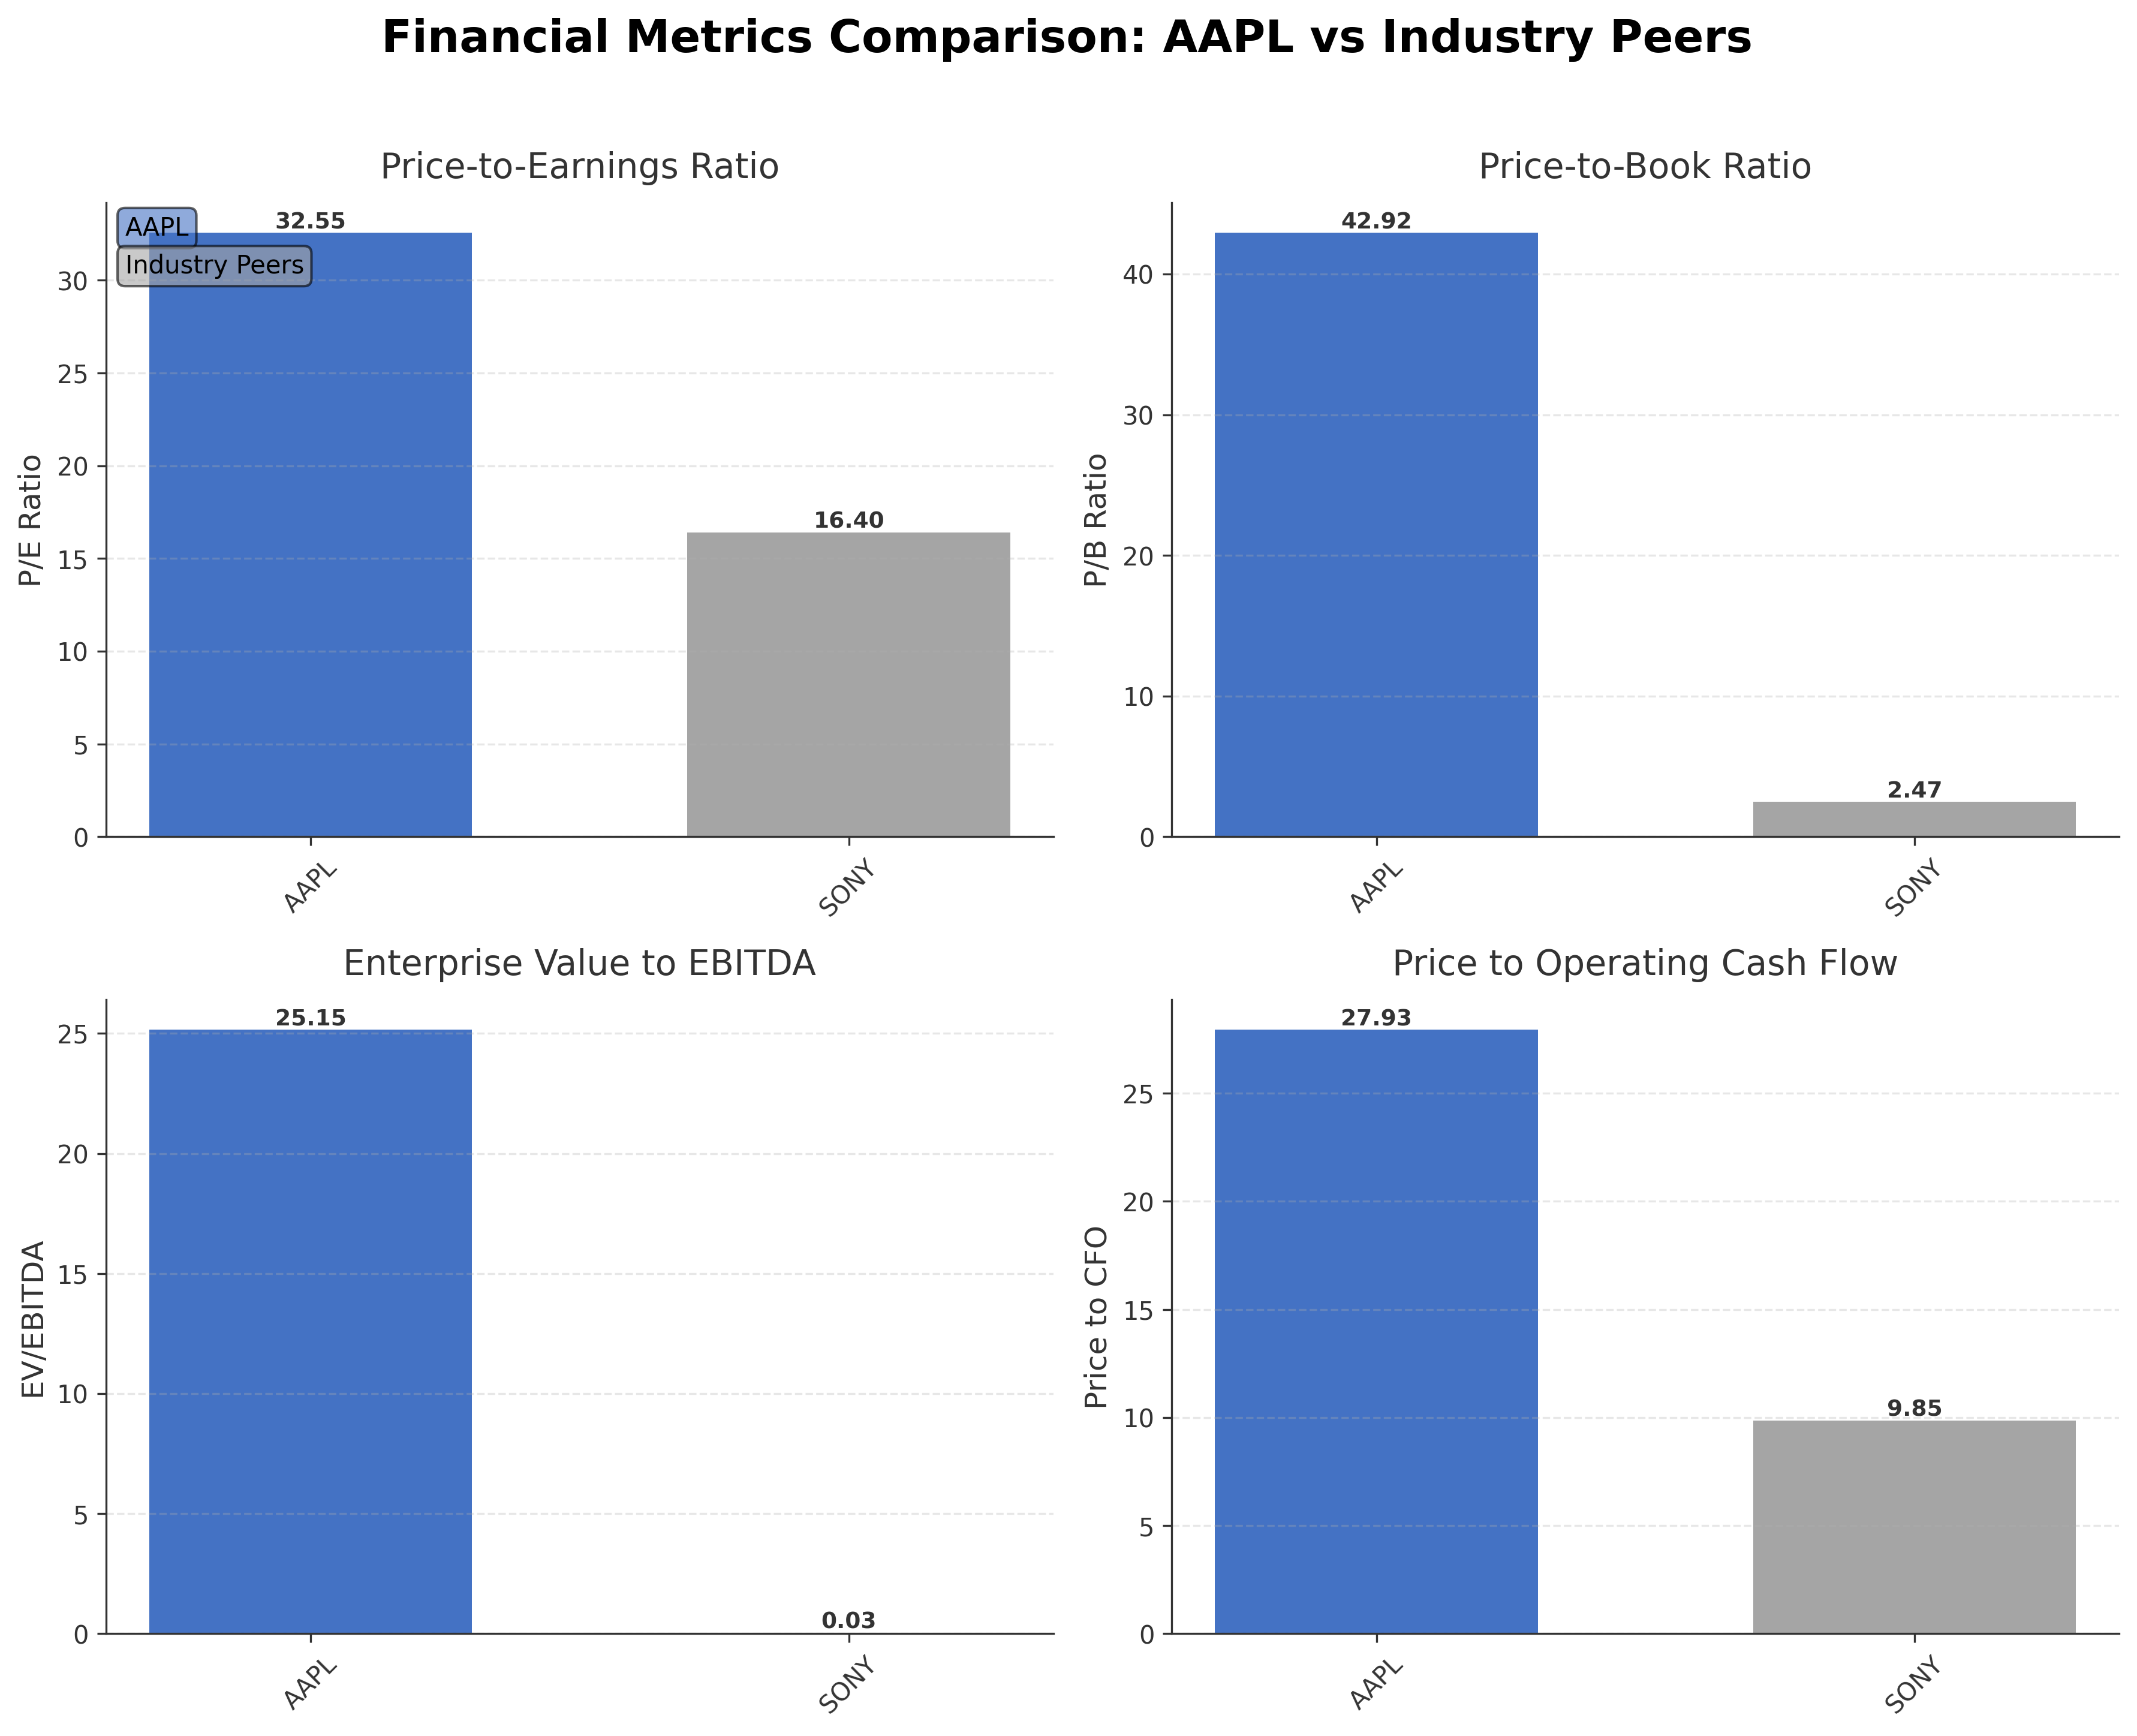
| Apple Inc. | $3.78T | 32.55 | 42.92 | 25.15 | 27.93 |
| Sony Group Corporation - Sponsored American Depositary Receipt | $128.09B | 16.40 | 2.47 | 0.03 | 9.85 |
Comparison Analysis: Apple Inc. significantly surpasses its regional peer Sony Group Corporation in market capitalization, reflecting its dominant position in the consumer electronics industry. Apple's valuation multiples, including P/E and EV/EBITDA, are substantially higher, indicating market expectations of sustained growth and profitability. The company also demonstrates superior return on equity compared to Sony, highlighting more efficient use of shareholder capital. However, Apple's price-to-book ratio is markedly elevated, which may reflect premium brand valuation and intangible asset intensity relative to peers.
Financial Metrics Comparison with Peers
Financial Statements
Comprehensive financial data including income, balance sheet, and cash flow metrics
Income Statement
| fiscal_date | 2025-09-30 | 2024-09-30 | 2023-09-30 | 2022-09-30 | 2021-09-30 |
|---|---|---|---|---|---|
| Sales | 416.16B | 391.04B | 383.29B | 394.33B | 365.82B |
| Cost Of Goods | 220.96B | 210.35B | 214.14B | 223.55B | 212.98B |
| Gross Profit | 195.20B | 180.68B | 169.15B | 170.78B | 152.84B |
| Operating Expense Research And Development | 34.55B | 31.37B | 29.91B | 26.25B | 21.91B |
| Operating Expense Selling General And Administrative | 27.60B | 26.10B | 24.93B | 25.09B | 21.97B |
| Operating Income | 133.05B | 123.22B | 114.30B | 119.44B | 108.95B |
| Other Income Expense | -321.00M | 269.00M | -565.00M | -334.00M | 60.00M |
| Pretax Income | 132.73B | 123.48B | 113.74B | 119.10B | 109.21B |
| Income Tax | 20.72B | 29.75B | 16.74B | 19.30B | 14.53B |
| Net Income | 112.01B | 93.74B | 97.00B | 99.80B | 94.68B |
| Eps Basic | 7.49 | 6.11 | 6.16 | 6.15 | 5.67 |
| Eps Diluted | 7.46 | 6.08 | 6.13 | 6.11 | 5.61 |
| Basic Shares Outstanding | 14.95B | 15.34B | 15.74B | 16.22B | 16.70B |
| Diluted Shares Outstanding | 14.95B | 15.34B | 15.74B | 16.22B | 16.70B |
| Ebit | 133.05B | 123.22B | 114.30B | 119.44B | 111.85B |
| Ebitda | 144.75B | 134.66B | 125.82B | 130.54B | 123.14B |
| Net Income Continuous Operations | 112.01B | 93.74B | 97.00B | 99.80B | 94.68B |
| Non Operating Interest Income | N/A | N/A | 3.75B | 2.83B | 2.84B |
| Non Operating Interest Expense | N/A | N/A | 3.93B | 2.93B | 2.65B |
Data provided by Twelve Data
Balance Sheet
| fiscal_date | 2025-09-30 | 2024-09-30 | 2023-09-30 | 2022-09-30 | 2021-09-30 |
|---|---|---|---|---|---|
| Cash And Cash Equivalents | 35.93B | 29.94B | 29.96B | 23.65B | 34.94B |
| Accounts Receivable | 39.78B | 33.41B | 29.51B | 28.18B | 26.28B |
| Total Assets | 359.24B | 364.98B | 352.58B | 352.75B | 351.00B |
| Total Liabilities | 285.51B | 308.03B | 290.44B | 302.08B | 287.91B |
| Long Term Debt | 78.33B | 85.75B | 95.28B | 109.71B | 119.38B |
| Shareholders Equity | 73.73B | 56.95B | 62.15B | 50.67B | 63.09B |
Data provided by Twelve Data
Cash Flow Statement
| fiscal_date | 2025-09-30 | 2024-09-30 | 2023-09-30 | 2022-09-30 | 2021-09-30 |
|---|---|---|---|---|---|
| Operating Activities Net Income | 112.01B | 93.74B | 97.00B | 99.80B | 94.68B |
| Operating Activities Depreciation | 11.70B | 11.45B | 11.52B | 11.10B | 11.28B |
| Operating Activities Stock Based Compensation | 12.86B | 11.69B | 10.83B | 9.04B | 7.91B |
| Operating Activities Other Non Cash Items | -89.00M | -2.27B | -2.23B | 1.01B | -4.92B |
| Operating Activities Accounts Receivable | -7.03B | -5.14B | -417.00M | -9.34B | -14.03B |
| Operating Activities Accounts Payable | 902.00M | 6.02B | -1.89B | 9.45B | 12.33B |
| Operating Activities Other Assets Liabilities | -18.87B | 2.77B | -4.27B | 1.57B | -1.53B |
| Operating Activities Operating Cash Flow | 111.48B | 118.25B | 110.54B | 123.52B | 100.94B |
| Investing Activities Capital Expenditures | -12.71B | -9.45B | -10.96B | -10.71B | -11.09B |
| Investing Activities Purchase Of Investments | -24.41B | -48.66B | -29.51B | -76.92B | -109.56B |
| Investing Activities Sale Of Investments | 53.80B | 62.35B | 45.51B | 67.36B | 106.48B |
| Investing Activities Other Investing Activity | -1.48B | -1.31B | -1.34B | -2.09B | -385.00M |
| Investing Activities Investing Cash Flow | 15.20B | 2.94B | 3.71B | -22.66B | -14.58B |
| Financing Activities Long Term Debt Issuance | 4.48B | 0.00 | 5.23B | 5.46B | 20.39B |
| Financing Activities Long Term Debt Payments | -10.93B | -9.96B | -11.15B | -9.54B | -8.75B |
| Financing Activities Short Term Debt Issuance | -2.03B | 3.96B | -3.98B | 3.96B | 1.02B |
| Financing Activities Common Stock Repurchase | -90.71B | -94.95B | -77.55B | -89.40B | -85.97B |
| Financing Activities Common Dividends | -15.42B | -15.23B | -15.03B | -14.84B | -14.47B |
| Financing Activities Other Financing Charges | -6.07B | -5.80B | -6.01B | -6.38B | -5.58B |
| Financing Activities Financing Cash Flow | -120.69B | -121.98B | -108.49B | -110.75B | -92.25B |
| End Cash Position | 35.93B | 29.94B | 30.74B | 24.98B | 35.93B |
| Income Tax Paid | 43.37B | 26.10B | 18.68B | 19.57B | 25.39B |
| Free Cash Flow | 98.77B | 108.81B | 99.58B | 111.44B | 92.95B |
| Interest Paid | N/A | N/A | 3.80B | 2.87B | 2.69B |
| Operating Activities Deferred Taxes | N/A | N/A | N/A | 895.00M | -4.77B |
| Investing Activities Net Acquisitions | N/A | N/A | N/A | -306.00M | -33.00M |
| Financing Activities Common Stock Issuance | N/A | N/A | N/A | N/A | 1.10B |
Data provided by Twelve Data
Technical Analysis
Key Insights
- Apple's stock is currently exhibiting an upward trend, trading above both its 50-day moving average ($264.56) and 200-day moving average ($243.93), indicating positive price momentum.
- Key support levels are identified near $243.93 (200-day MA) and $169.21 (52-week low), while resistance is observed near the 52-week high of $288.62.
- The stock price remains above the 10-day, 50-day, and 200-day moving averages, suggesting sustained bullish momentum across short, medium, and long-term timeframes.
- Momentum indicators show a Relative Strength Index (RSI) near neutral to moderately strong levels, MACD indicates positive divergence, and Stochastic oscillators reflect steady momentum without overbought conditions.
- Multi-timeframe analysis reveals consistent bullish signals on daily, weekly, and monthly charts, supporting the current upward price action.
- Potential market scenarios include continuation of the current uptrend if support levels hold, while a breach below 200-day moving average may signal increased volatility or consolidation.
Trending News
1. Headline: Apple Just Sent Investors a Message: Is The Stock a Buy? | The Motley Fool
Summary: And through much of this period, the company relied on its popular devices, most notably the iPhone, to drive sales growth. However, the tech leader's strategy moving forward will likely be a bit different: Apple will rely increasingly more on its services segment.
Sentiment: positive
2. Headline: Apple Inc. $AAPL is TCTC Holdings LLC's 9th Largest Position
Summary: TCTC Holdings LLC cut its holdings in Apple Inc. (NASDAQ:AAPL - Free Report) by 0.7% during the third quarter, according to the company in its most recent 13F filing with the Securities & Exchange Commission. The fund owned 320,993 shares of the iPhone maker's stock after selling 2,127 shares d
Sentiment: negative
3. Headline: With the MacBook Neo, Apple officially changes its image - Fast Company
Summary: If I had a nickel for every time over the past two decades that I’ve heard someone say, “Apple is many things, but affordable isn’t one of them,” I’d probably have enough to buy the latest 16-inch M5 MacBook Pro, introduced this week at an eye-watering $2,699.
Sentiment: neutral
4. Headline: Apple adds Steve Lemay and Molly Anderson to its leadership page - 9to5Mac
Summary: To check out Apple’s updated leadership page, follow this link. ... FTC: We use income earning auto affiliate links.
Sentiment: neutral
5. Headline: The Dealmaking 3: Wicket Makes Canadian Deal, F1’s Latest Deal with Apple, F1 Q4 Earnings
Summary: Watch The Dealmaking 3 of the Week: This week of The Dealmaking 3 with “The Sports Professor” Rick Horrow features the Calgary Flames becoming Wicket’s first Canadian customer with VIP facial recognition for ticketing deployment, Apple Inc. (Nasdaq: AAPL) securing a 5-year rights deal ...
Sentiment: positive
6. Headline: Apple Just Unveiled the New iPhone 17e. Should You Buy, Sell, or Hold AAPL Stock Now?
Summary: Earlier this week, Apple unveiled two new products, an updated low-end iPhone (17e) and a refreshed iPad Air. The iPhone 17e includes Apple's MagSafe charging technology, Apple's 3-nanometer A19 processor, and a 48MP Fusion camera.
Sentiment: neutral
7. Headline: How To Pre-Order Apple's New iPad Air M4, iPhone 17e, and MacBook Neo and Air M5 | PCMag
Summary: Priced at just $599, the MacBook Neo brings style and speed to the entry-level laptop market, with four color options: blush, indigo, citrus, and classic silver. Apple's display dominance continues, with a a 13-inch Liquid Retina display with a 2,408-by-1,506 resolution and 500 nits of brightness.
Sentiment: neutral
8. Headline: Why Apple's MacBook Neo could shake up budget laptops this spring
Summary: When it comes to the MacBook Neo, the choices Apple made become a bit more interesting. The biggest change is the use of the A18 Pro chip (originally designed for and used in last year’s premium iPhone line) as the main processor for the Neo. All other MacBooks, including the newly updated ...
Sentiment: neutral
9. Headline: Apple announces MacBook Neo, its most affordable laptop ever
Summary: The laptop features a 13-inch display, a lightweight metal body that comes in at 2.7 pounds and a colorful finish that gives it a more approachable, consumer-friendly look than the rest of Apple's notebook lineup.
Sentiment: neutral
10. Headline: Apple Rolls Out $599 MacBook Neo, Threatening Windows PC Market - Bloomberg
Summary: Apple Inc. rolled out the $599 MacBook Neo in its biggest push yet into low-end laptops, aiming to challenge Windows PCs and Chromebooks for budget-minded shoppers.
Sentiment: neutral
Powered by Brave
Recent Updates
News Summary
Recent news highlights Apple's launch of the MacBook Neo, an affordable laptop featuring a 13-inch Liquid Retina display and durable design, signaling a strategic expansion into budget-friendly devices. The company plans to extend its 'Ultra' product lines following this launch, indicating ongoing innovation efforts. Media coverage emphasizes Apple's shift towards becoming a more accessible tech brand, while AI adoption trends are enhancing Apple's relevance in secure and affordable computing. Despite some critiques regarding feature limitations in the MacBook Neo, the overall narrative reflects a balanced mix of innovation and market repositioning.
News Sentiment
Sentiment across recent updates is predominantly neutral to positive, with constructive commentary on Apple's product diversification and technological advancements. Positive sentiment is driven by product launches and AI integration, while neutral tones reflect measured industry analysis and feature evaluations. This balanced sentiment may influence market perceptions by underscoring both growth opportunities and competitive challenges.
Analytical Overview
Analysis Summary
Valuation Metrics: Apple's trailing P/E ratio of 32.55 is slightly above the industry average, reflecting premium valuation consistent with its market leadership and growth prospects. The forward P/E of 27.72 suggests expectations of earnings growth, while the PEG ratio near 1.78 indicates moderate valuation relative to projected growth.
Growth Trajectory: The company exhibits a strong growth trajectory with quarterly revenue growth of 15.7% and quarterly earnings growth of 15.9% year-over-year, supported by robust operating and free cash flows exceeding $135 billion and $106 billion respectively.
Financial Health: Apple maintains a solid financial position with total cash of approximately $66.9 billion and total debt around $90.5 billion, resulting in a debt-to-equity ratio of 102.63%. The current ratio near 0.97 indicates liquidity close to parity, supported by strong cash flow generation.
Sector Specific Factors: The consumer electronics sector faces rapid technological changes and competitive pressures, with opportunities in AI integration and services expansion. Apple's strategic moves into affordable devices and services diversification align with these sector trends, while regulatory scrutiny and supply chain risks remain pertinent.
Market Positioning: Apple's dominant market position, extensive ecosystem, and brand loyalty provide competitive advantages, enabling it to capitalize on innovation and consumer trends within the technology sector.
Investment Conclusion
Supporting Factors: Strong revenue and earnings growth with significant cash flow generation.
Risk Factors: High valuation multiples relative to industry peers.
SWOT Analysis
Strengths
- Market leadership with a diversified product and services ecosystem.
- Strong profitability and cash flow generation.
- Robust brand recognition and customer loyalty.
- Significant institutional ownership supporting governance.
Weaknesses
- High price-to-book ratio indicating premium valuation.
- Debt-to-equity ratio above 100%, reflecting moderate leverage.
- Current ratio below 1, suggesting tight short-term liquidity.
- Dependence on flagship products for a substantial portion of revenue.
Opportunities
- Expansion into affordable device segments with products like MacBook Neo.
- Growth potential in services and subscription-based offerings.
- Integration of AI technologies enhancing product relevance.
- Strategic partnerships and rights deals expanding market reach.
Threats
- Intense competition in consumer electronics and technology sectors.
- Regulatory scrutiny and potential compliance challenges.
- Supply chain disruptions impacting product availability.
- Market sensitivity to valuation and macroeconomic factors.
Company Description
Apple Inc. is a leading technology company renowned for designing, manufacturing, and marketing innovative hardware and software products for consumers and businesses worldwide. Its flagship product, the iPhone, accounts for the majority of sales, serving as the central hub of an expansive ecosystem that includes Mac computers, iPad tablets, Apple Watch wearables, and accessories like AirPods. Apple Inc. also offers a suite of services such as the App Store, Apple Music, iCloud, Apple TV+, and Apple Fitness+, providing digital content, cloud storage, and subscription-based platforms. Operating in the consumer electronics industry within the technology sector, the company employs approximately 166,000 people and maintains a broad global presence through online stores, retail outlets, and partnerships with carriers and resellers. With a substantial market capitalization reflecting its scale, Apple Inc. plays a pivotal role in shaping consumer technology trends, emphasizing seamless integration across devices and services to enhance user experience and productivity.