
Apple Inc (AAPL)
Stock Analysis Report
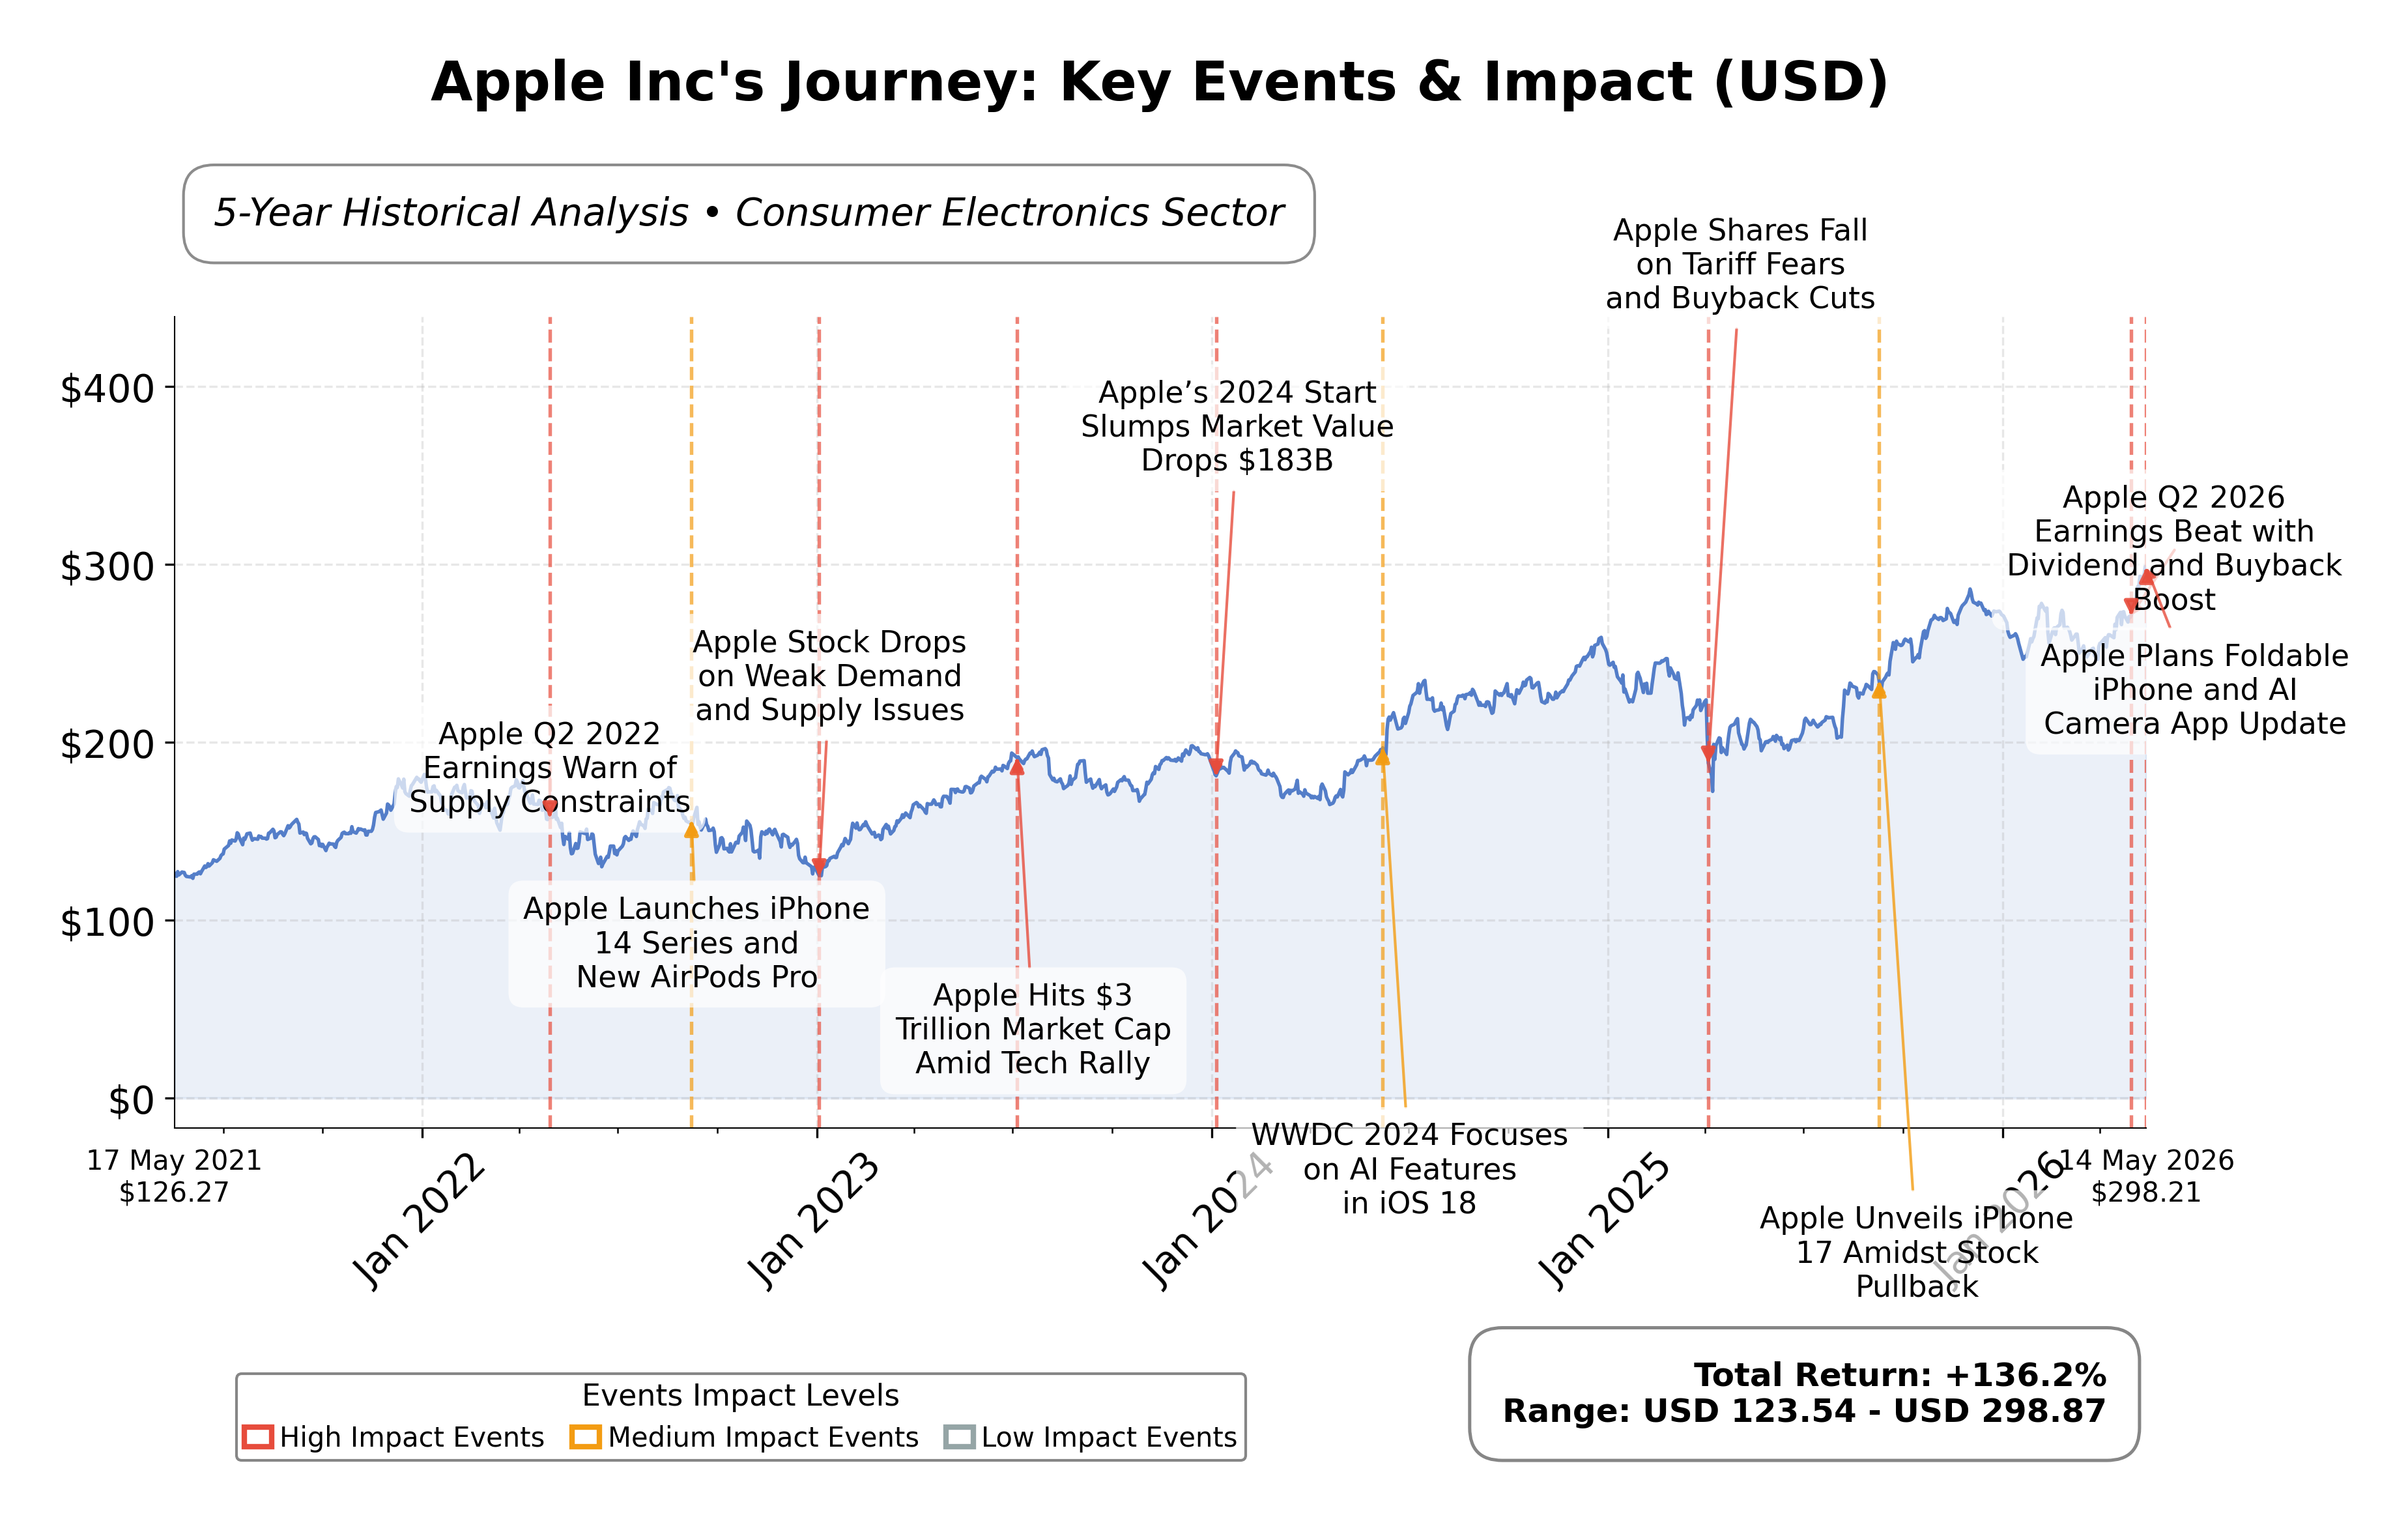
Stock Journey
Key Positives and Key Risks
Pros
- Revenue growth of 16.6% year-over-year demonstrates strong demand and business expansion.
- Operating cash flow of $140.2 billion and free cash flow of $101 billion indicate robust financial health and liquidity.
- Market capitalization of $4.31 trillion reflects significant scale and investor confidence.
Cons
- High trailing P/E ratio of 35.47 and price-to-book ratio of 40.40 suggest premium valuation that may limit upside.
- Debt-to-equity ratio of 79.5% indicates moderate leverage that requires monitoring amid rising interest rates.
- Legal risks related to potential OpenAI litigation could impact future operations and investor sentiment.
Disclosure: This information is for general awareness and does not constitute investment advice
Report Summary
Apple Inc. operates as a leading technology company primarily engaged in designing, manufacturing, and marketing consumer electronics and software products. Its flagship product, the iPhone, dominates its revenue streams, supported by a broad ecosystem including Mac computers, iPads, Apple Watch, and services such as the App Store and Apple Music. Listed on NASDAQ under the technology sector, Apple holds a prominent market position globally with a diverse product portfolio and extensive distribution channels.
Financially, Apple reported trailing twelve months revenue of approximately $451.4 billion, with a gross margin of 49.3%, operating margin of 32.3%, and a net profit margin of 27.15%. The company demonstrates strong profitability and operational efficiency, supported by a return on equity (ROE) of 141.47% and return on assets (ROA) of 26.23%. Its return on invested capital (ROIC) is also robust, underscoring effective capital utilization and earnings generation.
Valuation metrics indicate a trailing price-to-earnings (P/E) ratio of 35.47 and a price-to-book (P/B) ratio of 40.40, with an enterprise value to EBITDA (EV/EBITDA) multiple of 27.03. Apple’s market capitalization stands at approximately $4.31 trillion, reflecting its scale and investor confidence. The stock trades near its 52-week high of $294.76, currently priced at $298.17, signaling strong market demand and premium valuation relative to fundamentals.
Apple’s strengths include significant cash flow generation with operating cash flow of $140.2 billion and free cash flow exceeding $101 billion, alongside manageable debt levels with a debt-to-equity ratio of 79.5%. The company maintains market leadership and continues innovation through product launches and service expansion. Key risks involve regulatory scrutiny, competitive pressures, and supply chain challenges. Recent strategic moves include a $100 billion share repurchase authorization and leadership transition with John Ternus set to become CEO.
Technically, the stock exhibits an upward trend supported by momentum indicators and trading above key moving averages. Recent news highlights strong earnings growth and product demand, although legal challenges related to AI integration have emerged. Overall, current conditions suggest a balanced environment where monitoring developments and market dynamics remains prudent.
Company and Industry Overview
Company Basics
Price Performance
Company Size
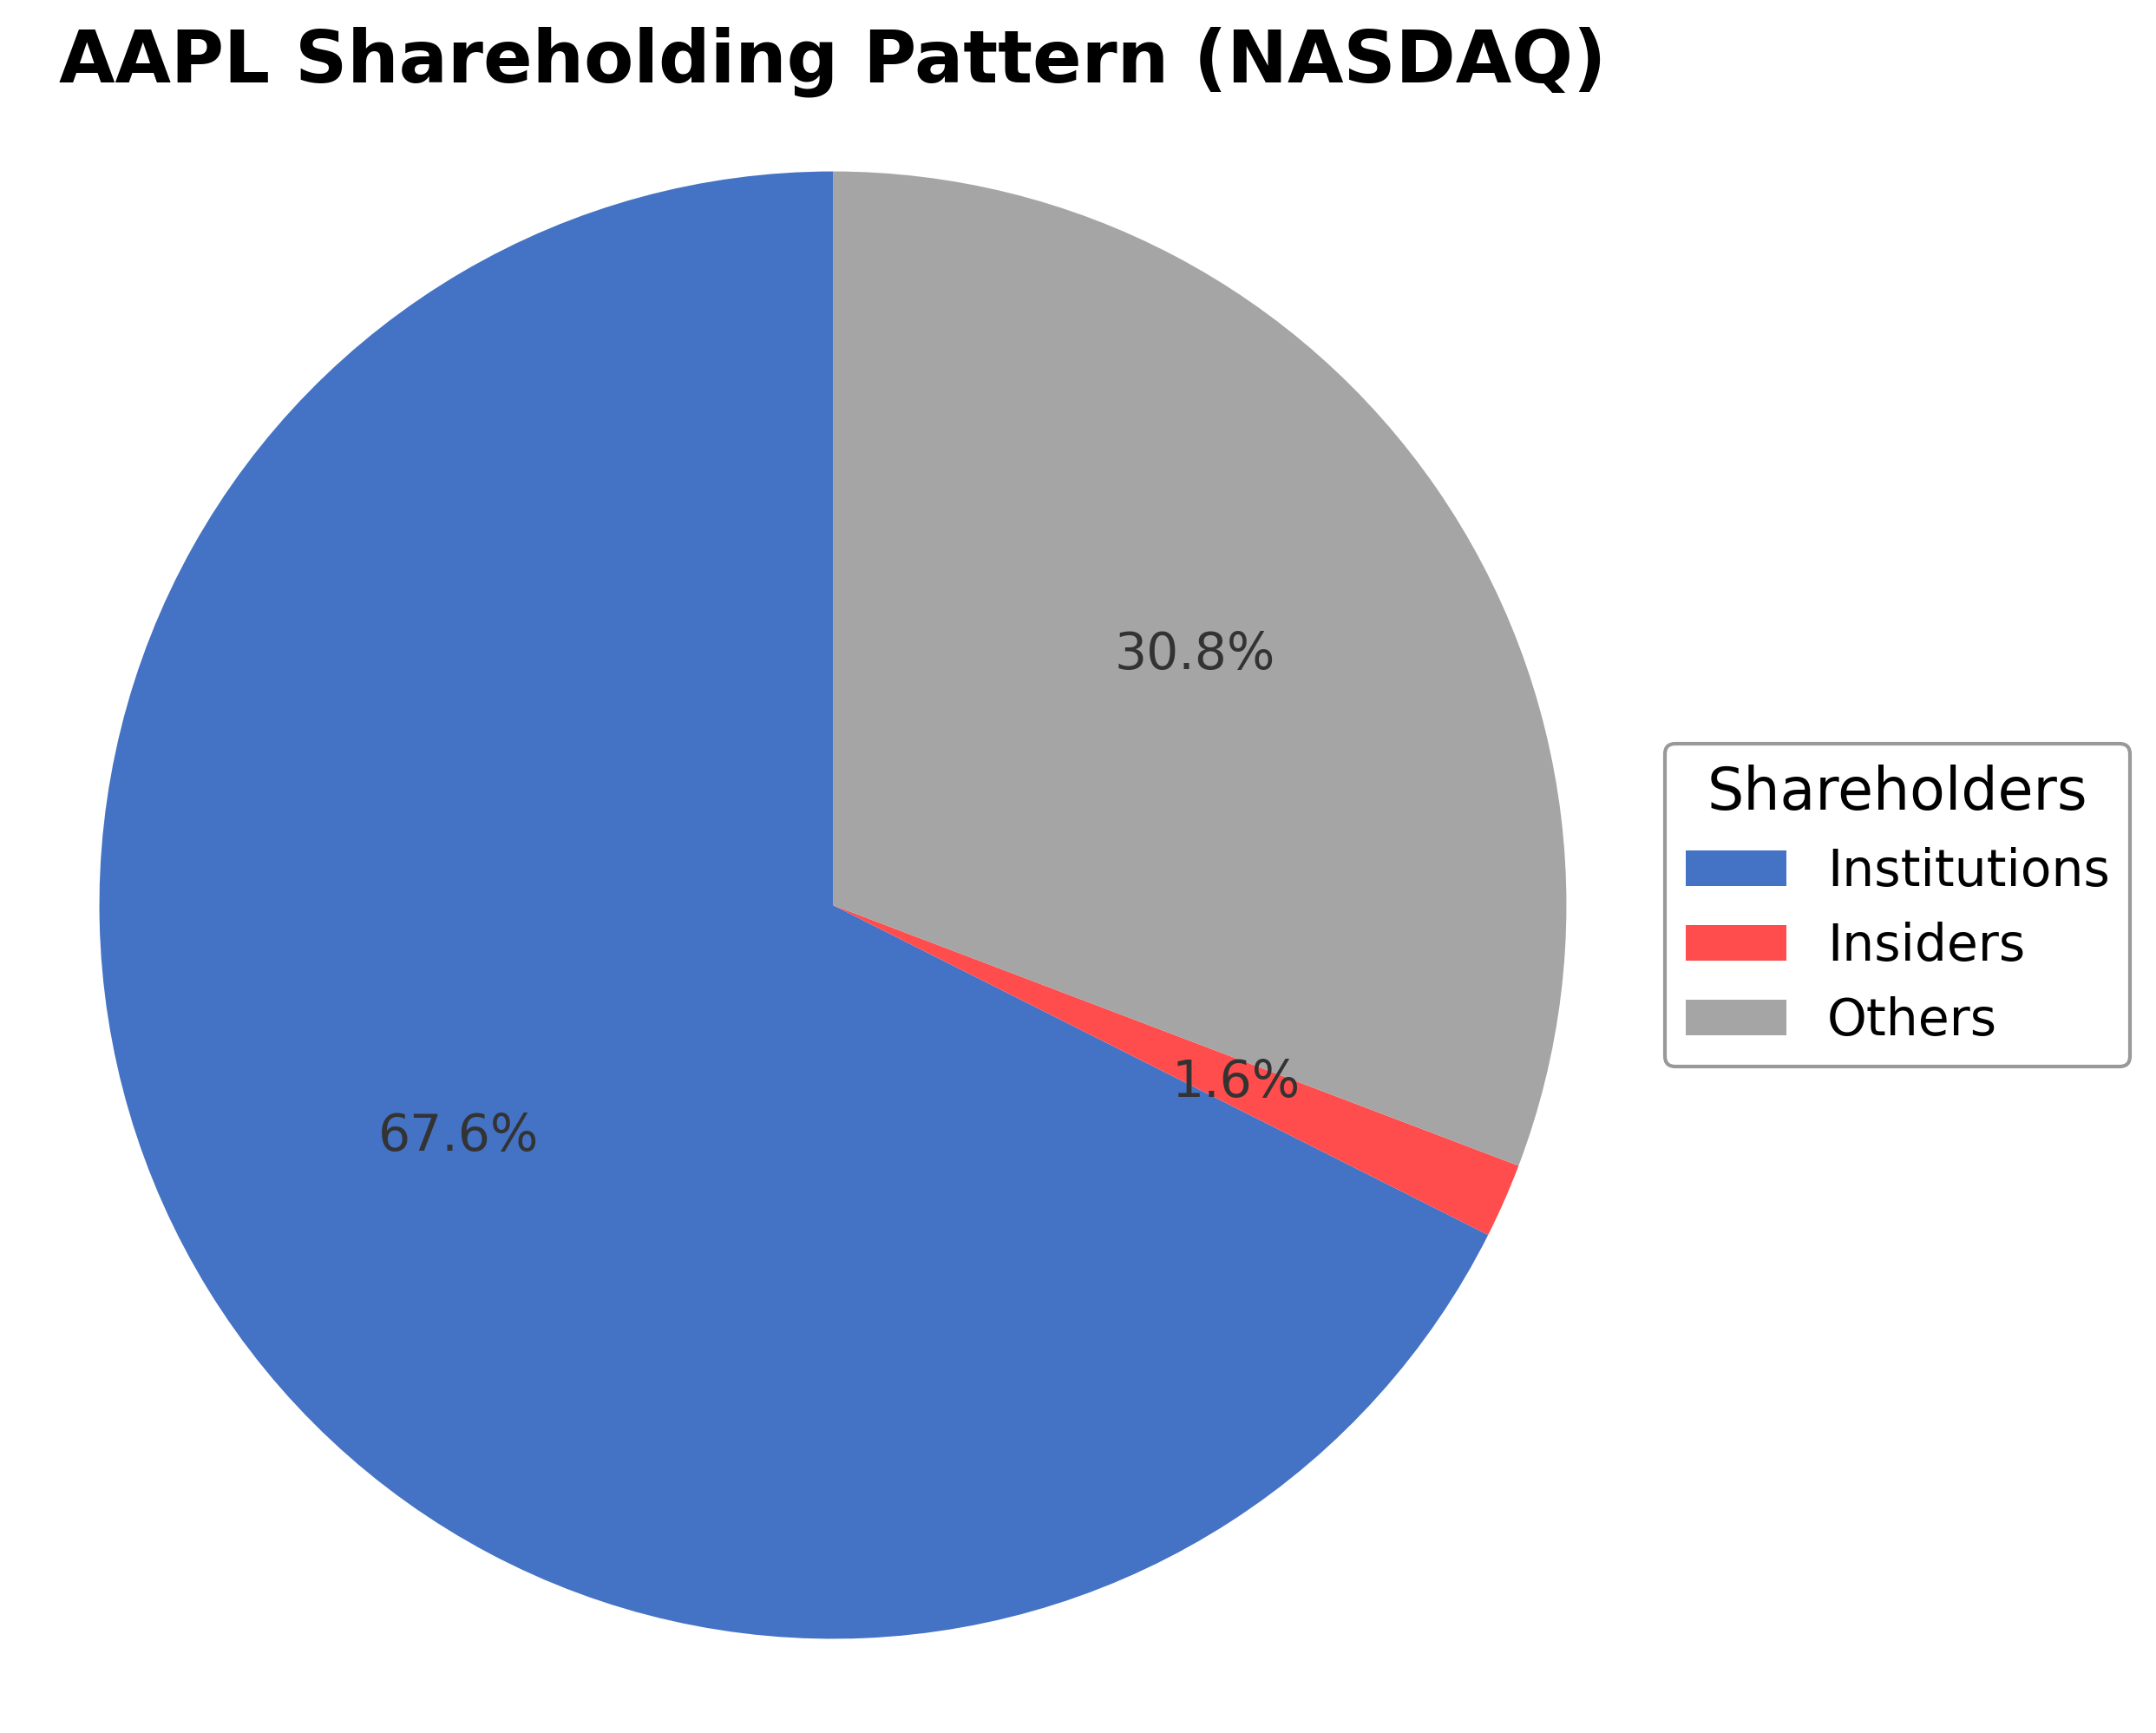
Shareholding Pattern
Sector and Industry Analysis
The global apple market is projected to grow by USD 15.94 billion between 2024 and 2029, with a compound annual growth rate (CAGR) of 3.4%. This growth is supported by increasing consumer demand for superfoods and health-conscious products. The market comprises approximately 25 key vendors, including major players such as Auvil Fruit Co. Inc., Batlow Fruit Co. Pty Ltd, and Stemilt Growers LLC, which collectively shape the competitive landscape.
Current industry trends highlight the rising popularity of urban farming and the expansion of retail channels, particularly private-label brands, which are driving demand. Competitive dynamics are influenced by factors such as product differentiation, pricing strategies, and distribution channels, with offline and online sales both contributing to market growth. Barriers to entry remain moderate due to established vendor presence and the need for supply chain efficiencies.
The regulatory environment affecting the apple market centers on food safety standards, import-export regulations, and agricultural policies that vary by region. Compliance with these regulations is critical for market participants to maintain product quality and access international markets. Looking ahead, evolving regulations related to sustainability and pesticide use may further impact production practices and market operations.
Note: Analysis synthesized from industry research, market reports, and regulatory filings. Information is subject to change based on market conditions.
Financial Ratios Dashboard
Illustrative Scenario Analysis
DCF Assumptions:
Method: Two-Stage EPS-Priority Model
Financials
Peer Analysis
| Company Name | Market Cap | P/E Ratio | P/B Ratio | EV/EBITDA | Price to CFO |
|---|---|---|---|---|---|
| Apple Inc | $4.31T | 35.47 | 40.40 | 27.03 | 30.72 |
| Sony Group Corporation - Sponsored American Depositary Receipt | $119.04B | 18.32 | 2.32 | -0.01 | 9.59 |
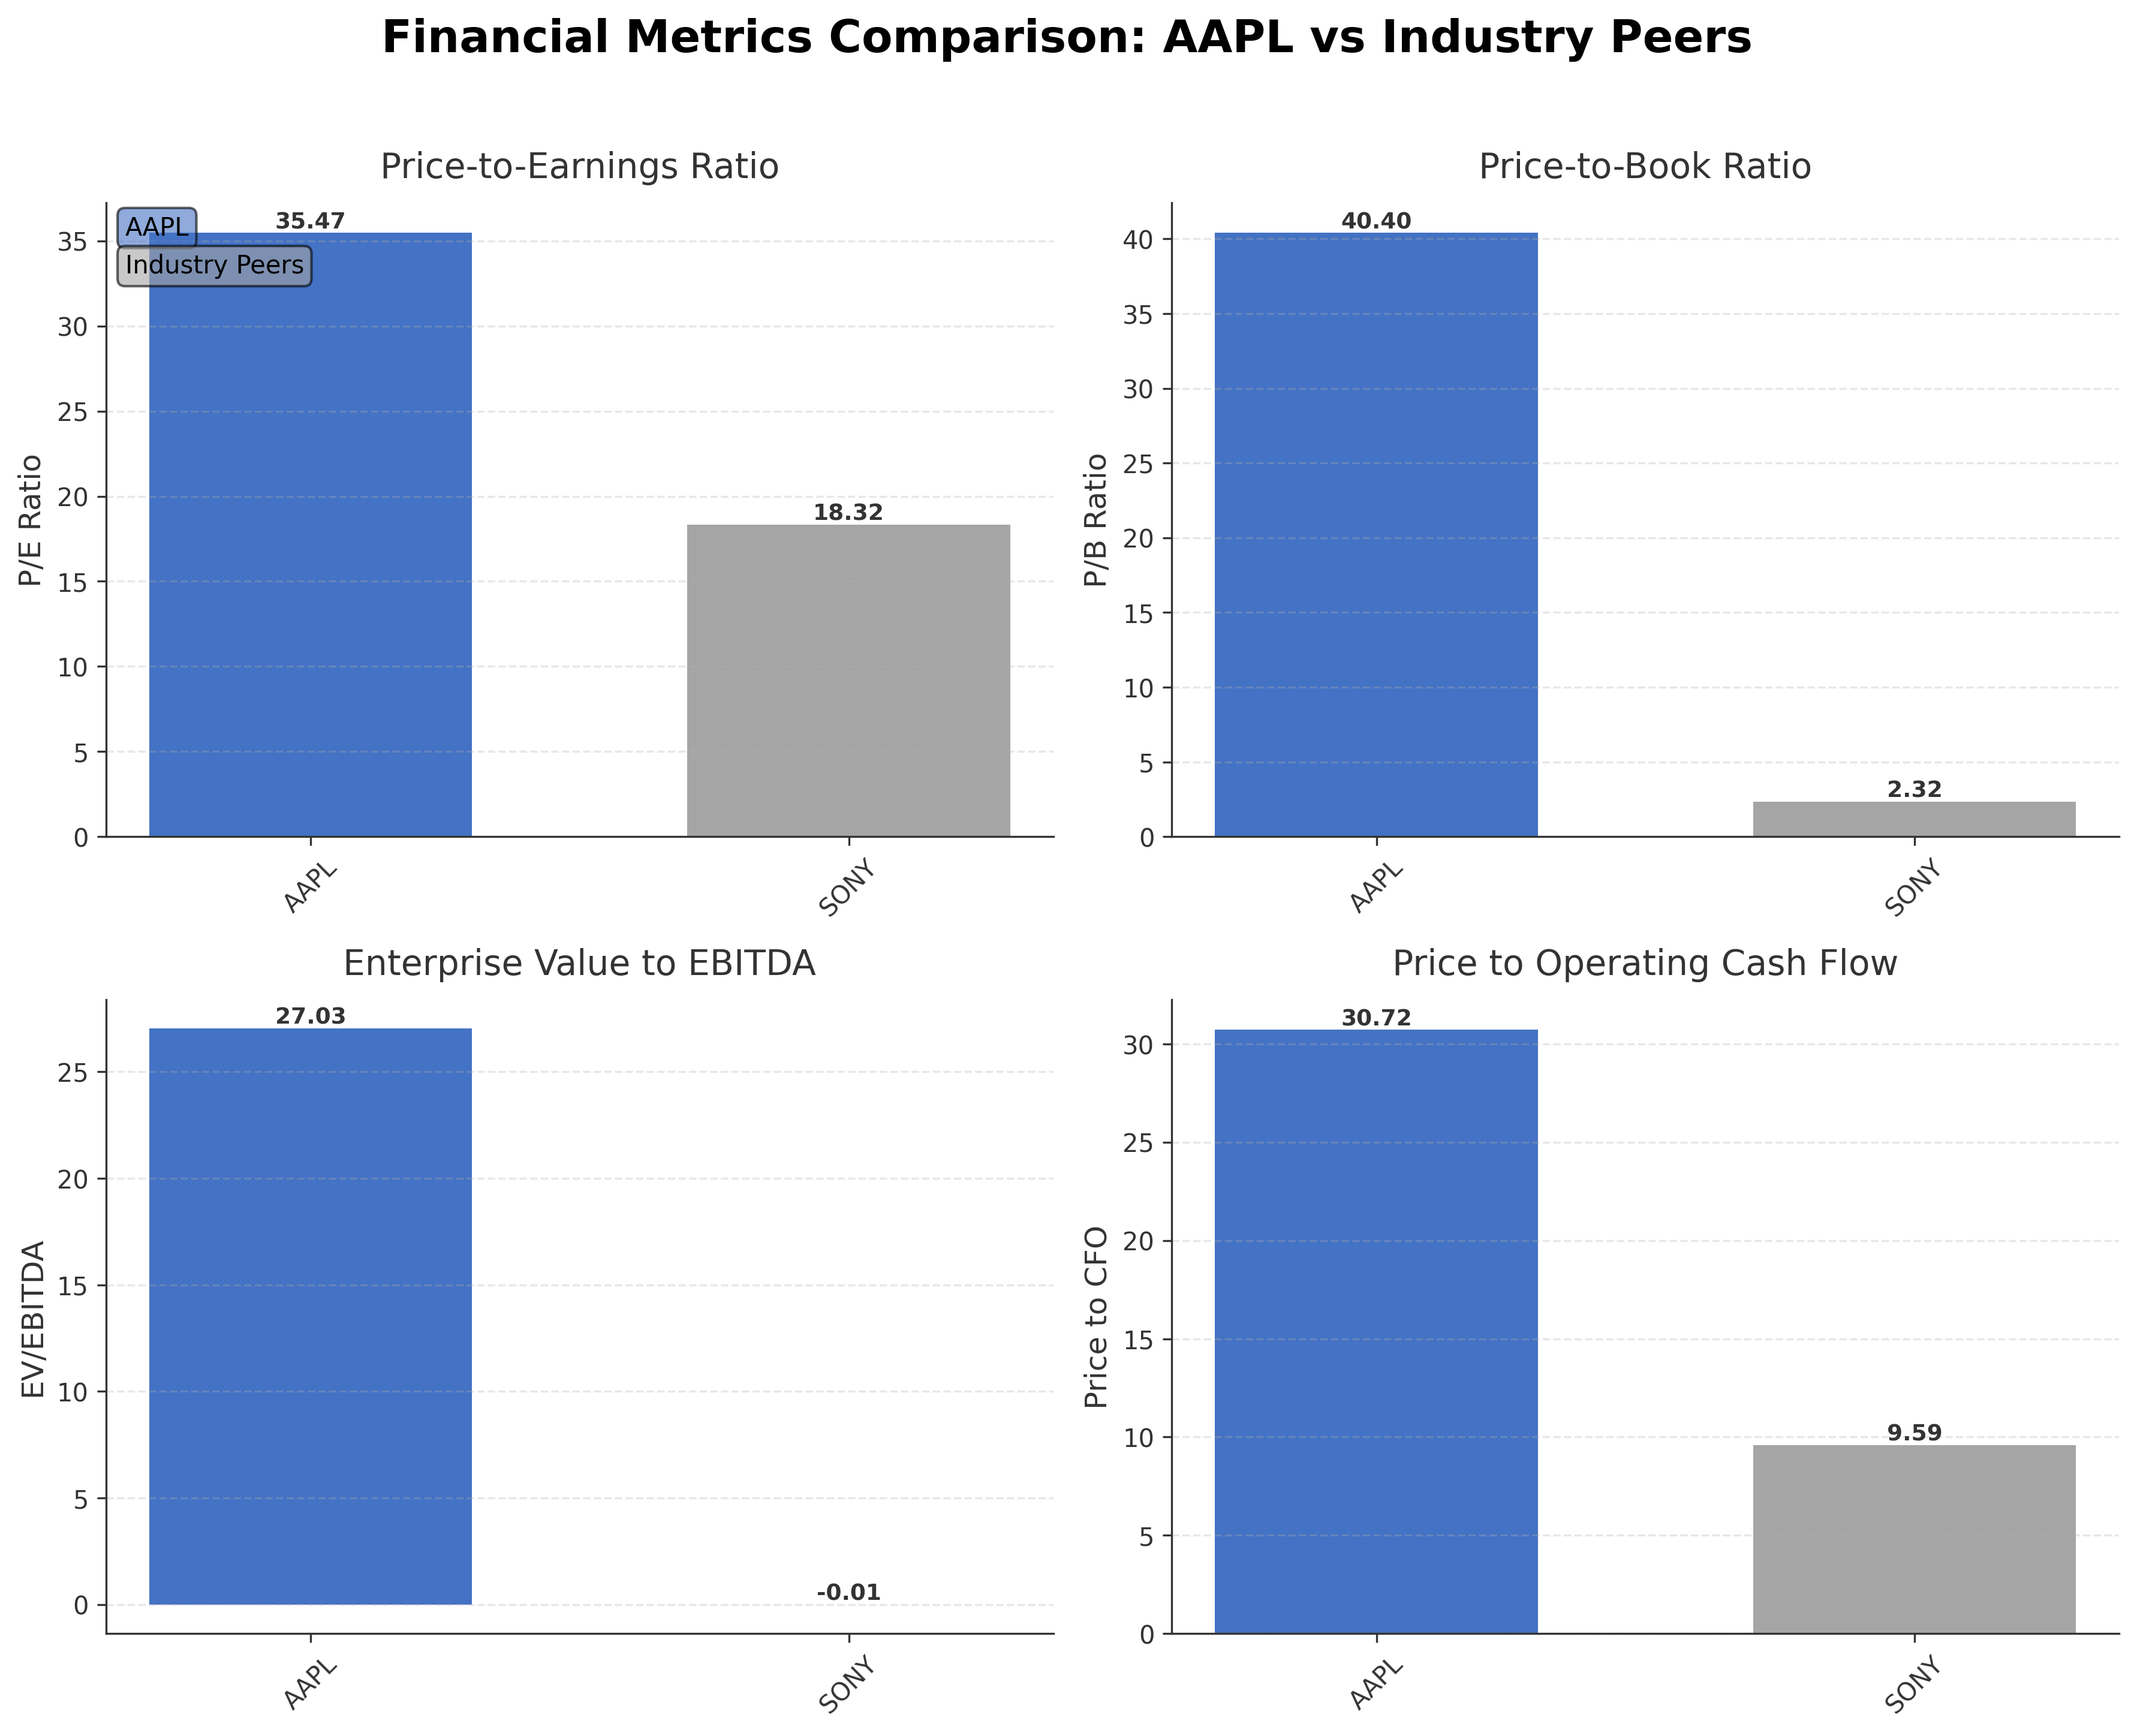
Comparison Analysis: Apple Inc. significantly outpaces its peer Sony Group Corporation in market capitalization, trading at $4.31 trillion versus Sony’s $119.04 billion. Apple's valuation multiples such as P/E at 35.47 and P/B at 40.40 are markedly higher than Sony’s 18.32 and 2.32 respectively, reflecting premium pricing driven by superior profitability and growth prospects. Apple’s EV/EBITDA ratio of 27.03 also exceeds Sony’s negative value, indicating stronger earnings before interest, taxes, depreciation, and amortization. The return on equity for Apple at 1.41% surpasses Sony’s 0.12%, underscoring more efficient capital use. Overall, Apple commands a dominant position with higher valuation and profitability metrics relative to its regional industry peer.
Financial Metrics Comparison with Peers
Financial Statements
Comprehensive financial data including income, balance sheet, and cash flow metrics
Income Statement
| fiscal_date | 2025-09-30 | 2024-09-30 | 2023-09-30 | 2022-09-30 | 2021-09-30 |
|---|---|---|---|---|---|
| Sales | 416.16B | 391.04B | 383.29B | 394.33B | 365.82B |
| Cost Of Goods | 220.96B | 210.35B | 214.14B | 223.55B | 212.98B |
| Gross Profit | 195.20B | 180.68B | 169.15B | 170.78B | 152.84B |
| Operating Expense Research And Development | 34.55B | 31.37B | 29.91B | 26.25B | 21.91B |
| Operating Expense Selling General And Administrative | 27.60B | 26.10B | 24.93B | 25.09B | 21.97B |
| Operating Income | 133.05B | 123.22B | 114.30B | 119.44B | 108.95B |
| Other Income Expense | -321.00M | 269.00M | -565.00M | -334.00M | 60.00M |
| Pretax Income | 132.73B | 123.48B | 113.74B | 119.10B | 109.21B |
| Income Tax | 20.72B | 29.75B | 16.74B | 19.30B | 14.53B |
| Net Income | 112.01B | 93.74B | 97.00B | 99.80B | 94.68B |
| Eps Basic | 7.49 | 6.11 | 6.16 | 6.15 | 5.67 |
| Eps Diluted | 7.46 | 6.08 | 6.13 | 6.11 | 5.61 |
| Basic Shares Outstanding | 14.95B | 15.34B | 15.74B | 16.22B | 16.70B |
| Diluted Shares Outstanding | 14.95B | 15.34B | 15.74B | 16.22B | 16.70B |
| Ebit | 133.05B | 123.22B | 114.30B | 119.44B | 111.85B |
| Ebitda | 144.75B | 134.66B | 125.82B | 130.54B | 123.14B |
| Net Income Continuous Operations | 112.01B | 93.74B | 97.00B | 99.80B | 94.68B |
| Non Operating Interest Income | N/A | N/A | 3.75B | 2.83B | 2.84B |
| Non Operating Interest Expense | N/A | N/A | 3.93B | 2.93B | 2.65B |
Source: Financial statements and regulatory filings
Balance Sheet
| fiscal_date | 2025-09-30 | 2024-09-30 | 2023-09-30 | 2022-09-30 | 2021-09-30 |
|---|---|---|---|---|---|
| Cash And Cash Equivalents | 35.93B | 29.94B | 29.96B | 23.65B | 34.94B |
| Accounts Receivable | 39.78B | 33.41B | 29.51B | 28.18B | 26.28B |
| Total Assets | 359.24B | 364.98B | 352.58B | 352.75B | 351.00B |
| Total Liabilities | 285.51B | 308.03B | 290.44B | 302.08B | 287.91B |
| Long Term Debt | 78.33B | 85.75B | 95.28B | 109.71B | 119.38B |
| Shareholders Equity | 73.73B | 56.95B | 62.15B | 50.67B | 63.09B |
Source: Financial statements and regulatory filings
Cash Flow Statement
| fiscal_date | 2025-09-30 | 2024-09-30 | 2023-09-30 | 2022-09-30 | 2021-09-30 |
|---|---|---|---|---|---|
| Operating Activities Net Income | 112.01B | 93.74B | 97.00B | 99.80B | 94.68B |
| Operating Activities Depreciation | 11.70B | 11.45B | 11.52B | 11.10B | 11.28B |
| Operating Activities Stock Based Compensation | 12.86B | 11.69B | 10.83B | 9.04B | 7.91B |
| Operating Activities Other Non Cash Items | -89.00M | -2.27B | -2.23B | 1.01B | -4.92B |
| Operating Activities Accounts Receivable | -7.03B | -5.14B | -417.00M | -9.34B | -14.03B |
| Operating Activities Accounts Payable | 902.00M | 6.02B | -1.89B | 9.45B | 12.33B |
| Operating Activities Other Assets Liabilities | -18.87B | 2.77B | -4.27B | 1.57B | -1.53B |
| Operating Activities Operating Cash Flow | 111.48B | 118.25B | 110.54B | 123.52B | 100.94B |
| Investing Activities Capital Expenditures | -12.71B | -9.45B | -10.96B | -10.71B | -11.09B |
| Investing Activities Purchase Of Investments | -24.41B | -48.66B | -29.51B | -76.92B | -109.56B |
| Investing Activities Sale Of Investments | 53.80B | 62.35B | 45.51B | 67.36B | 106.48B |
| Investing Activities Other Investing Activity | -1.48B | -1.31B | -1.34B | -2.09B | -385.00M |
| Investing Activities Investing Cash Flow | 15.20B | 2.94B | 3.71B | -22.66B | -14.58B |
| Financing Activities Long Term Debt Issuance | 4.48B | 0.00 | 5.23B | 5.46B | 20.39B |
| Financing Activities Long Term Debt Payments | -10.93B | -9.96B | -11.15B | -9.54B | -8.75B |
| Financing Activities Short Term Debt Issuance | -2.03B | 3.96B | -3.98B | 3.96B | 1.02B |
| Financing Activities Common Stock Repurchase | -90.71B | -94.95B | -77.55B | -89.40B | -85.97B |
| Financing Activities Common Dividends | -15.42B | -15.23B | -15.03B | -14.84B | -14.47B |
| Financing Activities Other Financing Charges | -6.07B | -5.80B | -6.01B | -6.38B | -5.58B |
| Financing Activities Financing Cash Flow | -120.69B | -121.98B | -108.49B | -110.75B | -92.25B |
| End Cash Position | 35.93B | 29.94B | 30.74B | 24.98B | 35.93B |
| Income Tax Paid | 43.37B | 26.10B | 18.68B | 19.57B | 25.39B |
| Free Cash Flow | 98.77B | 108.81B | 99.58B | 111.44B | 92.95B |
| Interest Paid | N/A | N/A | 3.80B | 2.87B | 2.69B |
| Operating Activities Deferred Taxes | N/A | N/A | N/A | 895.00M | -4.77B |
| Investing Activities Net Acquisitions | N/A | N/A | N/A | -306.00M | -33.00M |
| Financing Activities Common Stock Issuance | N/A | N/A | N/A | N/A | 1.10B |
Source: Financial statements and regulatory filings
Technical Analysis
Key Insights
- Apple’s stock is currently in a strong uptrend, exhibiting consistent higher highs and higher lows in recent price action.
- Key support levels are identified near $260 and $270, while resistance is observed around the recent high near $295.
- The stock price is trading above its 10-day, 50-day, and 200-day moving averages, indicating bullish momentum across short, medium, and long-term timeframes.
- Momentum indicators show the Relative Strength Index (RSI) near 70, suggesting the stock is approaching overbought conditions; MACD remains positive with a bullish crossover, and Stochastic oscillators confirm upward momentum.
- Multi-timeframe analysis reveals daily and weekly charts support the upward trend, while monthly charts indicate sustained long-term strength.
- Potential market scenarios include continuation of the uptrend if support holds, or a consolidation phase if the stock encounters resistance near $295, with volatility likely influenced by upcoming earnings and legal developments.
Trending News
1. Headline: Apple stock keeps surging to new highs — it’s more than just the iPhone
Summary: Apple stock continues to hit new record highs, extending this year’s impressive rebound. Evercore ISI sees the momentum continuing for some time, and it’s about more than just iPhone sales. Analyst Amit Daryanani raised his price target for Apple to $365 from $330 on Thursday, implying roughly 22% upside from today. ... Daryanani’s increased ...
Sentiment: positive
2. Headline: AAPL Stock Slips From Record Highs As Legal Action Threatens OpenAI Alliance: Report
Summary: Apple (AAPL) stock eased on Thursday, dropping marginally from its record highs after media reports suggested OpenAI is considering suing the iPhone maker over the way ChatGPT was integrated with Apple’s mobile ecosystem. OpenAI lawyers are actively working with an outside legal firm on a range of options that could be formally executed in the near future and that could include ...
Sentiment: negative
3. Headline: Why MP Materials Stock Is Sinking Despite Apple Deal - TipRanks.com
Summary: MP Materials ( ($MP) ) is experiencing volatility. Read on for a possible explanation for the stock’s unusual movement. MP Materials shares are sliding as traders s...
Sentiment: negative
4. Headline: Apple Stock Forecast: Wedbush Raises Apple Target to $400 on AI Push | AAPL - TheStreet
Summary: Apple stock bull makes towering new call on AI potential
Sentiment: positive
5. Headline: Apple stock notches fresh record as tech rebounds
Summary: Wednesday’s market action comes as Apple CEO Tim Cook travels to China with President Trump’s delegation for a summit with Chinese leader Xi Jinping. Nasdaq 100 year-to-date chart. Ines Ferre is a senior business reporter for Yahoo Finance. Follow her on X at @ines_ferre. Click here for in-depth analysis of the latest stock market news and events moving stock prices · Read the latest financial and business news from Yahoo Finance ... CBRS Cerebras Systems Inc...
Sentiment: positive
Recent Updates
News Summary
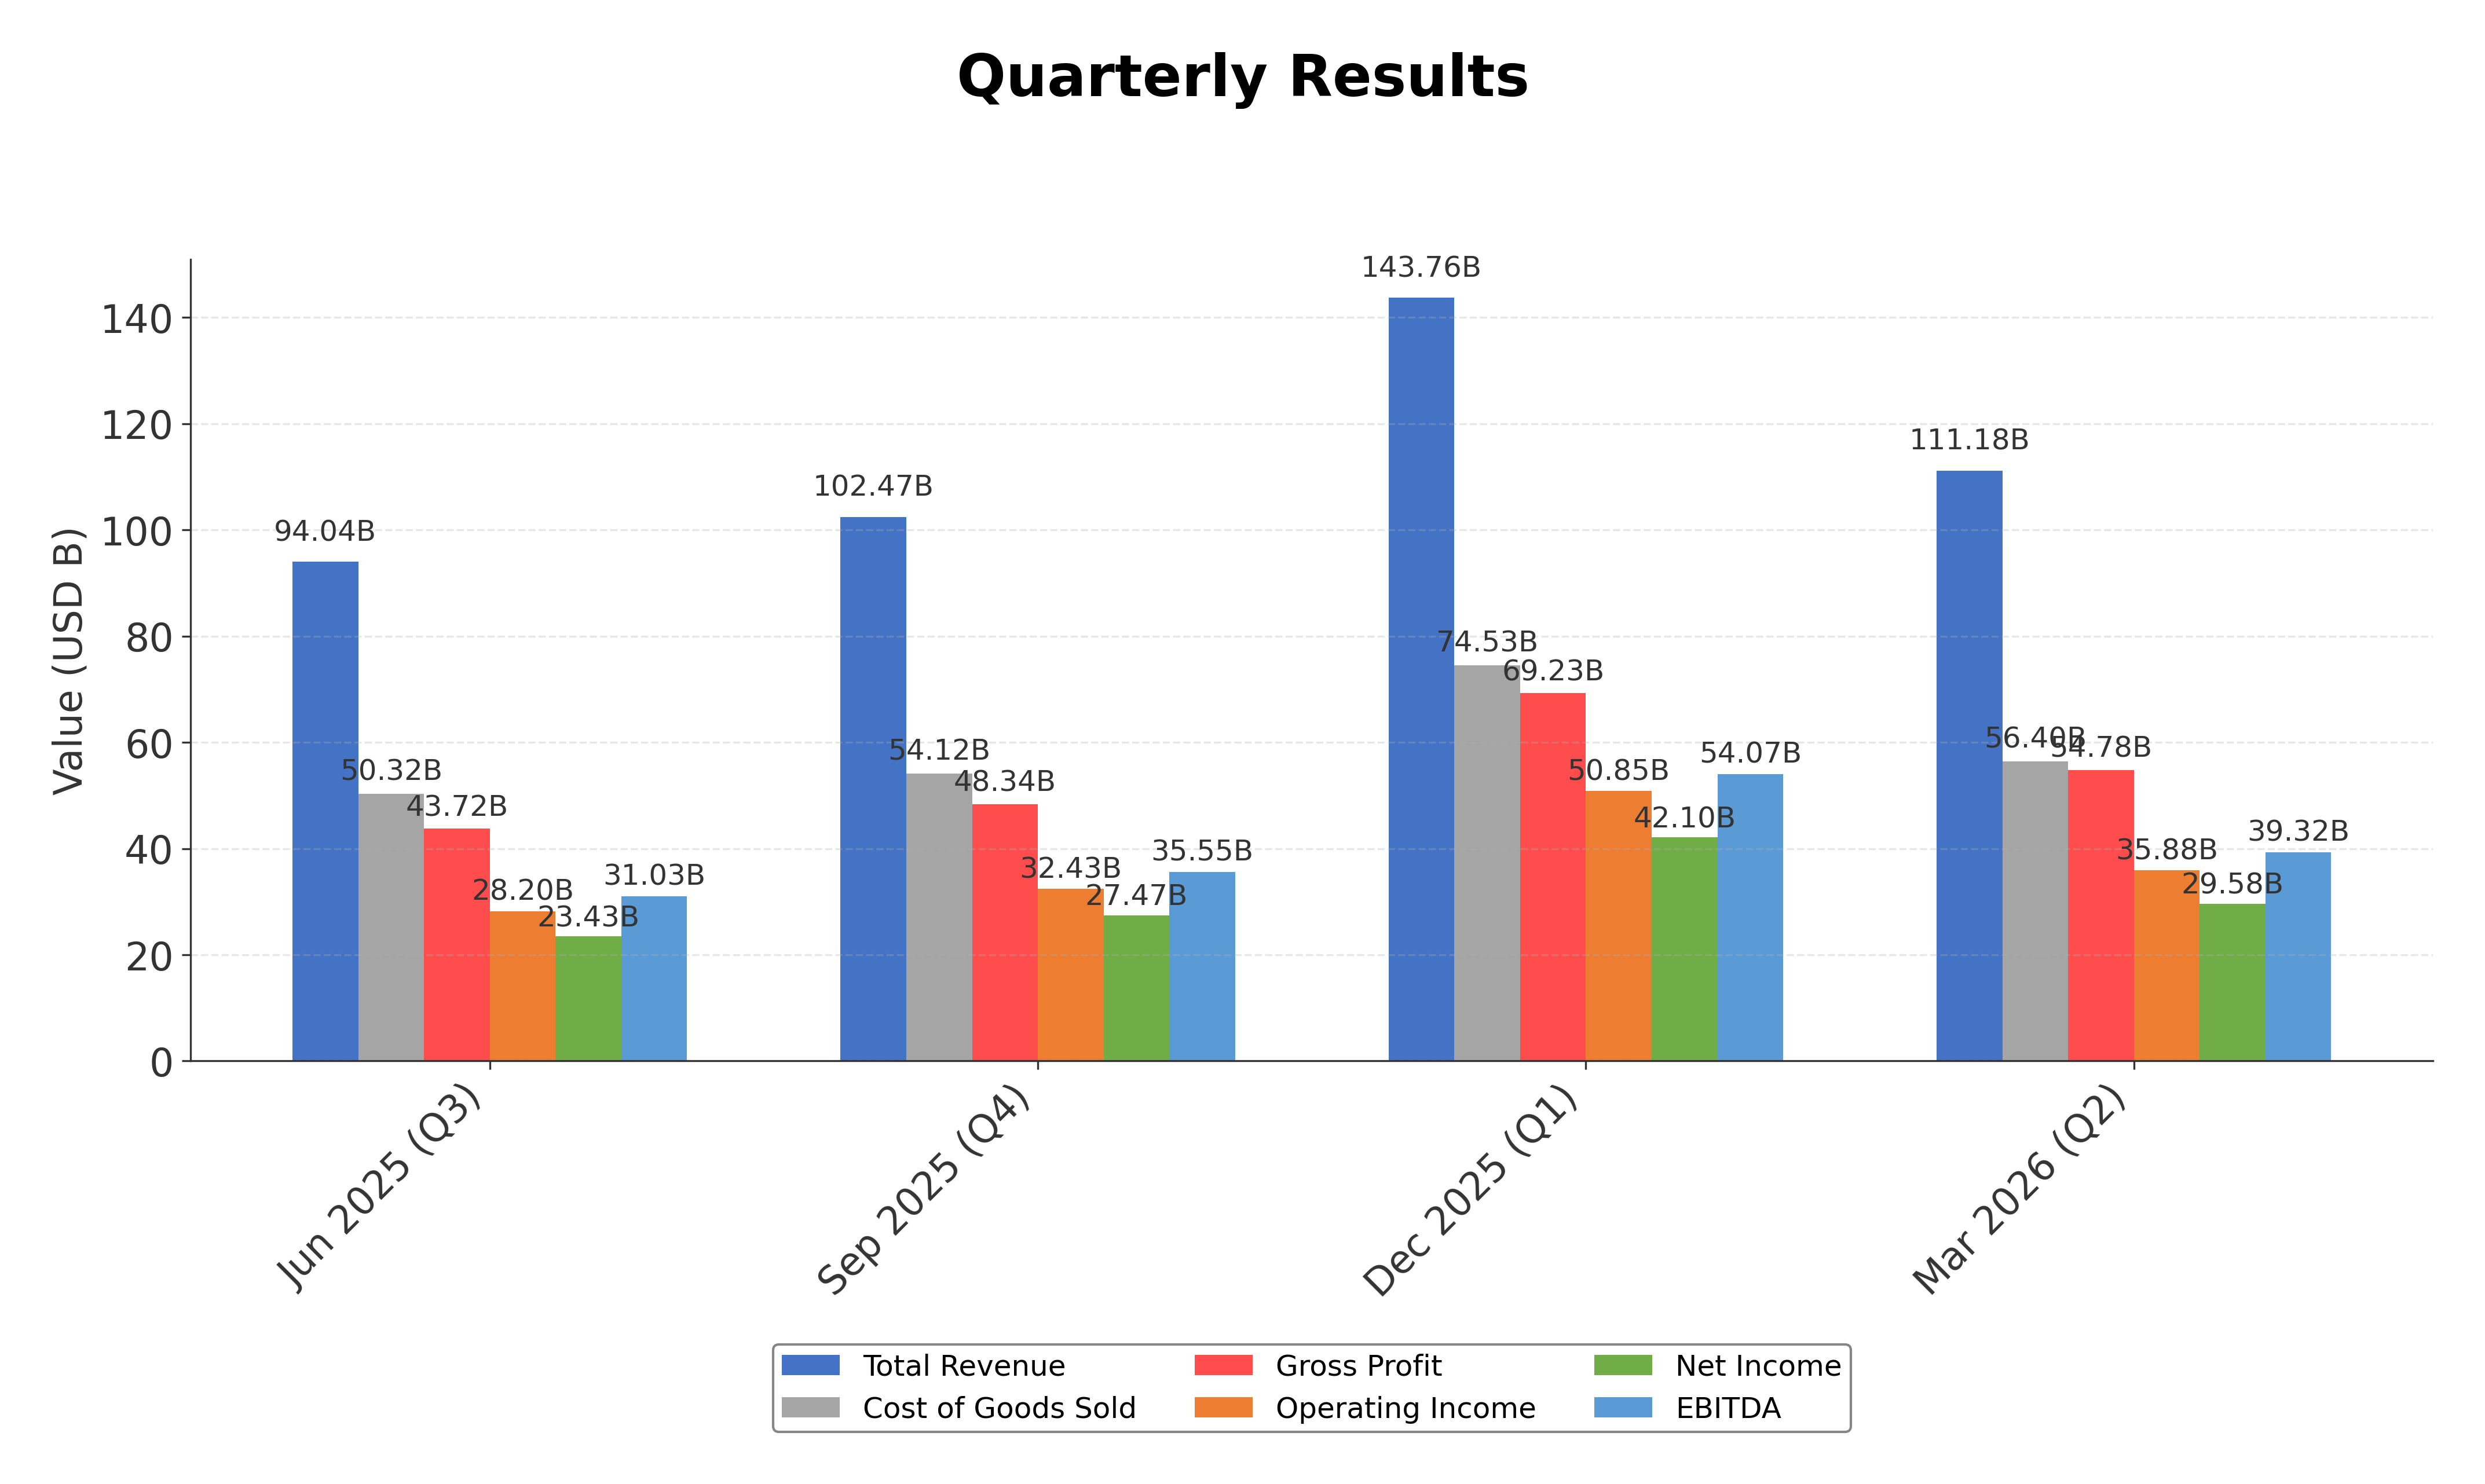
As of April 30, 2026. Apple reported its fiscal second quarter results with record revenue of $111.2 billion, marking a 17% year-over-year increase, driven by strong iPhone 17 lineup demand and all-time high Services revenue. Diluted EPS rose 22% to $2.01, supported by robust gross and operating margins. The company announced a 4% dividend increase to $0.27 per share and authorized a $100 billion share repurchase program. Leadership transition plans were disclosed with Tim Cook moving to Executive Chairman and John Ternus assuming the CEO role. Outlook guidance anticipates continued revenue growth of 14%-17% for the June quarter despite supply constraints and rising costs.
News Sentiment
The overall sentiment from recent updates is predominantly positive, reflecting strong financial performance with record revenues and earnings growth. The dividend increase and significant share repurchase authorization reinforce shareholder returns. Leadership changes are presented as orderly and strategic, while guidance acknowledges challenges such as supply chain issues but maintains growth expectations. No material negative developments were reported, supporting a constructive tone toward the company’s near-term prospects.
Source List
Analytical Overview
Analysis Summary
Apple’s valuation metrics, including a trailing P/E of 35.47 and forward P/E of 30.68, are elevated relative to the consumer electronics industry average P/E of 35.47, reflecting premium pricing supported by growth and profitability. The company’s revenue growth of 16.6% year-over-year and strong operating cash flow trends demonstrate a solid growth trajectory. Financial health is robust, with operating cash flow of $140.2 billion and a manageable debt-to-equity ratio of 79.5%, indicating efficient capital structure and liquidity. Sector-specific opportunities include expansion in services and AI integration, while challenges encompass supply chain constraints and regulatory scrutiny. Market positioning and competitive advantages are strong, underpinned by brand loyalty, innovation, and ecosystem integration.
Overall Business and Market Assessment
Supporting Factors: Key supporting factors include record revenue and earnings growth, substantial free cash flow generation, and a diversified product and services portfolio. Risks to monitor involve regulatory and legal developments, competitive pressures, and component cost inflation. The appropriate investment timeframe is medium to long-term, considering the company’s innovation pipeline and market leadership. Overall, Apple presents a stable profile with growth potential balanced by valuation and external uncertainties.
Risk Factors: No data
SWOT Analysis
Strengths
- Market leadership with a diversified product and services ecosystem.
- Strong profitability with high gross and operating margins.
- Robust cash flow generation supporting shareholder returns.
- Extensive global brand recognition and customer loyalty.
Weaknesses
- High valuation multiples relative to industry peers.
- Dependence on iPhone sales for a significant portion of revenue.
- Supply chain vulnerabilities impacting product availability.
- Limited dividend yield compared to some competitors.
Opportunities
- Expansion of services and subscription-based revenue streams.
- Innovation in artificial intelligence and new product launches.
- Growth in emerging markets and increased device penetration.
- Strategic share repurchase programs enhancing shareholder value.
Threats
- Regulatory and legal challenges including potential litigation.
- Intense competition in consumer electronics and software sectors.
- Rising component costs and supply chain disruptions.
- Geopolitical tensions affecting global operations and sales.
Company Description
Apple Inc. is a leading technology company renowned for designing, manufacturing, and marketing innovative hardware and software products for consumers and businesses worldwide. Its flagship product, the iPhone, accounts for the majority of sales, serving as the central hub of an expansive ecosystem that includes Mac computers, iPad tablets, Apple Watch wearables, and accessories like AirPods. Apple Inc. also offers a suite of services such as the App Store, Apple Music, iCloud, Apple TV+, and Apple Fitness+, providing digital content, cloud storage, and subscription-based platforms. Operating in the consumer electronics industry within the technology sector, the company employs approximately 166,000 people and maintains a broad global presence through online stores, retail outlets, and partnerships with carriers and resellers. With a substantial market capitalization reflecting its scale, Apple Inc. plays a pivotal role in shaping consumer technology trends, emphasizing seamless integration across devices and services to enhance user experience and productivity.