
Apple Inc (AAPL)
Stock Analysis Report
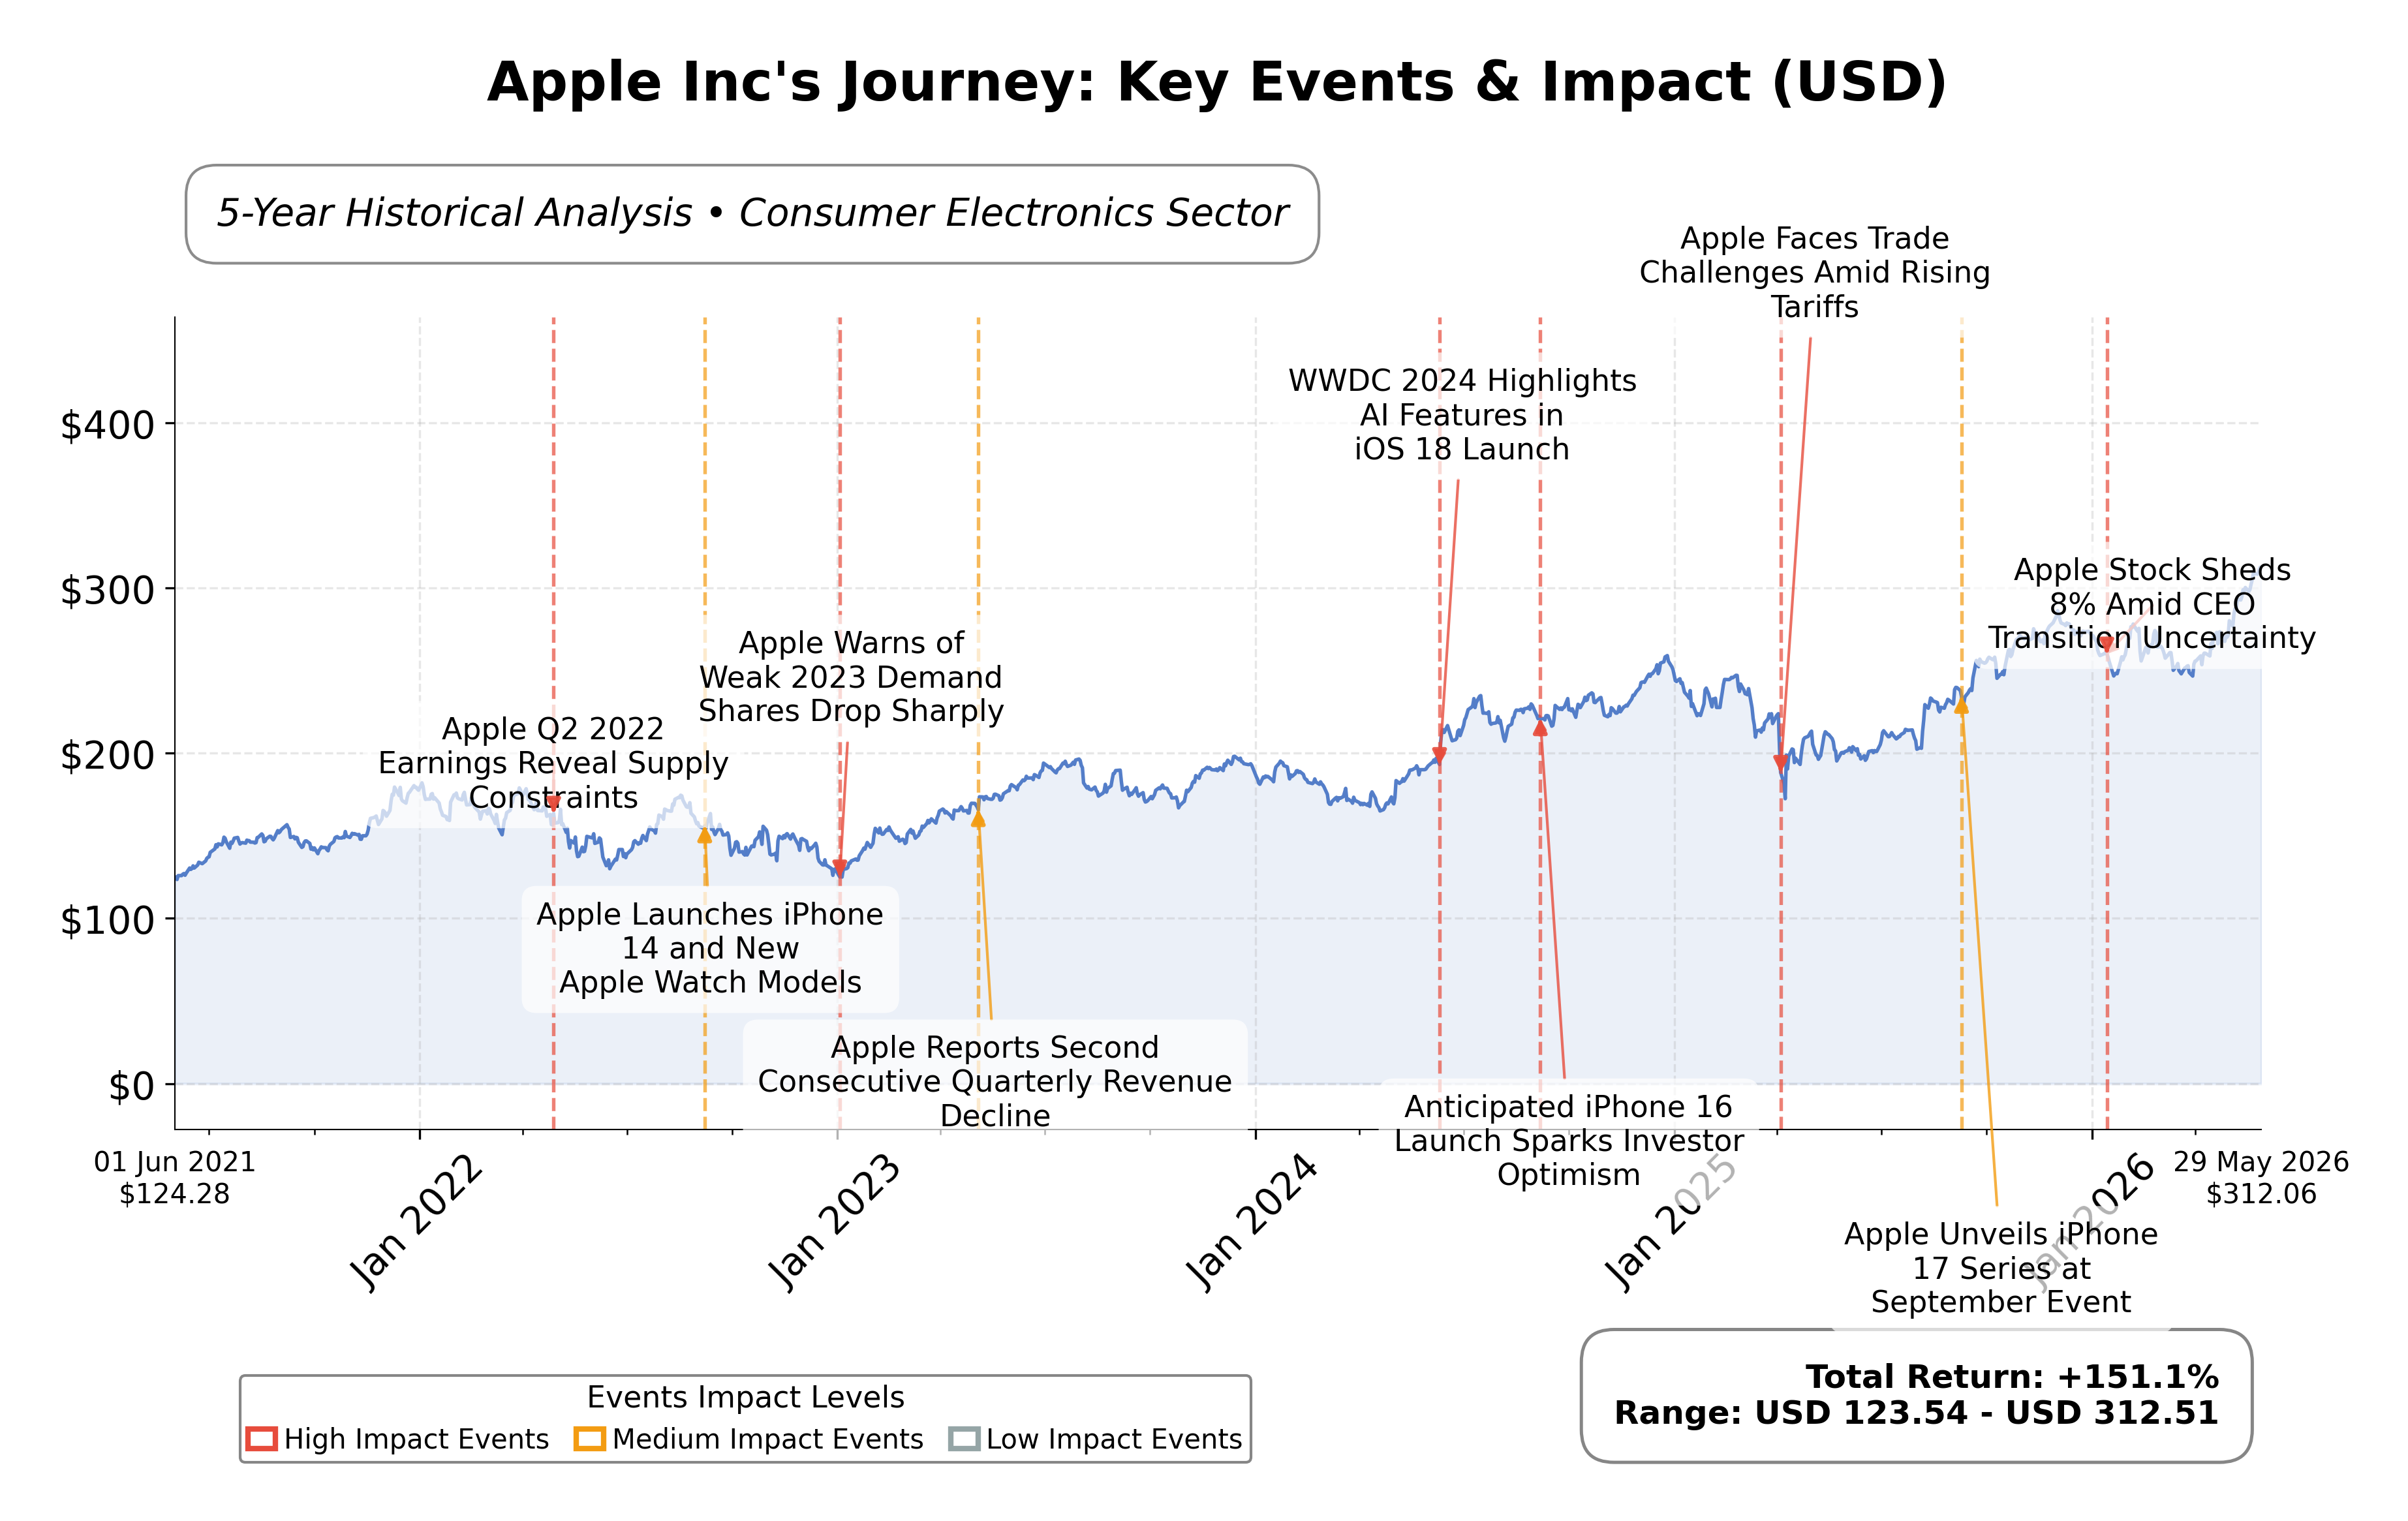
Stock Journey
Key Positives and Key Risks
Pros
- Market capitalization of $4.58 trillion reflects dominant industry position and investor confidence.
- Strong revenue growth of 16.6% year-over-year and operating cash flow of $140.2 billion demonstrate robust financial performance.
- High return on equity at 141.5% indicates exceptional profitability and efficient capital use.
Cons
- Elevated valuation multiples with a P/E ratio of 37.58 and price-to-book of 42.81 suggest limited margin of safety.
- Current ratio of 1.07 points to modest short-term liquidity, which may constrain flexibility in volatile conditions.
- Debt-to-equity ratio of 79.5% is relatively high, indicating increased leverage compared to some industry peers.
Disclosure: This information is for general awareness and does not constitute investment advice
Report Summary
Apple Inc. is a leading technology company listed on the NASDAQ exchange, operating primarily within the Consumer Electronics sector. The company designs, manufactures, and markets a broad range of products including iPhones, Macs, iPads, wearables, and accessories, alongside service platforms such as the App Store and Apple Music. Its market positioning is strong, supported by a global footprint and a diversified product ecosystem that integrates hardware, software, and services. Apple serves individual consumers, businesses, and government sectors worldwide, maintaining a dominant presence in the technology industry.
Financially, Apple reported trailing twelve months (TTM) revenue of approximately $451.4 billion with a gross margin of 49.3%, operating margin of 32.3%, and net profit margin of 27.2%. The company’s return on equity (ROE) stands at 141.5%, reflecting exceptional profitability and efficient capital utilization, while return on assets (ROA) is 26.2%, indicating strong asset productivity. Operating cash flow reached $140.2 billion TTM, with free cash flow of $101.1 billion, underscoring robust cash generation capabilities. These metrics collectively demonstrate Apple’s high profitability and operational efficiency.
Valuation metrics show Apple’s market capitalization at approximately $4.58 trillion, with a trailing P/E ratio of 37.58 and a forward P/E of 32.35, suggesting premium pricing relative to earnings expectations. The price-to-book ratio is elevated at 42.81, and the enterprise value to EBITDA ratio is 28.64, indicating the stock trades at a significant premium compared to book value and earnings. The 52-week price range spans from $195.07 to $315, with the current price near the upper end at $312.07, reflecting strong recent price appreciation but also a modest premium relative to fair value estimates.
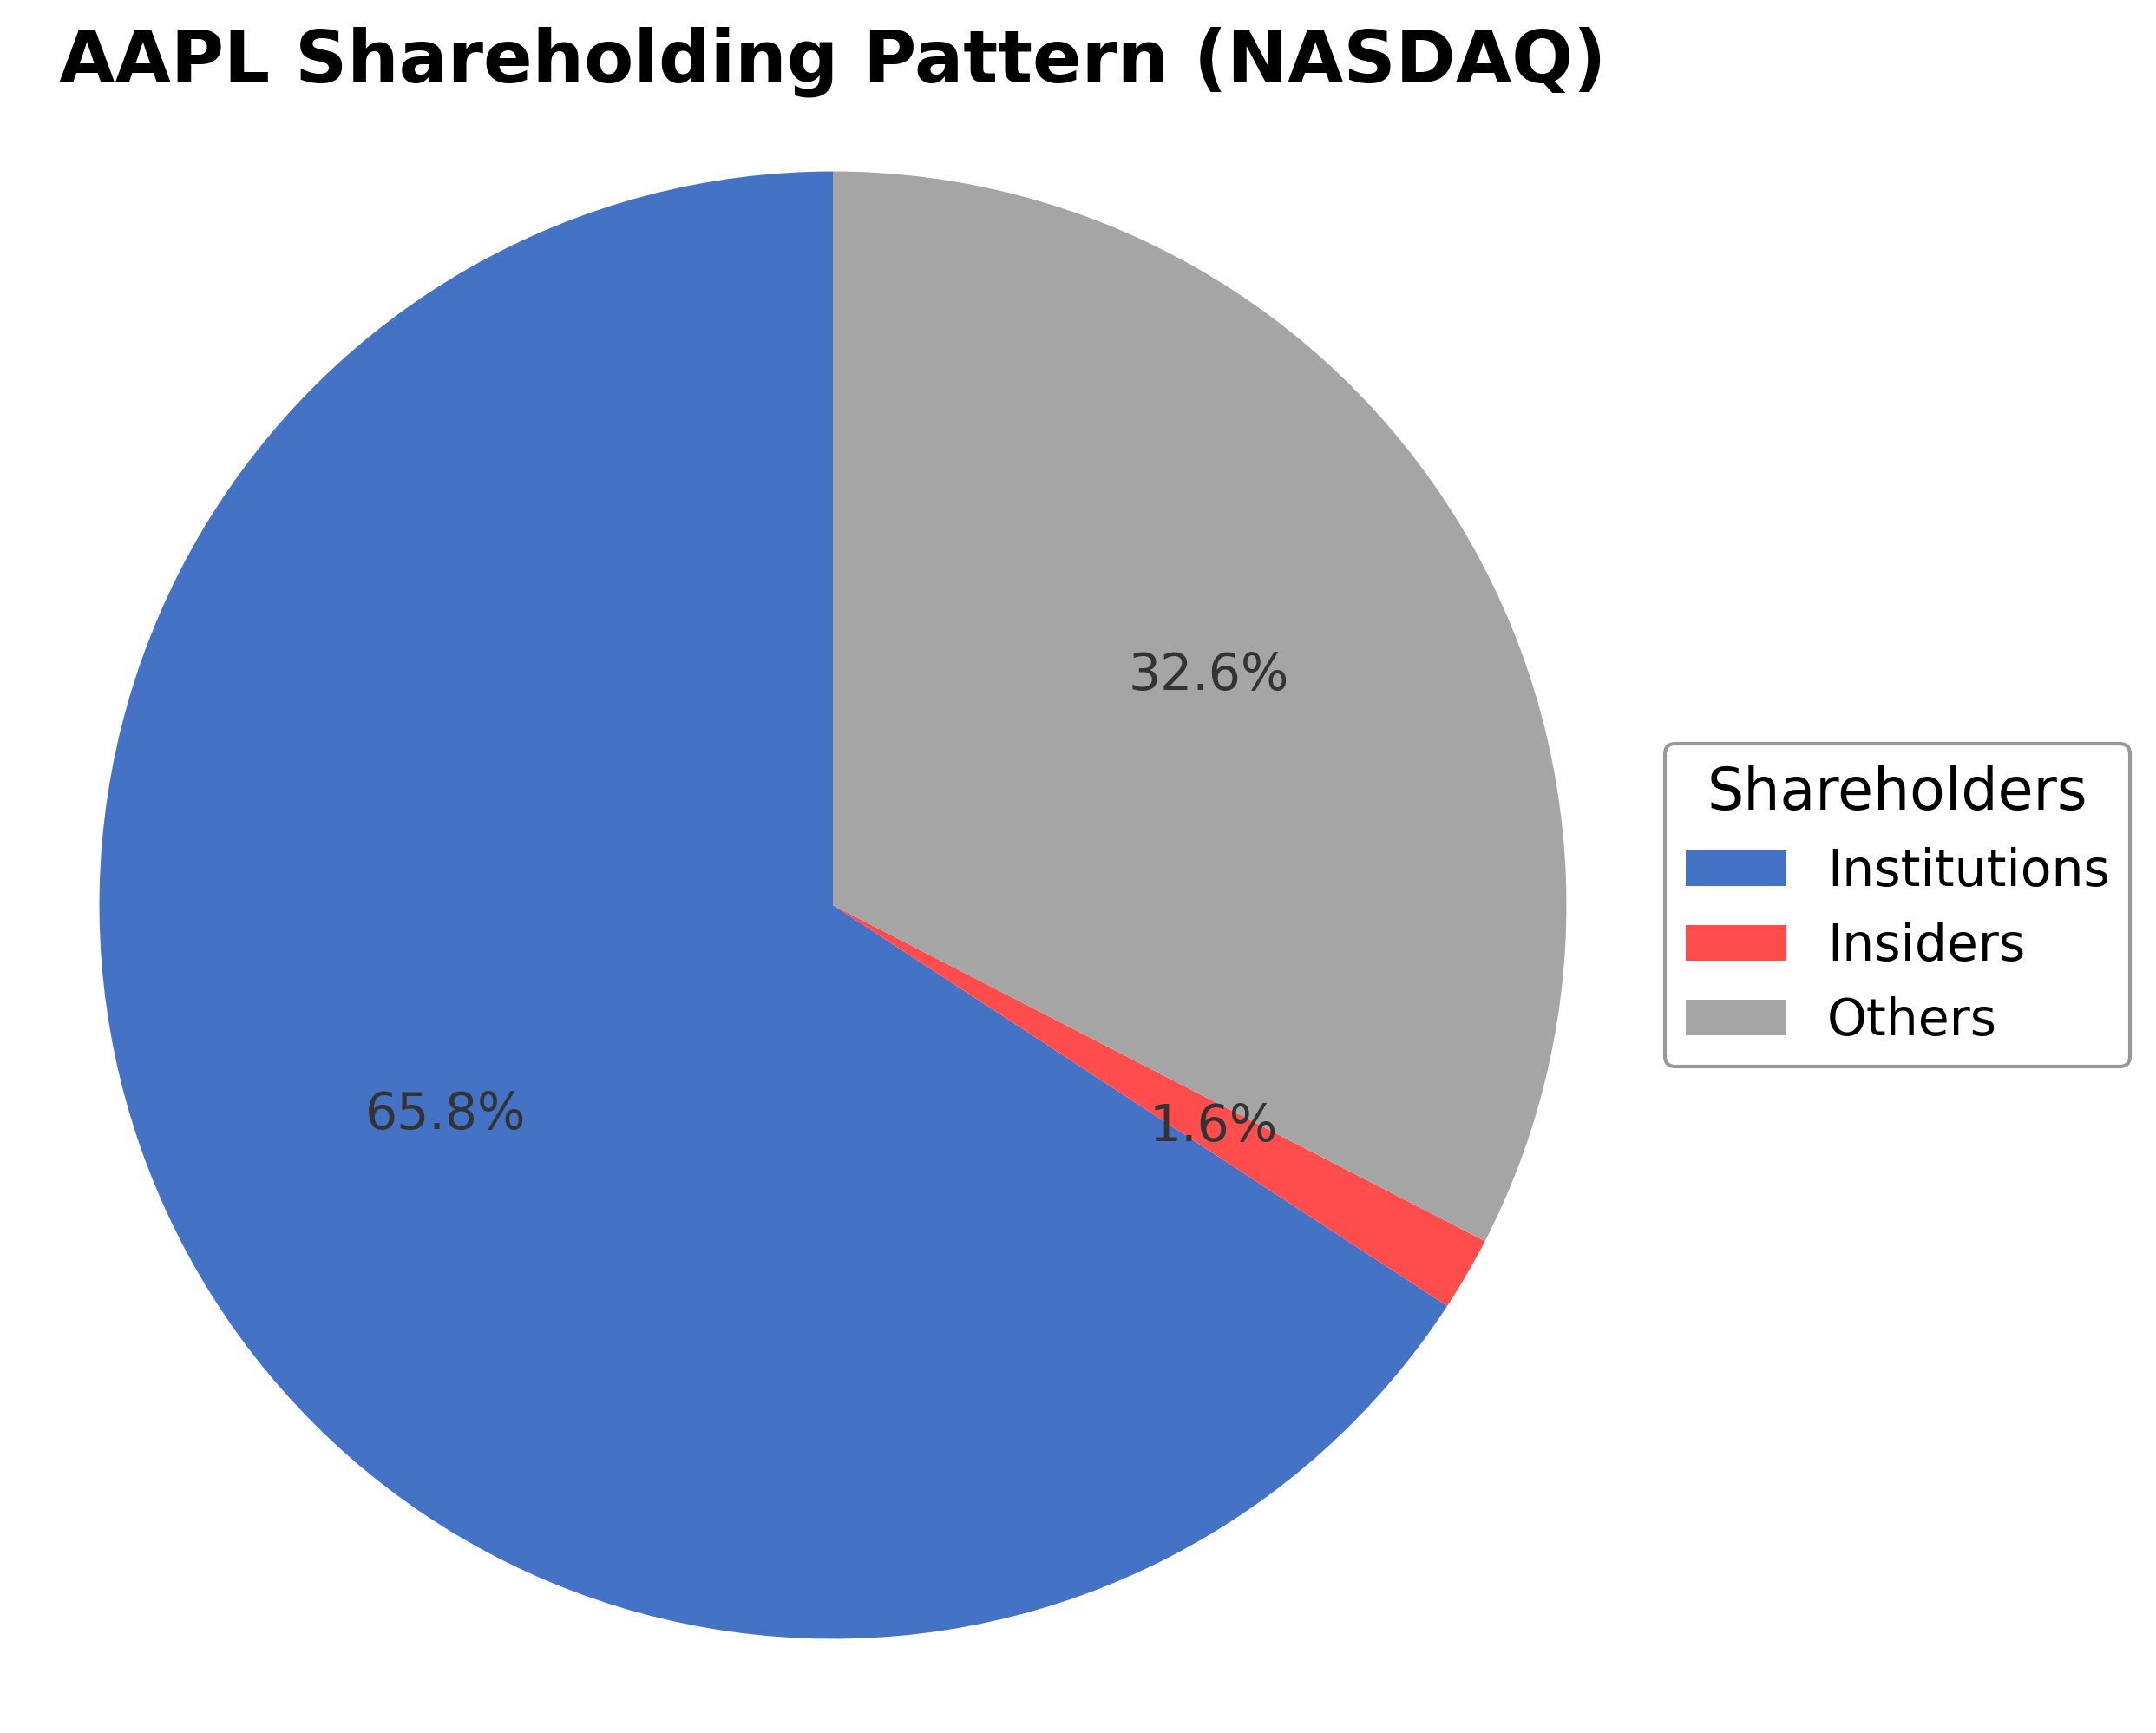
Apple’s strengths include a diversified product portfolio, strong cash flow generation, a healthy balance sheet with a current ratio of 1.07, and a low short interest of 0.95%. Key risks involve competitive pressures in the technology sector, supply chain constraints, and regulatory challenges. Recent strategic developments include a leadership transition with Tim Cook moving to Executive Chairman and John Ternus assuming the CEO role, alongside ongoing product innovation such as the launch of the iPhone 17 lineup and new MacBook models. Institutional investors hold a significant 65.8% stake, reflecting broad market confidence.
Technically, Apple’s stock exhibits an uptrend with the price above its 50-day and 200-day moving averages, supported by momentum indicators signaling strength across multiple timeframes. Recent news highlights institutional accumulation and positive earnings surprises, although valuation premiums suggest cautious monitoring. Overall, the data indicates a mature market position with conditions that may favor continued observation of price and fundamental developments.
Company and Industry Overview
Company Basics
Price Performance
Company Size
Shareholding Pattern
Sector and Industry Analysis
The technology sector, particularly the consumer electronics and software markets, continues to exhibit robust growth driven by increasing digital adoption worldwide. Market size is expanding as demand for smartphones, personal computing devices, and cloud services grows, with key players including Apple, Samsung, Microsoft, and Google dominating the landscape. Innovation cycles and consumer preferences heavily influence market dynamics, contributing to sustained sector expansion.
Within the consumer electronics industry, trends such as integration of artificial intelligence, enhanced connectivity through 5G, and emphasis on ecosystem lock-in are reshaping competitive dynamics. Barriers to entry remain high due to significant capital requirements, technological expertise, and established brand loyalty. Companies like Apple leverage their strong brand, proprietary hardware-software integration, and extensive service offerings to maintain competitive advantage amid intensifying rivalry.
Regulatory scrutiny is increasing globally, focusing on data privacy, antitrust concerns, and cybersecurity standards, which impact operational and strategic decisions for technology firms. Compliance with regulations such as GDPR in Europe and evolving U.S. data protection laws requires ongoing investment in legal and technical frameworks. The regulatory environment is expected to remain stringent, influencing innovation approaches and market conduct within the sector.
Note: Analysis synthesized from industry research, market reports, and regulatory filings. Information is subject to change based on market conditions.
Financial Ratios Dashboard
Illustrative Scenario Analysis
DCF Assumptions:
Method: Two-Stage EPS-Priority Model
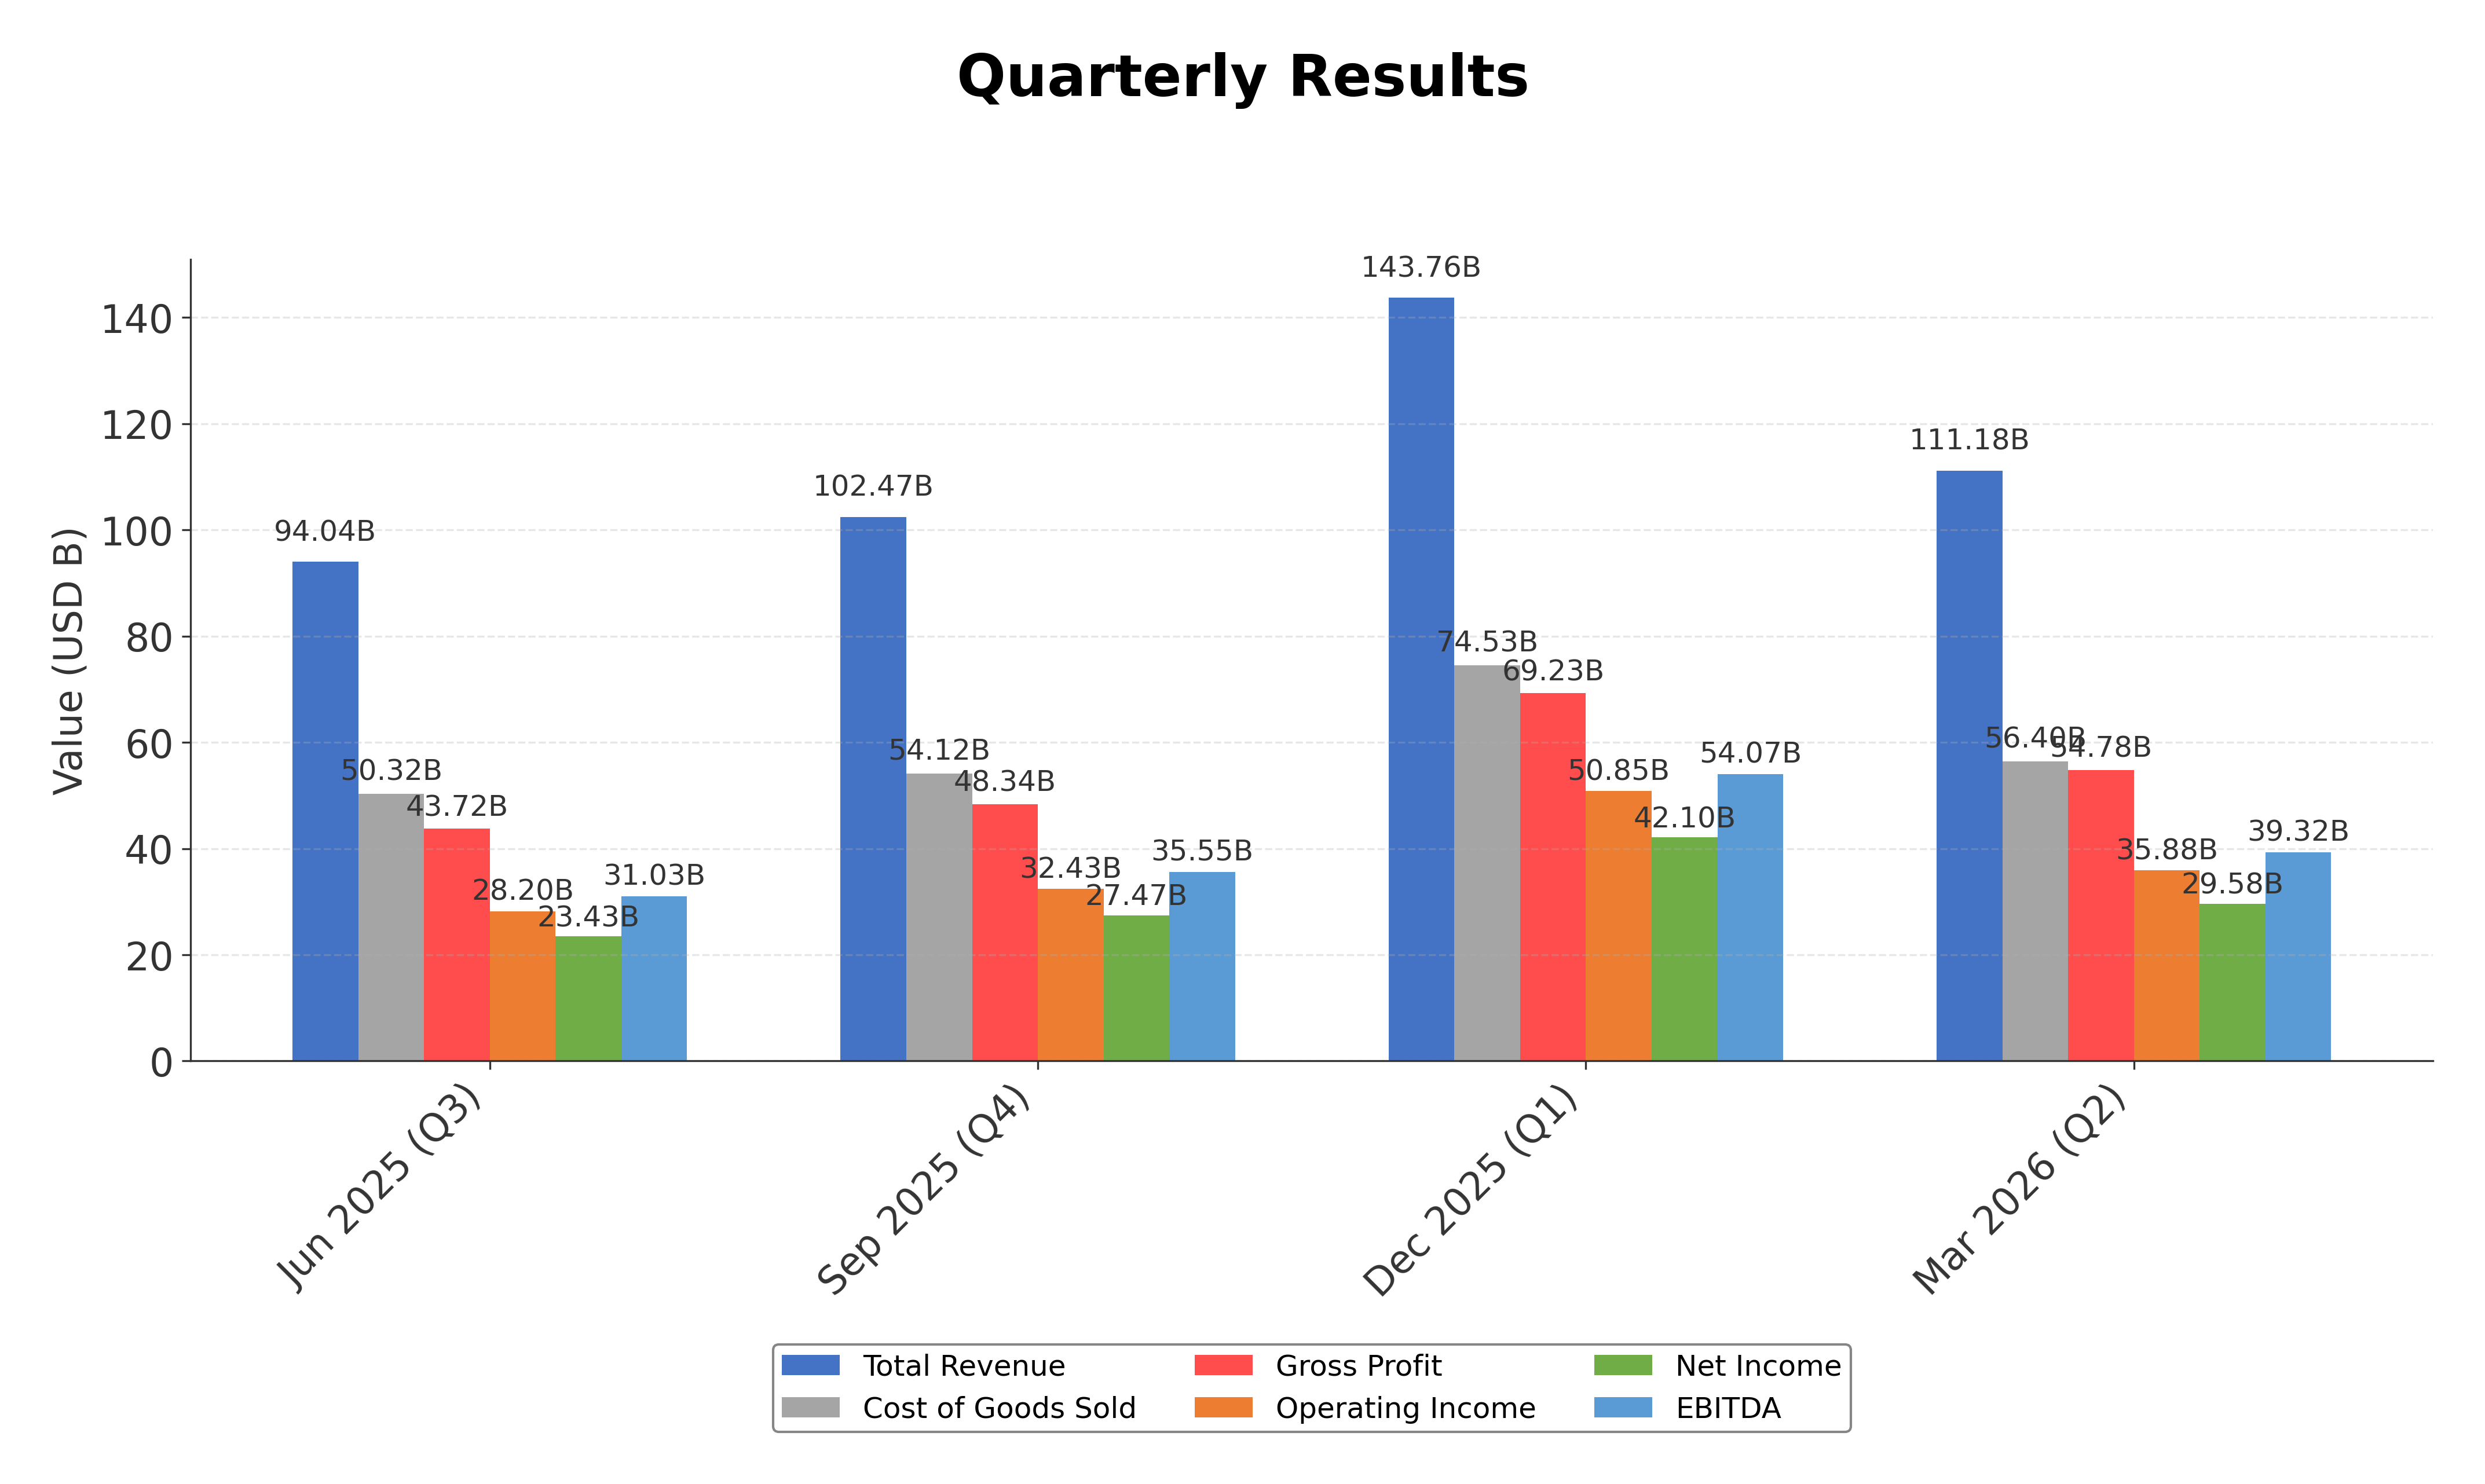
Financials
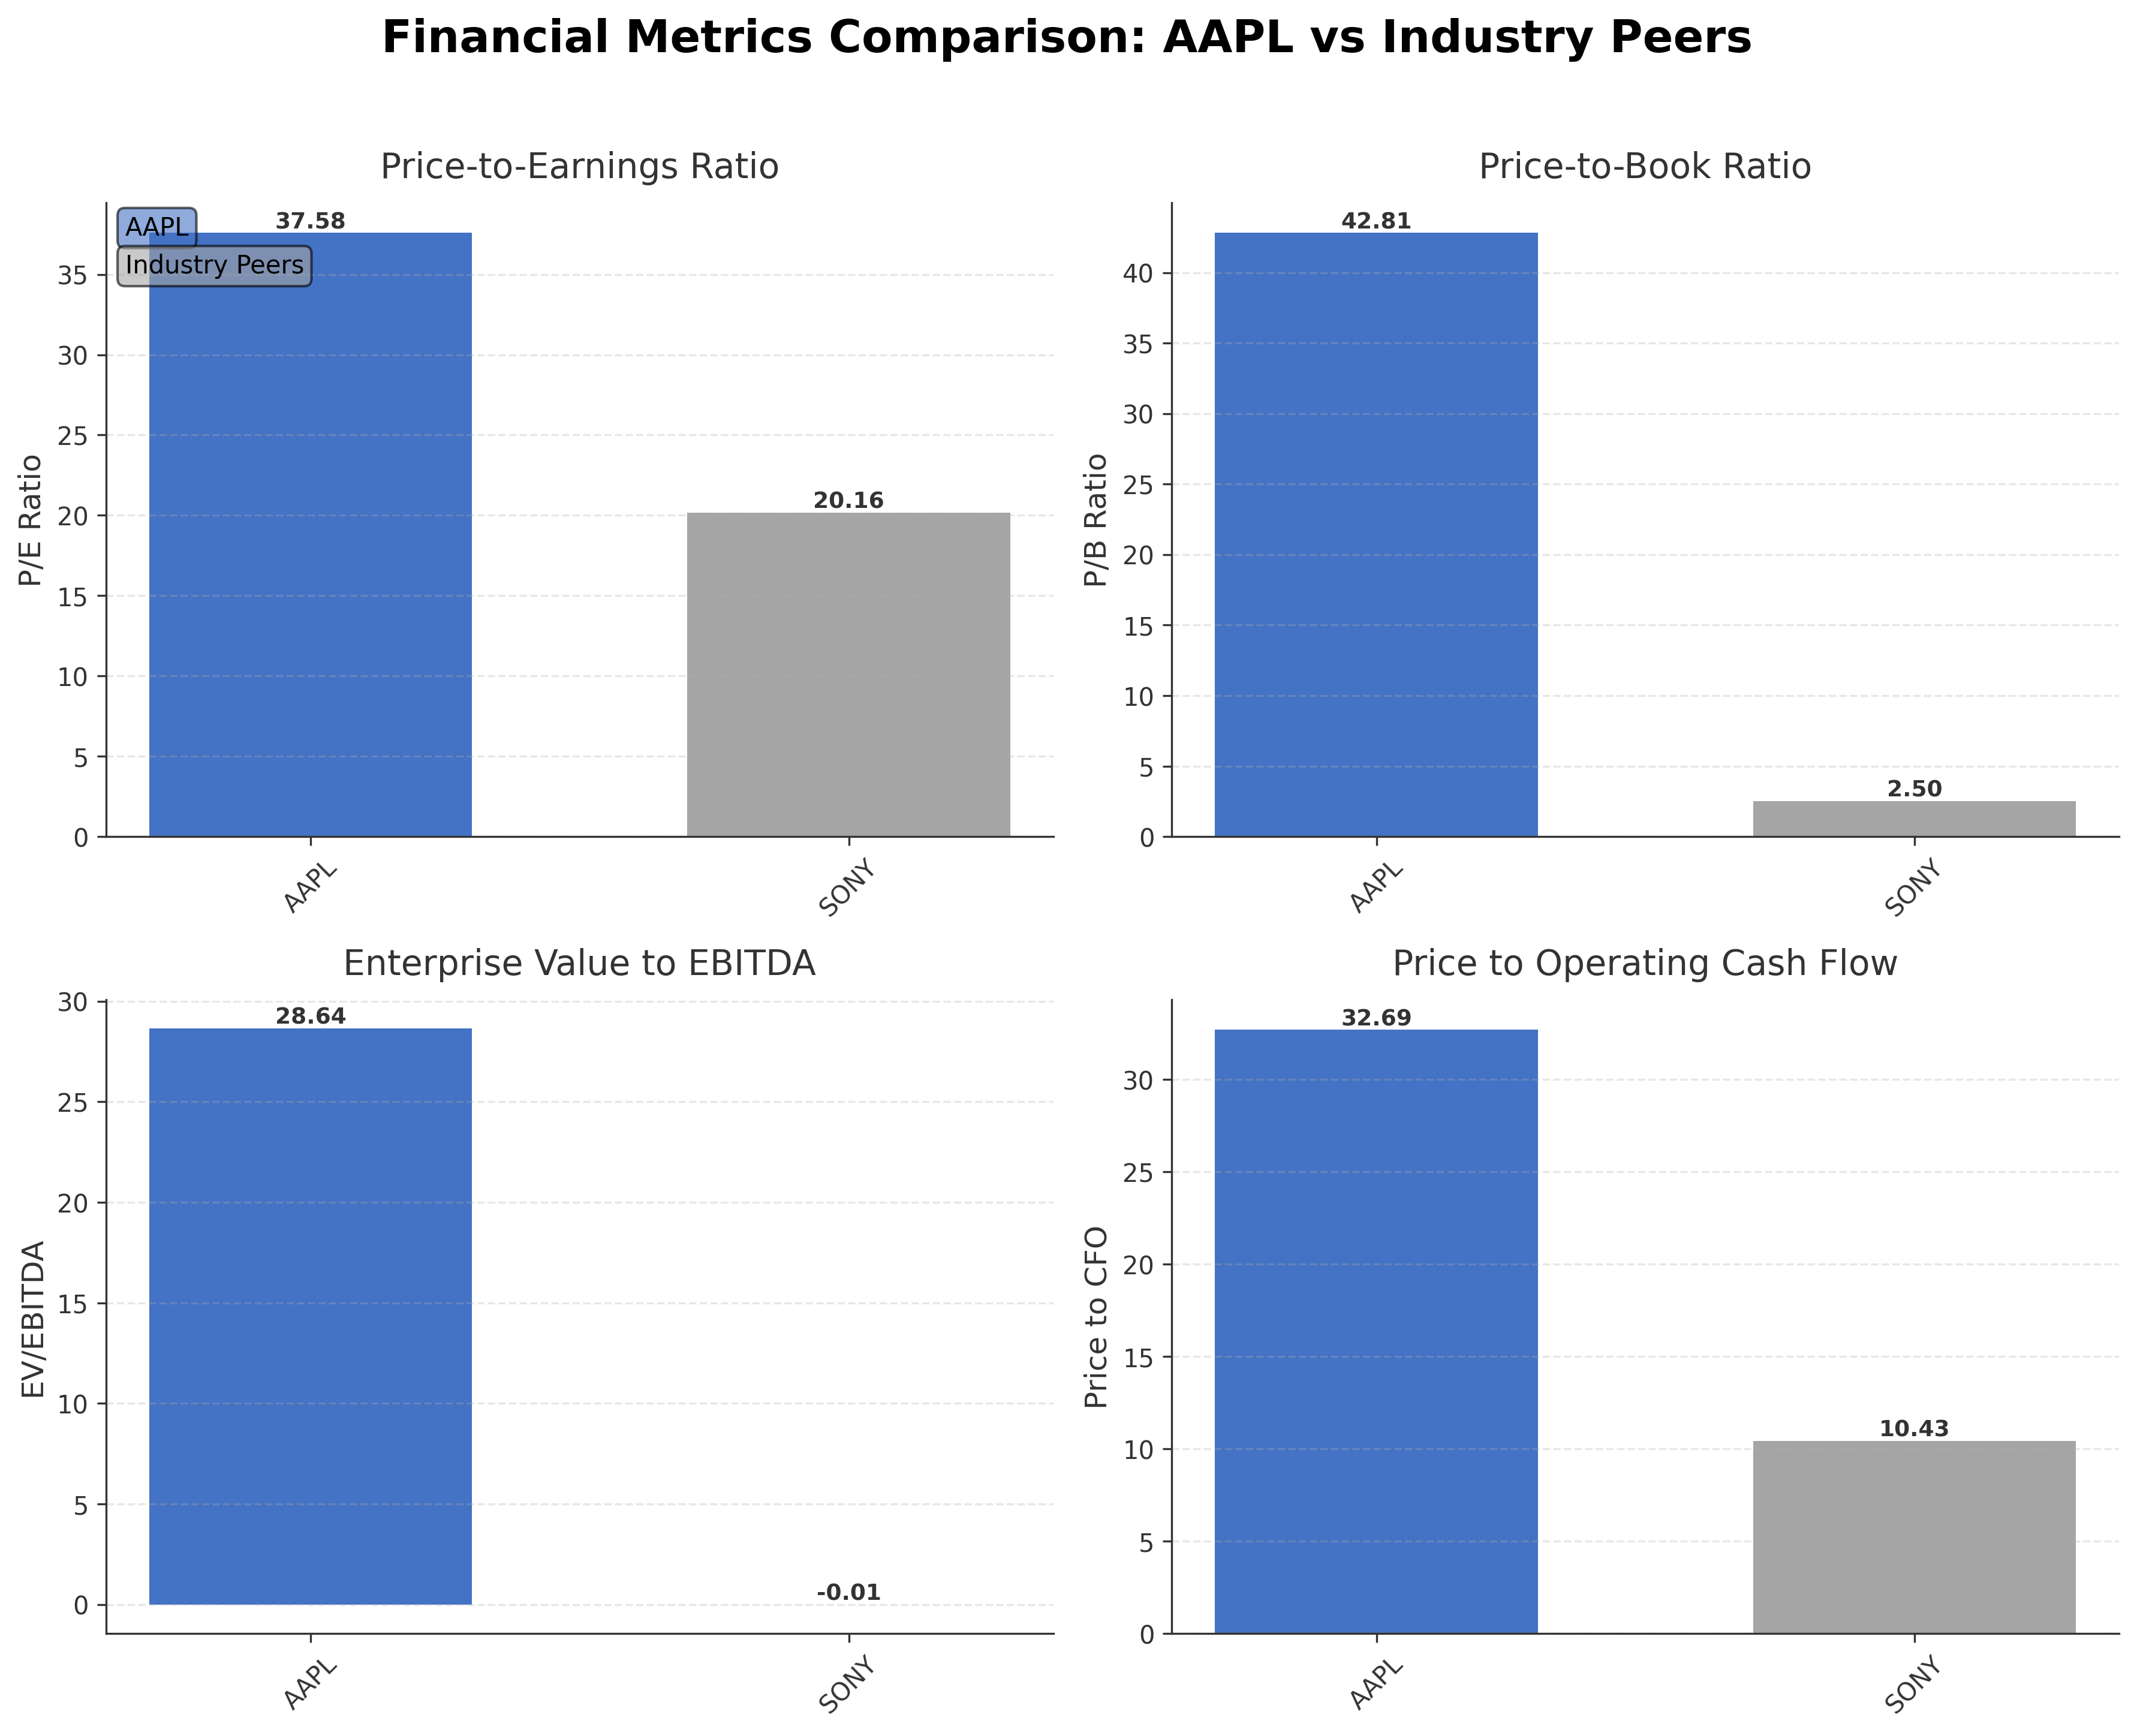
Peer Analysis
| Company Name | Market Cap | P/E Ratio | P/B Ratio | EV/EBITDA | Price to CFO |
|---|---|---|---|---|---|
| Apple Inc | $4.58T | 37.58 | 42.81 | 28.64 | 32.69 |
| Sony Group Corporation | $127.44B | 20.16 | 2.50 | -0.01 | 10.43 |
Comparison Analysis: Apple Inc. significantly outpaces its peer Sony Group Corporation in market capitalization, boasting a $4.58 trillion valuation compared to Sony’s $127.44 billion. Apple’s P/E ratio of 37.58 is notably higher than Sony’s 20.16, reflecting a premium valuation consistent with its dominant market position and growth prospects. The price-to-book ratio disparity is substantial, with Apple at 42.81 versus Sony’s 2.50, indicating Apple’s strong brand and intangible asset value. Apple’s EV/EBITDA ratio of 28.64 contrasts with Sony’s negative figure, underscoring Apple’s robust earnings before interest, taxes, depreciation, and amortization. Return on equity also favors Apple at 1.41% compared to Sony’s 0.12%, highlighting superior profitability and capital efficiency.
Financial Metrics Comparison with Peers
Financial Statements
Comprehensive financial data including income, balance sheet, and cash flow metrics
Income Statement
| fiscal_date | 2025-09-30 | 2024-09-30 | 2023-09-30 | 2022-09-30 | 2021-09-30 |
|---|---|---|---|---|---|
| Sales | 416.16B | 391.04B | 383.29B | 394.33B | 365.82B |
| Cost Of Goods | 220.96B | 210.35B | 214.14B | 223.55B | 212.98B |
| Gross Profit | 195.20B | 180.68B | 169.15B | 170.78B | 152.84B |
| Operating Expense Research And Development | 34.55B | 31.37B | 29.91B | 26.25B | 21.91B |
| Operating Expense Selling General And Administrative | 27.60B | 26.10B | 24.93B | 25.09B | 21.97B |
| Operating Income | 133.05B | 123.22B | 114.30B | 119.44B | 108.95B |
| Other Income Expense | -321.00M | 269.00M | -565.00M | -334.00M | 60.00M |
| Pretax Income | 132.73B | 123.48B | 113.74B | 119.10B | 109.21B |
| Income Tax | 20.72B | 29.75B | 16.74B | 19.30B | 14.53B |
| Net Income | 112.01B | 93.74B | 97.00B | 99.80B | 94.68B |
| Eps Basic | 7.49 | 6.11 | 6.16 | 6.15 | 5.67 |
| Eps Diluted | 7.46 | 6.08 | 6.13 | 6.11 | 5.61 |
| Basic Shares Outstanding | 14.95B | 15.34B | 15.74B | 16.22B | 16.70B |
| Diluted Shares Outstanding | 14.95B | 15.34B | 15.74B | 16.22B | 16.70B |
| Ebit | 133.05B | 123.22B | 114.30B | 119.44B | 111.85B |
| Ebitda | 144.75B | 134.66B | 125.82B | 130.54B | 123.14B |
| Net Income Continuous Operations | 112.01B | 93.74B | 97.00B | 99.80B | 94.68B |
| Non Operating Interest Income | N/A | N/A | 3.75B | 2.83B | 2.84B |
| Non Operating Interest Expense | N/A | N/A | 3.93B | 2.93B | 2.65B |
Data provided by Twelve Data
Balance Sheet
| fiscal_date | 2025-09-30 | 2024-09-30 | 2023-09-30 | 2022-09-30 | 2021-09-30 |
|---|---|---|---|---|---|
| Cash And Cash Equivalents | 35.93B | 29.94B | 29.96B | 23.65B | 34.94B |
| Accounts Receivable | 39.78B | 33.41B | 29.51B | 28.18B | 26.28B |
| Total Assets | 359.24B | 364.98B | 352.58B | 352.75B | 351.00B |
| Total Liabilities | 285.51B | 308.03B | 290.44B | 302.08B | 287.91B |
| Long Term Debt | 78.33B | 85.75B | 95.28B | 109.71B | 119.38B |
| Shareholders Equity | 73.73B | 56.95B | 62.15B | 50.67B | 63.09B |
Data provided by Twelve Data
Cash Flow Statement
| fiscal_date | 2025-09-30 | 2024-09-30 | 2023-09-30 | 2022-09-30 | 2021-09-30 |
|---|---|---|---|---|---|
| Operating Activities Net Income | 112.01B | 93.74B | 97.00B | 99.80B | 94.68B |
| Operating Activities Depreciation | 11.70B | 11.45B | 11.52B | 11.10B | 11.28B |
| Operating Activities Stock Based Compensation | 12.86B | 11.69B | 10.83B | 9.04B | 7.91B |
| Operating Activities Other Non Cash Items | -89.00M | -2.27B | -2.23B | 1.01B | -4.92B |
| Operating Activities Accounts Receivable | -7.03B | -5.14B | -417.00M | -9.34B | -14.03B |
| Operating Activities Accounts Payable | 902.00M | 6.02B | -1.89B | 9.45B | 12.33B |
| Operating Activities Other Assets Liabilities | -18.87B | 2.77B | -4.27B | 1.57B | -1.53B |
| Operating Activities Operating Cash Flow | 111.48B | 118.25B | 110.54B | 123.52B | 100.94B |
| Investing Activities Capital Expenditures | -12.71B | -9.45B | -10.96B | -10.71B | -11.09B |
| Investing Activities Purchase Of Investments | -24.41B | -48.66B | -29.51B | -76.92B | -109.56B |
| Investing Activities Sale Of Investments | 53.80B | 62.35B | 45.51B | 67.36B | 106.48B |
| Investing Activities Other Investing Activity | -1.48B | -1.31B | -1.34B | -2.09B | -385.00M |
| Investing Activities Investing Cash Flow | 15.20B | 2.94B | 3.71B | -22.66B | -14.58B |
| Financing Activities Long Term Debt Issuance | 4.48B | 0.00 | 5.23B | 5.46B | 20.39B |
| Financing Activities Long Term Debt Payments | -10.93B | -9.96B | -11.15B | -9.54B | -8.75B |
| Financing Activities Short Term Debt Issuance | -2.03B | 3.96B | -3.98B | 3.96B | 1.02B |
| Financing Activities Common Stock Repurchase | -90.71B | -94.95B | -77.55B | -89.40B | -85.97B |
| Financing Activities Common Dividends | -15.42B | -15.23B | -15.03B | -14.84B | -14.47B |
| Financing Activities Other Financing Charges | -6.07B | -5.80B | -6.01B | -6.38B | -5.58B |
| Financing Activities Financing Cash Flow | -120.69B | -121.98B | -108.49B | -110.75B | -92.25B |
| End Cash Position | 35.93B | 29.94B | 30.74B | 24.98B | 35.93B |
| Income Tax Paid | 43.37B | 26.10B | 18.68B | 19.57B | 25.39B |
| Free Cash Flow | 98.77B | 108.81B | 99.58B | 111.44B | 92.95B |
| Interest Paid | N/A | N/A | 3.80B | 2.87B | 2.69B |
| Operating Activities Deferred Taxes | N/A | N/A | N/A | 895.00M | -4.77B |
| Investing Activities Net Acquisitions | N/A | N/A | N/A | -306.00M | -33.00M |
| Financing Activities Common Stock Issuance | N/A | N/A | N/A | N/A | 1.10B |
Data provided by Twelve Data
Technical Analysis
Key Insights
- Apple’s stock is currently in a sustained uptrend, with price action showing higher highs and higher lows over recent periods.
- Key support levels are identified near $270 and $260, while resistance is observed around the 52-week high of $315.
- The stock price is trading above its 10-day, 50-day ($272.88), and 200-day ($262.40) moving averages, indicating bullish momentum.
- Momentum indicators show RSI in the mid-60s, MACD above the signal line, and Stochastic oscillators in overbought territory, suggesting strong buying interest.
- Multi-timeframe analysis reveals consistent strength on daily, weekly, and monthly charts, confirming a positive technical setup.
- Potential scenarios include continuation of the upward trend if support holds, or consolidation near resistance levels if profit-taking intensifies.
Trending News
1. Headline: Renaissance Technologies Takes New Position In Apple Inc. (NASDAQ: AAPL), Ranking It Third Among Top Stock Picks
Summary: The combination of record iPhone ... to the stock. Renaissance Technologies’ decision to re-enter the position signals renewed institutional confidence in Apple’s near-term earnings trajectory and its ability to sustain momentum across multiple business segments. ... Ewan is a reporter at the Foreign Policy Journal, primarily covering US current affairs and news related to ...
Sentiment: positive
2. Headline: Apple's AI Future, Stock Surge, Nvidia CEO's New Role And More: This Week In Appleverse - NVIDIA (NASDAQ: - Benzinga
Summary: Apple's AI-driven "agentic smartphone" narrative, stock surge, and Nvidia CEO's advisory role highlight major shifts in tech leadership.
Sentiment: positive
3. Headline: Northbridge Financial Group LLC Acquires New Shares in Apple Inc. $AAPL
Summary: Northbridge Financial Group LLC acquired a new stake in shares of Apple Inc. (NASDAQ:AAPL - Free Report) during the 4th quarter, according to the company in its most recent filing with the Securities and Exchange Commission. The fund acquired 66,615 shares of the iPhone maker's stock, valued at app
Sentiment: neutral
4. Headline: Apple @ Work: How Apple Business solved the shadow IT problem of Apple Maps Connect - 9to5Mac
Summary: For years, employees managed Apple Maps location data using personal iCloud accounts. With the new Apple Business platform, IT gains control.
Sentiment: neutral
5. Headline: Apple Inc (AAPL) Shares Fall 0.2% -- What GF Score of 95 Tells Investors
Summary: According to the GF Value™, Apple Inc AAPL is currently overvalued, with a price of $312.06 compared to its calculated fair value of $263.69. This discrepancy suggests that the stock is priced at an 18.3% premium, indicating a lack of margin of safety for potential investors. The GF Valuation label classifies the stock as "Modestly Overvalued," which raises concerns about the sustainability of its current price level in the event of market corrections or adverse news...
Sentiment: negative
Powered by Brave
Recent Updates
News Summary
As of 2026-05-31. Apple reported its best March quarter ever with revenue of $111.18 billion, marking a 17% year-over-year increase and setting new records across all geographic segments. The iPhone 17 lineup drove extraordinary demand, contributing $56.99 billion in revenue. Services revenue also reached an all-time high, supporting strong gross margins of 49.3%. The company announced a leadership transition with Tim Cook moving to Executive Chairman and John Ternus becoming CEO. Additionally, Apple declared a 4% increase in its quarterly dividend to $0.27 per share and authorized a $100 billion share repurchase program, reflecting strong cash flow generation and capital return policies. The June quarter outlook anticipates revenue growth between 14% and 17%, despite supply chain challenges.
News Sentiment
The overall sentiment from recent updates is predominantly positive, driven by record-breaking revenue and earnings performance, robust product demand, and strategic leadership changes. Institutional buying activity, including new positions by Renaissance Technologies and Northbridge Financial Group, further supports confidence in Apple’s growth prospects. However, valuation concerns highlighted by modest overvaluation metrics introduce a note of caution. The balanced narrative reflects strong operational execution tempered by market pricing considerations, suggesting a stable outlook grounded in fundamental strength.
Source List
- https://www.cnbc.com/2026/04/30/apple-aapl-q2-2026-earnings-report.html
Analytical Overview
Analysis Summary
Apple’s valuation metrics, including a trailing P/E of 37.58 and forward P/E of 32.35, are elevated compared to industry averages, reflecting premium pricing justified by strong brand equity and growth prospects. The company’s revenue growth rate of 16.6% year-over-year and robust operating cash flow of $140.2 billion demonstrate a solid growth trajectory supported by high demand for flagship products and expanding services. Financial health is strong with a manageable debt-to-equity ratio of 79.5% and substantial cash reserves of $68.5 billion, ensuring liquidity and flexibility for capital allocation. The technology sector’s rapid innovation pace and competitive dynamics present both opportunities and challenges, with Apple leveraging its ecosystem to maintain leadership. Market positioning and competitive advantages are underscored by a large installed base exceeding 2.5 billion active devices and continuous product innovation.
Overall Business and Market Assessment
Supporting Factors: No data
Risk Factors: Apple’s investment appeal is supported by record revenues, strong profitability, and significant cash flow generation, alongside a diversified product and service portfolio. Key risks to monitor include valuation premiums that may limit upside, supply chain constraints, and intensifying competition in key markets. The company’s strategic leadership transition and ongoing innovation position it well for medium to long-term growth, though near-term market dynamics warrant balanced attention. Overall, the analysis suggests a stable outlook with a balanced risk-reward profile suitable for investors with a medium to long-term horizon.
SWOT Analysis
Strengths
- Market leadership with a diversified and integrated product ecosystem.
- Strong profitability with high gross and net profit margins.
- Robust cash flow generation supporting capital returns and investments.
- Significant institutional ownership providing governance stability.
Weaknesses
- High valuation multiples that may limit near-term price appreciation.
- Dependence on flagship products like the iPhone for a large portion of revenue.
- Moderate current ratio indicating limited short-term liquidity buffer.
- Relatively high debt-to-equity ratio compared to some peers.
Opportunities
- Expansion of services segment with growing subscription revenues.
- Innovation in AI and new product launches enhancing market appeal.
- Leadership transition potentially bringing fresh strategic perspectives.
- Growing installed base of active devices supporting ecosystem lock-in.
Threats
- Intense competition in consumer electronics and technology sectors.
- Supply chain disruptions impacting product availability and costs.
- Regulatory scrutiny and potential legal challenges in global markets.
- Valuation pressures increasing vulnerability to market corrections.
Company Description
Apple Inc. designs, manufactures, and markets a wide range of technology products worldwide. These include the iPhone, a line of smartphones; Mac, a line of personal computers; iPad, a line of multi-purpose tablets; and wearables, home, and accessories such as AirPods, Apple Vision Pro, Apple TV, Apple Watch, Beats products, HomePod, as well as Apple branded and third-party accessories. The company operates service platforms including the App Store, Apple Music, and subscription models that provide curated content, cloud services, and digital offerings. Apple Inc. serves individual consumers, businesses, and government sectors through online stores, retail outlets, and partnerships with cellular carriers and resellers. Its products span the information technology sector, impacting mobile communication, personal computing, entertainment, and health monitoring. Founded in 1976 and headquartered in Cupertino, California, Apple Inc. plays a pivotal role in the global technology market by integrating hardware, software, and services into seamless ecosystems.