
Apple Inc (AAPL)
Stock Analysis Report
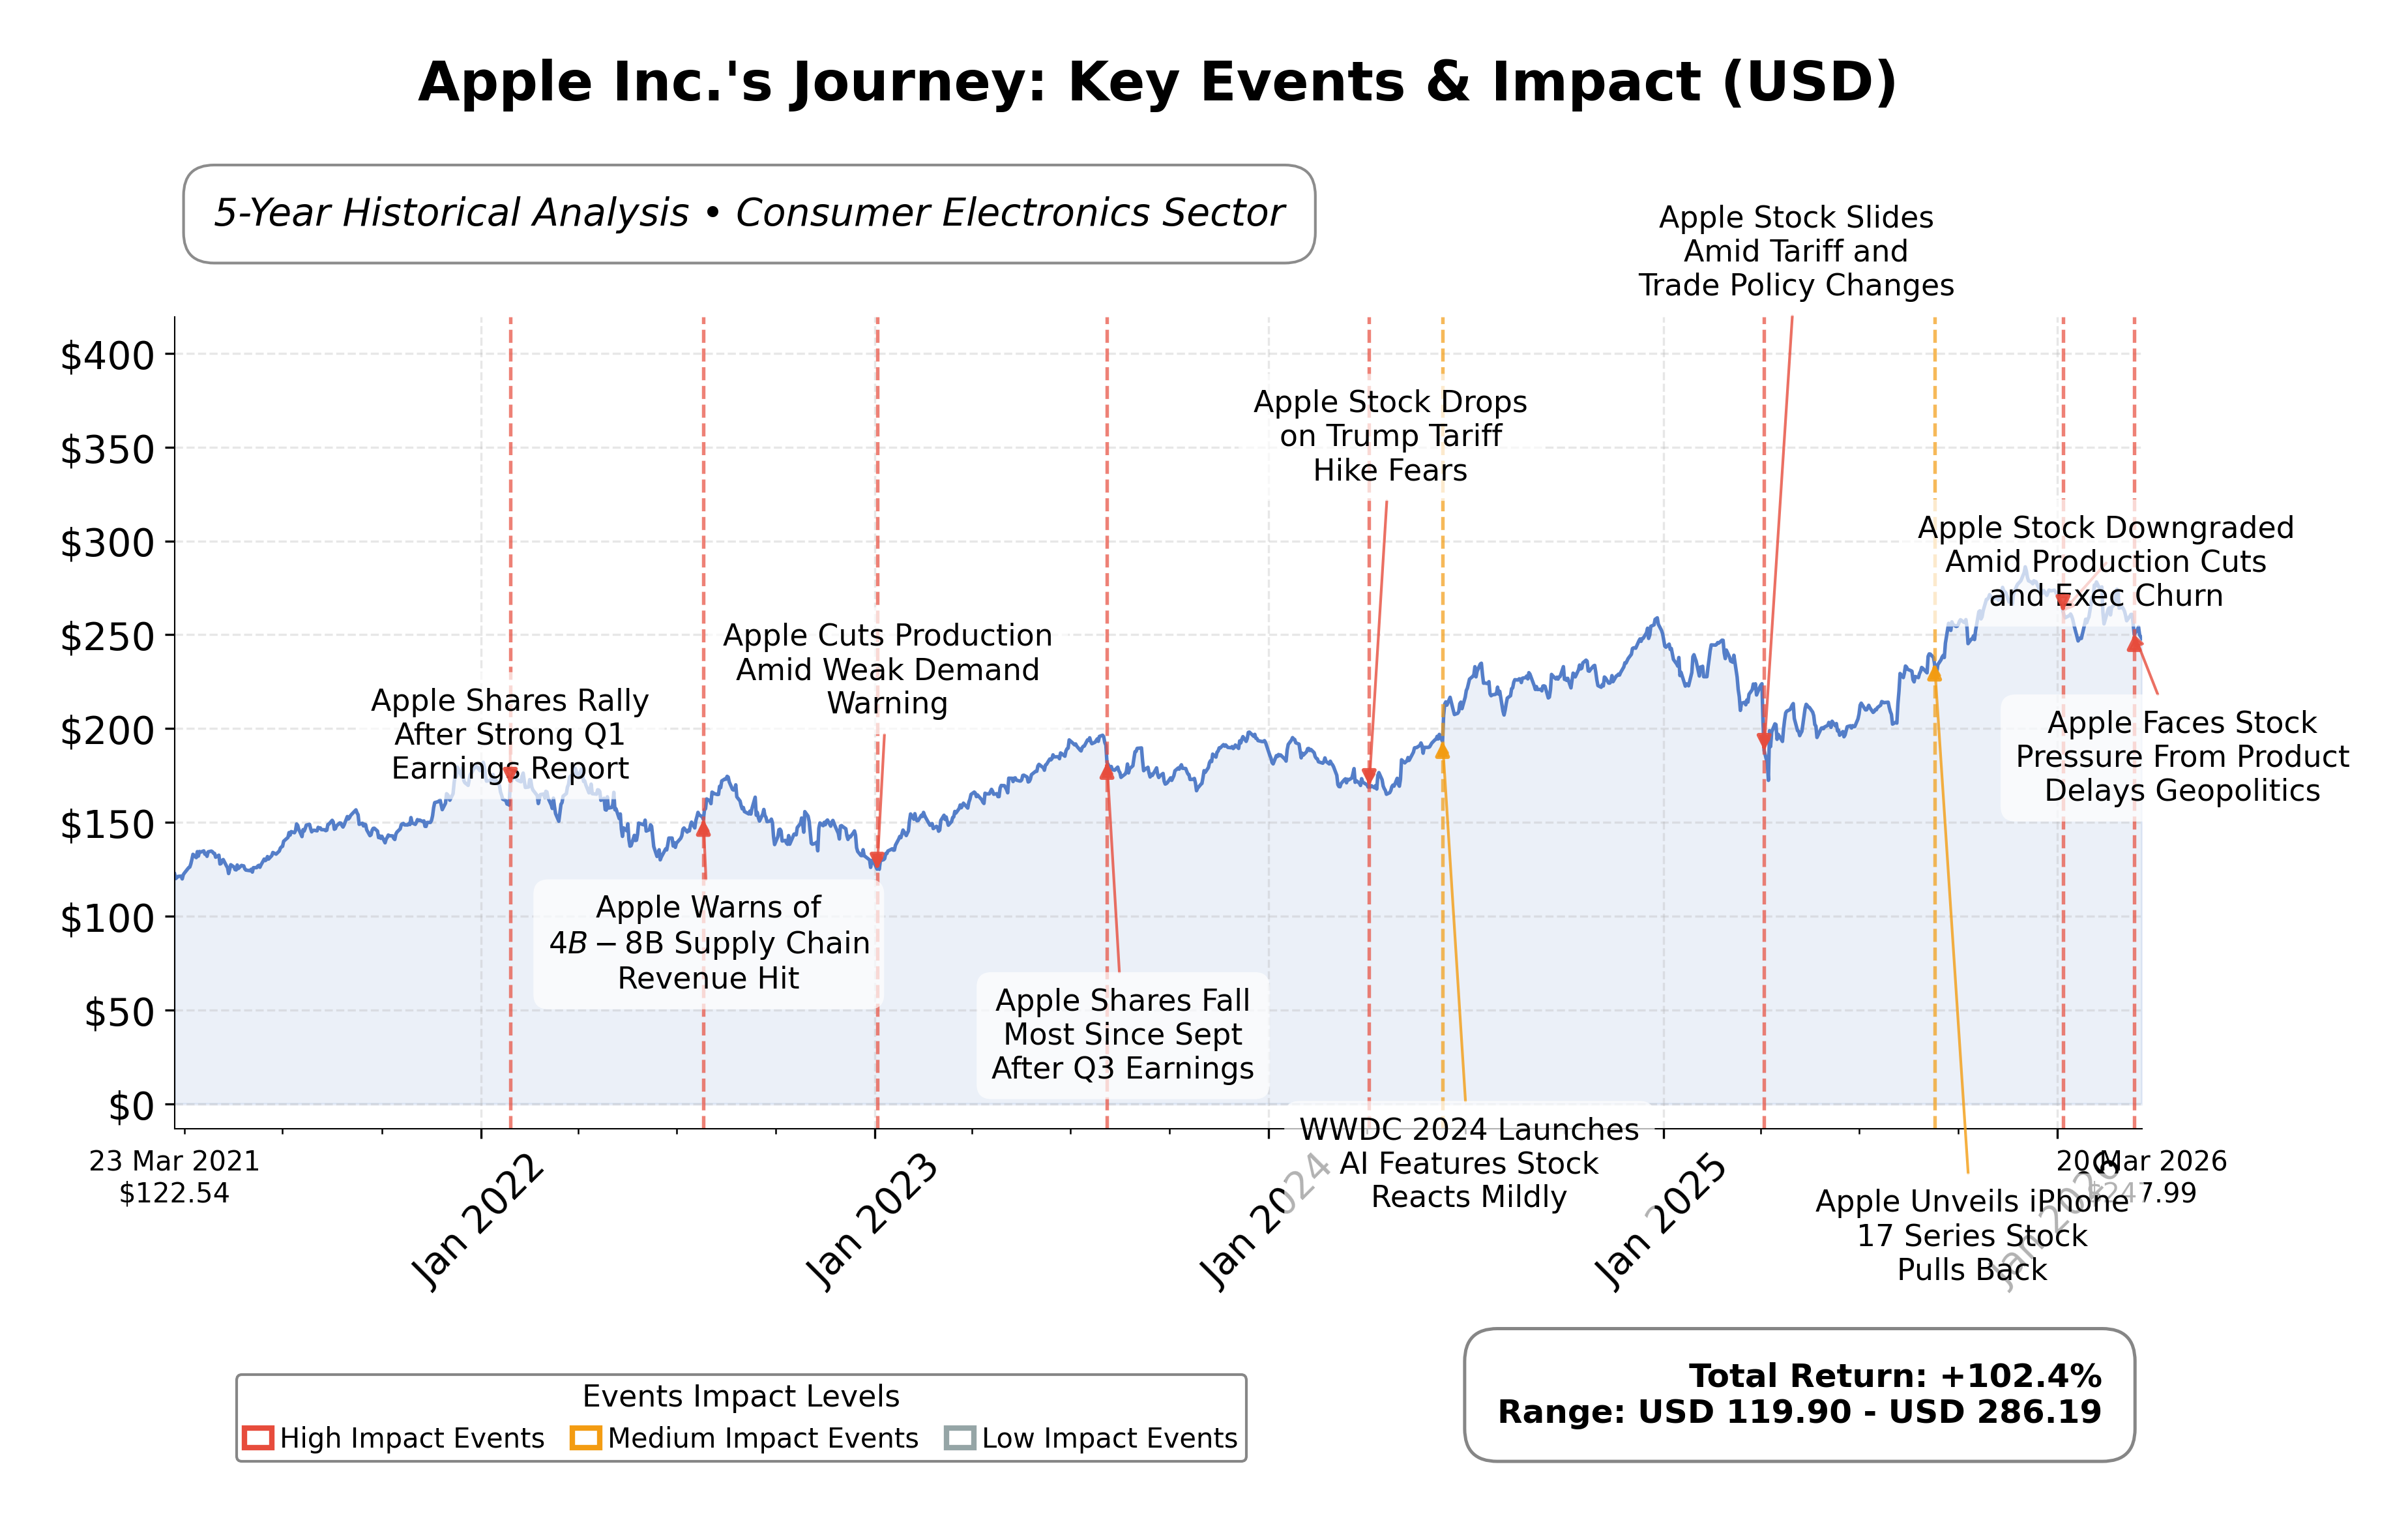
Stock Journey
Key Positives and Key Risks
Pros
- Market capitalization of $3.64 trillion demonstrates Apple’s dominant industry position and scale.
- Strong revenue growth of 15.7% quarterly and operating cash flow of $135.5 billion indicate robust financial performance.
- Institutional ownership at 65.27% reflects confidence and governance stability among major shareholders.
Cons
- Trailing P/E ratio of 31.5 and price-to-book ratio of 41.5 suggest a premium valuation that may limit upside.
- Current ratio of 0.974 indicates tight short-term liquidity, which may pose operational constraints.
- Total debt of $90.5 billion with a debt-to-equity ratio of 102.6% requires monitoring for financial leverage risks.
Disclosure: This information is for general awareness and does not constitute investment advice
Report Summary
Apple Inc. is a leading global technology company specializing in consumer electronics, software, and digital services. Its core business revolves around designing, manufacturing, and marketing flagship products such as the iPhone, Mac computers, iPad tablets, Apple Watch, and accessories, complemented by a growing suite of services including the App Store, Apple Music, and iCloud. Operating within the consumer electronics industry, Apple maintains a strong market position characterized by a vast ecosystem and global retail presence.
Financially, Apple demonstrates robust performance with a market capitalization exceeding $3.64 trillion and a trailing P/E ratio of approximately 31.5, reflecting premium valuation consistent with its industry standing. The company reported trailing twelve months (TTM) revenue of $435.6 billion with a profit margin of 27%, operating margin of 35%, and a return on equity (ROE) of 1.52%. Cash flow metrics remain strong, with operating cash flow near $135.5 billion and free cash flow around $106.3 billion, supporting ongoing capital returns and investment.
From a technical and strategic perspective, Appleâs stock trades above its 50-day and 200-day moving averages, indicating positive momentum. Recent strategic initiatives include product innovation such as the MacBook Neo targeting AI applications, and leadership changes reflected in institutional shareholding adjustments. Strengths include a diversified product ecosystem and strong cash generation, while risks encompass high valuation multiples and competitive pressures in technology markets.
Peer analysis within the consumer electronics sector, particularly compared to Sony Group Corporation in the United States, shows Appleâs significantly larger market capitalization and higher valuation multiples. Appleâs P/E and P/B ratios are substantially above peers, reflecting its dominant market position but also indicating premium pricing relative to industry counterparts. Return on equity is modest but superior to peers, underscoring operational efficiency.
Apple navigates a dynamic technology landscape marked by rapid innovation and evolving consumer preferences. Recent achievements include strong revenue growth and product launches, while challenges involve sustaining growth amid valuation scrutiny and competitive innovation. The companyâs strategic direction and market conditions present pivotal moments with potential impacts on its market leadership and financial performance. Given the comprehensive data, a balanced stance emphasizing ongoing observation of valuation and operational metrics may align with prudent evaluation practices.
Company and Industry Overview
Company Basics
Price Performance
Company Size
Shareholding Pattern
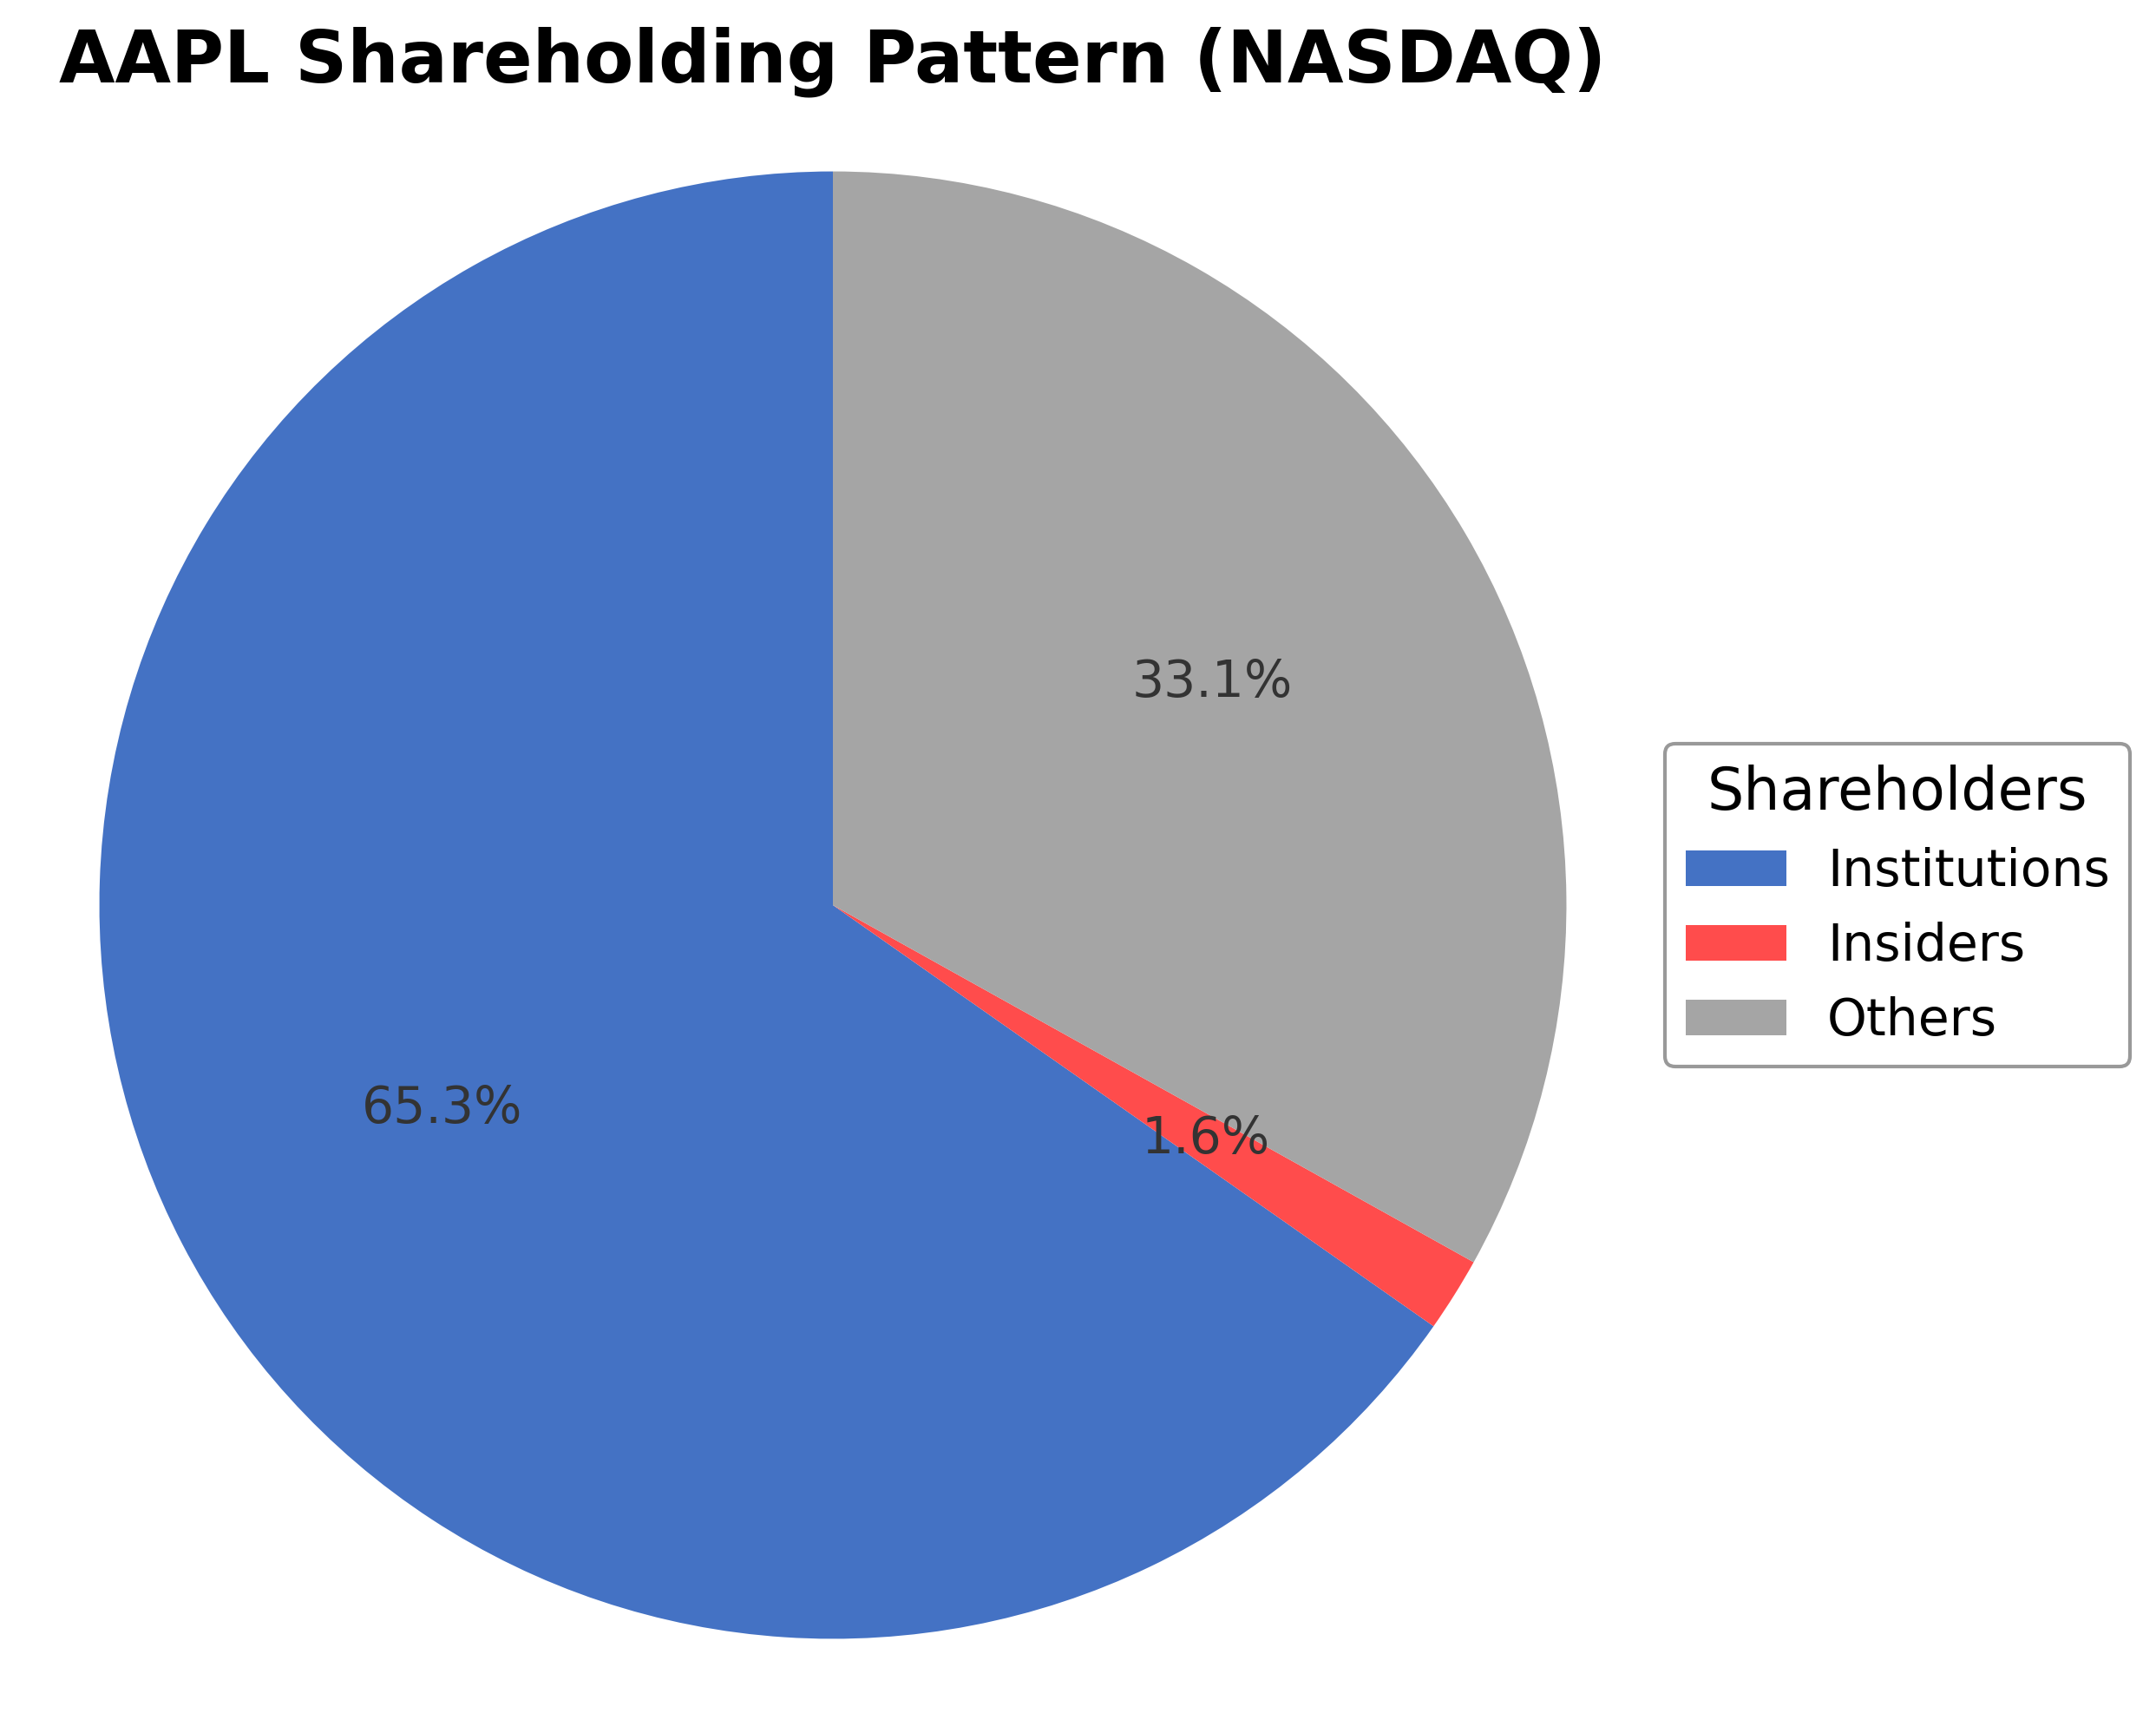
Apple Inc.'s ownership structure comprises approximately 1.64% insiders, 65.27% institutional investors, and 33.21% other shareholders including retail investors and employee stock plans. Over the past 12-24 months, institutional ownership has shown selective adjustments with some funds increasing positions, such as LifeGuide Financial Advisors LLC and Commons Capital LLC, while others like Neville Rodie & Shaw Inc. have reduced holdings. This pattern reflects a nuanced market sentiment balancing confidence in Apple's innovation and valuation considerations. The dominant institutional presence supports governance stability and strategic continuity, while retail participation contributes to liquidity and market dynamics. The ownership distribution suggests a mature shareholder base aligned with long-term corporate objectives within the competitive consumer electronics industry.
Sector and Industry Analysis
Apple Inc. (AAPL) operates primarily within the Technology sector, specifically in the Hardware industry, which encompasses consumer electronics, computing devices, and related software ecosystems. The global technology hardware market is expansive, valued in the trillions of USD, driven by continuous innovation in smartphones, personal computing, wearables, and semiconductor components. Apple is a dominant player with a diversified product portfolio centered on the iPhone, which constitutes the majority of its revenue, supplemented by Mac computers, iPads, Apple Watch, and an expanding suite of software and services. The sector exhibits a robust growth trajectory fueled by rising digital adoption, increasing consumer demand for integrated ecosystems, and the proliferation of connected devices.
Industry trends are characterized by rapid technological shifts including the integration of augmented reality (AR), artificial intelligence (AI), and 5G connectivity into consumer devices. Apple’s strategic emphasis on proprietary chip design (e.g., M-series processors) and software integration enhances performance and user experience, setting industry benchmarks. Consumer behavior increasingly favors seamless interoperability across devices and subscription-based services, which Apple leverages through its growing services segment including streaming, cloud, and app ecosystems. Emerging opportunities lie in augmented reality applications, health and fitness technologies via wearables, and expansion into automotive and smart home sectors, positioning hardware companies to capitalize on converging technology platforms.
The regulatory landscape for the technology hardware industry is complex and multifaceted, involving data privacy laws (e.g., GDPR, CCPA), antitrust scrutiny, intellectual property protections, and trade policies affecting global supply chains. Compliance with environmental regulations and sustainability mandates is increasingly critical, as governments and consumers demand responsible sourcing and reduced carbon footprints. Apple faces ongoing regulatory challenges related to app store practices, competition law investigations, and international trade tensions, particularly given its reliance on global manufacturing partners like Foxconn and TSMC. Adherence to these regulatory frameworks is essential to mitigate legal risks and maintain market access.
Competitive dynamics in the hardware industry are shaped by high capital intensity, significant R&D investment, and strong brand loyalty. Barriers to entry are substantial due to the need for advanced technological capabilities, economies of scale, and established distribution networks. Apple’s competitive positioning is fortified by its integrated hardware-software ecosystem, premium brand perception, and extensive global retail presence. The market structure is oligopolistic with a few dominant firms such as Samsung, Google, and Microsoft competing on innovation, product differentiation, and ecosystem lock-in. Strategic partnerships, supply chain optimization, and continuous innovation remain critical for sustaining competitive advantage in this rapidly evolving industry.
Note: Analysis synthesized from industry research, market reports, and regulatory filings. Information is subject to change based on market conditions.
Illustrative Scenario Analysis
DCF Assumptions:
Method: Two-Stage EPS-Priority Model
Financials
Peer Analysis
| Company Name | Market Cap | P/E Ratio | P/B Ratio | EV/EBITDA | Price to CFO |
|---|---|---|---|---|---|
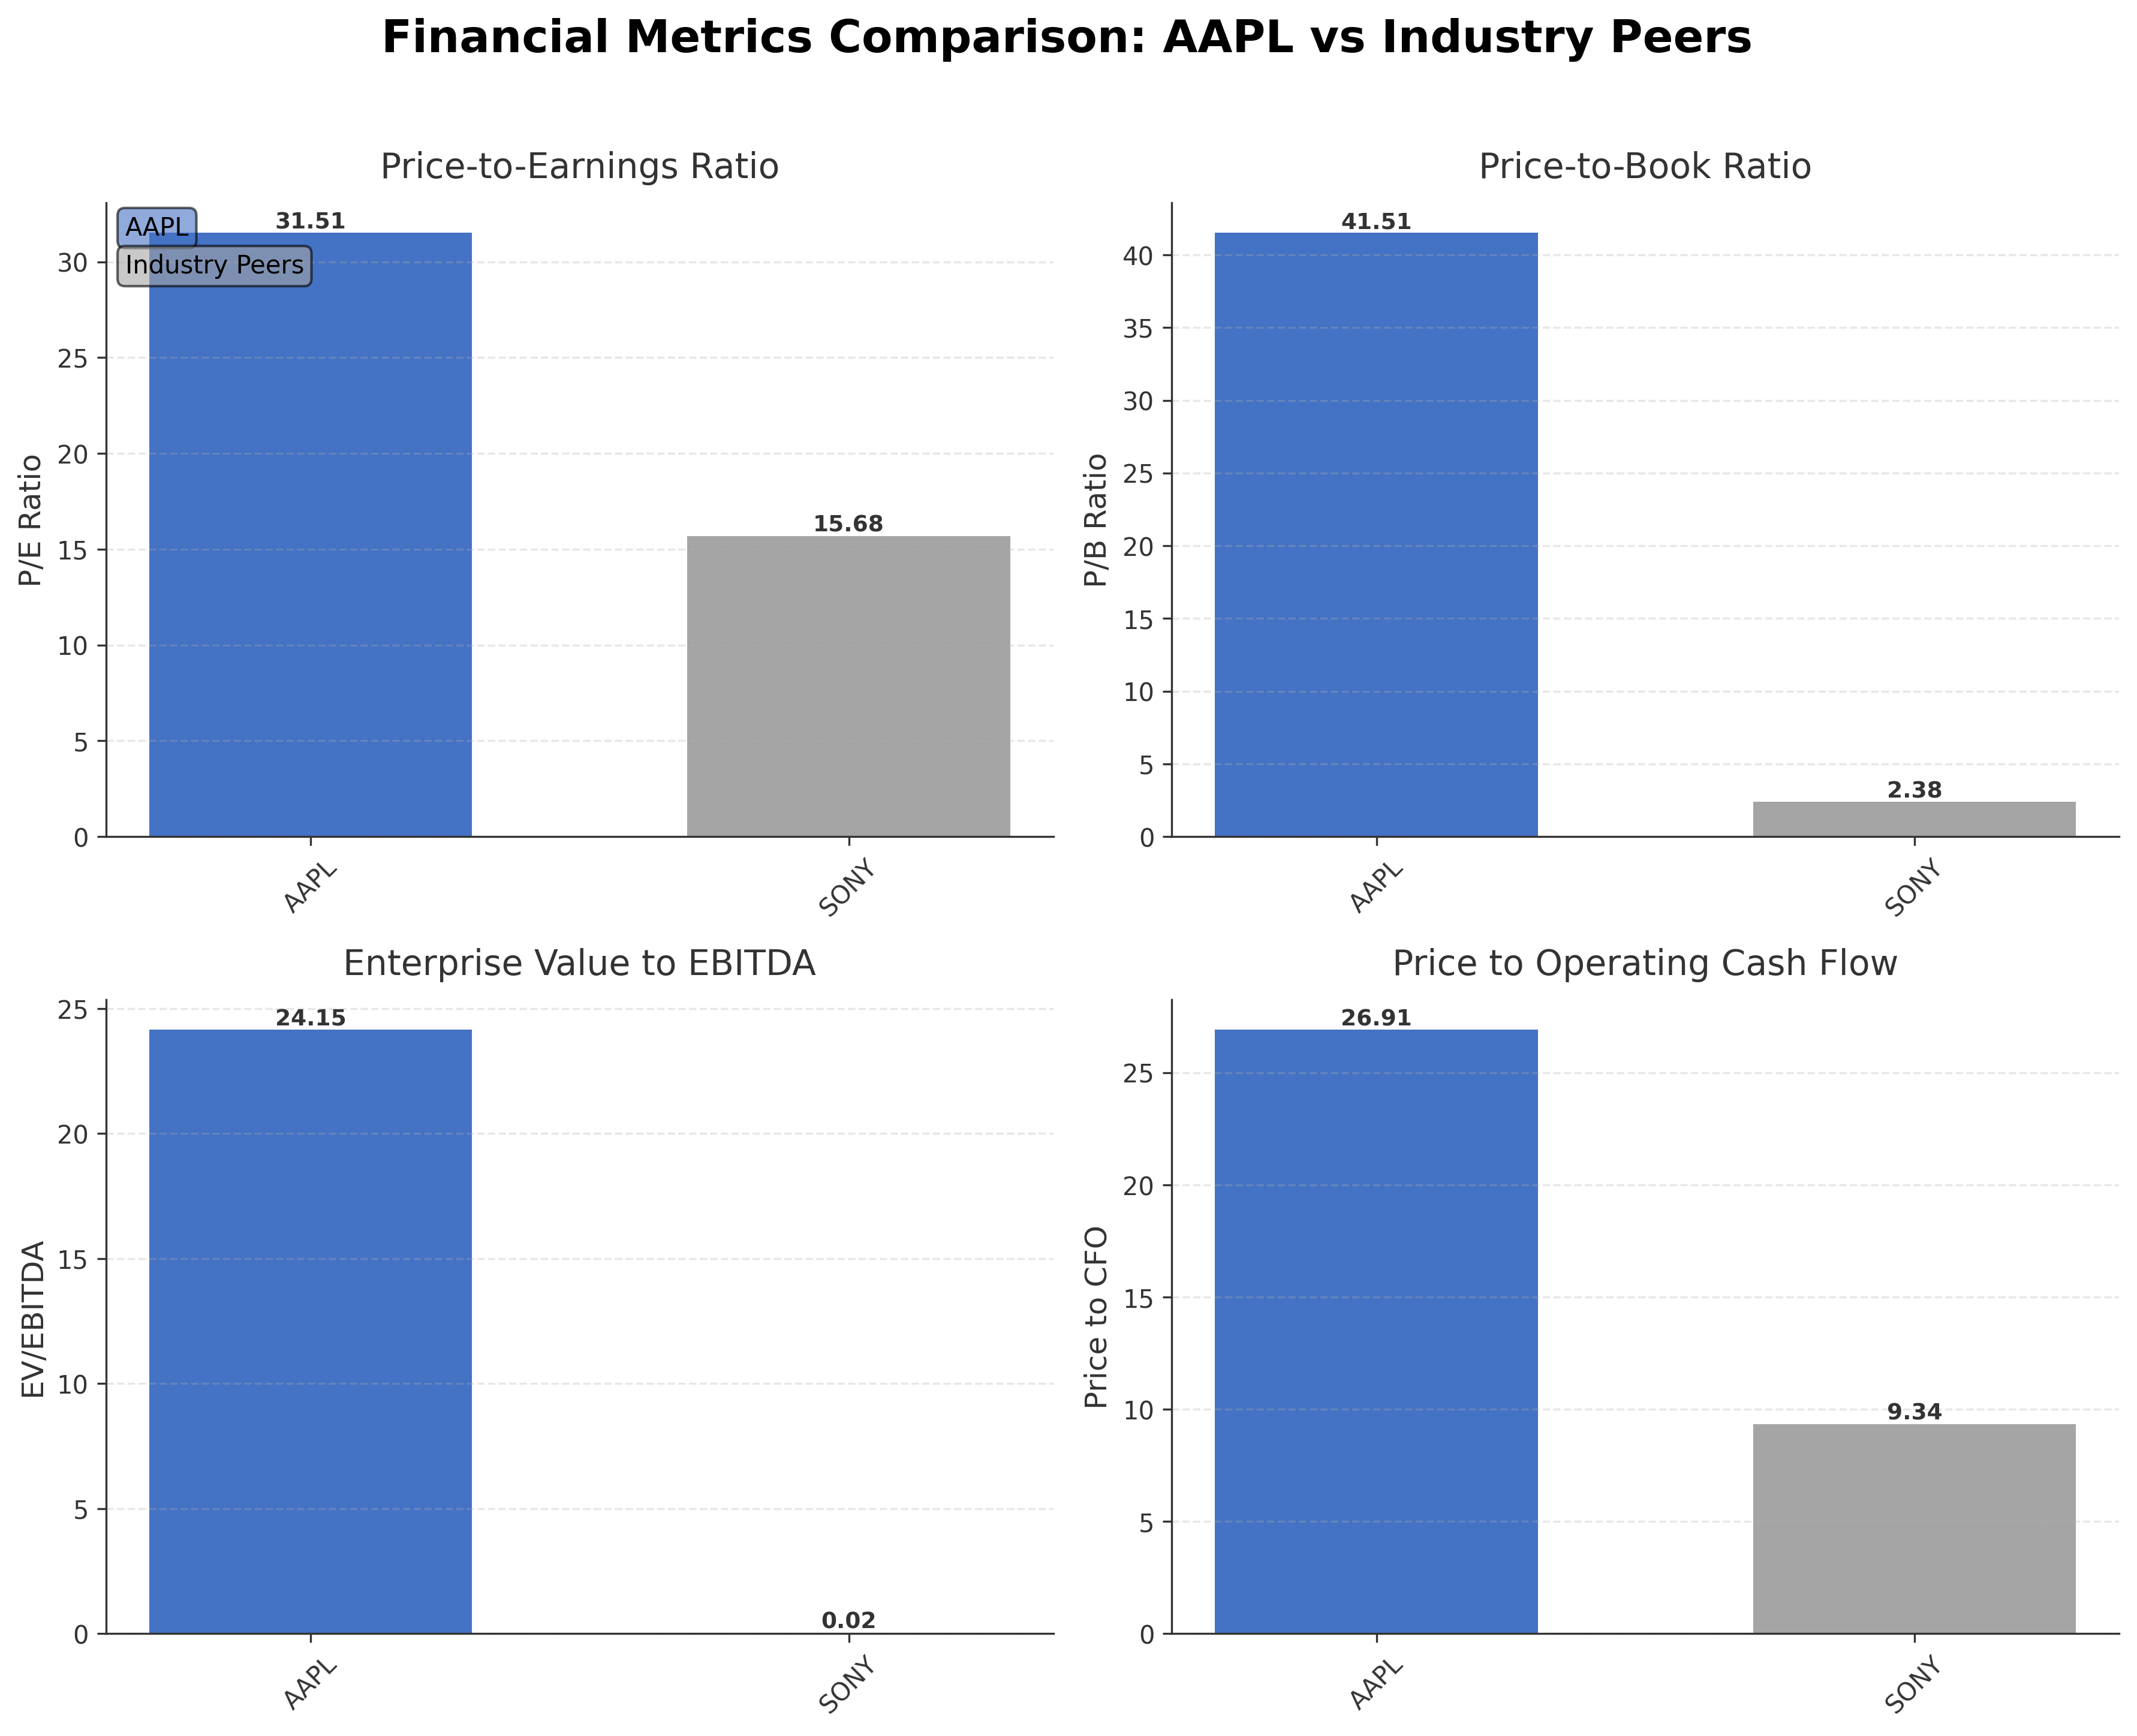
| Apple Inc. | $3.64T | 31.51 | 41.51 | 24.15 | 26.91 |
| Sony Group Corporation - Sponsored American Depositary Receipt | $120.12B | 15.68 | 2.38 | 0.02 | 9.34 |
Comparison Analysis: Apple Inc. significantly outscales its regional peer Sony Group Corporation in market capitalization, reflecting its dominant industry position. Apple's valuation multiples, including P/E and P/B ratios, are substantially higher, indicating a premium market valuation relative to peers. The company also demonstrates superior return on equity, suggesting more efficient capital utilization. However, Apple's elevated EV/EBITDA and price to CFO ratios highlight a more expensive valuation profile compared to Sony. This contrast underscores Apple's leadership in innovation and market presence, balanced against valuation considerations within the consumer electronics sector.
Financial Metrics Comparison with Peers
Financial Statements
Comprehensive financial data including income, balance sheet, and cash flow metrics
Income Statement
| fiscal_date | 2025-09-30 | 2024-09-30 | 2023-09-30 | 2022-09-30 | 2021-09-30 |
|---|---|---|---|---|---|
| Sales | 416.16B | 391.04B | 383.29B | 394.33B | 365.82B |
| Cost Of Goods | 220.96B | 210.35B | 214.14B | 223.55B | 212.98B |
| Gross Profit | 195.20B | 180.68B | 169.15B | 170.78B | 152.84B |
| Operating Expense Research And Development | 34.55B | 31.37B | 29.91B | 26.25B | 21.91B |
| Operating Expense Selling General And Administrative | 27.60B | 26.10B | 24.93B | 25.09B | 21.97B |
| Operating Income | 133.05B | 123.22B | 114.30B | 119.44B | 108.95B |
| Other Income Expense | -321.00M | 269.00M | -565.00M | -334.00M | 60.00M |
| Pretax Income | 132.73B | 123.48B | 113.74B | 119.10B | 109.21B |
| Income Tax | 20.72B | 29.75B | 16.74B | 19.30B | 14.53B |
| Net Income | 112.01B | 93.74B | 97.00B | 99.80B | 94.68B |
| Eps Basic | 7.49 | 6.11 | 6.16 | 6.15 | 5.67 |
| Eps Diluted | 7.46 | 6.08 | 6.13 | 6.11 | 5.61 |
| Basic Shares Outstanding | 14.95B | 15.34B | 15.74B | 16.22B | 16.70B |
| Diluted Shares Outstanding | 14.95B | 15.34B | 15.74B | 16.22B | 16.70B |
| Ebit | 133.05B | 123.22B | 114.30B | 119.44B | 111.85B |
| Ebitda | 144.75B | 134.66B | 125.82B | 130.54B | 123.14B |
| Net Income Continuous Operations | 112.01B | 93.74B | 97.00B | 99.80B | 94.68B |
| Non Operating Interest Income | N/A | N/A | 3.75B | 2.83B | 2.84B |
| Non Operating Interest Expense | N/A | N/A | 3.93B | 2.93B | 2.65B |
Source: Financial statements and regulatory filings
Balance Sheet
| fiscal_date | 2025-09-30 | 2024-09-30 | 2023-09-30 | 2022-09-30 | 2021-09-30 |
|---|---|---|---|---|---|
| Cash And Cash Equivalents | 35.93B | 29.94B | 29.96B | 23.65B | 34.94B |
| Accounts Receivable | 39.78B | 33.41B | 29.51B | 28.18B | 26.28B |
| Total Assets | 359.24B | 364.98B | 352.58B | 352.75B | 351.00B |
| Total Liabilities | 285.51B | 308.03B | 290.44B | 302.08B | 287.91B |
| Long Term Debt | 78.33B | 85.75B | 95.28B | 109.71B | 119.38B |
| Shareholders Equity | 73.73B | 56.95B | 62.15B | 50.67B | 63.09B |
Source: Financial statements and regulatory filings
Cash Flow Statement
| fiscal_date | 2025-09-30 | 2024-09-30 | 2023-09-30 | 2022-09-30 | 2021-09-30 |
|---|---|---|---|---|---|
| Operating Activities Net Income | 112.01B | 93.74B | 97.00B | 99.80B | 94.68B |
| Operating Activities Depreciation | 11.70B | 11.45B | 11.52B | 11.10B | 11.28B |
| Operating Activities Stock Based Compensation | 12.86B | 11.69B | 10.83B | 9.04B | 7.91B |
| Operating Activities Other Non Cash Items | -89.00M | -2.27B | -2.23B | 1.01B | -4.92B |
| Operating Activities Accounts Receivable | -7.03B | -5.14B | -417.00M | -9.34B | -14.03B |
| Operating Activities Accounts Payable | 902.00M | 6.02B | -1.89B | 9.45B | 12.33B |
| Operating Activities Other Assets Liabilities | -18.87B | 2.77B | -4.27B | 1.57B | -1.53B |
| Operating Activities Operating Cash Flow | 111.48B | 118.25B | 110.54B | 123.52B | 100.94B |
| Investing Activities Capital Expenditures | -12.71B | -9.45B | -10.96B | -10.71B | -11.09B |
| Investing Activities Purchase Of Investments | -24.41B | -48.66B | -29.51B | -76.92B | -109.56B |
| Investing Activities Sale Of Investments | 53.80B | 62.35B | 45.51B | 67.36B | 106.48B |
| Investing Activities Other Investing Activity | -1.48B | -1.31B | -1.34B | -2.09B | -385.00M |
| Investing Activities Investing Cash Flow | 15.20B | 2.94B | 3.71B | -22.66B | -14.58B |
| Financing Activities Long Term Debt Issuance | 4.48B | 0.00 | 5.23B | 5.46B | 20.39B |
| Financing Activities Long Term Debt Payments | -10.93B | -9.96B | -11.15B | -9.54B | -8.75B |
| Financing Activities Short Term Debt Issuance | -2.03B | 3.96B | -3.98B | 3.96B | 1.02B |
| Financing Activities Common Stock Repurchase | -90.71B | -94.95B | -77.55B | -89.40B | -85.97B |
| Financing Activities Common Dividends | -15.42B | -15.23B | -15.03B | -14.84B | -14.47B |
| Financing Activities Other Financing Charges | -6.07B | -5.80B | -6.01B | -6.38B | -5.58B |
| Financing Activities Financing Cash Flow | -120.69B | -121.98B | -108.49B | -110.75B | -92.25B |
| End Cash Position | 35.93B | 29.94B | 30.74B | 24.98B | 35.93B |
| Income Tax Paid | 43.37B | 26.10B | 18.68B | 19.57B | 25.39B |
| Free Cash Flow | 98.77B | 108.81B | 99.58B | 111.44B | 92.95B |
| Interest Paid | N/A | N/A | 3.80B | 2.87B | 2.69B |
| Operating Activities Deferred Taxes | N/A | N/A | N/A | 895.00M | -4.77B |
| Investing Activities Net Acquisitions | N/A | N/A | N/A | -306.00M | -33.00M |
| Financing Activities Common Stock Issuance | N/A | N/A | N/A | N/A | 1.10B |
Source: Financial statements and regulatory filings
Technical Analysis
Key Insights
- The current trend direction for Apple Inc. shows a sustained upward momentum with price action maintaining levels above both the 50-day ($261.64) and 200-day ($246.36) moving averages.
- Key support levels are identified near $246.36 (200-day MA) and $169.21 (52-week low), while resistance is observed around $288.62 (52-week high).
- The stock price is above the 10-day, 50-day, and 200-day moving averages, indicating a bullish alignment across short, medium, and long-term timeframes.
- Momentum indicators show the Relative Strength Index (RSI) in a moderate range, MACD exhibiting positive divergence, and Stochastic oscillators suggesting sustained buying interest without overbought conditions.
- Multi-timeframe analysis reveals consistent strength in daily, weekly, and monthly charts, supporting a stable upward trend with periodic consolidations.
- Potential market scenarios include continuation of the upward trend if support levels hold, or corrective pullbacks if resistance near the 52-week high proves strong.
Trending News
1. Headline: With the MacBook Neo, Apple Made the Perfect AI Computer
Summary: Inc. PremiumMoneyCoterie Turned a Dirty Product Into a Premium Brand, Then Scored a Major Sale · LeadMove Over, Unlimited PTO: The New Must-Have AI Perk Taking Over Silicon Valley · GrowShe Lost $75,000 on a Startup—Then Built Mrs. Meyer’s Into a Category-Defining Brand · MoneyIf These 3 Big IPOs Happen, No One Else May Have a Shot ... Apple...
Sentiment: positive
2. Headline: Apple Inc. $AAPL Shares Sold by Neville Rodie & Shaw Inc.
Summary: Neville Rodie & Shaw Inc. decreased its position in shares of Apple Inc. (NASDAQ:AAPL - Free Report) by 1.6% during the 4th quarter, according to its most recent filing with the Securities and Exchange Commission (SEC). The fund owned 453,983 shares of the iPhone maker's stock after selling 7,197 s
Sentiment: negative
3. Headline: Apple Inc. $AAPL Stake Increased by LifeGuide Financial Advisors LLC
Summary: LifeGuide Financial Advisors LLC boosted its stake in Apple Inc. (NASDAQ:AAPL - Free Report) by 146.4% during the 4th quarter, according to its most recent Form 13F filing with the Securities and Exchange Commission (SEC). The institutional investor owned 9,101 shares of the iPhone maker's stock a
Sentiment: positive
4. Headline: 8,222 Shares in Apple Inc. $AAPL Acquired by Holos Integrated Wealth LLC
Summary: Holos Integrated Wealth LLC bought a new position in shares of Apple Inc. (NASDAQ:AAPL - Free Report) in the fourth quarter, according to the company in its most recent disclosure with the Securities & Exchange Commission. The institutional investor bought 8,222 shares of the iPhone maker's st
Sentiment: neutral
5. Headline: Apple Inc. $AAPL Shares Purchased by GoalVest Advisory LLC
Summary: GoalVest Advisory LLC boosted its holdings in shares of Apple Inc. (NASDAQ:AAPL - Free Report) by 24.1% during the 4th quarter, according to its most recent 13F filing with the SEC. The fund owned 13,486 shares of the iPhone maker's stock after purchasing an additional 2,618 shares during the perio
Sentiment: positive
6. Headline: Apple Stock Is Doing Something It Hasn't Done Since 2022. Should You Buy or Run? | The Motley Fool
Summary: Apple ended the quarter with $45.3 billion in cash and cash equivalents, up from $30.3 billion a year ago. The company reported $54 billion in operating cash flow, and returned nearly $32 billion to shareholders through dividends and stock repurchases. It issued guidance for the second quarter for revenue to continue to grow at a rate of 13% to 16%. The company is continuing to roll out new products, including ...
Sentiment: positive
7. Headline: Apple Inc. $AAPL is Narus Financial Partners LLC's 5th Largest Position
Summary: Narus Financial Partners LLC reduced its stake in Apple Inc. (NASDAQ:AAPL - Free Report) by 43.4% during the third quarter, according to the company in its most recent Form 13F filing with the Securities and Exchange Commission. The fund owned 10,532 shares of the iPhone maker's stock after selling
Sentiment: negative
8. Headline: Apple Inc. $AAPL is Mirabella Financial Services LLP's 9th Largest Position
Summary: Mirabella Financial Services LLP boosted its holdings in shares of Apple Inc. (NASDAQ:AAPL - Free Report) by 118.6% during the third quarter, according to the company in its most recent disclosure with the Securities & Exchange Commission. The institutional investor owned 92,027 shares of the
Sentiment: positive
9. Headline: Is Apple Stock Going to $500? Here's What Has to Happen. | The Motley Fool
Summary: Apple's (AAPL 0.38%) past is defined by its winning performance. Shares have skyrocketed a jaw-dropping 953%, including dividends, in the last decade (as of March 17). This is impressive given the scale of the business.
Sentiment: positive
10. Headline: Halide co-founder is suing former partner Sebastiaan de With for taking source code to Apple
Summary: Sebastiaan de With was allegedly fired for financial misconduct before joining Apple. ... Halide running on an iPhone. Photo: Allison Johnson / The Verge ... See All by Terrence O'Brien is the Verge’s weekend editor. He has over 18 years of experience, including 10 years as managing editor ...
Sentiment: neutral
Recent Updates
News Summary
Recent news highlights Apple's strategic advancements and investor activity. The launch of the MacBook Neo emphasizes Apple's focus on AI-enabled computing, broadening its product appeal. Institutional investors have shown mixed activity, with some increasing stakes significantly, such as LifeGuide Financial Advisors LLC and Commons Capital LLC, while others have reduced holdings. Security enhancements on the iPhone through Background Security Improvements reflect Apple's commitment to user privacy and software robustness. Market attention remains high, with coverage emphasizing Apple's strong cash position and ongoing product innovation. These developments collectively underscore Apple's dynamic positioning amid evolving technology trends and investor interest.
News Sentiment
Overall sentiment skews positive, with multiple reports highlighting product innovation, institutional accumulation, and operational strength. Neutral and negative sentiments are limited to minor institutional share reductions, suggesting cautious portfolio adjustments rather than broad concerns. The prevailing positive tone supports a constructive view of Apple's current market and strategic environment.
Analytical Overview
Analysis Summary
Apple's valuation metrics, including a trailing P/E of 31.5 and forward P/E of 26.7, are elevated relative to the industry average of 31.5, indicating a premium pricing consistent with its market leadership. The PEG ratio of 1.73 suggests moderate growth expectations priced in.
Revenue growth of 15.7% quarterly and positive earnings growth reflect a strong growth trajectory supported by robust cash flow generation, with operating cash flow exceeding $135 billion and free cash flow over $106 billion.
Financial health is solid with a total debt to equity ratio of approximately 102.6%, balanced by substantial cash reserves of $66.9 billion, and a current ratio near 0.97, indicating adequate liquidity.
Sector-specific opportunities include expanding AI integration and services growth, while challenges involve maintaining innovation pace and managing premium valuation in a competitive technology environment.
Consideration of market positioning and competitive advantages highlights Apple’s extensive ecosystem, brand strength, and diversified revenue streams as key factors supporting resilience.
Investment Conclusion
Supporting Factors: Primary supporting factors include strong revenue and earnings growth, robust cash flow generation, and a dominant market position with diversified products and services.
Risk Factors: Main risk factors to monitor encompass high valuation multiples, competitive pressures in consumer electronics, and potential shifts in institutional ownership.
SWOT Analysis
Strengths
- Market leadership with a strong global brand and ecosystem integration.
- Robust cash flow generation supporting innovation and shareholder returns.
- Diverse product portfolio including hardware, software, and services.
- High operating and profit margins reflecting operational efficiency.
Weaknesses
- Premium valuation metrics may limit near-term upside potential.
- High debt-to-equity ratio relative to cash reserves requires monitoring.
- Dependence on flagship products like the iPhone for majority of revenue.
- Current ratio below 1 indicates tight short-term liquidity.
Opportunities
- Expansion of AI-enabled products and services such as MacBook Neo.
- Growth in subscription-based digital services and cloud offerings.
- Increasing institutional investor interest supporting capital access.
- Potential market share gains through innovation and ecosystem enhancements.
Threats
- Intense competition in consumer electronics and technology sectors.
- Market sensitivity to valuation adjustments and economic cycles.
- Regulatory scrutiny and geopolitical risks impacting global operations.
- Shifts in consumer preferences affecting product demand.
Company Description
Apple Inc. is a leading technology company renowned for designing, manufacturing, and marketing innovative hardware and software products for consumers and businesses worldwide. Its flagship product, the iPhone, accounts for the majority of sales, serving as the central hub of an expansive ecosystem that includes Mac computers, iPad tablets, Apple Watch wearables, and accessories like AirPods. Apple Inc. also offers a suite of services such as the App Store, Apple Music, iCloud, Apple TV+, and Apple Fitness+, providing digital content, cloud storage, and subscription-based platforms. Operating in the consumer electronics industry within the technology sector, the company employs approximately 166,000 people and maintains a broad global presence through online stores, retail outlets, and partnerships with carriers and resellers. With a substantial market capitalization reflecting its scale, Apple Inc. plays a pivotal role in shaping consumer technology trends, emphasizing seamless integration across devices and services to enhance user experience and productivity.