
Apple Inc (AAPL)
Stock Analysis Report
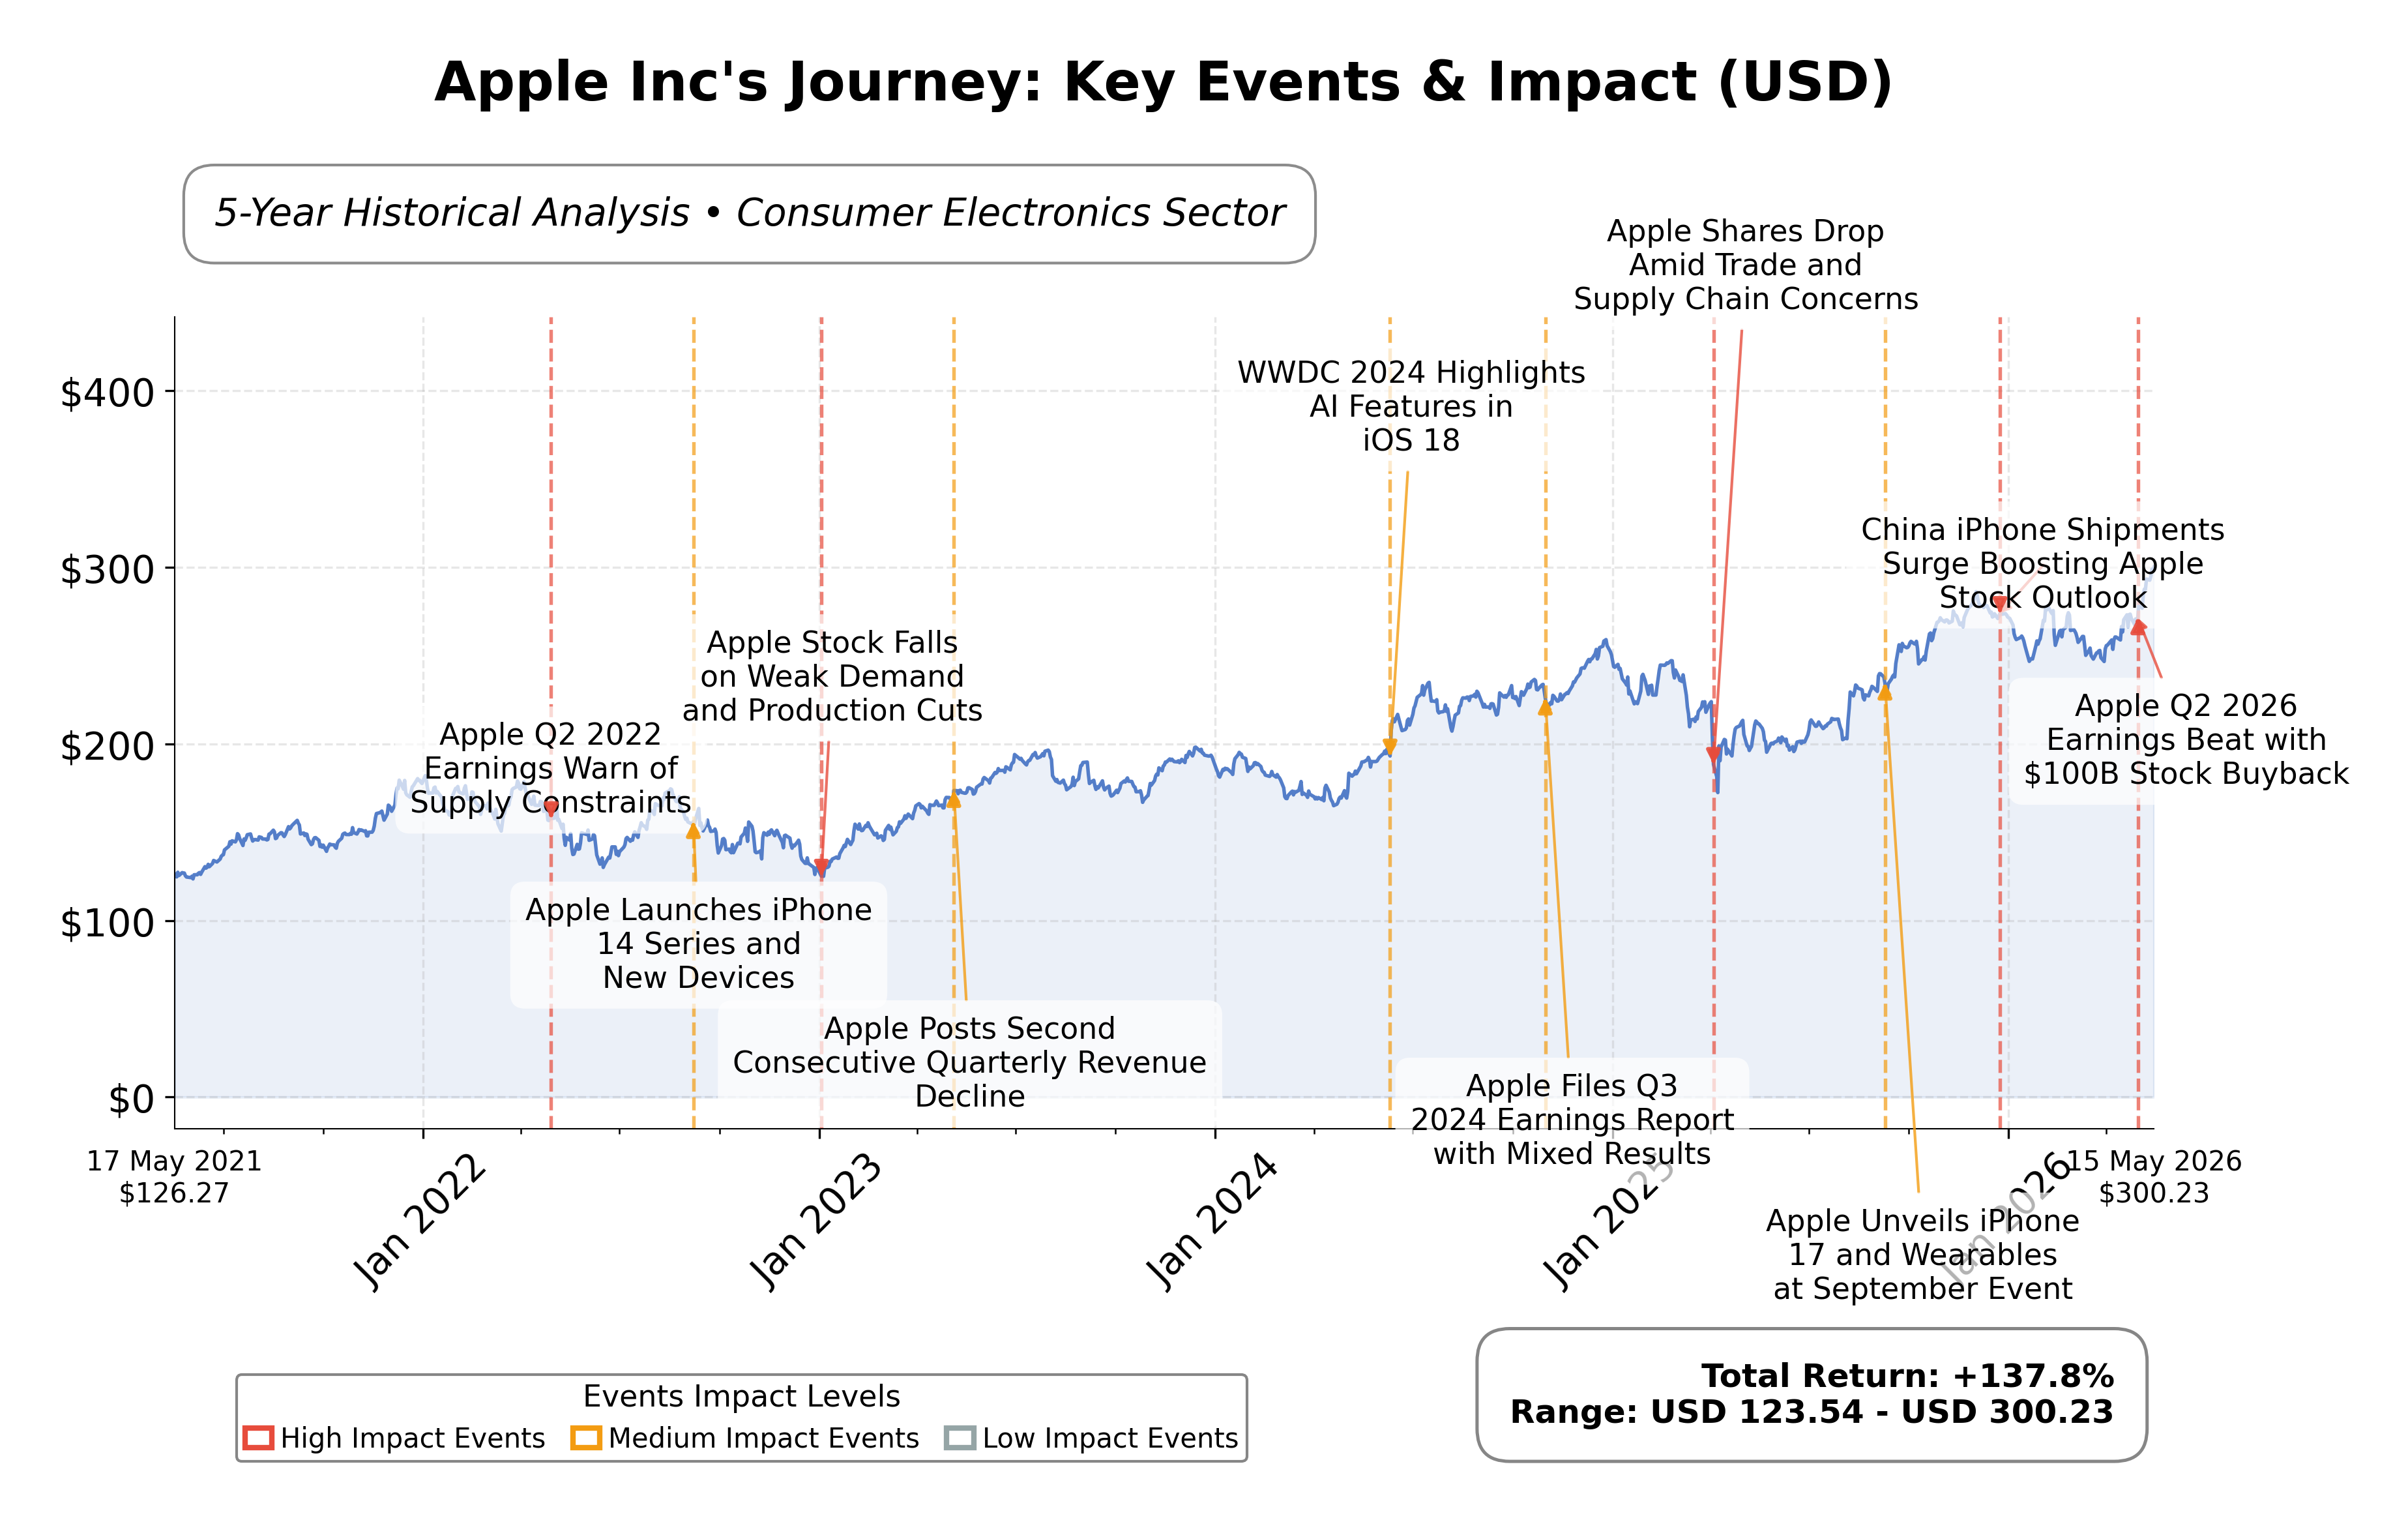
Stock Journey
Key Positives and Key Risks
Pros
- Strong revenue growth of 16.6% quarterly indicates robust business expansion.
- Free cash flow of $101.1 billion supports financial flexibility and shareholder returns.
- Market capitalization of $4.31 trillion reflects dominant industry positioning.
Cons
- High P/B ratio of 40.40 suggests the stock is trading at a significant premium.
- Debt-to-equity ratio near 79.55% indicates elevated financial leverage.
- Legal uncertainties with OpenAI could impact AI-related growth initiatives.
Disclosure: This information is for general awareness and does not constitute investment advice
Report Summary
Apple Inc. operates as a leading technology company specializing in the design, manufacture, and marketing of consumer electronics and software products. Listed on NASDAQ under the technology sector, Apple’s flagship product is the iPhone, which anchors a broad ecosystem including Mac computers, iPads, Apple Watch, and services such as the App Store and Apple Music. The company maintains a significant global footprint with a workforce of approximately 166,000 employees and extensive retail and online distribution channels. Its market positioning is strong within the consumer electronics industry, emphasizing integrated hardware and software solutions.
Financially, Apple reported trailing twelve months (TTM) revenue of approximately $451.4 billion, with a gross margin of 49.27%, operating margin of 32.28%, and net profit margin of 27.15%. The company’s return on equity (ROE) stands at 141.47%, and return on assets (ROA) at 26.23%, indicating highly efficient use of equity and assets to generate profits. Operating cash flow totaled $140.2 billion TTM, with free cash flow of $101.1 billion, underscoring strong cash generation capabilities supporting its operations and shareholder returns.
Valuation metrics show a trailing price-to-earnings (P/E) ratio of 35.47 and a forward P/E of 30.68, reflecting market expectations of continued earnings growth. The price-to-book (P/B) ratio is notably high at 40.40, consistent with Apple’s premium valuation status. Enterprise value to EBITDA stands at 27.03. The market capitalization is approximately $4.31 trillion, with the stock currently trading at $300.22, near its 52-week high of $294.76, indicating strong market momentum and investor confidence.
Apple’s strengths include robust cash flow, a manageable debt level with a total debt to equity ratio of 79.55%, and dominant market leadership in consumer electronics. Key risks involve regulatory scrutiny, competitive pressures in technology innovation, and recent legal tensions with OpenAI that could affect AI-related collaborations. Recent strategic developments include major software updates enhancing user experience and ongoing partnerships in chip production, such as potential collaboration with Intel.
Technically, Apple’s stock is in a strong uptrend, trading well above key moving averages with momentum indicators signaling overbought conditions. Recent news highlights both positive momentum from product innovation and cautious sentiment due to legal uncertainties. The overall data suggests a market environment that favors continued interest and monitoring, balancing growth potential with emerging risks.
Company and Industry Overview
Company Basics
Price Performance
Company Size
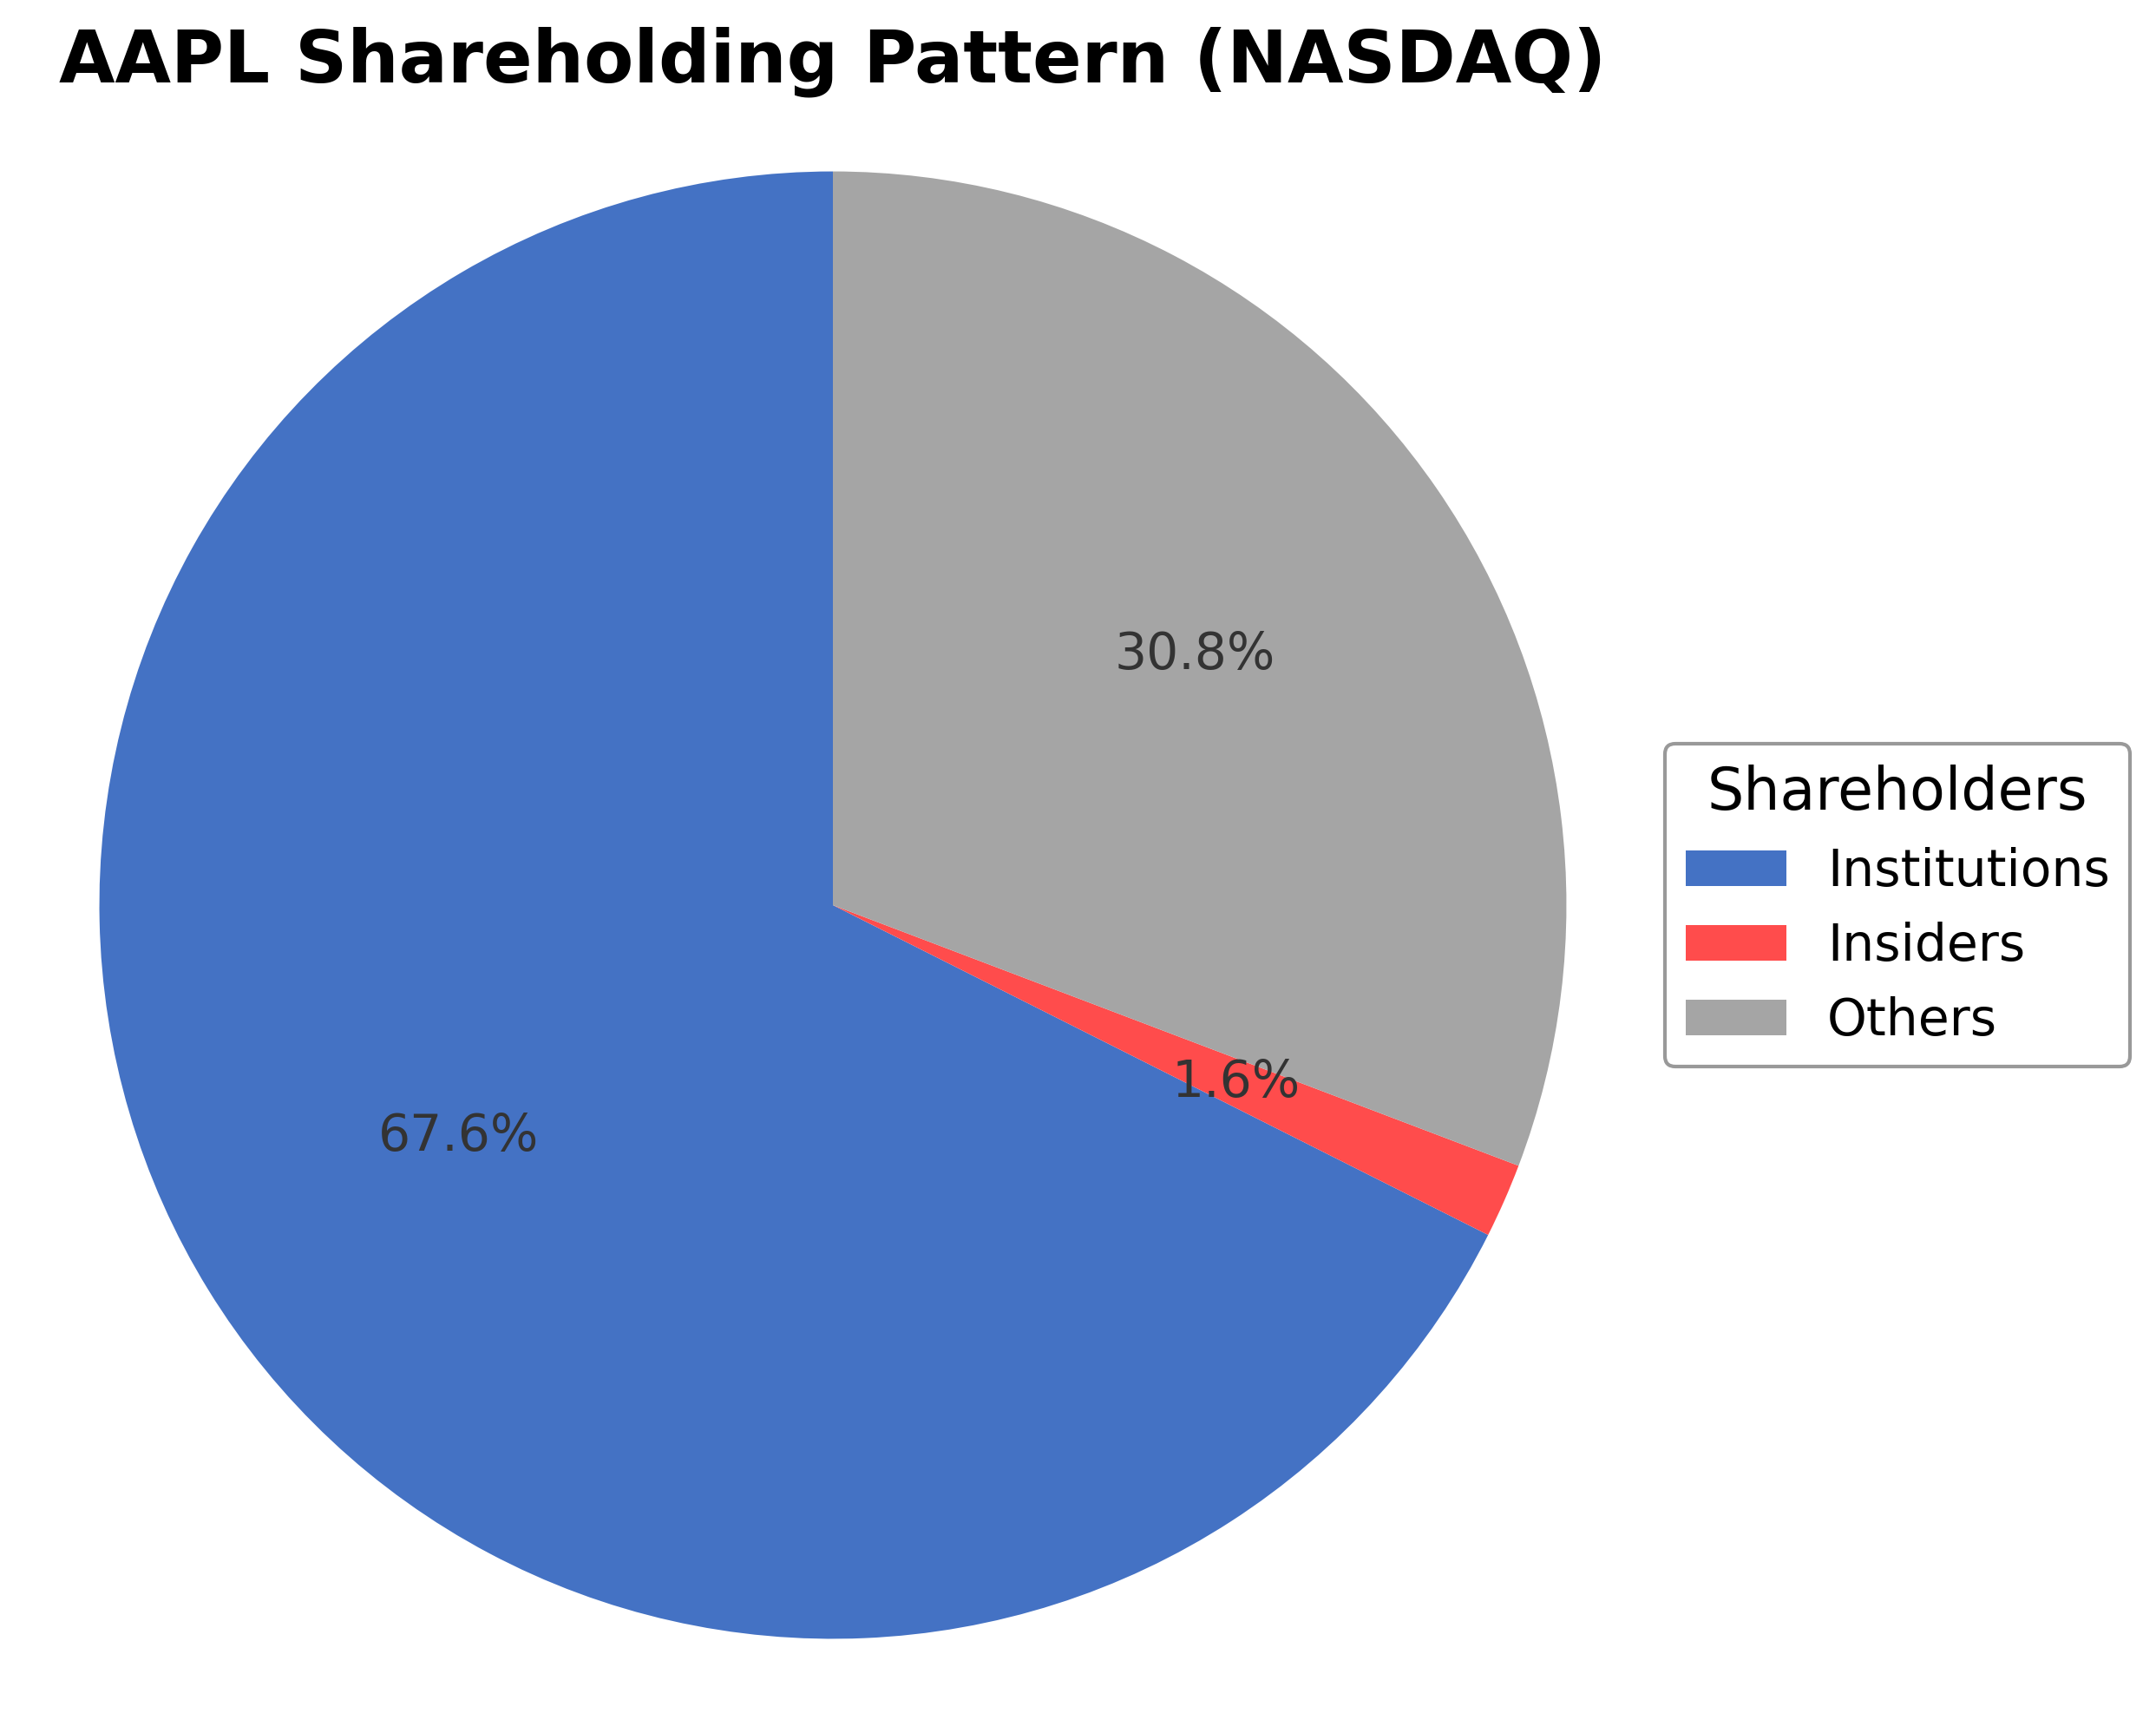
Shareholding Pattern
Sector and Industry Analysis
The global apple sector is a significant segment within the broader agricultural industry, encompassing cultivation, harvesting, distribution, and retail of diverse apple varieties. The market is experiencing steady growth driven by rising health awareness and demand for organic produce, with projections extending through 2034 across key regions including North America, Europe, and Asia-Pacific. Major players range from multinational corporations to local producers, competing to capture market share in both fresh and processed apple products.
Emerging trends in the apple industry include increased consumer preference for organic and locally sourced apples, advancements in cultivation techniques, and innovations in packaging and storage that extend shelf life. Competitive dynamics are shaped by technological adoption such as smart farming and data analytics, alongside challenges like climate change and fluctuating trade tariffs. Barriers to entry include stringent food safety standards and the need for capital-intensive investments in resilient agricultural practices and supply chain efficiencies.
The regulatory environment is increasingly focused on food safety, quality assurance, and sustainability, with stricter standards impacting production and trade practices globally. Policies related to carbon pricing and energy security also influence operational costs and supply chain strategies. Trade agreements and geopolitical factors further affect market access and pricing, prompting industry participants to adapt through strategic partnerships and compliance with evolving regulations to maintain competitiveness.
Note: Analysis synthesized from industry research, market reports, and regulatory filings. Information is subject to change based on market conditions.
Financial Ratios Dashboard
Illustrative Scenario Analysis
DCF Assumptions:
Method: Two-Stage EPS-Priority Model
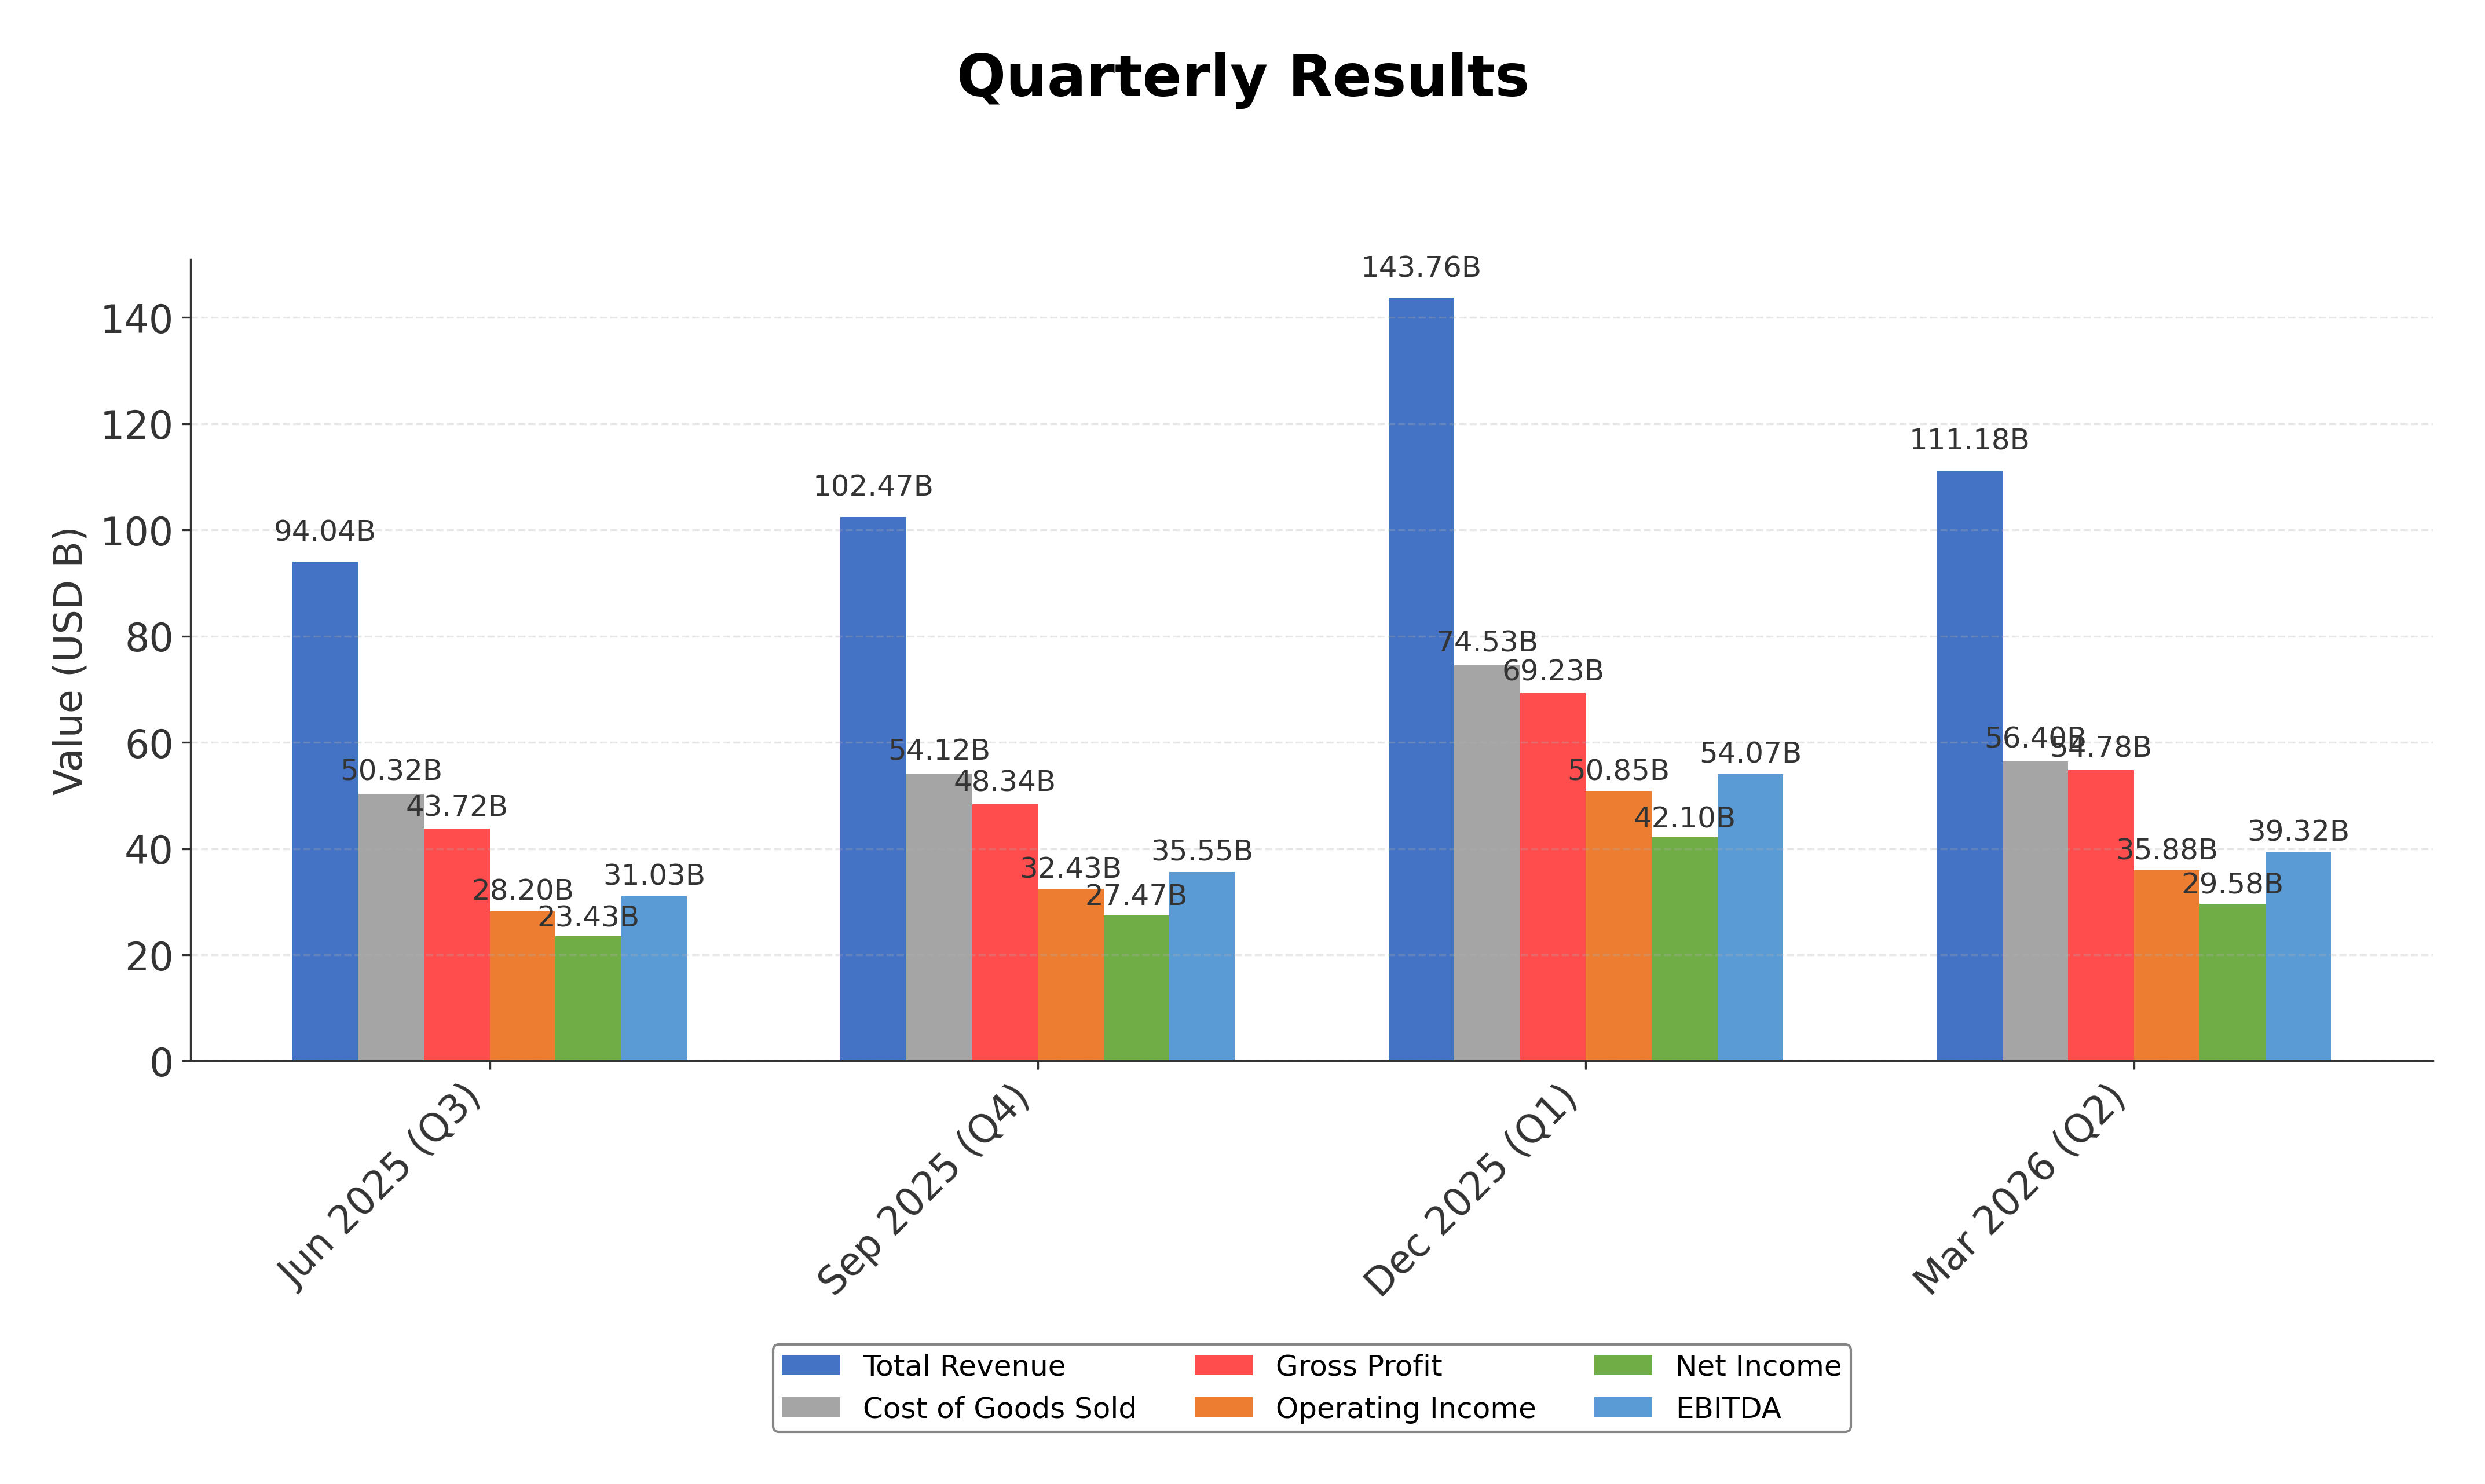
Financials
Peer Analysis
| Company Name | Market Cap | P/E Ratio | P/B Ratio | EV/EBITDA | Price to CFO |
|---|---|---|---|---|---|
| Apple Inc | $4.31T | 35.47 | 40.40 | 27.03 | 30.72 |
| Sony Group Corporation - Sponsored American Depositary Receipt | $119.04B | 18.32 | 2.32 | -0.01 | 9.59 |
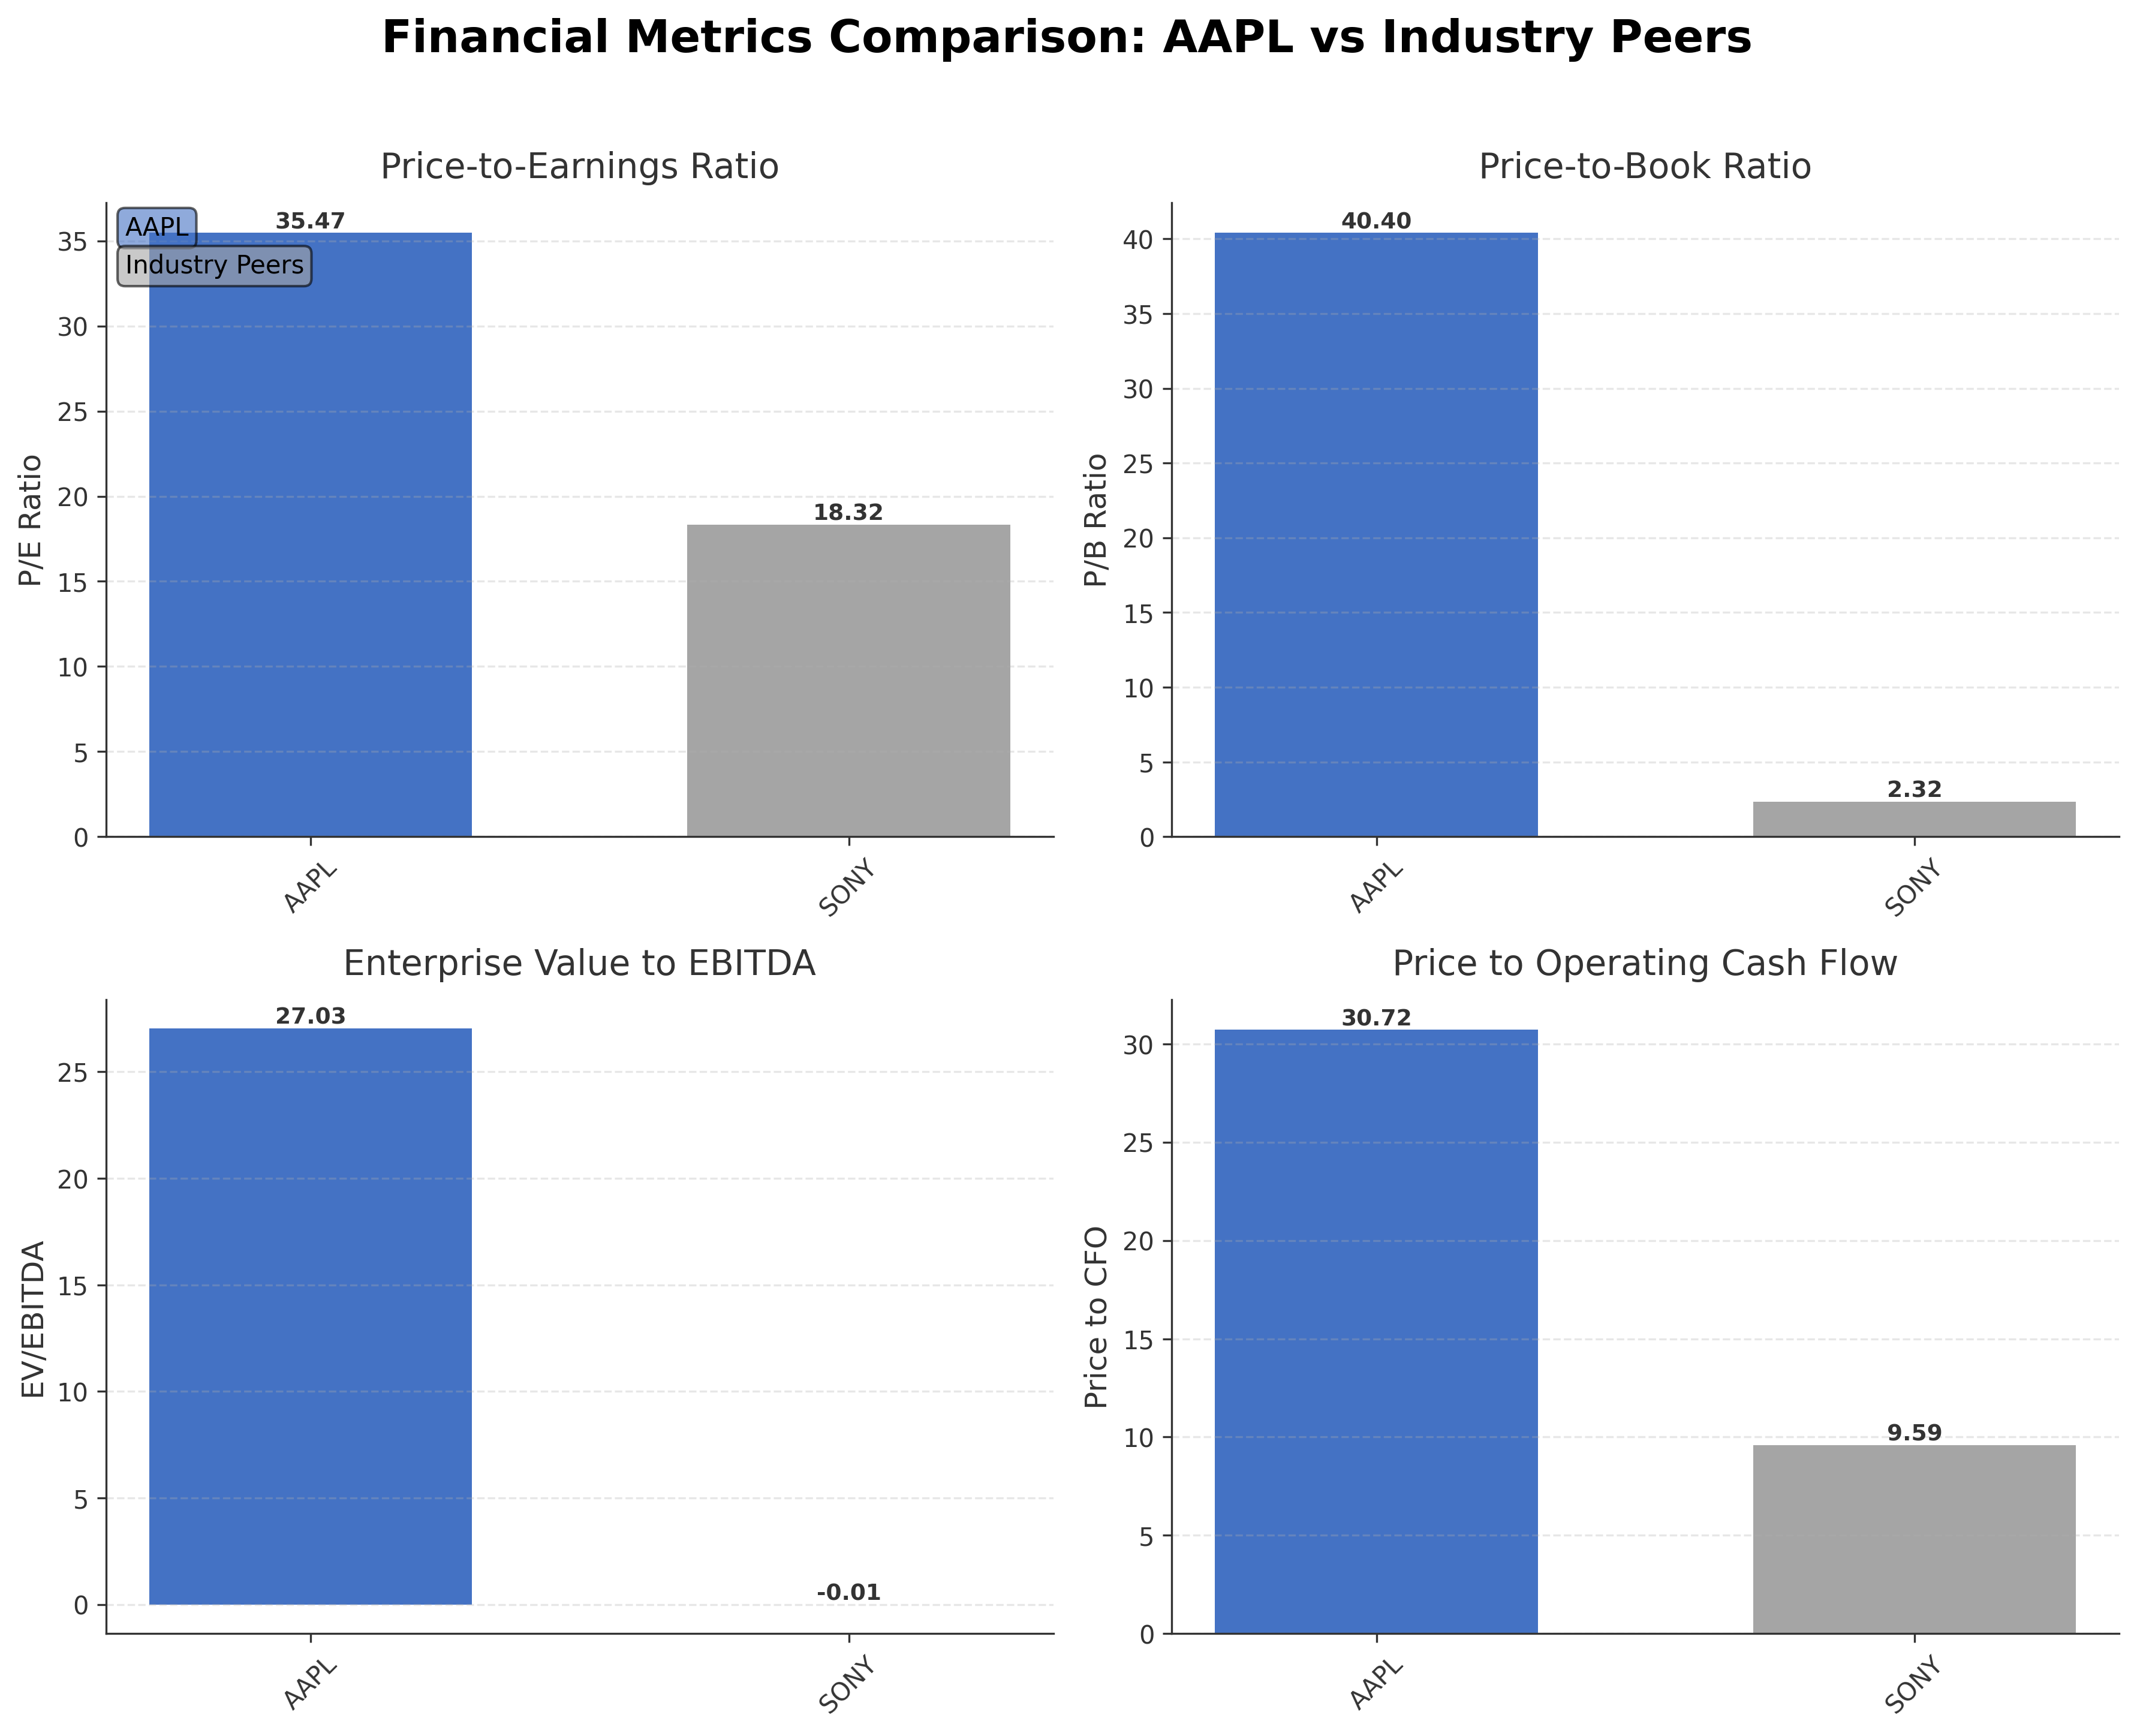
Comparison Analysis: Apple Inc. significantly outpaces its peer Sony Group Corporation in market capitalization, with a valuation exceeding $4 trillion compared to Sony's $119 billion. Apple's P/E ratio of 35.47 is nearly double Sony's 18.32, reflecting higher growth expectations and premium market positioning. The P/B ratio for Apple is substantially higher at 40.40 versus Sony's 2.32, indicating a strong market premium on Apple's equity. Enterprise value to EBITDA for Apple stands at 27.03, while Sony's is negative, suggesting differences in profitability and capital structure. Apple's return on equity of 1.41% surpasses Sony's 0.12%, highlighting superior efficiency in generating shareholder returns. Overall, Apple demonstrates dominant financial metrics and valuation multiples relative to its regional industry peer.
Financial Metrics Comparison with Peers
Financial Statements
Comprehensive financial data including income, balance sheet, and cash flow metrics
Income Statement
| fiscal_date | 2025-09-30 | 2024-09-30 | 2023-09-30 | 2022-09-30 | 2021-09-30 |
|---|---|---|---|---|---|
| Sales | 416.16B | 391.04B | 383.29B | 394.33B | 365.82B |
| Cost Of Goods | 220.96B | 210.35B | 214.14B | 223.55B | 212.98B |
| Gross Profit | 195.20B | 180.68B | 169.15B | 170.78B | 152.84B |
| Operating Expense Research And Development | 34.55B | 31.37B | 29.91B | 26.25B | 21.91B |
| Operating Expense Selling General And Administrative | 27.60B | 26.10B | 24.93B | 25.09B | 21.97B |
| Operating Income | 133.05B | 123.22B | 114.30B | 119.44B | 108.95B |
| Other Income Expense | -321.00M | 269.00M | -565.00M | -334.00M | 60.00M |
| Pretax Income | 132.73B | 123.48B | 113.74B | 119.10B | 109.21B |
| Income Tax | 20.72B | 29.75B | 16.74B | 19.30B | 14.53B |
| Net Income | 112.01B | 93.74B | 97.00B | 99.80B | 94.68B |
| Eps Basic | 7.49 | 6.11 | 6.16 | 6.15 | 5.67 |
| Eps Diluted | 7.46 | 6.08 | 6.13 | 6.11 | 5.61 |
| Basic Shares Outstanding | 14.95B | 15.34B | 15.74B | 16.22B | 16.70B |
| Diluted Shares Outstanding | 14.95B | 15.34B | 15.74B | 16.22B | 16.70B |
| Ebit | 133.05B | 123.22B | 114.30B | 119.44B | 111.85B |
| Ebitda | 144.75B | 134.66B | 125.82B | 130.54B | 123.14B |
| Net Income Continuous Operations | 112.01B | 93.74B | 97.00B | 99.80B | 94.68B |
| Non Operating Interest Income | N/A | N/A | 3.75B | 2.83B | 2.84B |
| Non Operating Interest Expense | N/A | N/A | 3.93B | 2.93B | 2.65B |
Source: Financial statements and regulatory filings
Balance Sheet
| fiscal_date | 2025-09-30 | 2024-09-30 | 2023-09-30 | 2022-09-30 | 2021-09-30 |
|---|---|---|---|---|---|
| Cash And Cash Equivalents | 35.93B | 29.94B | 29.96B | 23.65B | 34.94B |
| Accounts Receivable | 39.78B | 33.41B | 29.51B | 28.18B | 26.28B |
| Total Assets | 359.24B | 364.98B | 352.58B | 352.75B | 351.00B |
| Total Liabilities | 285.51B | 308.03B | 290.44B | 302.08B | 287.91B |
| Long Term Debt | 78.33B | 85.75B | 95.28B | 109.71B | 119.38B |
| Shareholders Equity | 73.73B | 56.95B | 62.15B | 50.67B | 63.09B |
Source: Financial statements and regulatory filings
Cash Flow Statement
| fiscal_date | 2025-09-30 | 2024-09-30 | 2023-09-30 | 2022-09-30 | 2021-09-30 |
|---|---|---|---|---|---|
| Operating Activities Net Income | 112.01B | 93.74B | 97.00B | 99.80B | 94.68B |
| Operating Activities Depreciation | 11.70B | 11.45B | 11.52B | 11.10B | 11.28B |
| Operating Activities Stock Based Compensation | 12.86B | 11.69B | 10.83B | 9.04B | 7.91B |
| Operating Activities Other Non Cash Items | -89.00M | -2.27B | -2.23B | 1.01B | -4.92B |
| Operating Activities Accounts Receivable | -7.03B | -5.14B | -417.00M | -9.34B | -14.03B |
| Operating Activities Accounts Payable | 902.00M | 6.02B | -1.89B | 9.45B | 12.33B |
| Operating Activities Other Assets Liabilities | -18.87B | 2.77B | -4.27B | 1.57B | -1.53B |
| Operating Activities Operating Cash Flow | 111.48B | 118.25B | 110.54B | 123.52B | 100.94B |
| Investing Activities Capital Expenditures | -12.71B | -9.45B | -10.96B | -10.71B | -11.09B |
| Investing Activities Purchase Of Investments | -24.41B | -48.66B | -29.51B | -76.92B | -109.56B |
| Investing Activities Sale Of Investments | 53.80B | 62.35B | 45.51B | 67.36B | 106.48B |
| Investing Activities Other Investing Activity | -1.48B | -1.31B | -1.34B | -2.09B | -385.00M |
| Investing Activities Investing Cash Flow | 15.20B | 2.94B | 3.71B | -22.66B | -14.58B |
| Financing Activities Long Term Debt Issuance | 4.48B | 0.00 | 5.23B | 5.46B | 20.39B |
| Financing Activities Long Term Debt Payments | -10.93B | -9.96B | -11.15B | -9.54B | -8.75B |
| Financing Activities Short Term Debt Issuance | -2.03B | 3.96B | -3.98B | 3.96B | 1.02B |
| Financing Activities Common Stock Repurchase | -90.71B | -94.95B | -77.55B | -89.40B | -85.97B |
| Financing Activities Common Dividends | -15.42B | -15.23B | -15.03B | -14.84B | -14.47B |
| Financing Activities Other Financing Charges | -6.07B | -5.80B | -6.01B | -6.38B | -5.58B |
| Financing Activities Financing Cash Flow | -120.69B | -121.98B | -108.49B | -110.75B | -92.25B |
| End Cash Position | 35.93B | 29.94B | 30.74B | 24.98B | 35.93B |
| Income Tax Paid | 43.37B | 26.10B | 18.68B | 19.57B | 25.39B |
| Free Cash Flow | 98.77B | 108.81B | 99.58B | 111.44B | 92.95B |
| Interest Paid | N/A | N/A | 3.80B | 2.87B | 2.69B |
| Operating Activities Deferred Taxes | N/A | N/A | N/A | 895.00M | -4.77B |
| Investing Activities Net Acquisitions | N/A | N/A | N/A | -306.00M | -33.00M |
| Financing Activities Common Stock Issuance | N/A | N/A | N/A | N/A | 1.10B |
Source: Financial statements and regulatory filings
Technical Analysis
Key Insights
- Apple's stock is exhibiting a strong upward trend with price action breaking above prior resistance levels, indicating bullish momentum.
- Key support levels are identified near $260 and $257, corresponding to the 50-day and 200-day moving averages, while resistance is observed near the recent high of $295.
- The stock is trading significantly above its 10-day, 50-day, and 200-day moving averages, with the 20-day SMA positioned above the 50-day SMA, confirming a bullish alignment.
- Momentum indicators show an RSI of 73.27, signaling overbought conditions; MACD remains positive, and stochastic oscillators indicate potential short-term pullback risks.
- Multi-timeframe analysis reveals consistent bullish trends on daily, weekly, and monthly charts, with the golden cross formed in September 2025 supporting long-term strength.
- Current technical setup suggests potential scenarios of continued upward momentum tempered by possible short-term corrections due to overbought signals.
Trending News
1. Headline: Viking Global Investors Lp Reports Share Stake Of 3.6 Million Shares In Apple - SEC Filing — TradingView News
Summary: Search · Get started · Viking Global Investors Lp Reports Share Stake Of 3.6 Million Shares In Apple - SEC Filing · RefinitivLess than 1 min read · AAPLMETATSLA · Login or create a forever free account to read this news · Let's go · Compare charts · Analyze on Supercharts · Latest news
Sentiment: neutral
2. Headline: Intel Stock (NASDAQ:INTC) Plunges as Apple Deal Looks Focused on Legacy Chips - TipRanks.com
Summary: Chip stock Intel ($INTC) was on top of the world recently as word emerged that Apple ($AAPL) was looking to team up with Intel to produce chips. New reports suggest...
Sentiment: positive
3. Headline: Rep. John McGuire Purchases Shares of Apple Inc. (NASDAQ:AAPL)
Summary: Representative John McGuire (Republican-Virginia) recently bought shares of Apple Inc. (NASDAQ:AAPL). In a filing disclosed on May 13th, the Representative disclosed that they had bought between $1,001 and $15,000 in Apple stock on April 15th. The trade occurred in the Representative's "MERRILL LYNC
Sentiment: neutral
4. Headline: Cerebras IPO Stock Pop; Apple-OpenAI Drama — The Information
Summary: This was quite the day. OpenAI is jumping up and down about its unhappiness with Apple (it’s doubtful Tim Cook is shaking in his boots). Big telecom threw down the gauntlet to Elon Musk and Amazon (not that they should worry). We get to both news items lower down.
Sentiment: negative
5. Headline: Apple stock keeps surging to new highs — it’s more than just the iPhone
Summary: Apple stock continues to hit new record highs, extending this year’s impressive rebound. Evercore ISI sees the momentum continuing for some time, and it’s about more than just iPhone sales. Analyst Amit Daryanani raised his price target for Apple to $365 from $330 on Thursday, implying roughly 22% upside from today. ... Daryanani’s increased ...
Sentiment: positive
Recent Updates
News Summary
As of 2026-05-13. Apple is preparing a significant update to its iPhone software, featuring a redesigned Camera app that allows users to customize controls and layouts, enhancing both casual and professional user experiences. The update also introduces a new Siri mode leveraging visual intelligence and conversational capabilities, integrating options to select between Siri, ChatGPT, or Gemini for search results. Concurrently, Apple’s stock is exhibiting strong momentum, trading well above key moving averages and challenging resistance levels. However, OpenAI is reportedly considering legal action against Apple regarding the integration of ChatGPT within Apple's ecosystem, which introduces uncertainty around AI collaborations and may affect investor sentiment. These developments highlight Apple's ongoing innovation efforts alongside emerging legal challenges in the AI domain.
News Sentiment
The overall sentiment from recent updates is mixed but leans positive due to Apple's continued product innovation and strong stock performance. The planned software enhancements and user experience improvements contribute positively to market perception. Conversely, the potential legal dispute with OpenAI introduces a degree of caution, reflecting risks related to AI partnerships and regulatory scrutiny. Institutional interest remains stable, supporting confidence in Apple's strategic direction. The balance of innovation-driven optimism and legal uncertainties suggests a nuanced outlook for the company.
Source List
- https://stocktwits.com/news-articles/markets/equity/aapl-stock-slips-from-record-highs-as-legal-action-threatens-open-ai-alliance-report/cZX16MNReSW
Analytical Overview
Analysis Summary
Apple's valuation metrics, including a trailing P/E of 35.47 and forward P/E of 30.68, are elevated relative to the consumer electronics industry average of approximately 35.47, reflecting premium pricing based on growth expectations. The PEG ratio of 1.58 suggests reasonable valuation relative to earnings growth. Revenue growth stands at 16.6% quarterly, supported by strong cash flow trends with operating cash flow of $140.2 billion and free cash flow of $101.1 billion, indicating robust financial health and operational efficiency. The company maintains a manageable debt profile with a debt-to-equity ratio of 79.55%, supported by a current ratio of 1.07, reflecting adequate liquidity. Sector-specific challenges include intense competition and regulatory scrutiny, while opportunities arise from AI integration and expanding services. Market positioning and competitive advantages are strong, with a diversified product ecosystem and significant institutional ownership supporting governance and strategic initiatives.
Overall Business and Market Assessment
Supporting Factors: Apple's strong revenue growth of 16.6% and substantial free cash flow generation exceeding $100 billion, which underpin operational strength
Risk Factors: the ongoing legal dispute with OpenAI and high valuation multiples that may limit upside
SWOT Analysis
Strengths
- Market leadership in consumer electronics with a diversified product ecosystem.
- Strong profitability with gross margin near 49.3% and net margin over 27%.
- Robust cash flow generation supporting innovation and shareholder returns.
- High institutional ownership ensuring governance and strategic oversight.
Weaknesses
- High price-to-book ratio indicating premium valuation and potential overvaluation.
- Relatively high debt-to-equity ratio at nearly 80%, increasing financial leverage.
- Limited insider ownership which may reduce direct executive alignment with shareholders.
- Dependence on iPhone sales for a significant portion of revenue.
Opportunities
- Expansion of AI capabilities and services enhancing product differentiation.
- Growth in subscription-based services and digital content platforms.
- Potential strategic partnerships in chip manufacturing improving supply chain control.
- Increasing adoption of wearable technology and accessories.
Threats
- Legal challenges from OpenAI potentially impacting AI collaborations.
- Intense competition in technology and consumer electronics sectors.
- Regulatory scrutiny in multiple jurisdictions affecting operational flexibility.
- Macroeconomic factors influencing consumer spending on premium devices.
Company Description
Apple Inc. is a leading technology company renowned for designing, manufacturing, and marketing innovative hardware and software products for consumers and businesses worldwide. Its flagship product, the iPhone, accounts for the majority of sales, serving as the central hub of an expansive ecosystem that includes Mac computers, iPad tablets, Apple Watch wearables, and accessories like AirPods. Apple Inc. also offers a suite of services such as the App Store, Apple Music, iCloud, Apple TV+, and Apple Fitness+, providing digital content, cloud storage, and subscription-based platforms. Operating in the consumer electronics industry within the technology sector, the company employs approximately 166,000 people and maintains a broad global presence through online stores, retail outlets, and partnerships with carriers and resellers. With a substantial market capitalization reflecting its scale, Apple Inc. plays a pivotal role in shaping consumer technology trends, emphasizing seamless integration across devices and services to enhance user experience and productivity.