
Apple Inc (AAPL)
Stock Analysis Report
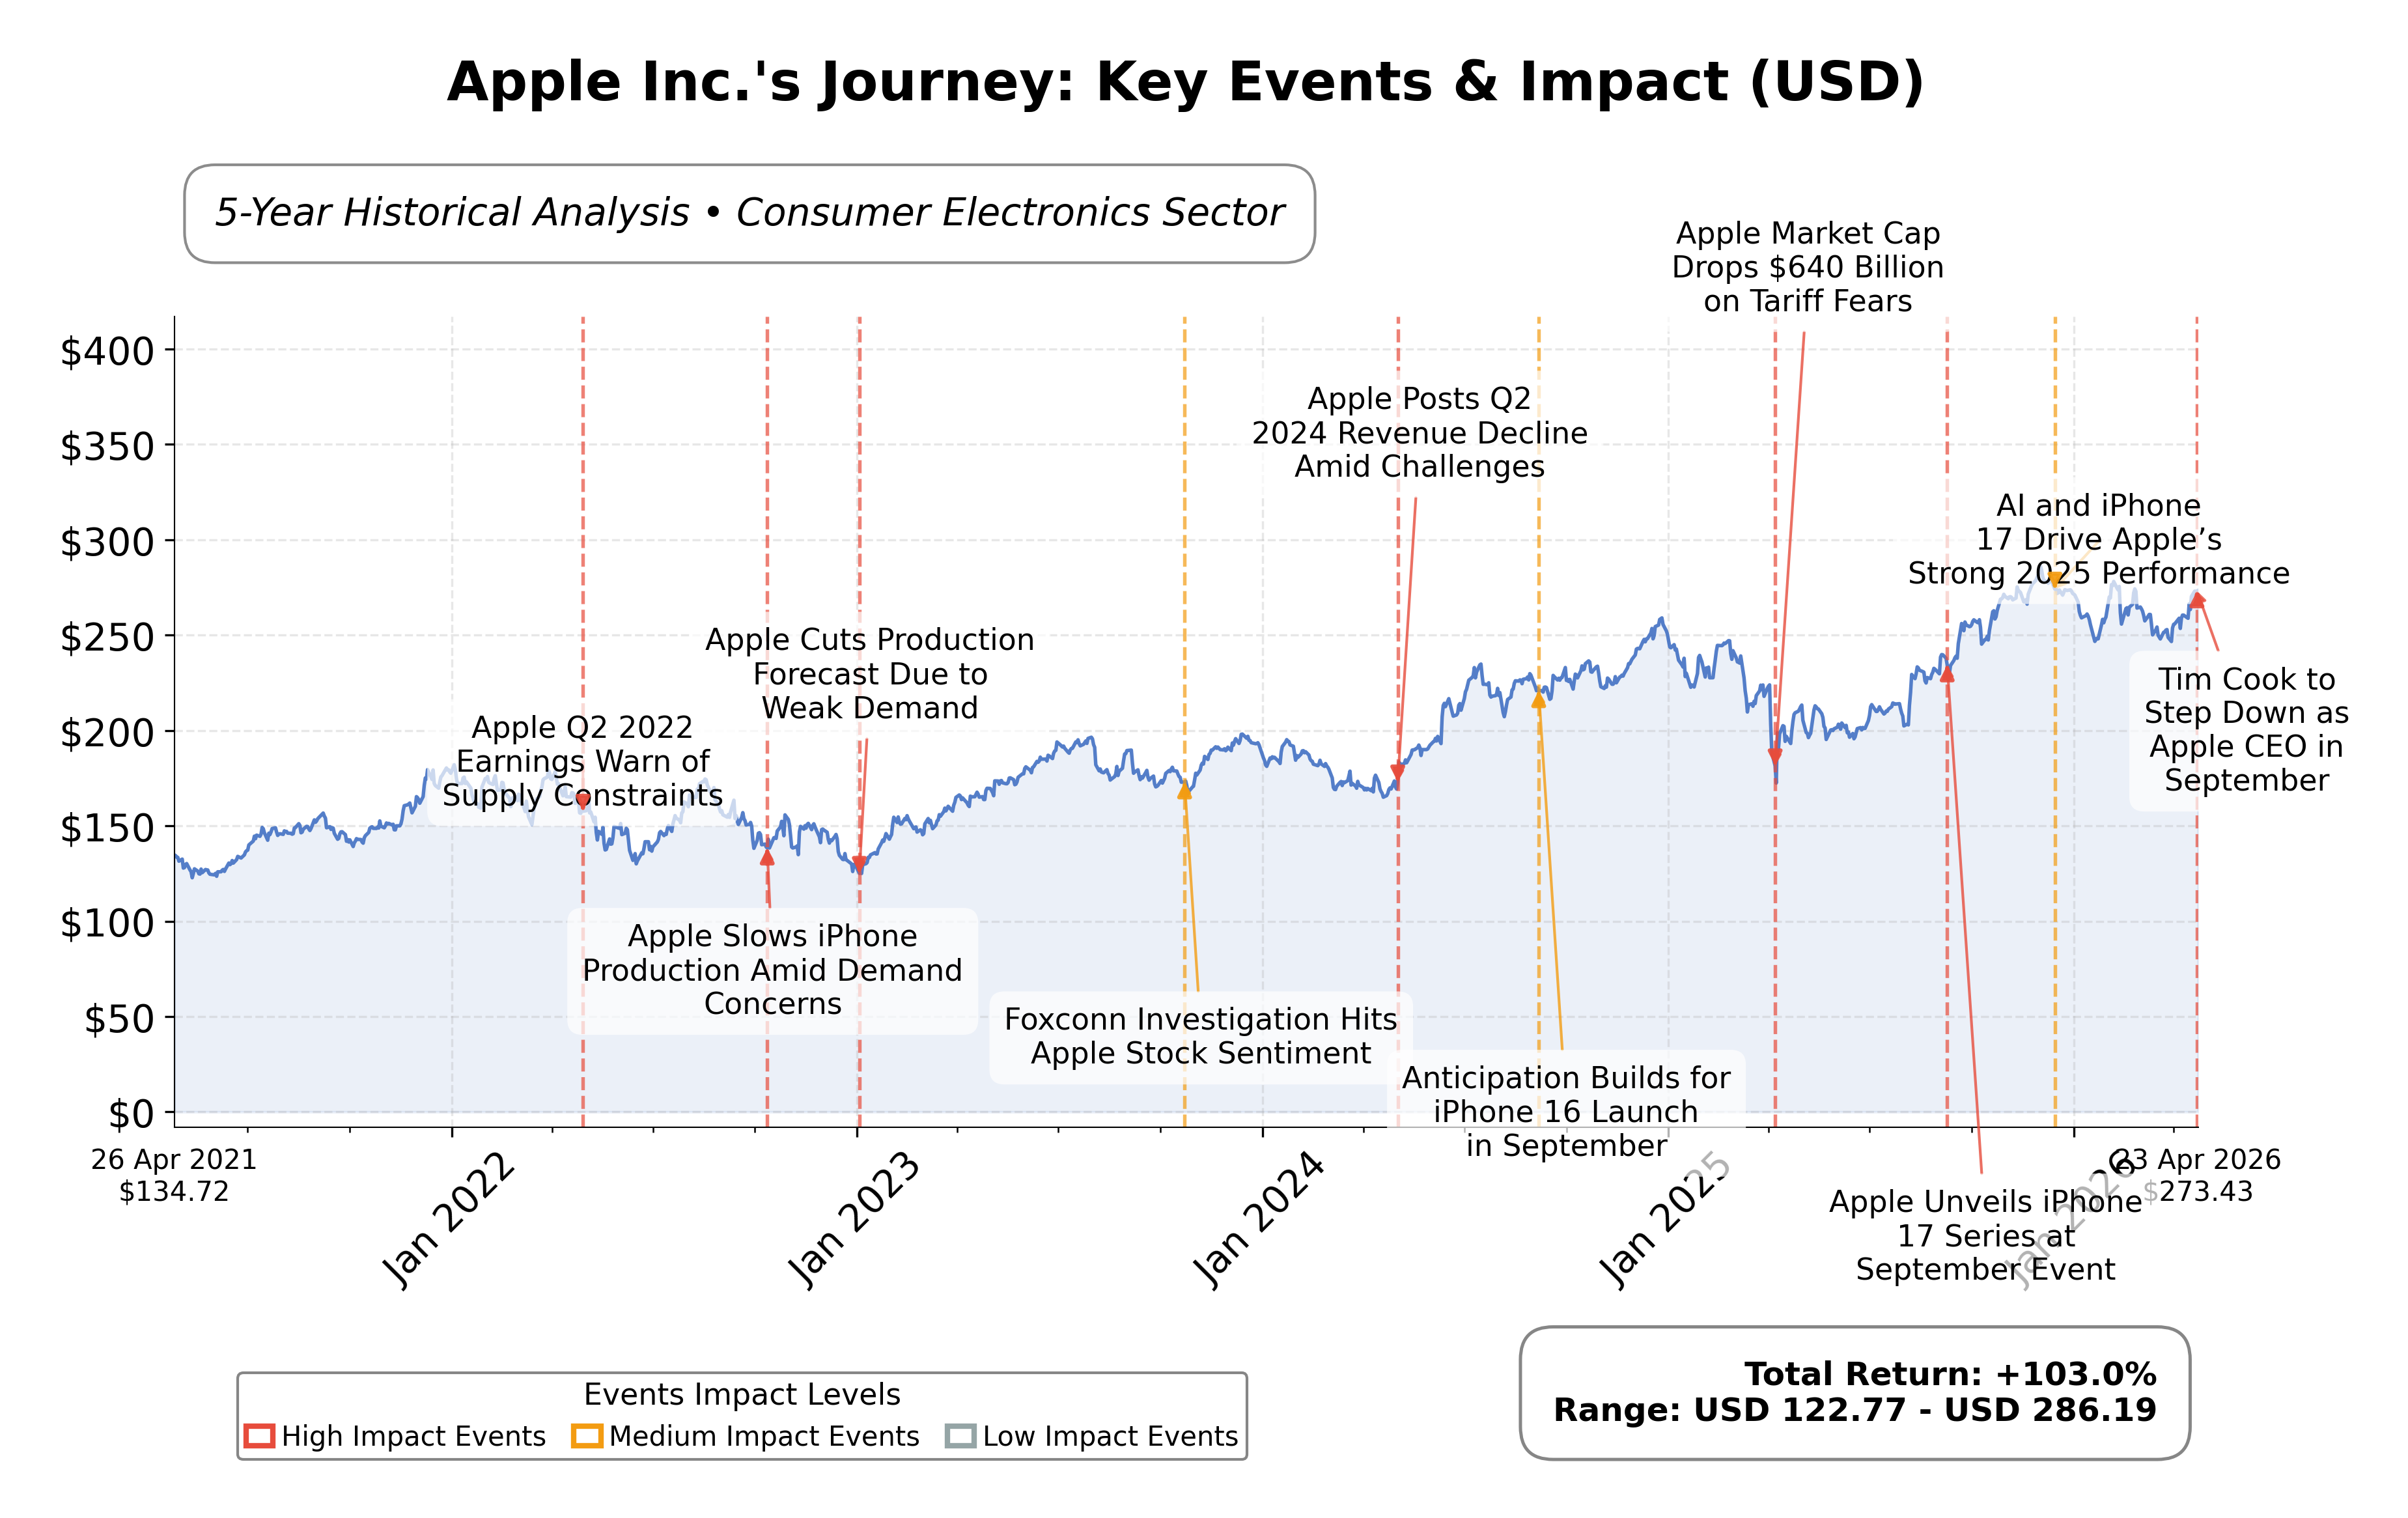
Stock Journey
Key Positives and Key Risks
Pros
- Market capitalization of $3.97 trillion underscores Apple’s dominant industry position and scale.
- Strong revenue growth of 15.7% quarterly and operating cash flow of $135.5 billion highlight robust financial performance.
- Return on assets of 24.38% indicates efficient use of company assets to generate profits.
Cons
- High price-to-book ratio of 45.05 suggests a premium valuation that may limit upside.
- Debt-to-equity ratio of 102.63 signals significant leverage that could impact financial flexibility.
- Supply constraints and tariff pressures pose risks to margin stability and product availability.
Disclosure: This information is for general awareness and does not constitute investment advice
Report Summary
Apple Inc. operates as a leading technology company primarily engaged in designing, manufacturing, and marketing consumer electronics, software, and services. Listed on NASDAQ under the technology sector, Apple’s flagship product is the iPhone, which drives the majority of its revenue. The company also offers a broad ecosystem including Mac computers, iPads, Apple Watch, and services such as the App Store and Apple Music, positioning it as a dominant player in the consumer electronics industry with a global footprint.
Financially, Apple reported trailing twelve months revenue of approximately $435.6 billion with a gross margin of 48.16%, operating margin of 35.37%, and net profit margin of 27.04%. The company’s return on equity (ROE) stands at 1.52%, and return on assets (ROA) at 24.38%, indicating strong profitability and efficient asset utilization. Operating cash flow reached $135.5 billion, with free cash flow of $106.3 billion, underscoring robust cash generation capabilities.
Apple’s valuation metrics show a trailing P/E ratio of 34.25 and a forward P/E of 28.92, with a price-to-book ratio of 45.05 and an EV/EBITDA multiple of 26.10. The market capitalization is approximately $3.97 trillion, reflecting its status as one of the largest companies globally. The stock trades near its 52-week high of $288.62, currently priced at $270.19, representing an upside potential of about 6.9% from the current price to the 52-week high.
Key strengths include Apple’s strong cash flow generation, substantial market capitalization, and leadership in innovation and product ecosystem integration. Risks involve competitive pressures, potential margin volatility due to tariffs and supply constraints, and regulatory scrutiny. Recent strategic developments include the appointment of John Ternus as the new CEO and a partnership with Amazon’s satellite network to enhance iPhone connectivity, signaling ongoing innovation and operational evolution.
Technically, Apple’s stock is in an uptrend, trading above its 50-day and 200-day moving averages, with momentum indicators showing moderate strength. The stock’s price action and recent leadership changes suggest a stable trajectory with potential for continued investor interest. Overall, the data points to a market environment where careful observation of fundamental and technical factors is warranted.
Company and Industry Overview
Company Basics
Price Performance
Company Size
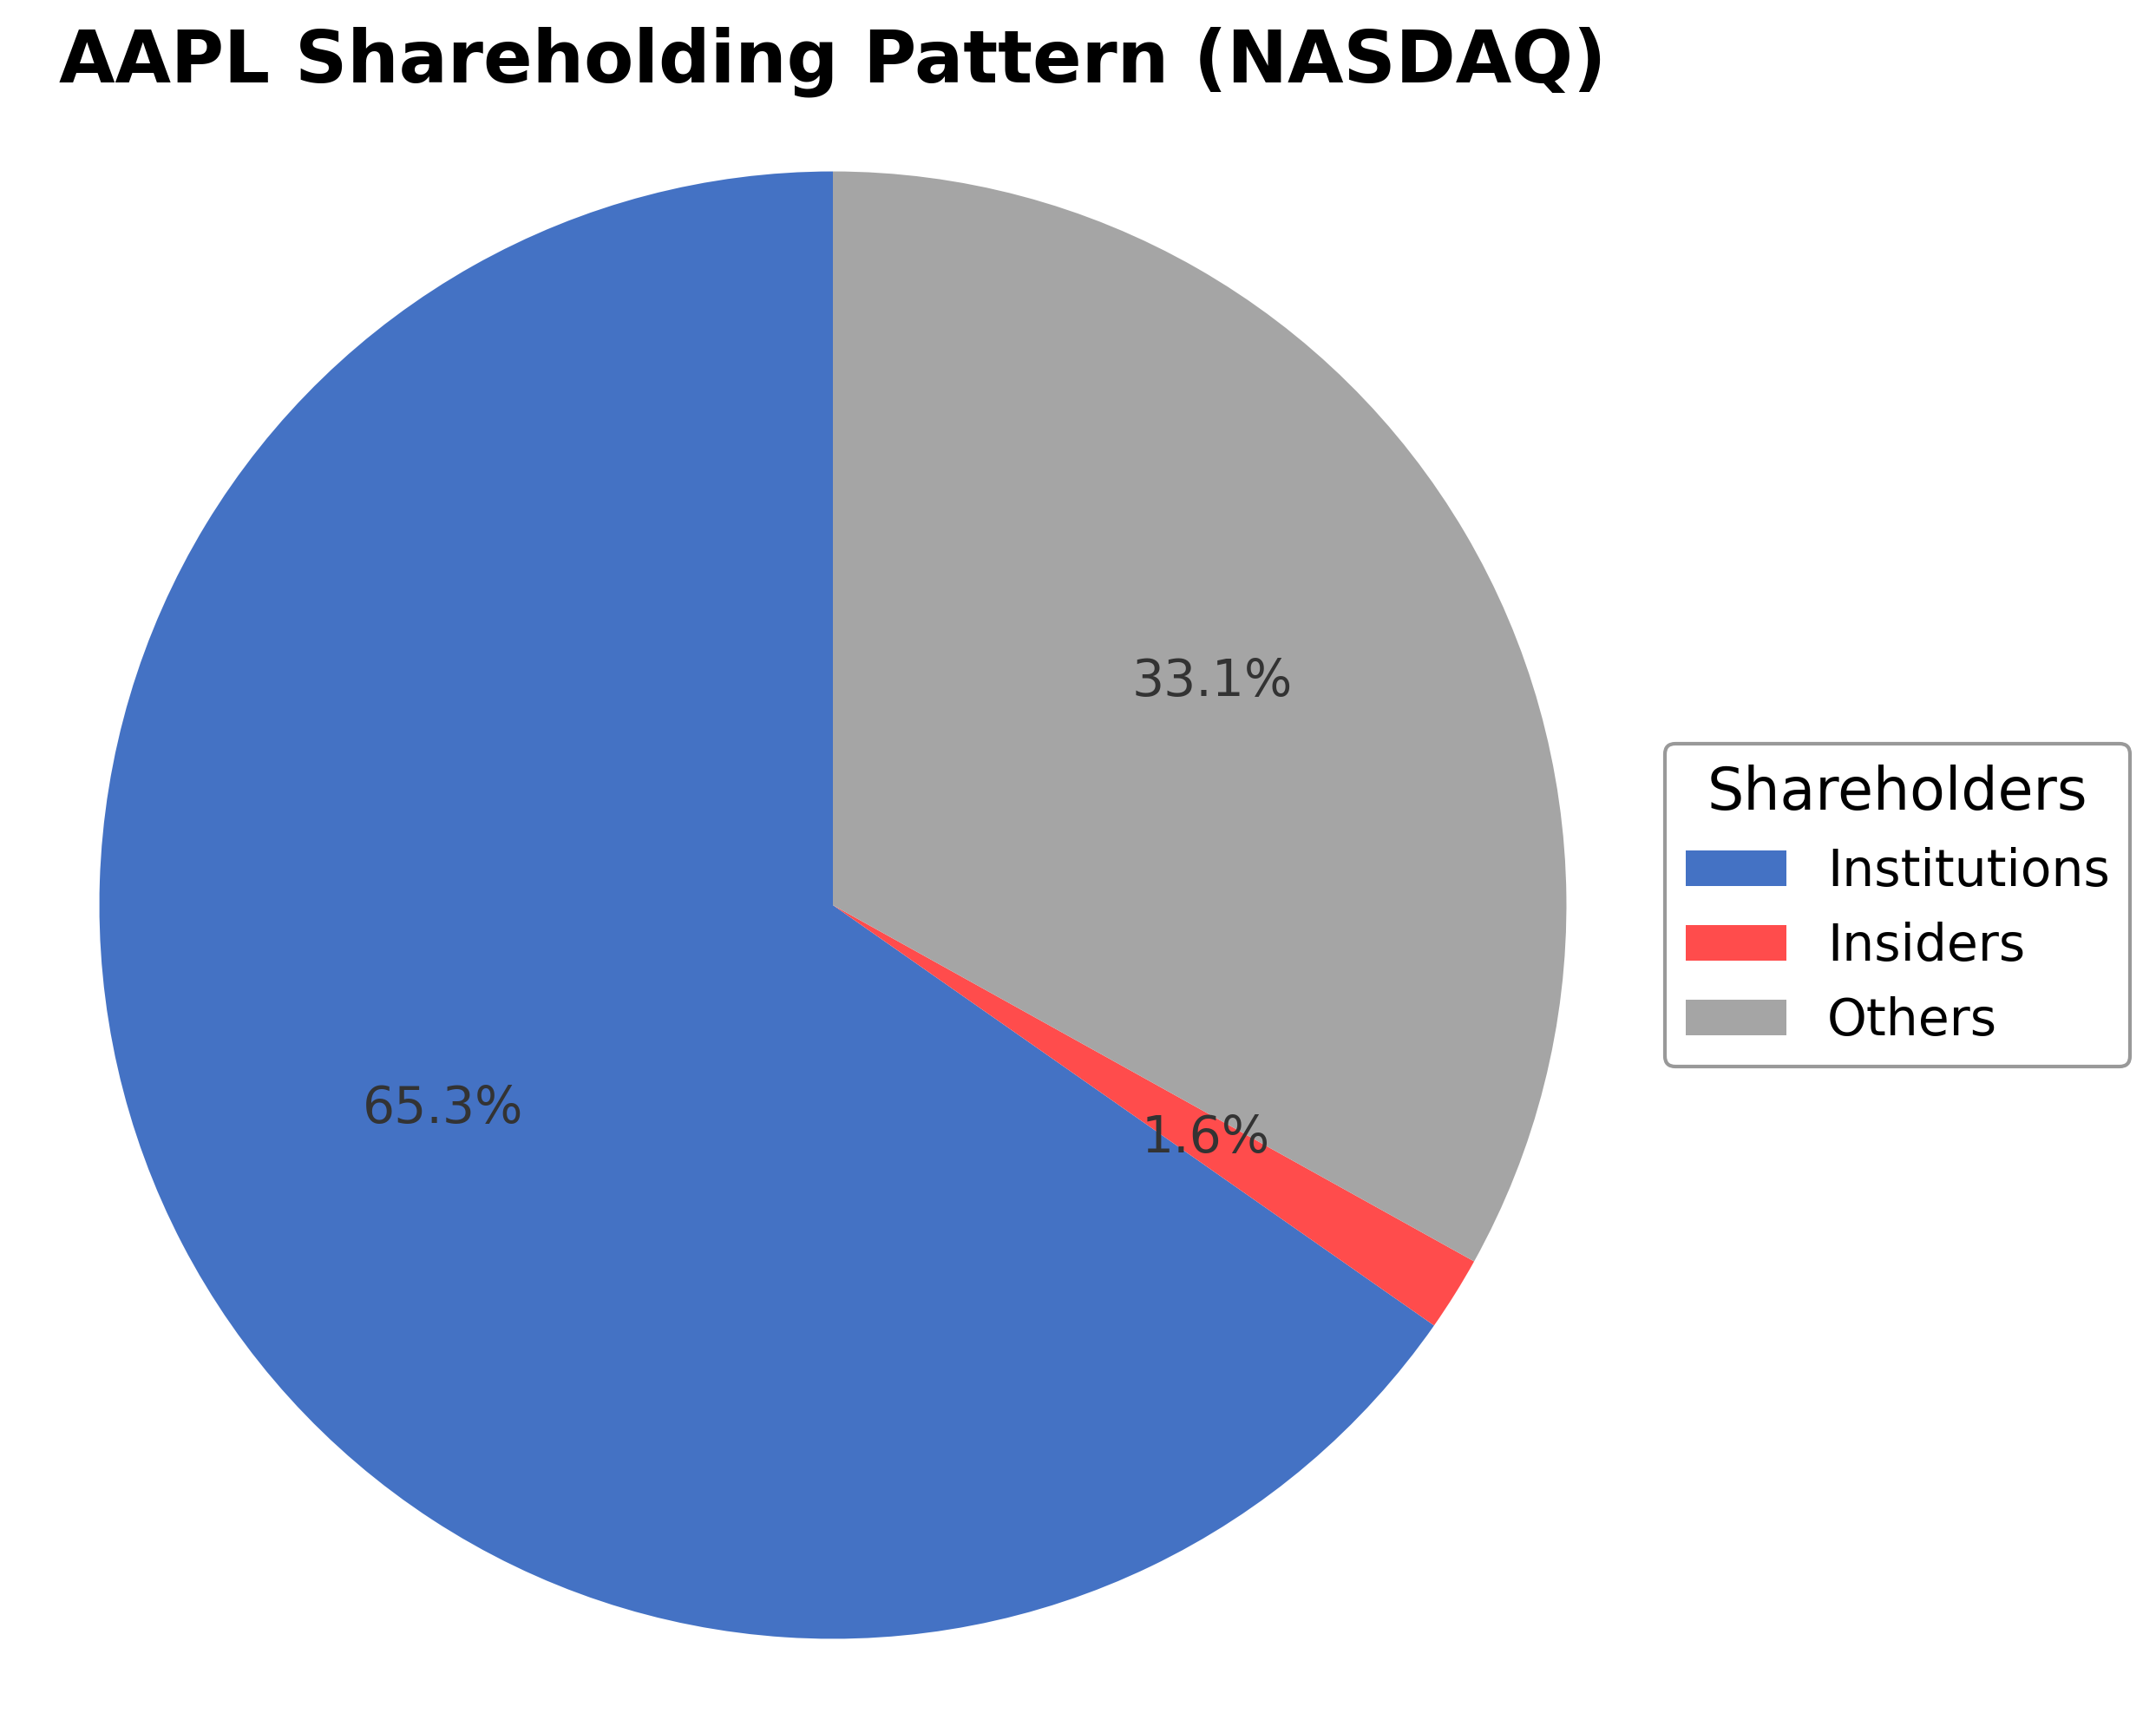
Shareholding Pattern
Sector and Industry Analysis
The computer hardware sector is a substantial and expanding market, valued at approximately $674 billion in 2023 and projected to grow to over $710 billion in 2024, with a compound annual growth rate (CAGR) of 5.3%. By 2028, the market is expected to reach nearly $915 billion, driven by increased demand for personal computing devices, data centers, and digital infrastructure. Major players include Apple, NVIDIA, and other technology firms that dominate segments such as personal computers, smartphones, and advanced processors.
Current industry trends emphasize the integration of artificial intelligence (AI) and machine learning, which are transforming hardware design and enabling applications like autonomous vehicles and robotics. The rise of the Internet of Things (IoT) also fuels demand for connected devices, necessitating improvements in security and interoperability. Additionally, emerging technologies like quantum computing present new growth avenues, requiring innovation in materials, chip design, and cooling systems, while also raising the competitive bar due to high R&D costs and technological complexity.
The regulatory environment for computer hardware is shaped by data privacy laws, export controls, and environmental standards, all of which influence product development and market access. Governments are increasingly focusing on cybersecurity requirements and supply chain transparency to mitigate risks associated with connected devices and AI deployment. Looking ahead, evolving regulations around AI ethics and hardware security are expected to impact innovation strategies and operational compliance within the sector.
Note: Analysis synthesized from industry research, market reports, and regulatory filings. Information is subject to change based on market conditions.
Financial Ratios Dashboard
Illustrative Scenario Analysis
DCF Assumptions:
Method: Two-Stage EPS-Priority Model
Financials
Peer Analysis
| Company Name | Market Cap | P/E Ratio | P/B Ratio | EV/EBITDA | Price to CFO |
|---|---|---|---|---|---|
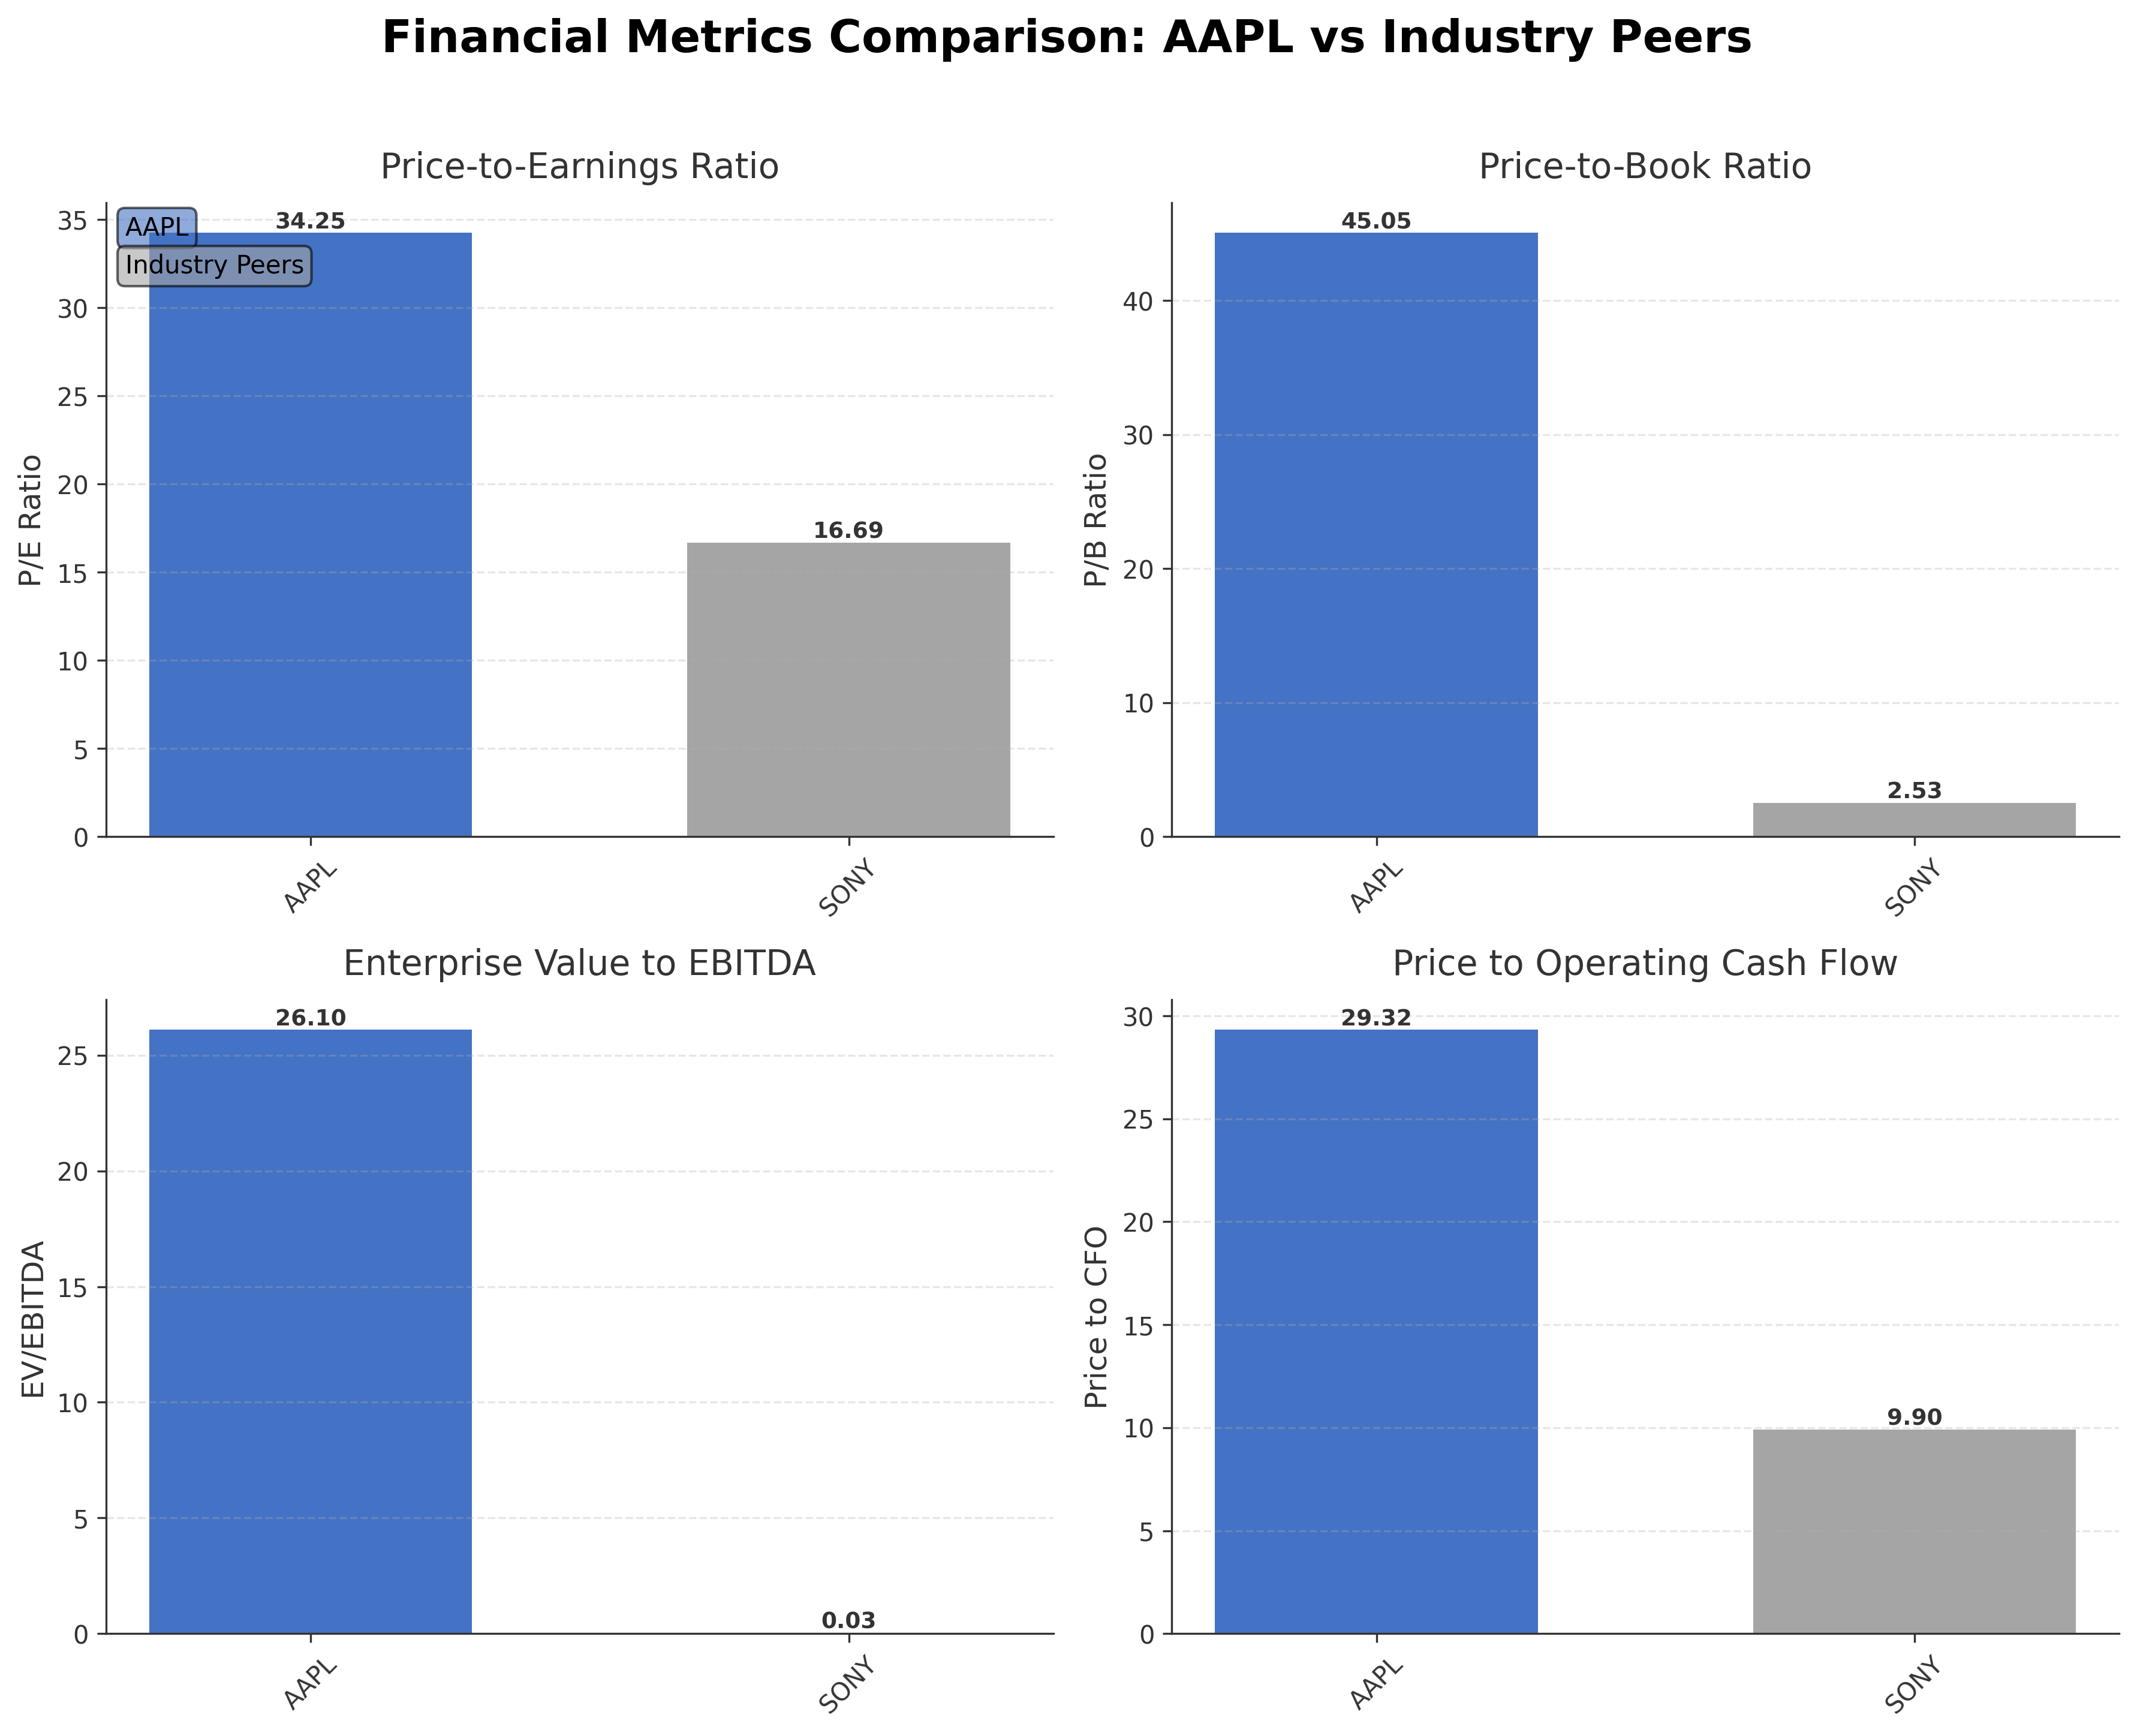
| Apple Inc. | $3.97T | 34.25 | 45.05 | 26.10 | 29.32 |
| Sony Group Corporation - Sponsored American Depositary Receipt | $128.20B | 16.69 | 2.53 | 0.03 | 9.90 |
Comparison Analysis: Apple Inc. significantly outscales its peer Sony Group Corporation in market capitalization, with $3.97 trillion versus $128.20 billion. Apple’s valuation multiples such as P/E (34.25) and P/B (45.05) are considerably higher than Sony’s P/E of 16.69 and P/B of 2.53, reflecting Apple's premium market positioning and growth expectations. The EV/EBITDA ratio for Apple at 26.10 contrasts sharply with Sony’s 0.03, indicating differing capital structures and profitability profiles. Apple’s return on equity of 1.52% also surpasses Sony’s 0.15%, showcasing stronger shareholder returns. Overall, Apple demonstrates a dominant financial and market position relative to regional industry peers.
Financial Metrics Comparison with Peers
Financial Statements
Comprehensive financial data including income, balance sheet, and cash flow metrics
Income Statement
| fiscal_date | 2025-09-30 | 2024-09-30 | 2023-09-30 | 2022-09-30 | 2021-09-30 |
|---|---|---|---|---|---|
| Sales | 416.16B | 391.04B | 383.29B | 394.33B | 365.82B |
| Cost Of Goods | 220.96B | 210.35B | 214.14B | 223.55B | 212.98B |
| Gross Profit | 195.20B | 180.68B | 169.15B | 170.78B | 152.84B |
| Operating Expense Research And Development | 34.55B | 31.37B | 29.91B | 26.25B | 21.91B |
| Operating Expense Selling General And Administrative | 27.60B | 26.10B | 24.93B | 25.09B | 21.97B |
| Operating Income | 133.05B | 123.22B | 114.30B | 119.44B | 108.95B |
| Other Income Expense | -321.00M | 269.00M | -565.00M | -334.00M | 60.00M |
| Pretax Income | 132.73B | 123.48B | 113.74B | 119.10B | 109.21B |
| Income Tax | 20.72B | 29.75B | 16.74B | 19.30B | 14.53B |
| Net Income | 112.01B | 93.74B | 97.00B | 99.80B | 94.68B |
| Eps Basic | 7.49 | 6.11 | 6.16 | 6.15 | 5.67 |
| Eps Diluted | 7.46 | 6.08 | 6.13 | 6.11 | 5.61 |
| Basic Shares Outstanding | 14.95B | 15.34B | 15.74B | 16.22B | 16.70B |
| Diluted Shares Outstanding | 14.95B | 15.34B | 15.74B | 16.22B | 16.70B |
| Ebit | 133.05B | 123.22B | 114.30B | 119.44B | 111.85B |
| Ebitda | 144.75B | 134.66B | 125.82B | 130.54B | 123.14B |
| Net Income Continuous Operations | 112.01B | 93.74B | 97.00B | 99.80B | 94.68B |
| Non Operating Interest Income | N/A | N/A | 3.75B | 2.83B | 2.84B |
| Non Operating Interest Expense | N/A | N/A | 3.93B | 2.93B | 2.65B |
Data provided by Twelve Data
Balance Sheet
| fiscal_date | 2025-09-30 | 2024-09-30 | 2023-09-30 | 2022-09-30 | 2021-09-30 |
|---|---|---|---|---|---|
| Cash And Cash Equivalents | 35.93B | 29.94B | 29.96B | 23.65B | 34.94B |
| Accounts Receivable | 39.78B | 33.41B | 29.51B | 28.18B | 26.28B |
| Total Assets | 359.24B | 364.98B | 352.58B | 352.75B | 351.00B |
| Total Liabilities | 285.51B | 308.03B | 290.44B | 302.08B | 287.91B |
| Long Term Debt | 78.33B | 85.75B | 95.28B | 109.71B | 119.38B |
| Shareholders Equity | 73.73B | 56.95B | 62.15B | 50.67B | 63.09B |
Data provided by Twelve Data
Cash Flow Statement
| fiscal_date | 2025-09-30 | 2024-09-30 | 2023-09-30 | 2022-09-30 | 2021-09-30 |
|---|---|---|---|---|---|
| Operating Activities Net Income | 112.01B | 93.74B | 97.00B | 99.80B | 94.68B |
| Operating Activities Depreciation | 11.70B | 11.45B | 11.52B | 11.10B | 11.28B |
| Operating Activities Stock Based Compensation | 12.86B | 11.69B | 10.83B | 9.04B | 7.91B |
| Operating Activities Other Non Cash Items | -89.00M | -2.27B | -2.23B | 1.01B | -4.92B |
| Operating Activities Accounts Receivable | -7.03B | -5.14B | -417.00M | -9.34B | -14.03B |
| Operating Activities Accounts Payable | 902.00M | 6.02B | -1.89B | 9.45B | 12.33B |
| Operating Activities Other Assets Liabilities | -18.87B | 2.77B | -4.27B | 1.57B | -1.53B |
| Operating Activities Operating Cash Flow | 111.48B | 118.25B | 110.54B | 123.52B | 100.94B |
| Investing Activities Capital Expenditures | -12.71B | -9.45B | -10.96B | -10.71B | -11.09B |
| Investing Activities Purchase Of Investments | -24.41B | -48.66B | -29.51B | -76.92B | -109.56B |
| Investing Activities Sale Of Investments | 53.80B | 62.35B | 45.51B | 67.36B | 106.48B |
| Investing Activities Other Investing Activity | -1.48B | -1.31B | -1.34B | -2.09B | -385.00M |
| Investing Activities Investing Cash Flow | 15.20B | 2.94B | 3.71B | -22.66B | -14.58B |
| Financing Activities Long Term Debt Issuance | 4.48B | 0.00 | 5.23B | 5.46B | 20.39B |
| Financing Activities Long Term Debt Payments | -10.93B | -9.96B | -11.15B | -9.54B | -8.75B |
| Financing Activities Short Term Debt Issuance | -2.03B | 3.96B | -3.98B | 3.96B | 1.02B |
| Financing Activities Common Stock Repurchase | -90.71B | -94.95B | -77.55B | -89.40B | -85.97B |
| Financing Activities Common Dividends | -15.42B | -15.23B | -15.03B | -14.84B | -14.47B |
| Financing Activities Other Financing Charges | -6.07B | -5.80B | -6.01B | -6.38B | -5.58B |
| Financing Activities Financing Cash Flow | -120.69B | -121.98B | -108.49B | -110.75B | -92.25B |
| End Cash Position | 35.93B | 29.94B | 30.74B | 24.98B | 35.93B |
| Income Tax Paid | 43.37B | 26.10B | 18.68B | 19.57B | 25.39B |
| Free Cash Flow | 98.77B | 108.81B | 99.58B | 111.44B | 92.95B |
| Interest Paid | N/A | N/A | 3.80B | 2.87B | 2.69B |
| Operating Activities Deferred Taxes | N/A | N/A | N/A | 895.00M | -4.77B |
| Investing Activities Net Acquisitions | N/A | N/A | N/A | -306.00M | -33.00M |
| Financing Activities Common Stock Issuance | N/A | N/A | N/A | N/A | 1.10B |
Data provided by Twelve Data
Technical Analysis
Key Insights
- Apple’s stock exhibits a sustained upward trend with price action maintaining above key moving averages, indicating bullish momentum.
- Support levels are identified near $260 and $250, while resistance is observed around the 52-week high at $288.62.
- The current price is above the 10-day, 50-day ($260.69), and 200-day ($251.83) moving averages, suggesting positive medium and long-term trends.
- Momentum indicators show RSI in a moderate range below overbought levels, MACD remains positive, and Stochastic oscillators indicate steady buying interest.
- Multi-timeframe analysis across daily, weekly, and monthly charts confirms consistent strength with no significant reversal signals.
- Market scenarios suggest continuation of the current trend with potential consolidation near resistance levels before any significant breakout or pullback.
Trending News
1. Headline: Apple Earnings Preview: Q2 2026 | Seeking Alpha
Summary: Apple stock up almost 6% since last quarter. Consensus P/E for 2026 is 32x. Could Q2 release and outlook confirm the upgrade cycle and drive further outperformance in AAPL stock?
Sentiment: positive
2. Headline: Prediction: Apple Stock Will Flourish Under New CEO | The Motley Fool
Summary: New CEO John Ternus could breathe life into Apple stock.
Sentiment: positive
3. Headline: Apple (AAPL) Stock Trades Up, Here Is Why
Summary: Shares of iPhone and iPad maker Apple (NASDAQ:AAPL) jumped 2.3% in the afternoon session after the company announced that John Ternus, senior vice president of Hardware Engineering, would become its next chief executive officer, a move that analysts viewed positively.
Sentiment: positive
4. Headline: Report shares new details from Tim Cook’s town hall, including career highs and missteps - 9to5Mac
Summary: A new report from Bloomberg adds fresh details to Tim Cook’s town hall at the Steve Jobs Theater, following Monday’s CEO transition announcement.
Sentiment: neutral
5. Headline: The base model $599 Mac mini is now completely out of stock - 9to5Mac
Summary: But that was also the theory for ... constrained stock — until Bloomberg reported that an M5 Mac Studio refresh wasn’t due until October. FTC: We use income earning auto affiliate links. More. You’re reading 9to5Mac — experts who break news about Apple and its surrounding ...
Sentiment: neutral
Powered by Brave
Recent Updates
News Summary
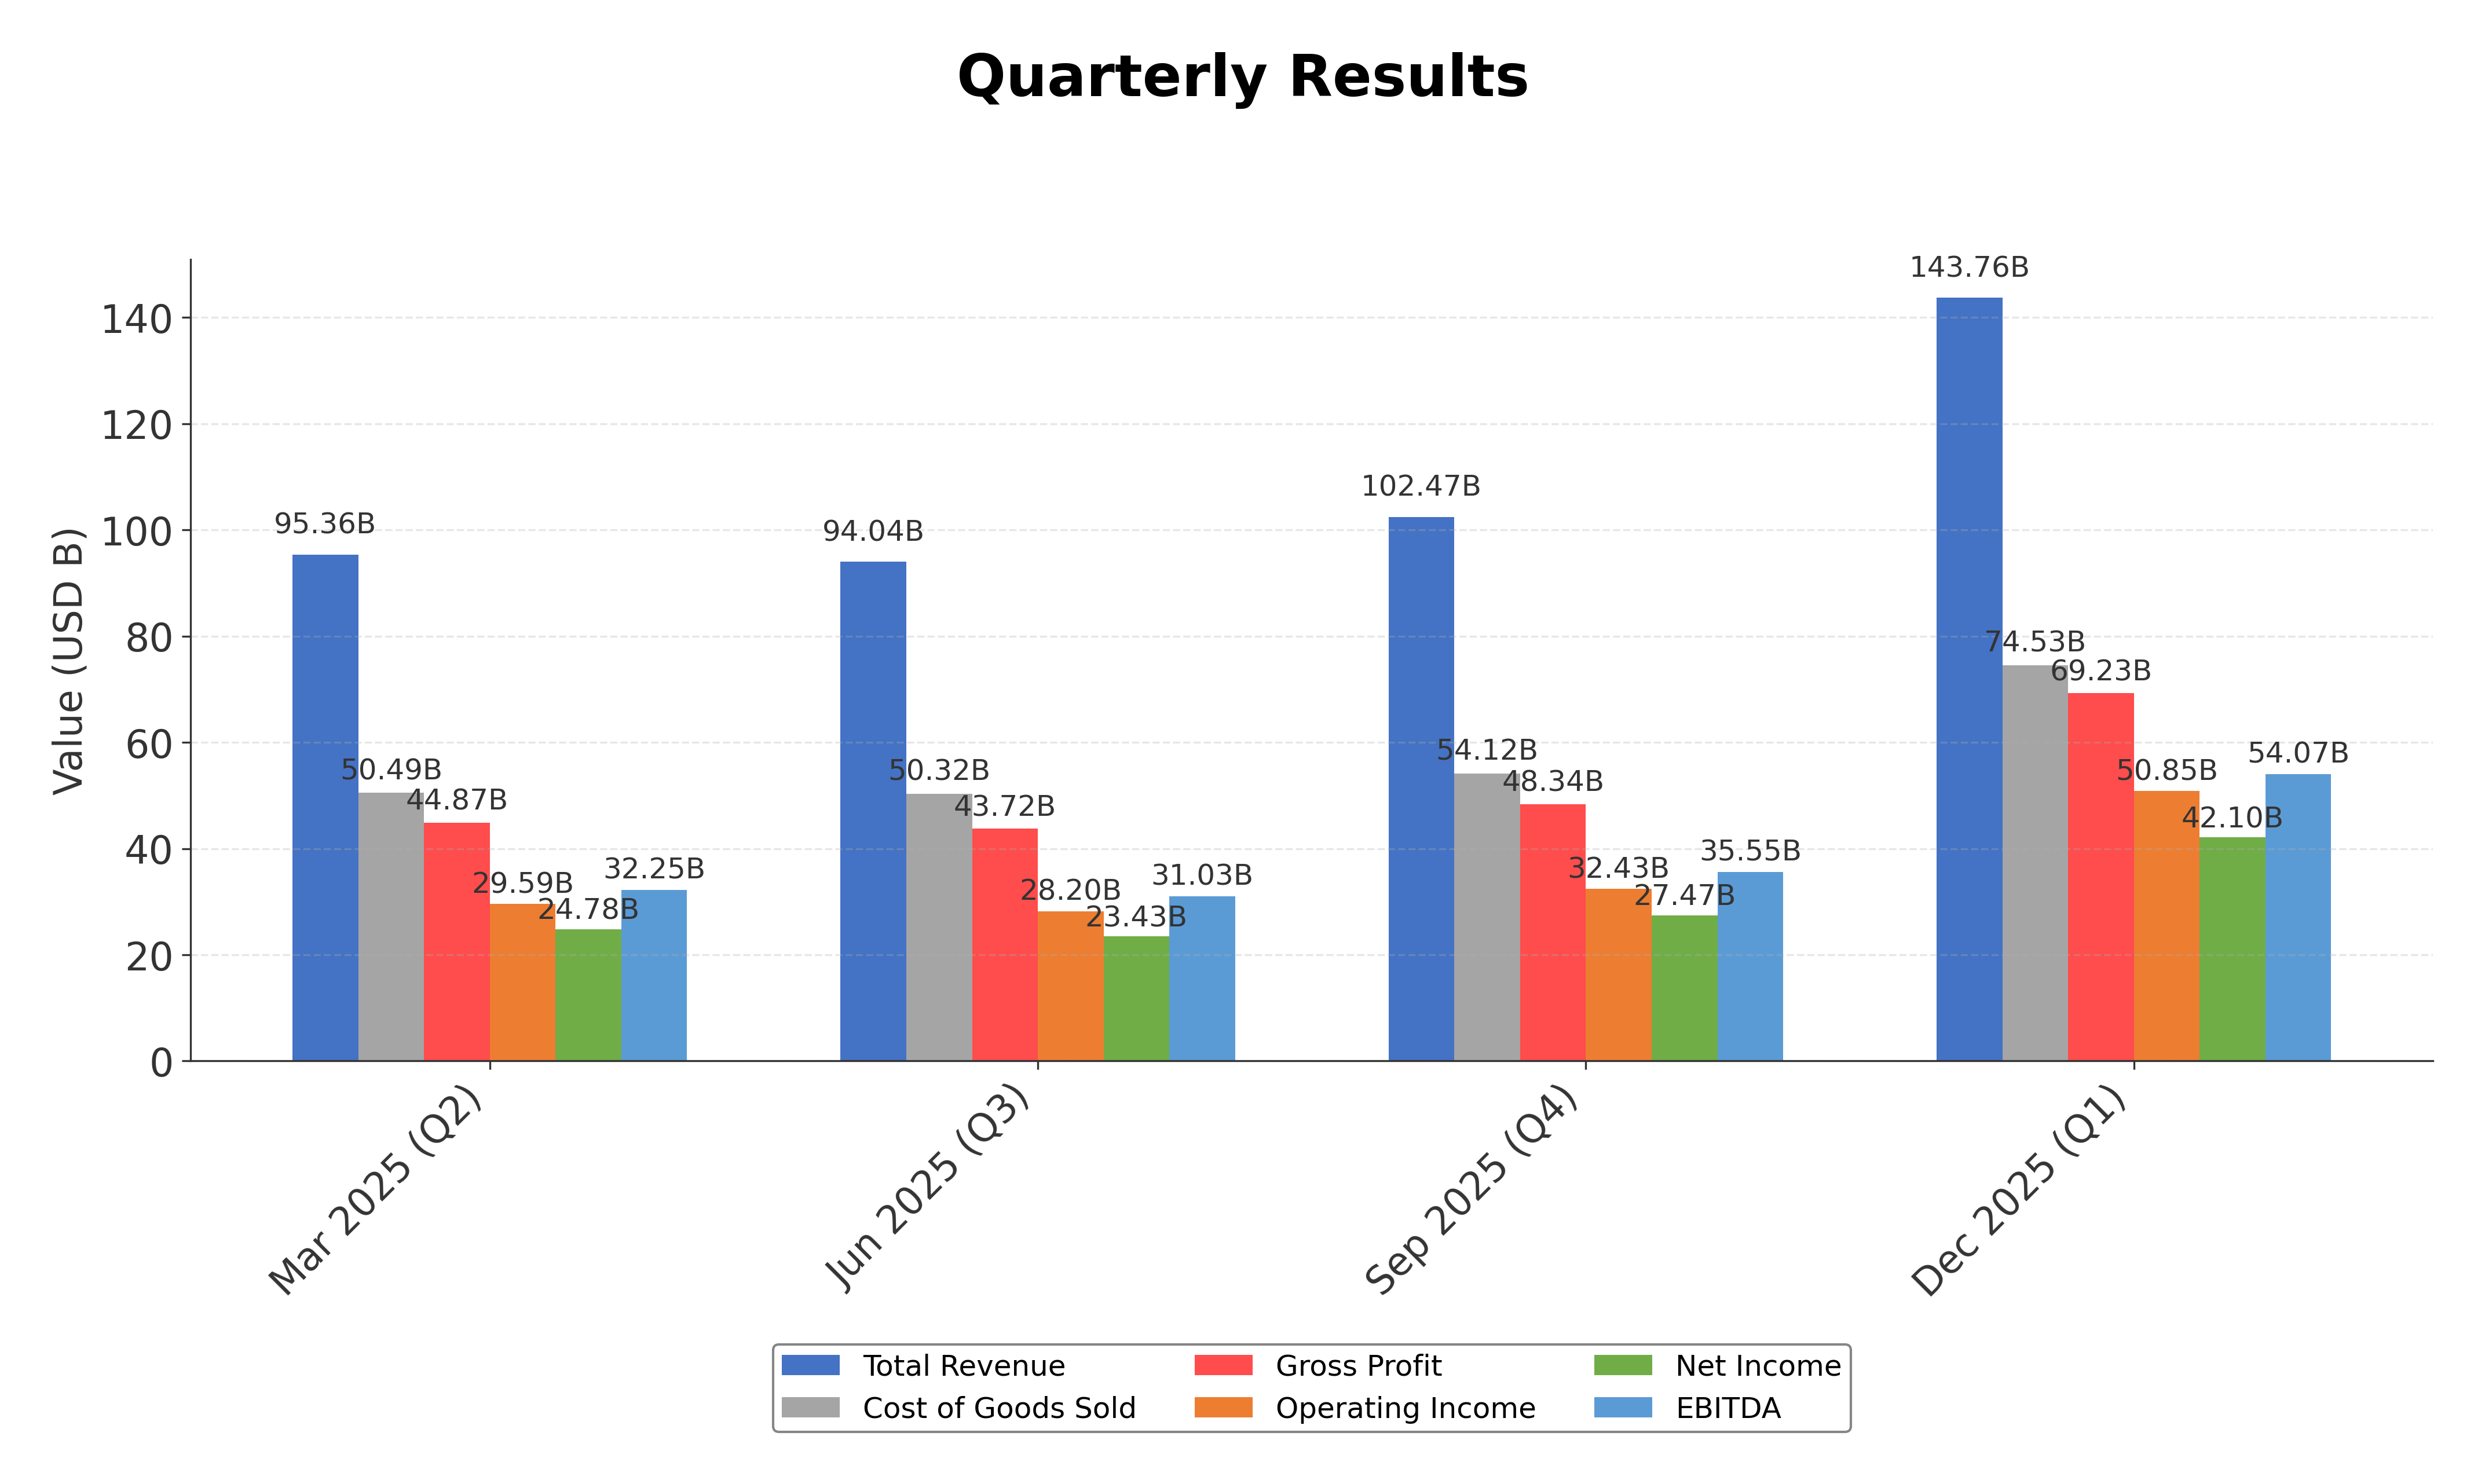
As of April 23, 2026. Apple announced the appointment of John Ternus as its new CEO, effective September 1, 2026, with Tim Cook transitioning to executive chairman. This leadership change was met with positive analyst reactions, anticipating strong iPhone sales to drive revenue above consensus estimates despite potential margin pressures from memory inflation. Apple reported record-breaking quarterly revenues of $143.8 billion for Q1 2026, up 16% year-over-year, with iPhone and Services revenue reaching all-time highs. The company generated nearly $54 billion in operating cash flow and returned approximately $32 billion to shareholders through dividends and share repurchases. Additionally, Apple’s installed base surpassed 2.5 billion active devices, reflecting high customer satisfaction and loyalty. Earlier quarters also showed consistent revenue growth and record EPS, supported by new product launches including the MacBook Pro, iPad Pro, and Apple Vision Pro.
News Sentiment
The overall sentiment from recent updates is predominantly positive, driven by strong financial performance, record revenues, and robust cash flow generation. The leadership transition to John Ternus has been well received by the market, adding optimism about future strategic direction. Neutral tones arise from supply constraints and product availability issues, such as the Mac mini stock shortage, which may temper near-term growth expectations. The combination of record earnings, shareholder returns, and ongoing innovation supports a constructive outlook, balanced by operational challenges and macroeconomic factors.
Source List
- https://finance.yahoo.com/markets/stocks/articles/apple-aapl-stock-trades-why-063723827.html
Analytical Overview
Analysis Summary
Apple’s valuation metrics, including a trailing P/E of 34.25 and forward P/E of 28.92, are elevated relative to the consumer electronics industry average P/E of 34.25, reflecting premium pricing consistent with its market leadership. The company demonstrates a strong growth trajectory with 15.7% quarterly revenue growth and robust cash flow trends, including operating cash flow of $135.5 billion and free cash flow of $106.3 billion. Financial health is solid, though the debt-to-equity ratio of 102.63 indicates leverage that is balanced by substantial cash reserves of $66.9 billion. Sector-specific challenges include supply constraints and tariff impacts, while opportunities arise from expanding services and product innovation. Market positioning and competitive advantages are evident in Apple’s integrated ecosystem and global brand strength.
Overall Business and Market Assessment
Supporting Factors: No data
Risk Factors: margin pressures from supply chain issues and competitive dynamics
SWOT Analysis
Strengths
- Market leadership with a strong global brand and product ecosystem.
- Robust cash flow generation supporting shareholder returns and innovation.
- Consistent record-breaking revenue and profitability growth.
- High customer loyalty with over 2.5 billion active devices.
Weaknesses
- High price-to-book ratio indicating premium valuation.
- Leverage with a debt-to-equity ratio above 100%.
- Supply constraints impacting product availability.
- Dependence on iPhone sales for majority of revenue.
Opportunities
- Expansion of services segment with growing subscription revenues.
- New product launches including foldable iPhones and AI integration.
- Strategic partnerships enhancing technology capabilities.
- Growth potential in emerging markets like Greater China and India.
Threats
- Intense competition in consumer electronics and services.
- Regulatory scrutiny and potential legal challenges.
- Macroeconomic factors affecting consumer spending.
- Tariffs and supply chain disruptions impacting margins.
Company Description
Apple Inc. is a leading technology company renowned for designing, manufacturing, and marketing innovative hardware and software products for consumers and businesses worldwide. Its flagship product, the iPhone, accounts for the majority of sales, serving as the central hub of an expansive ecosystem that includes Mac computers, iPad tablets, Apple Watch wearables, and accessories like AirPods. Apple Inc. also offers a suite of services such as the App Store, Apple Music, iCloud, Apple TV+, and Apple Fitness+, providing digital content, cloud storage, and subscription-based platforms. Operating in the consumer electronics industry within the technology sector, the company employs approximately 166,000 people and maintains a broad global presence through online stores, retail outlets, and partnerships with carriers and resellers. With a substantial market capitalization reflecting its scale, Apple Inc. plays a pivotal role in shaping consumer technology trends, emphasizing seamless integration across devices and services to enhance user experience and productivity.