
Apple Inc (AAPL)
Stock Analysis Report
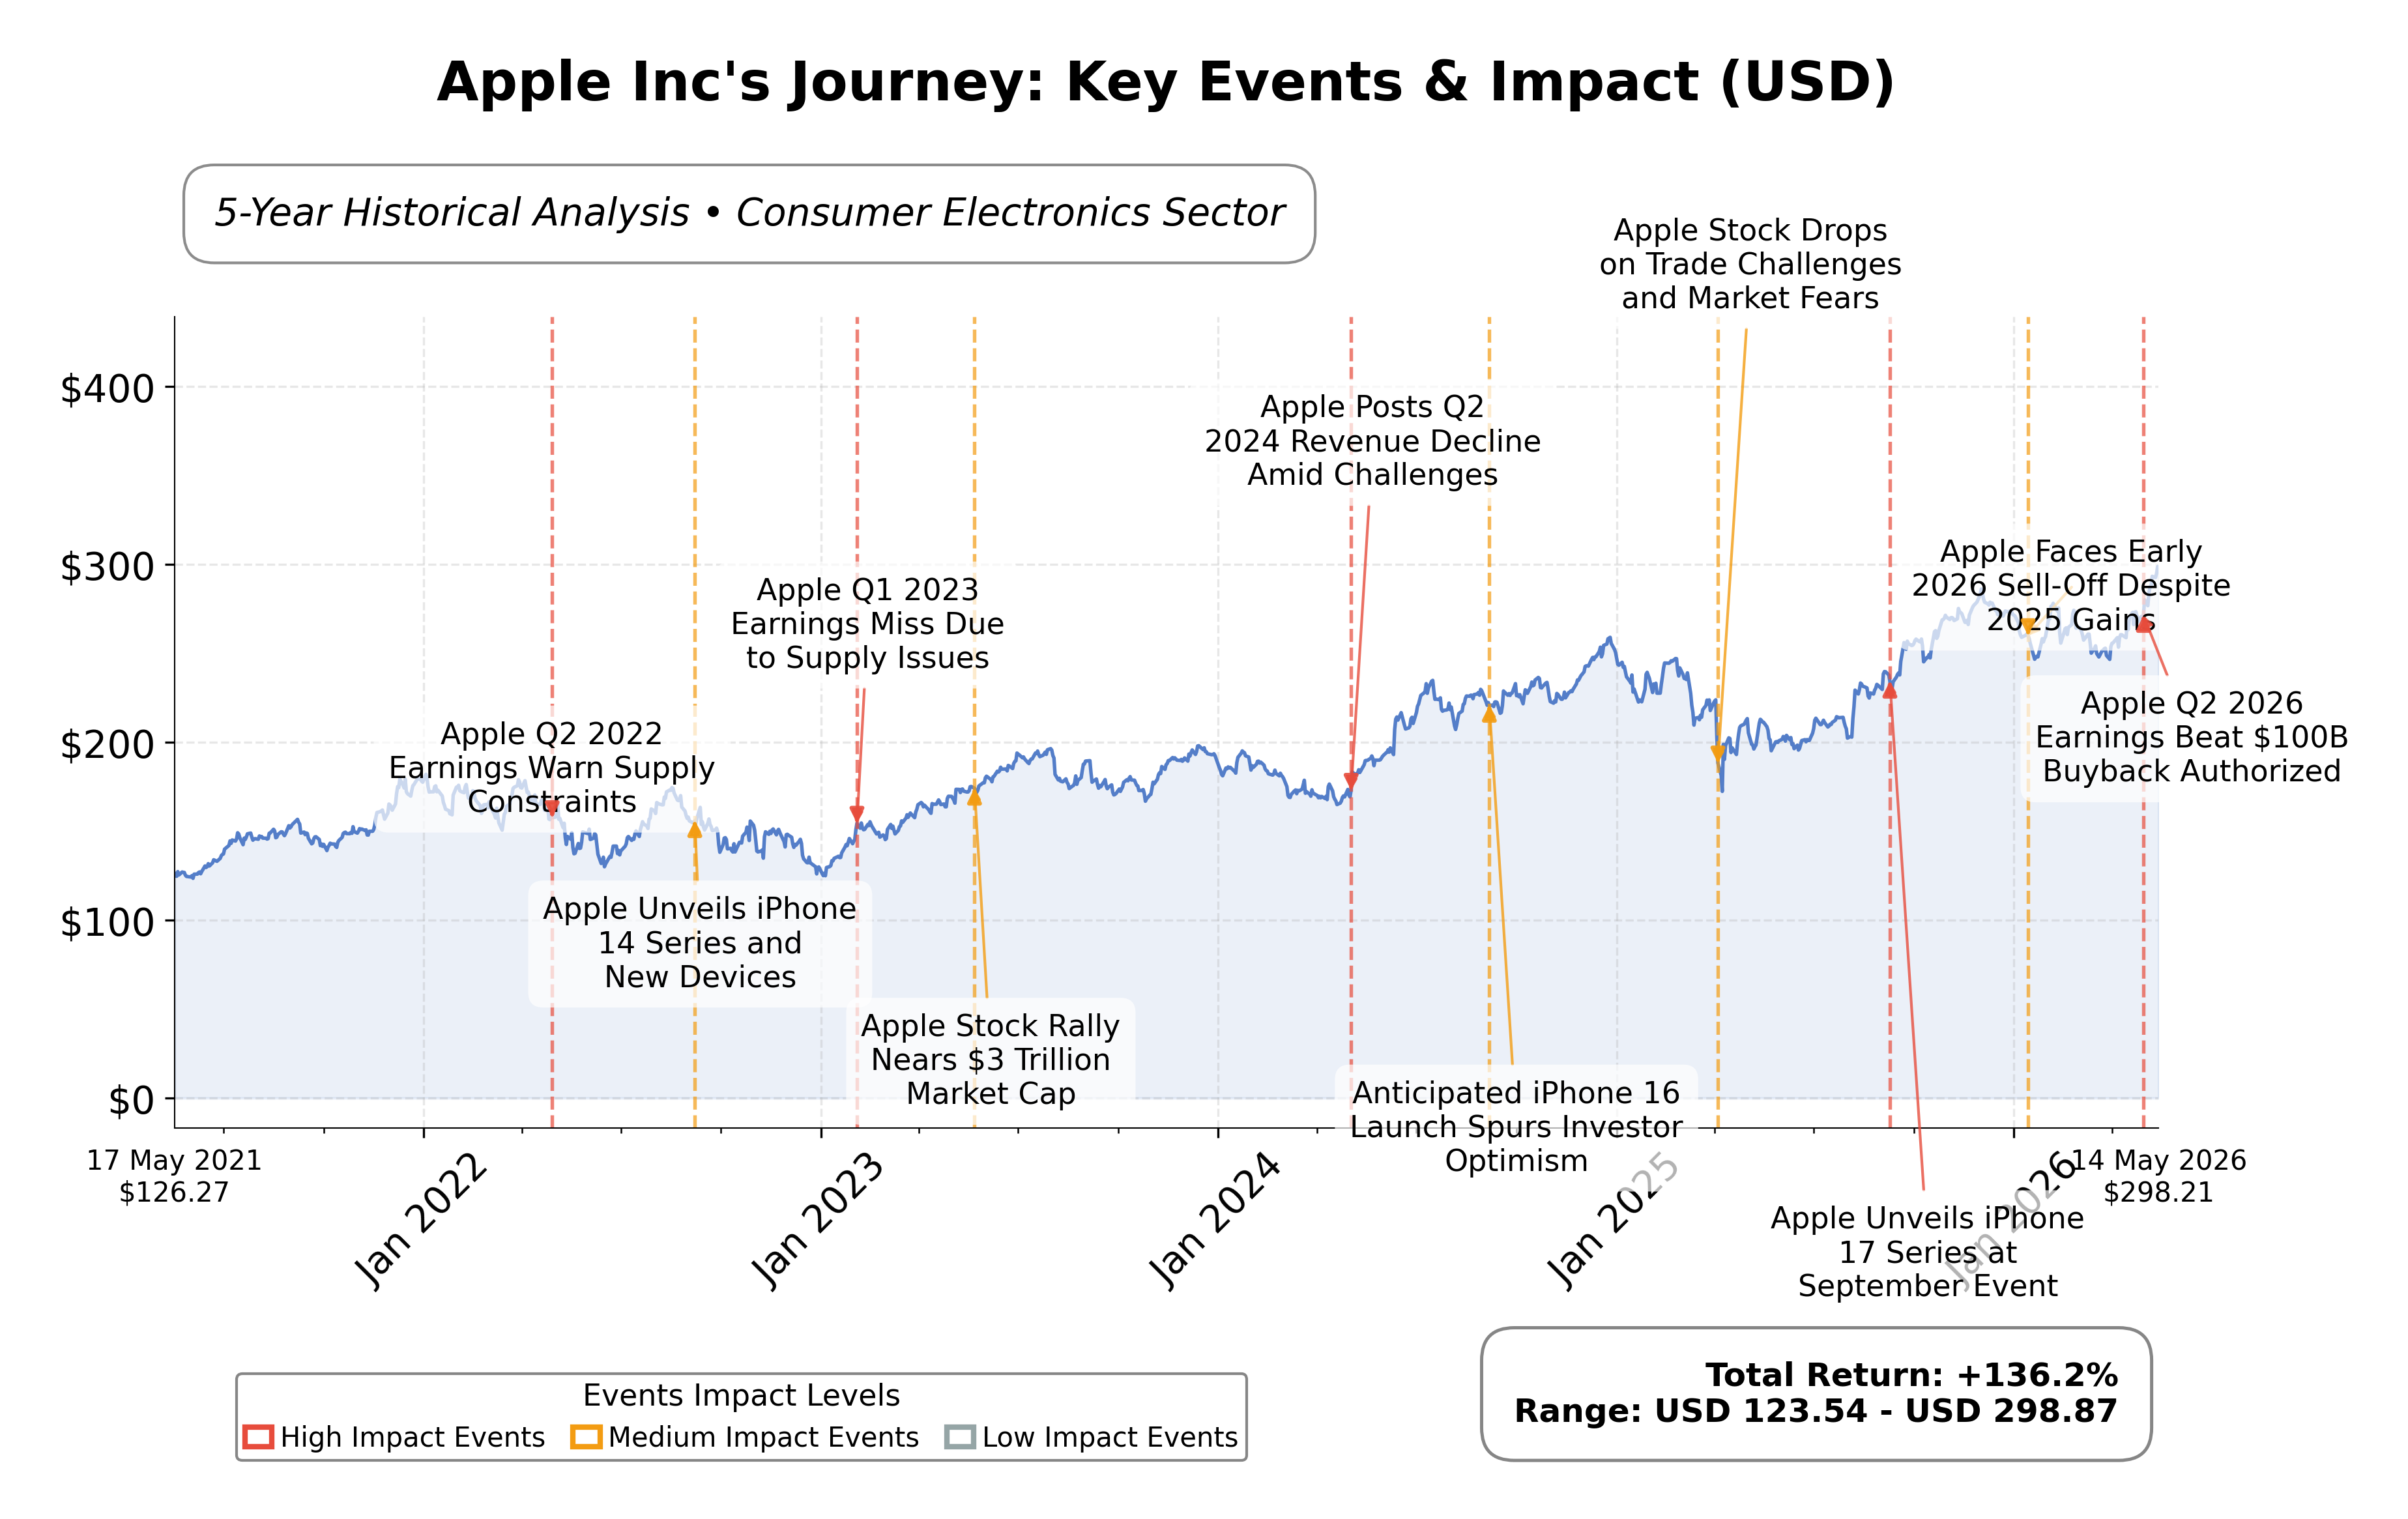
Stock Journey
Key Positives and Key Risks
Pros
- Strong profitability with a net profit margin of 27.2% and ROE of 141.5%, indicating exceptional capital efficiency.
- Robust cash flow generation with operating cash flow of $140.2 billion and free cash flow of $101.1 billion, supporting dividends and share repurchases.
- Market capitalization of $4.31 trillion and a dominant global presence reflecting scale and industry leadership.
Cons
- High valuation multiples including a trailing P/E of 35.47 and P/B ratio of 40.40, suggesting premium pricing.
- Potential legal and regulatory risks related to AI partnerships, notably the dispute with OpenAI.
- Supply chain constraints and rising component costs may pressure margins and growth.
Disclosure: This information is for general awareness and does not constitute investment advice
Report Summary
Apple Inc. is a leading technology company listed on NASDAQ under the symbol AAPL, operating primarily in the consumer electronics sector. The company designs, manufactures, and markets a broad range of innovative hardware products including the iPhone, Mac computers, iPads, Apple Watch, and accessories such as AirPods. Apple also offers a suite of digital services like the App Store, Apple Music, iCloud, and Apple TV+, positioning itself as a dominant player in the technology and consumer electronics industry with a significant global footprint.
Financially, Apple reported trailing twelve-month revenue of approximately $451.4 billion with a gross margin of 49.3%, operating margin of 32.3%, and a net profit margin of 27.2%, indicating strong profitability and operational efficiency. The company’s return on equity (ROE) stands at an exceptionally high 141.5%, and return on assets (ROA) at 26.2%, reflecting effective capital utilization and asset management. Operating cash flow reached $140.2 billion with free cash flow of $101.1 billion, underscoring robust cash generation capabilities.
Apple’s valuation metrics show a trailing price-to-earnings (P/E) ratio of 35.47 and a forward P/E of 30.68, with a price-to-book (P/B) ratio of 40.4 and an enterprise value to EBITDA (EV/EBITDA) multiple of 27.03. The market capitalization stands at approximately $4.31 trillion, with the stock currently trading at $302.27, near its 52-week high of $294.76. This pricing reflects a premium valuation relative to industry peers, supported by strong fundamentals and growth prospects.
Key strengths include a dominant market position with a vast installed base of active devices exceeding 2.5 billion, strong cash flow generation, and a low payout ratio of 12.6% supporting dividend sustainability. Risks involve ongoing supply chain constraints, rising component costs, and potential regulatory or competitive pressures, including recent tensions with OpenAI. Strategic initiatives include new product launches such as the iPhone 17 series, M4-powered iPad Air, and MacBook Neo, alongside leadership transition plans with Tim Cook moving to Executive Chairman and John Ternus assuming CEO duties.
Technically, Apple’s stock is in a strong uptrend, trading well above its 10-day, 50-day, and 200-day moving averages with momentum indicators signaling overbought conditions. Recent news highlights a mix of positive developments around AI integration and product innovation, tempered by legal challenges involving OpenAI. The overall data suggests a market environment where accumulation and profit-taking dynamics coexist, warranting close monitoring of momentum and fundamental catalysts.
Company and Industry Overview
Company Basics
Price Performance
Company Size
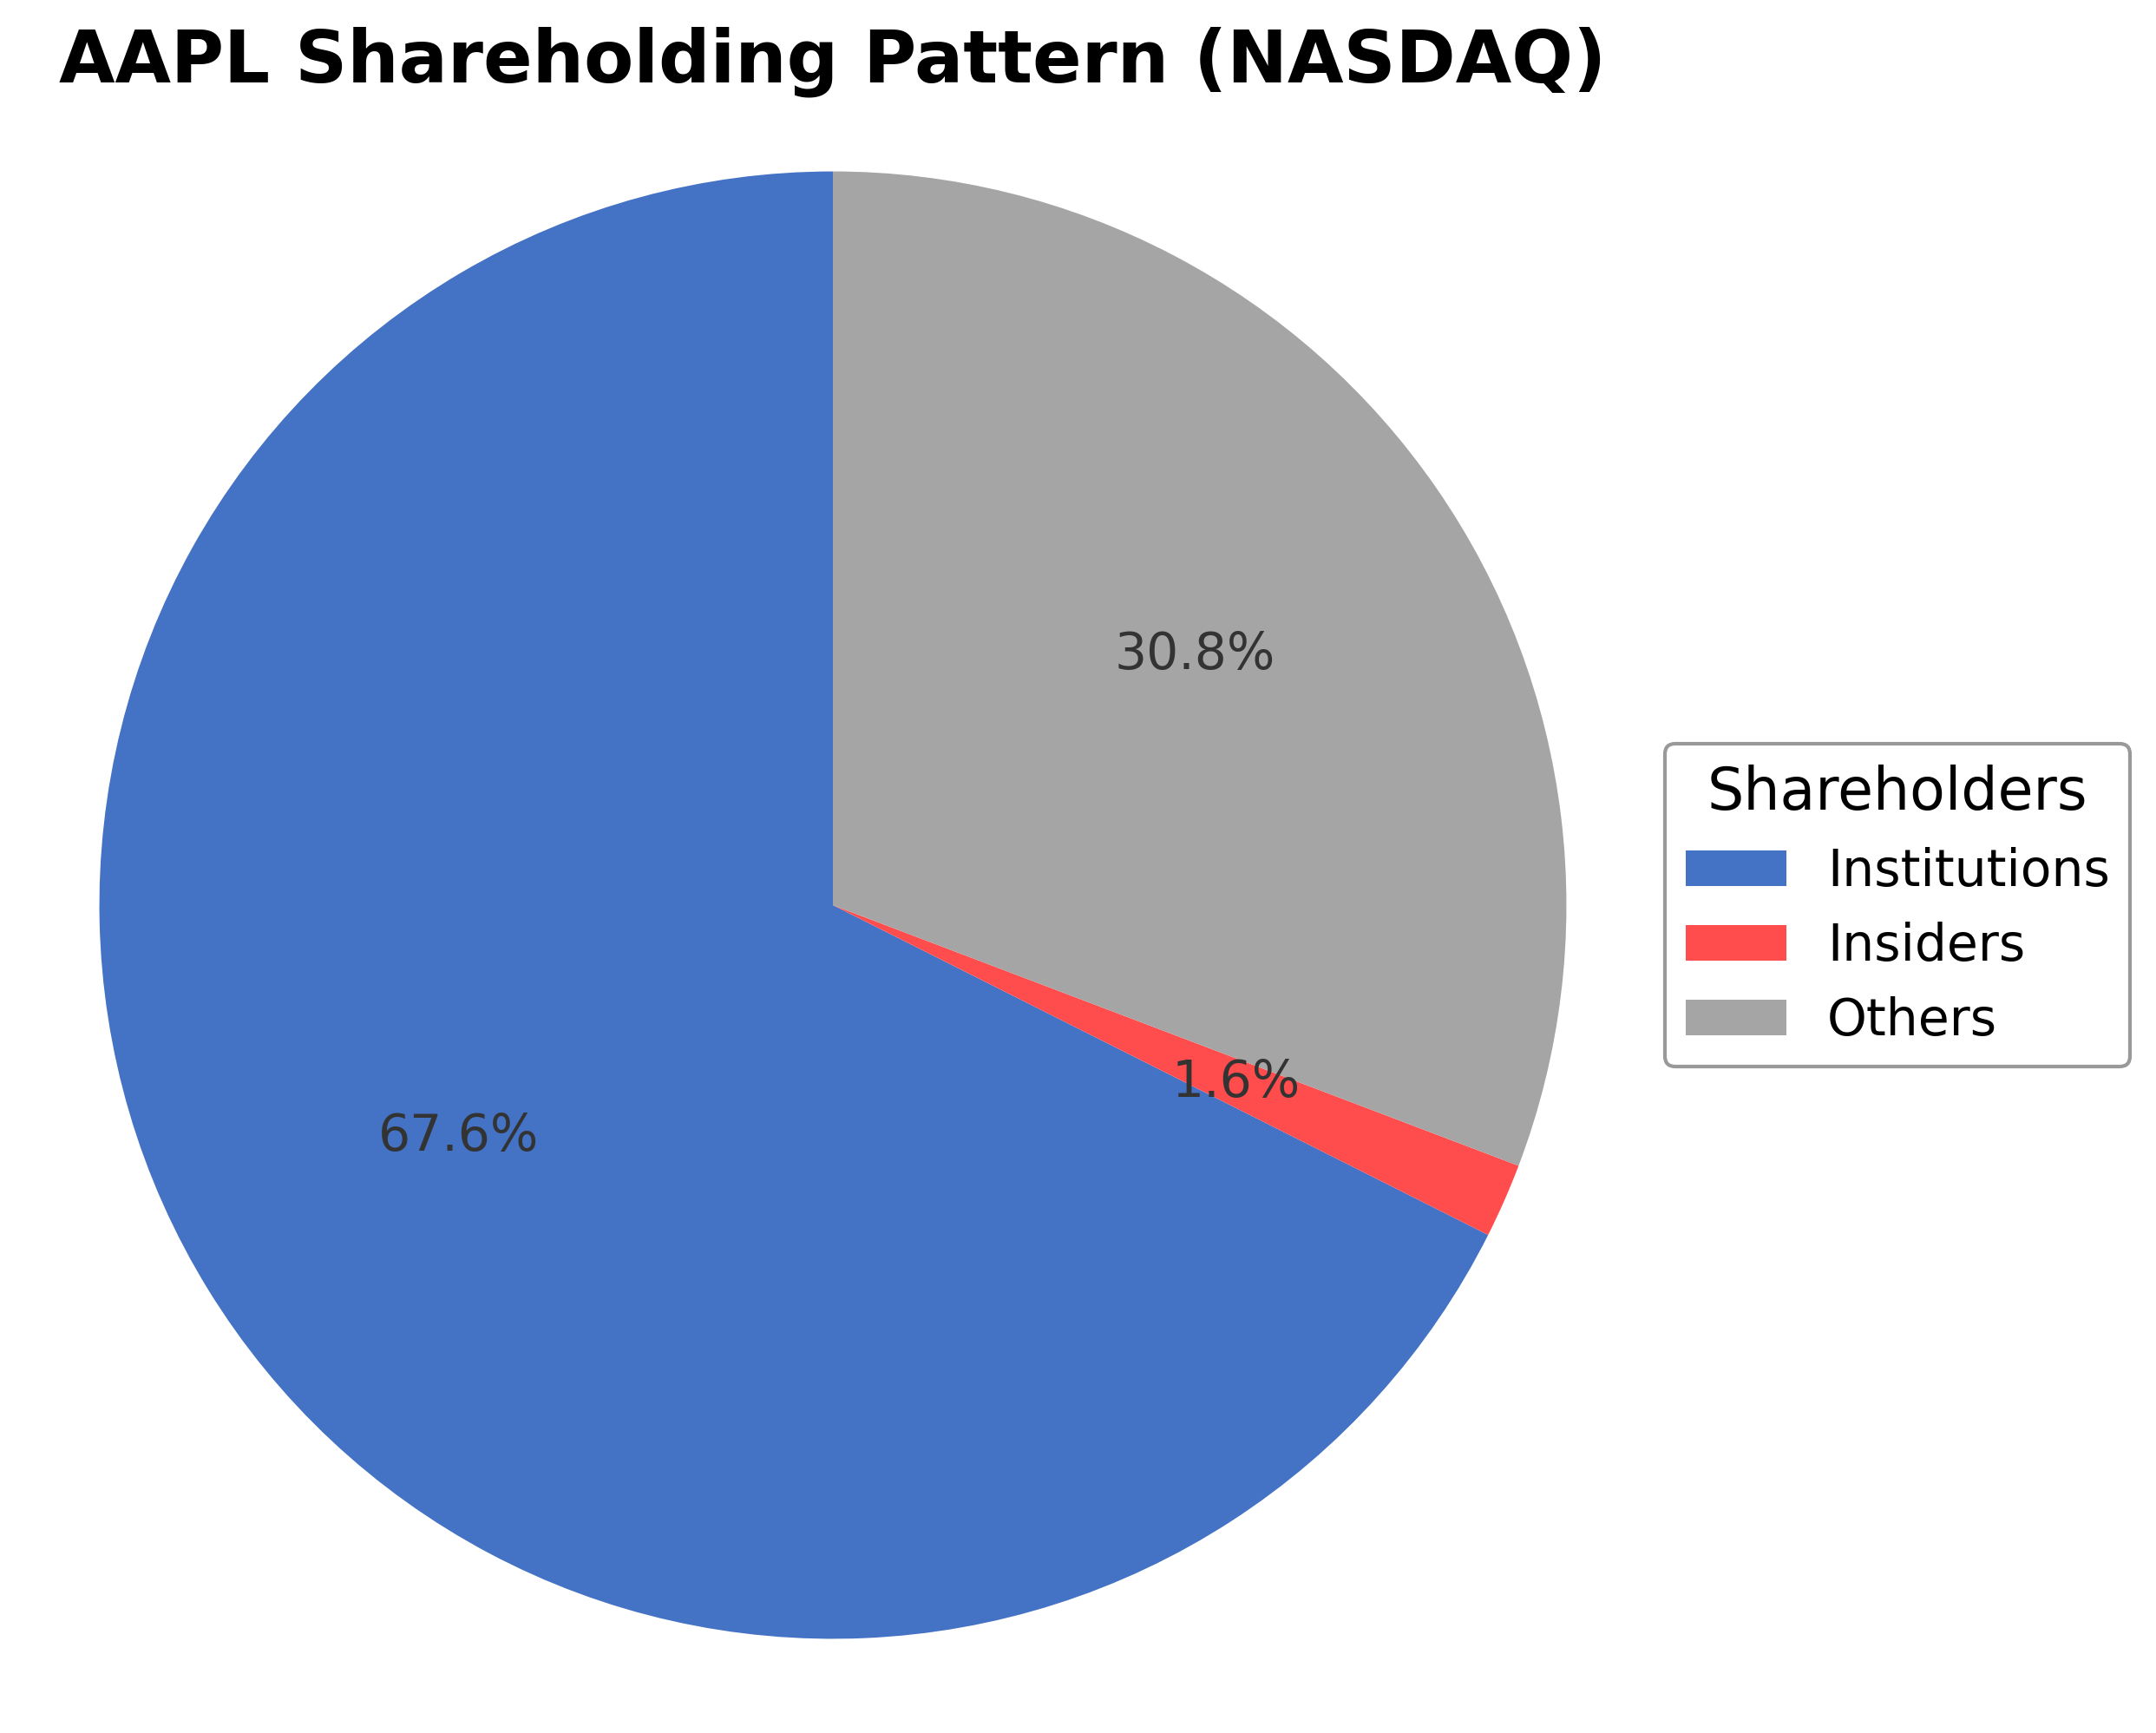
Shareholding Pattern
Sector and Industry Analysis
The global apple market is projected to grow by approximately USD 15.94 billion from 2024 to 2029, with a compound annual growth rate (CAGR) of 3.4%. This growth is supported by increasing consumer demand driven by health benefits and the introduction of new apple varieties. The market features around 25 key vendors, including Auvil Fruit Co. Inc., Batlow Fruit Co. Pty Ltd, and Stemilt Growers LLC, which collectively shape the competitive landscape.
Industry trends highlight the rising popularity of urban farming and the expansion of retail channels, including both offline and online distribution. Private-label brands are gaining traction, intensifying competition among established suppliers. Barriers to entry remain moderate due to the need for extensive supply chain networks and brand recognition, while innovation in product offerings and marketing strategies are critical for maintaining market position.
The regulatory environment affecting the apple market includes food safety standards and agricultural policies that vary by region, impacting production and distribution practices. Compliance with these regulations ensures quality and consumer safety, influencing vendor operations and market access. Looking ahead, regulatory developments are expected to emphasize sustainability and traceability, potentially affecting cost structures and competitive dynamics.
Note: Analysis synthesized from industry research, market reports, and regulatory filings. Information is subject to change based on market conditions.
Financial Ratios Dashboard
Illustrative Scenario Analysis
DCF Assumptions:
Method: Two-Stage EPS-Priority Model
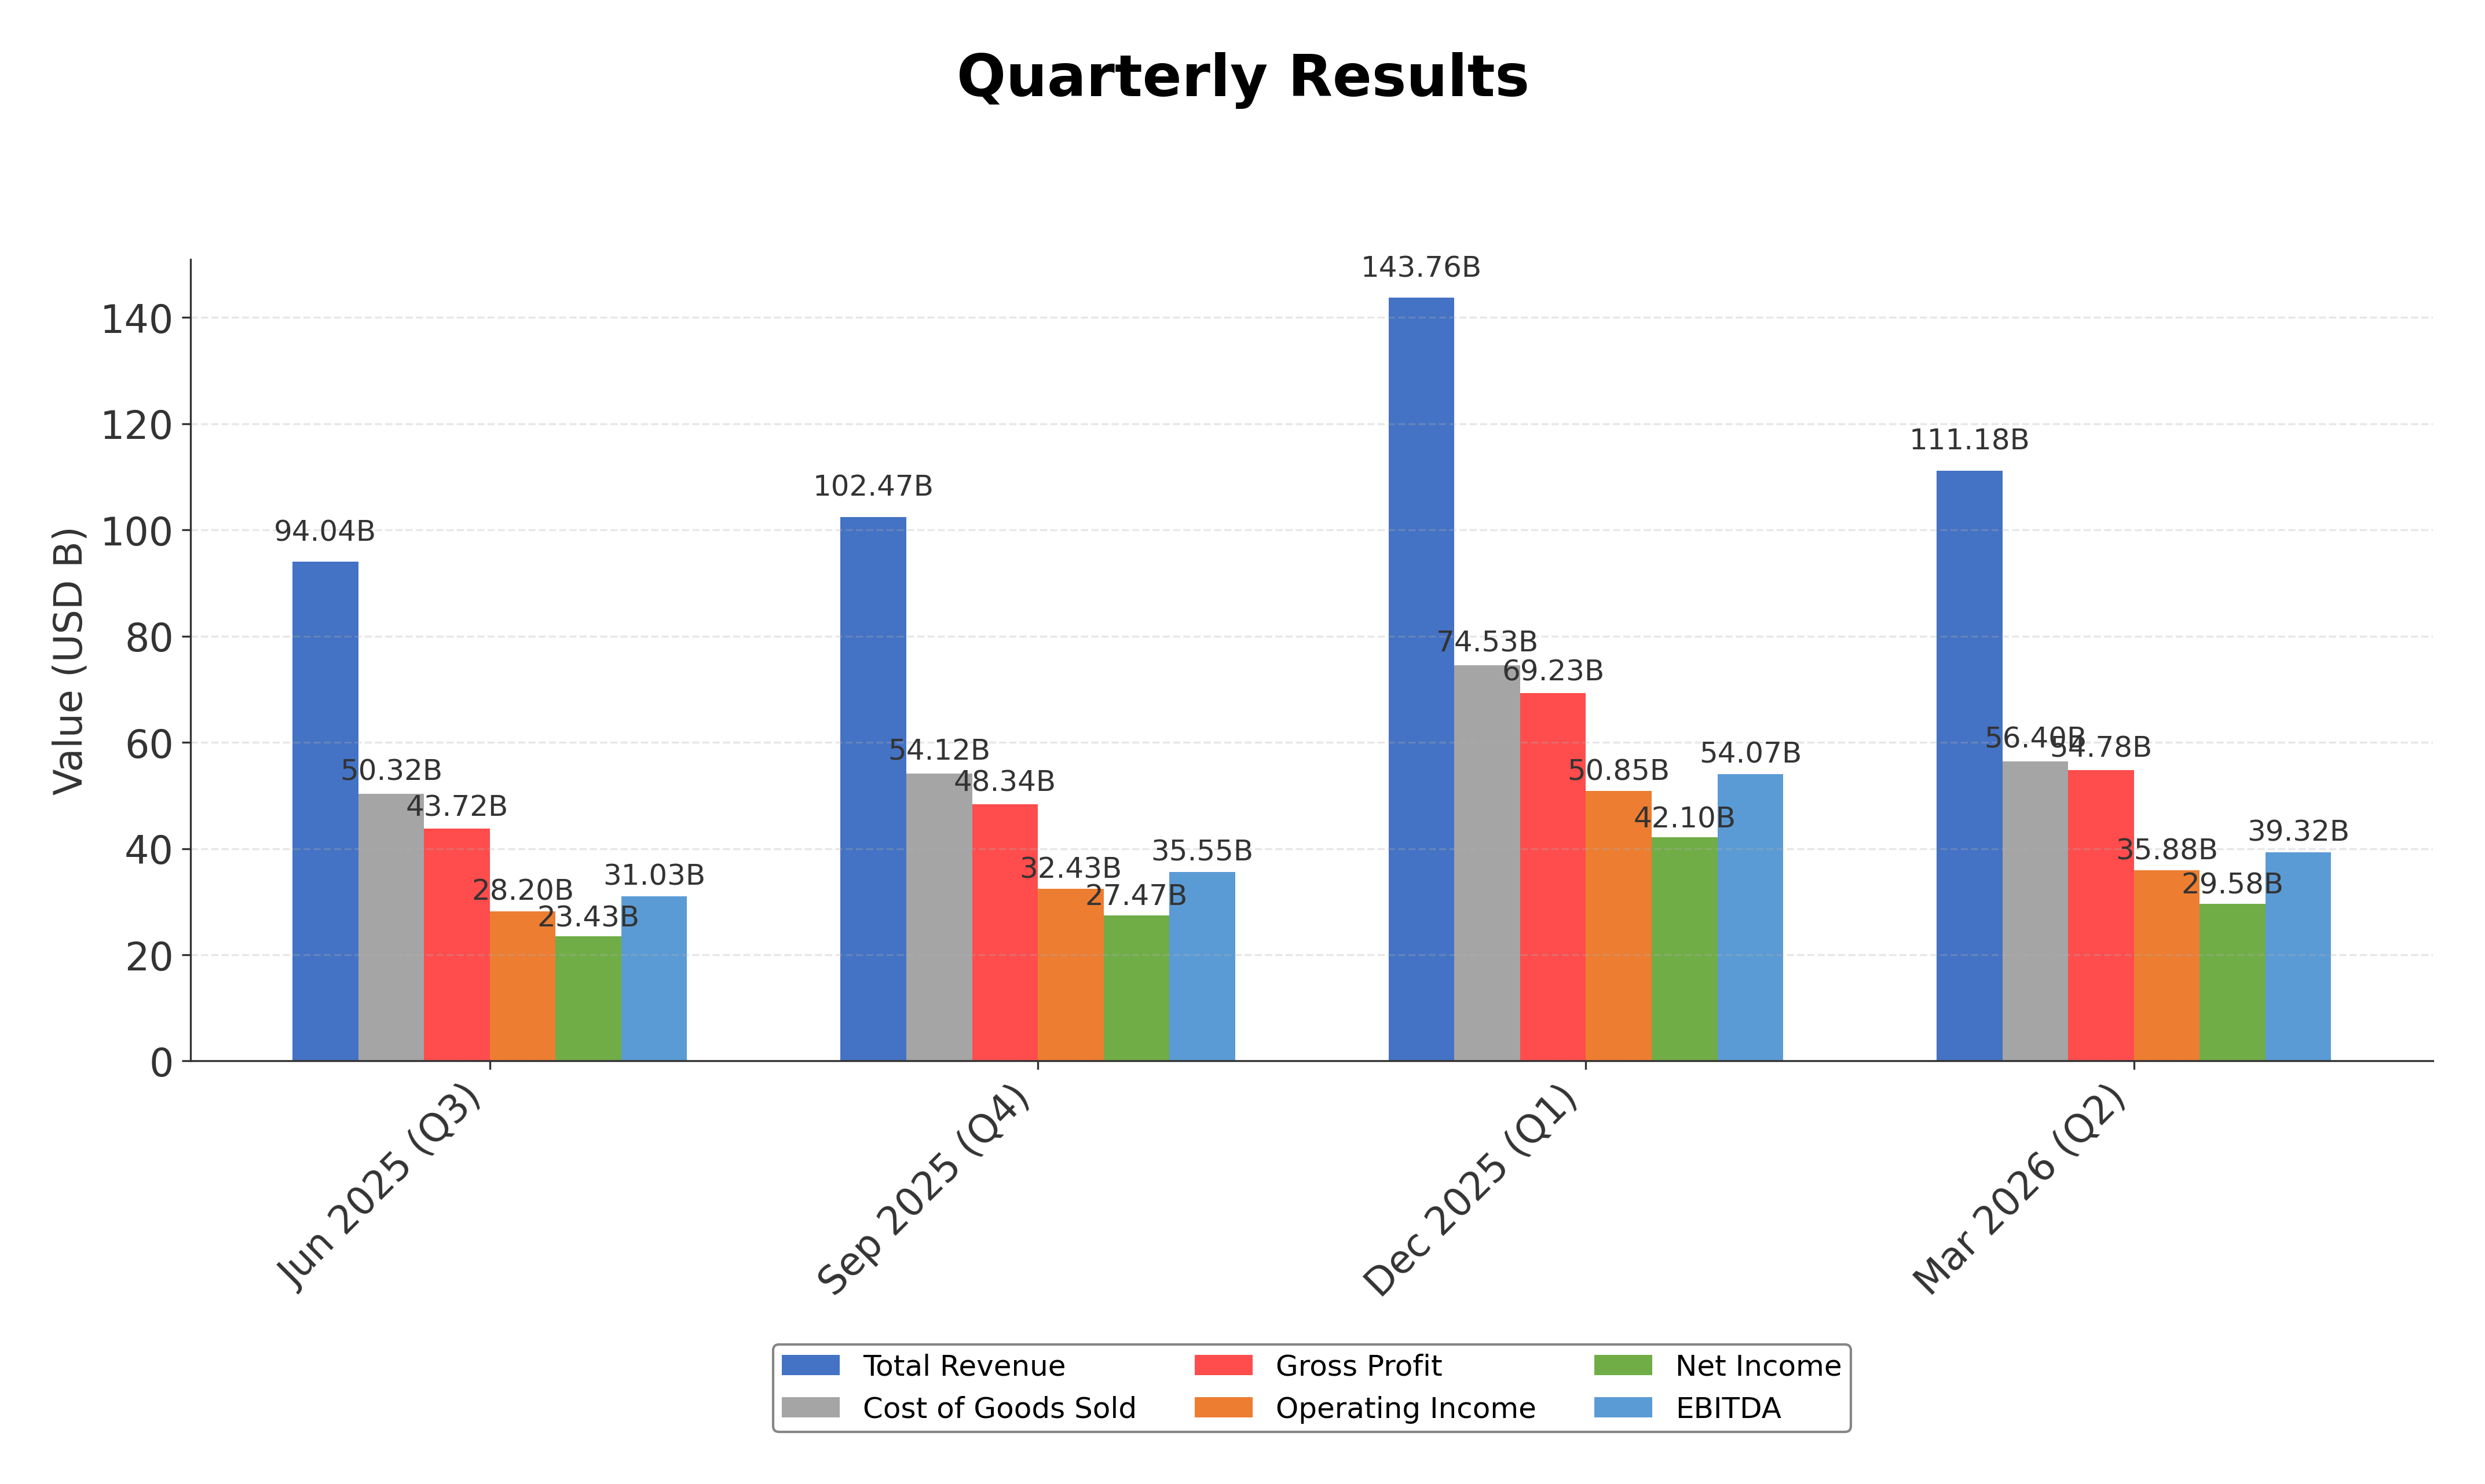
Financials
Peer Analysis
| Company Name | Market Cap | P/E Ratio | P/B Ratio | EV/EBITDA | Price to CFO |
|---|---|---|---|---|---|
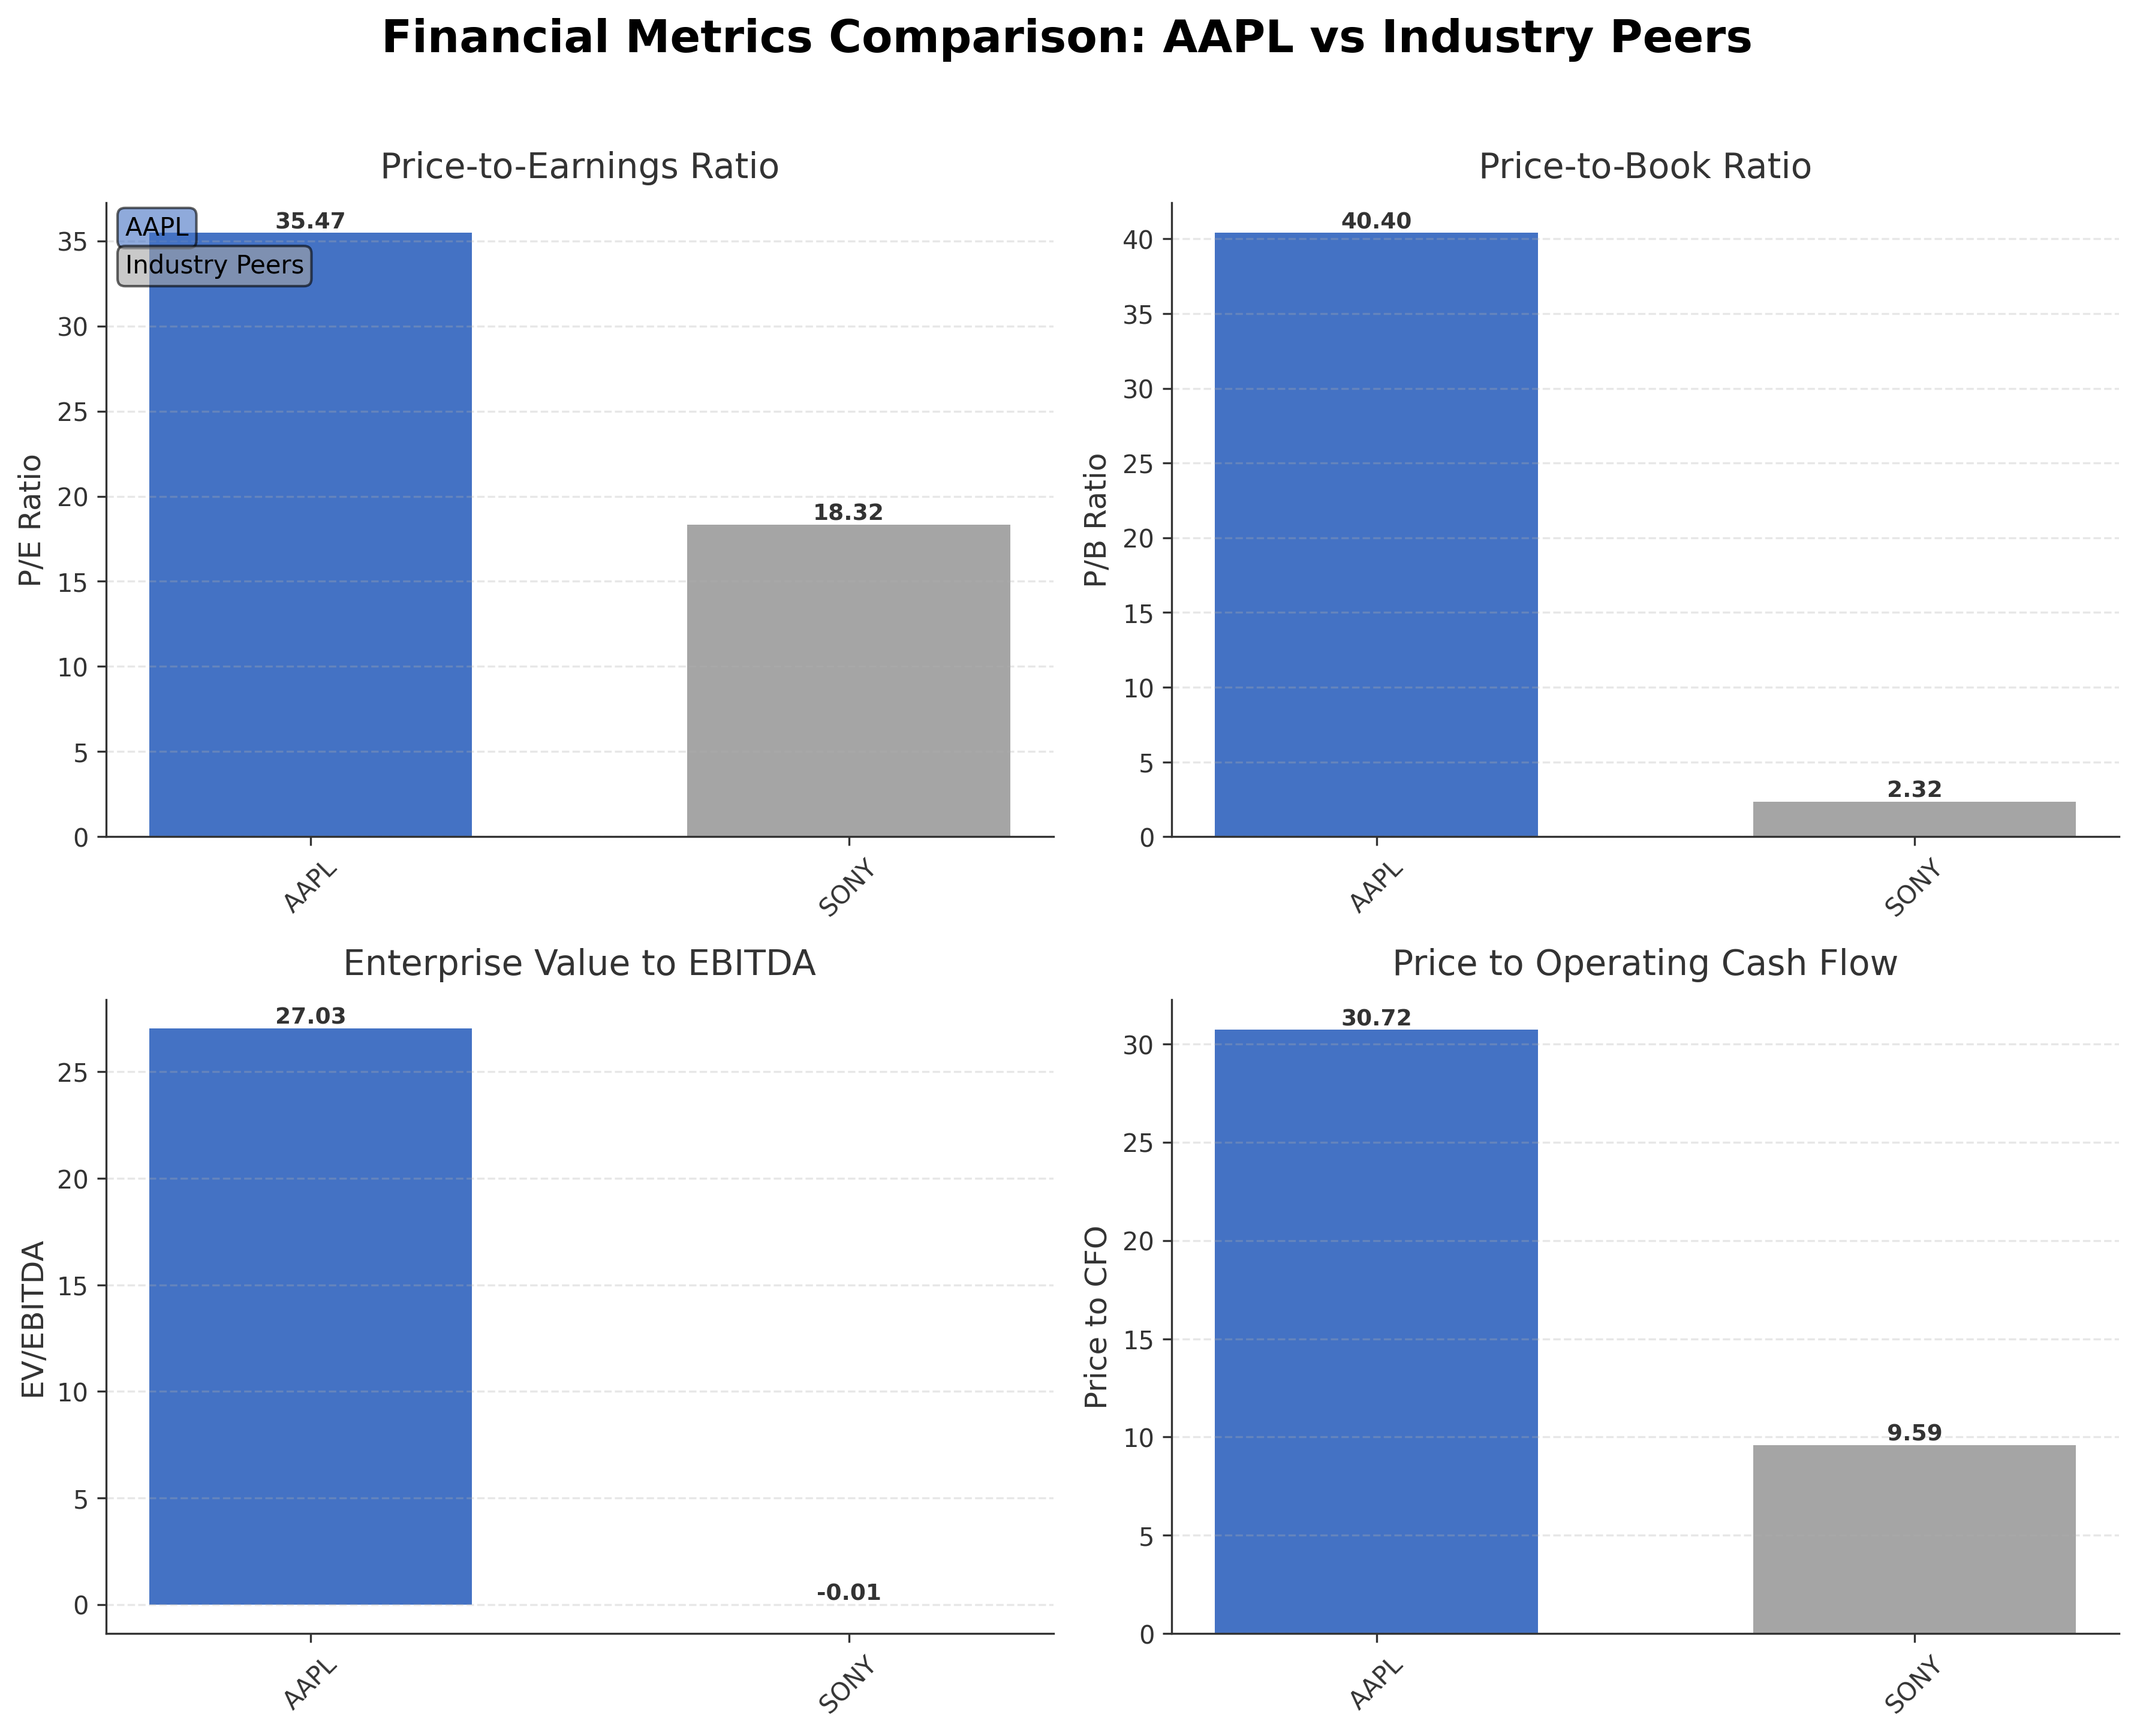
| Apple Inc | $4.31T | 35.47 | 40.40 | 27.03 | 30.72 |
| Sony Group Corporation - Sponsored American Depositary Receipt | $119.04B | 18.32 | 2.32 | -0.01 | 9.59 |
Comparison Analysis: Apple Inc. significantly outpaces its peer Sony Group Corporation in market capitalization, valuation multiples, and profitability metrics. Apple’s P/E ratio of 35.47 and P/B ratio of 40.40 are substantially higher than Sony’s 18.32 and 2.32 respectively, reflecting a premium valuation driven by superior earnings growth and brand strength. Apple’s return on equity of 141.47% dwarfs Sony’s 0.12%, indicating exceptional capital efficiency. The EV/EBITDA multiple of 27.03 for Apple contrasts with Sony’s negative figure, underscoring Apple’s robust earnings before interest, taxes, depreciation, and amortization. Overall, Apple leads the industry in scale, profitability, and investor confidence.
Financial Metrics Comparison with Peers
Financial Statements
Comprehensive financial data including income, balance sheet, and cash flow metrics
Income Statement
| fiscal_date | 2025-09-30 | 2024-09-30 | 2023-09-30 | 2022-09-30 | 2021-09-30 |
|---|---|---|---|---|---|
| Sales | 416.16B | 391.04B | 383.29B | 394.33B | 365.82B |
| Cost Of Goods | 220.96B | 210.35B | 214.14B | 223.55B | 212.98B |
| Gross Profit | 195.20B | 180.68B | 169.15B | 170.78B | 152.84B |
| Operating Expense Research And Development | 34.55B | 31.37B | 29.91B | 26.25B | 21.91B |
| Operating Expense Selling General And Administrative | 27.60B | 26.10B | 24.93B | 25.09B | 21.97B |
| Operating Income | 133.05B | 123.22B | 114.30B | 119.44B | 108.95B |
| Other Income Expense | -321.00M | 269.00M | -565.00M | -334.00M | 60.00M |
| Pretax Income | 132.73B | 123.48B | 113.74B | 119.10B | 109.21B |
| Income Tax | 20.72B | 29.75B | 16.74B | 19.30B | 14.53B |
| Net Income | 112.01B | 93.74B | 97.00B | 99.80B | 94.68B |
| Eps Basic | 7.49 | 6.11 | 6.16 | 6.15 | 5.67 |
| Eps Diluted | 7.46 | 6.08 | 6.13 | 6.11 | 5.61 |
| Basic Shares Outstanding | 14.95B | 15.34B | 15.74B | 16.22B | 16.70B |
| Diluted Shares Outstanding | 14.95B | 15.34B | 15.74B | 16.22B | 16.70B |
| Ebit | 133.05B | 123.22B | 114.30B | 119.44B | 111.85B |
| Ebitda | 144.75B | 134.66B | 125.82B | 130.54B | 123.14B |
| Net Income Continuous Operations | 112.01B | 93.74B | 97.00B | 99.80B | 94.68B |
| Non Operating Interest Income | N/A | N/A | 3.75B | 2.83B | 2.84B |
| Non Operating Interest Expense | N/A | N/A | 3.93B | 2.93B | 2.65B |
Source: Financial statements and regulatory filings
Balance Sheet
| fiscal_date | 2025-09-30 | 2024-09-30 | 2023-09-30 | 2022-09-30 | 2021-09-30 |
|---|---|---|---|---|---|
| Cash And Cash Equivalents | 35.93B | 29.94B | 29.96B | 23.65B | 34.94B |
| Accounts Receivable | 39.78B | 33.41B | 29.51B | 28.18B | 26.28B |
| Total Assets | 359.24B | 364.98B | 352.58B | 352.75B | 351.00B |
| Total Liabilities | 285.51B | 308.03B | 290.44B | 302.08B | 287.91B |
| Long Term Debt | 78.33B | 85.75B | 95.28B | 109.71B | 119.38B |
| Shareholders Equity | 73.73B | 56.95B | 62.15B | 50.67B | 63.09B |
Source: Financial statements and regulatory filings
Cash Flow Statement
| fiscal_date | 2025-09-30 | 2024-09-30 | 2023-09-30 | 2022-09-30 | 2021-09-30 |
|---|---|---|---|---|---|
| Operating Activities Net Income | 112.01B | 93.74B | 97.00B | 99.80B | 94.68B |
| Operating Activities Depreciation | 11.70B | 11.45B | 11.52B | 11.10B | 11.28B |
| Operating Activities Stock Based Compensation | 12.86B | 11.69B | 10.83B | 9.04B | 7.91B |
| Operating Activities Other Non Cash Items | -89.00M | -2.27B | -2.23B | 1.01B | -4.92B |
| Operating Activities Accounts Receivable | -7.03B | -5.14B | -417.00M | -9.34B | -14.03B |
| Operating Activities Accounts Payable | 902.00M | 6.02B | -1.89B | 9.45B | 12.33B |
| Operating Activities Other Assets Liabilities | -18.87B | 2.77B | -4.27B | 1.57B | -1.53B |
| Operating Activities Operating Cash Flow | 111.48B | 118.25B | 110.54B | 123.52B | 100.94B |
| Investing Activities Capital Expenditures | -12.71B | -9.45B | -10.96B | -10.71B | -11.09B |
| Investing Activities Purchase Of Investments | -24.41B | -48.66B | -29.51B | -76.92B | -109.56B |
| Investing Activities Sale Of Investments | 53.80B | 62.35B | 45.51B | 67.36B | 106.48B |
| Investing Activities Other Investing Activity | -1.48B | -1.31B | -1.34B | -2.09B | -385.00M |
| Investing Activities Investing Cash Flow | 15.20B | 2.94B | 3.71B | -22.66B | -14.58B |
| Financing Activities Long Term Debt Issuance | 4.48B | 0.00 | 5.23B | 5.46B | 20.39B |
| Financing Activities Long Term Debt Payments | -10.93B | -9.96B | -11.15B | -9.54B | -8.75B |
| Financing Activities Short Term Debt Issuance | -2.03B | 3.96B | -3.98B | 3.96B | 1.02B |
| Financing Activities Common Stock Repurchase | -90.71B | -94.95B | -77.55B | -89.40B | -85.97B |
| Financing Activities Common Dividends | -15.42B | -15.23B | -15.03B | -14.84B | -14.47B |
| Financing Activities Other Financing Charges | -6.07B | -5.80B | -6.01B | -6.38B | -5.58B |
| Financing Activities Financing Cash Flow | -120.69B | -121.98B | -108.49B | -110.75B | -92.25B |
| End Cash Position | 35.93B | 29.94B | 30.74B | 24.98B | 35.93B |
| Income Tax Paid | 43.37B | 26.10B | 18.68B | 19.57B | 25.39B |
| Free Cash Flow | 98.77B | 108.81B | 99.58B | 111.44B | 92.95B |
| Interest Paid | N/A | N/A | 3.80B | 2.87B | 2.69B |
| Operating Activities Deferred Taxes | N/A | N/A | N/A | 895.00M | -4.77B |
| Investing Activities Net Acquisitions | N/A | N/A | N/A | -306.00M | -33.00M |
| Financing Activities Common Stock Issuance | N/A | N/A | N/A | N/A | 1.10B |
Source: Financial statements and regulatory filings
Technical Analysis
Key Insights
- Apple’s stock is currently in a strong upward trend, exhibiting consistent higher highs and higher lows in recent price action.
- Key support levels are identified near $260 and $270, while resistance is observed around the recent high near $295.
- The stock trades well above its 10-day, 50-day, and 200-day moving averages, indicating sustained bullish momentum.
- Momentum indicators show an RSI of approximately 73, signaling overbought conditions; MACD remains positive with bullish crossover, and Stochastic oscillators are elevated.
- Multi-timeframe analysis reveals bullish trends on daily, weekly, and monthly charts, though the overbought RSI suggests potential for short-term consolidation.
- Potential market scenarios include continuation of the uptrend if support holds, or a corrective pullback if momentum wanes, with volatility likely around key moving averages.
Trending News
1. Headline: Cerebras IPO Stock Pop; Apple-OpenAI Drama — The Information
Summary: This was quite the day. OpenAI is jumping up and down about its unhappiness with Apple (it’s doubtful Tim Cook is shaking in his boots). Big telecom threw down the gauntlet to Elon Musk and Amazon (not that they should worry). We get to both news items lower down.
Sentiment: negative
2. Headline: Apple Stock Falls After $300 Test: Why AAPL’s OpenAI Risk Is Back
Summary: This strategic move led to increased customer spending, pushing Figma's stock price to a seven-week high. The adjustment highlights the growing demand for AI capabilities within design tools and reflects strong market confidence in Figma's revenue model. ... Blackstone and Clayton, Dubilier & Rice are considering bids for Magnum Ice Cream Company, owner of Ben & Jerry’s and Cornetto, Reuters reported. Magnum shares surged nearly 16% after the news...
Sentiment: positive
3. Headline: Apple stock (US0378331005): near record highs as OpenAI dispute and AI optimism collide
Summary: Reports this week suggested OpenAI ... investor focus on AI services, according to Stocktwits News as of 05/14/2026 and TradingEconomics as of 05/07/2026. ... By the editorial team – specialized in equity coverage. Name: Apple Inc....
Sentiment: positive
4. Headline: AAPL Stock Slips From Record Highs As Legal Action Threatens OpenAI Alliance: Report
Summary: Apple (AAPL) stock eased on Thursday, dropping marginally from its record highs after media reports suggested OpenAI is considering suing the iPhone maker over the way ChatGPT was integrated with Apple’s mobile ecosystem. OpenAI lawyers are actively working with an outside legal firm on a range of options that could be formally executed in the near future and that could include ...
Sentiment: negative
5. Headline: Apple Stock Forecast: Wedbush Raises Apple Target to $400 on AI Push | AAPL - TheStreet
Summary: Apple stock bull makes towering new call on AI potential
Sentiment: positive
Recent Updates
News Summary
As of 2026-05-14. Apple reported record-breaking quarterly results for Q2 2026 with revenue of $111.2 billion, a 17% year-over-year increase, driven by strong sales of the iPhone 17 lineup and all-time high Services revenue. Diluted EPS rose 22% to $2.01, supported by robust gross margins of 49.3% and operating income growth of 21%. The company announced a 4% increase in its quarterly dividend to $0.27 per share and authorized an additional $100 billion share repurchase program, underscoring strong capital return policies. Product innovation continued with major software updates planned for iPhone, including a redesigned Camera app and enhanced Siri capabilities. Leadership transition plans were disclosed, with Tim Cook moving to Executive Chairman and John Ternus assuming the CEO role. Overall, Apple’s financial performance and strategic initiatives highlight sustained growth and operational strength.
News Sentiment
The overall sentiment from recent updates is predominantly positive, driven by record financial results, strong product demand, and strategic capital allocation decisions. Positive investor reactions are supported by dividend increases and share repurchase authorizations, reflecting confidence in cash flow generation. Innovation in software and product offerings further bolsters market optimism. However, some cautious tones emerge from ongoing legal risks related to AI partnerships, which could introduce uncertainties. Balancing these factors, the prevailing outlook remains favorable with attention to execution and external risks.
Source List
Analytical Overview
Analysis Summary
Apple’s valuation metrics, including a trailing P/E of 35.47 and forward P/E of 30.68, are elevated relative to the consumer electronics industry average of 35.47, reflecting premium pricing supported by strong earnings growth and brand dominance. The company exhibits a solid growth trajectory with a 16.6% quarterly revenue growth and a 19.4% year-over-year earnings increase, complemented by substantial operating cash flow of $140.2 billion. Financial health remains robust with a manageable debt-to-equity ratio of 79.5%, a current ratio of 1.07, and free cash flow exceeding $101 billion, indicating strong liquidity and capital flexibility. Sector-specific opportunities include expanding services revenue and AI integration, while challenges encompass supply chain constraints and competitive pressures. Market positioning and competitive advantages are reinforced by a vast installed device base and continuous innovation, supporting sustained leadership in the technology sector.
Overall Business and Market Assessment
Supporting Factors: No data
Risk Factors: potential legal disputes with AI partners and supply chain disruptions that could impact margins and growth
SWOT Analysis
Strengths
- Market leadership with a vast global installed base exceeding 2.5 billion active devices.
- Strong profitability with gross margin near 49.3% and net profit margin above 27%.
- Robust cash flow generation supporting dividends and share repurchases.
- Diverse product and services ecosystem enhancing customer loyalty and revenue streams.
Weaknesses
- High valuation multiples including P/E of 35.47 and P/B of 40.40 may limit upside.
- Relatively high debt-to-equity ratio of 79.5% compared to some peers.
- Dependence on iPhone sales for a significant portion of revenue.
- Potential vulnerability to supply chain constraints and component cost inflation.
Opportunities
- Expansion of services segment including AI and subscription-based offerings.
- Growth in emerging markets and increasing device penetration.
- Advancements in software integration and user experience enhancements.
- Strategic acquisitions to bolster technology and creative tool capabilities.
Threats
- Legal and regulatory risks related to AI partnerships and antitrust scrutiny.
- Intense competition in consumer electronics and technology sectors.
- Macroeconomic factors affecting consumer spending and supply chains.
- Potential impacts from geopolitical tensions and trade disputes.
Company Description
Apple Inc. is a leading technology company renowned for designing, manufacturing, and marketing innovative hardware and software products for consumers and businesses worldwide. Its flagship product, the iPhone, accounts for the majority of sales, serving as the central hub of an expansive ecosystem that includes Mac computers, iPad tablets, Apple Watch wearables, and accessories like AirPods. Apple Inc. also offers a suite of services such as the App Store, Apple Music, iCloud, Apple TV+, and Apple Fitness+, providing digital content, cloud storage, and subscription-based platforms. Operating in the consumer electronics industry within the technology sector, the company employs approximately 166,000 people and maintains a broad global presence through online stores, retail outlets, and partnerships with carriers and resellers. With a substantial market capitalization reflecting its scale, Apple Inc. plays a pivotal role in shaping consumer technology trends, emphasizing seamless integration across devices and services to enhance user experience and productivity.