


Apple Inc (AAPL)
Stock Analysis Report
Stock Journey
Key Positives and Key Risks
Pros
- Revenue growth of 16.6% year-over-year demonstrates strong top-line expansion.
- Operating cash flow of $140.2 billion and free cash flow of $101.1 billion indicate robust cash generation.
- Market capitalization of $4.9 trillion reflects dominant market position and investor confidence.
Cons
- Trailing P/E ratio of 40.3 and P/B ratio of 45.97 suggest the stock is trading at a significant premium.
- Debt-to-equity ratio of 79.5% indicates relatively high leverage compared to cash reserves.
- Return on equity at 1.41% is low relative to industry peers, highlighting potential efficiency concerns.
Disclosure: This information is for general awareness and does not constitute investment advice
Report Summary
Apple Inc. operates as a leading global technology company listed on NASDAQ under the symbol AAPL, specializing in consumer electronics, software, and digital services. Its product portfolio includes flagship devices such as the iPhone, Mac computers, iPad tablets, and wearables like the Apple Watch and AirPods. The company also provides a range of services including the App Store, Apple Music, and cloud-based offerings, positioning itself strongly within the Technology sector and Consumer Electronics industry. Apple’s integrated ecosystem and broad geographic reach support its market leadership and competitive positioning.
Financially, Apple reported trailing twelve-month revenue of approximately $451.4 billion with a gross margin of 49.3%, an operating margin of 32.3%, and a net profit margin of 27.2%. Return on equity (ROE) stands at 141.5%, and return on assets (ROA) is 26.2%, indicating highly efficient use of capital and assets. The company generated $140.2 billion in operating cash flow and $101.1 billion in free cash flow over the trailing twelve months, underscoring strong cash generation capabilities. These metrics reflect robust profitability and operational efficiency.
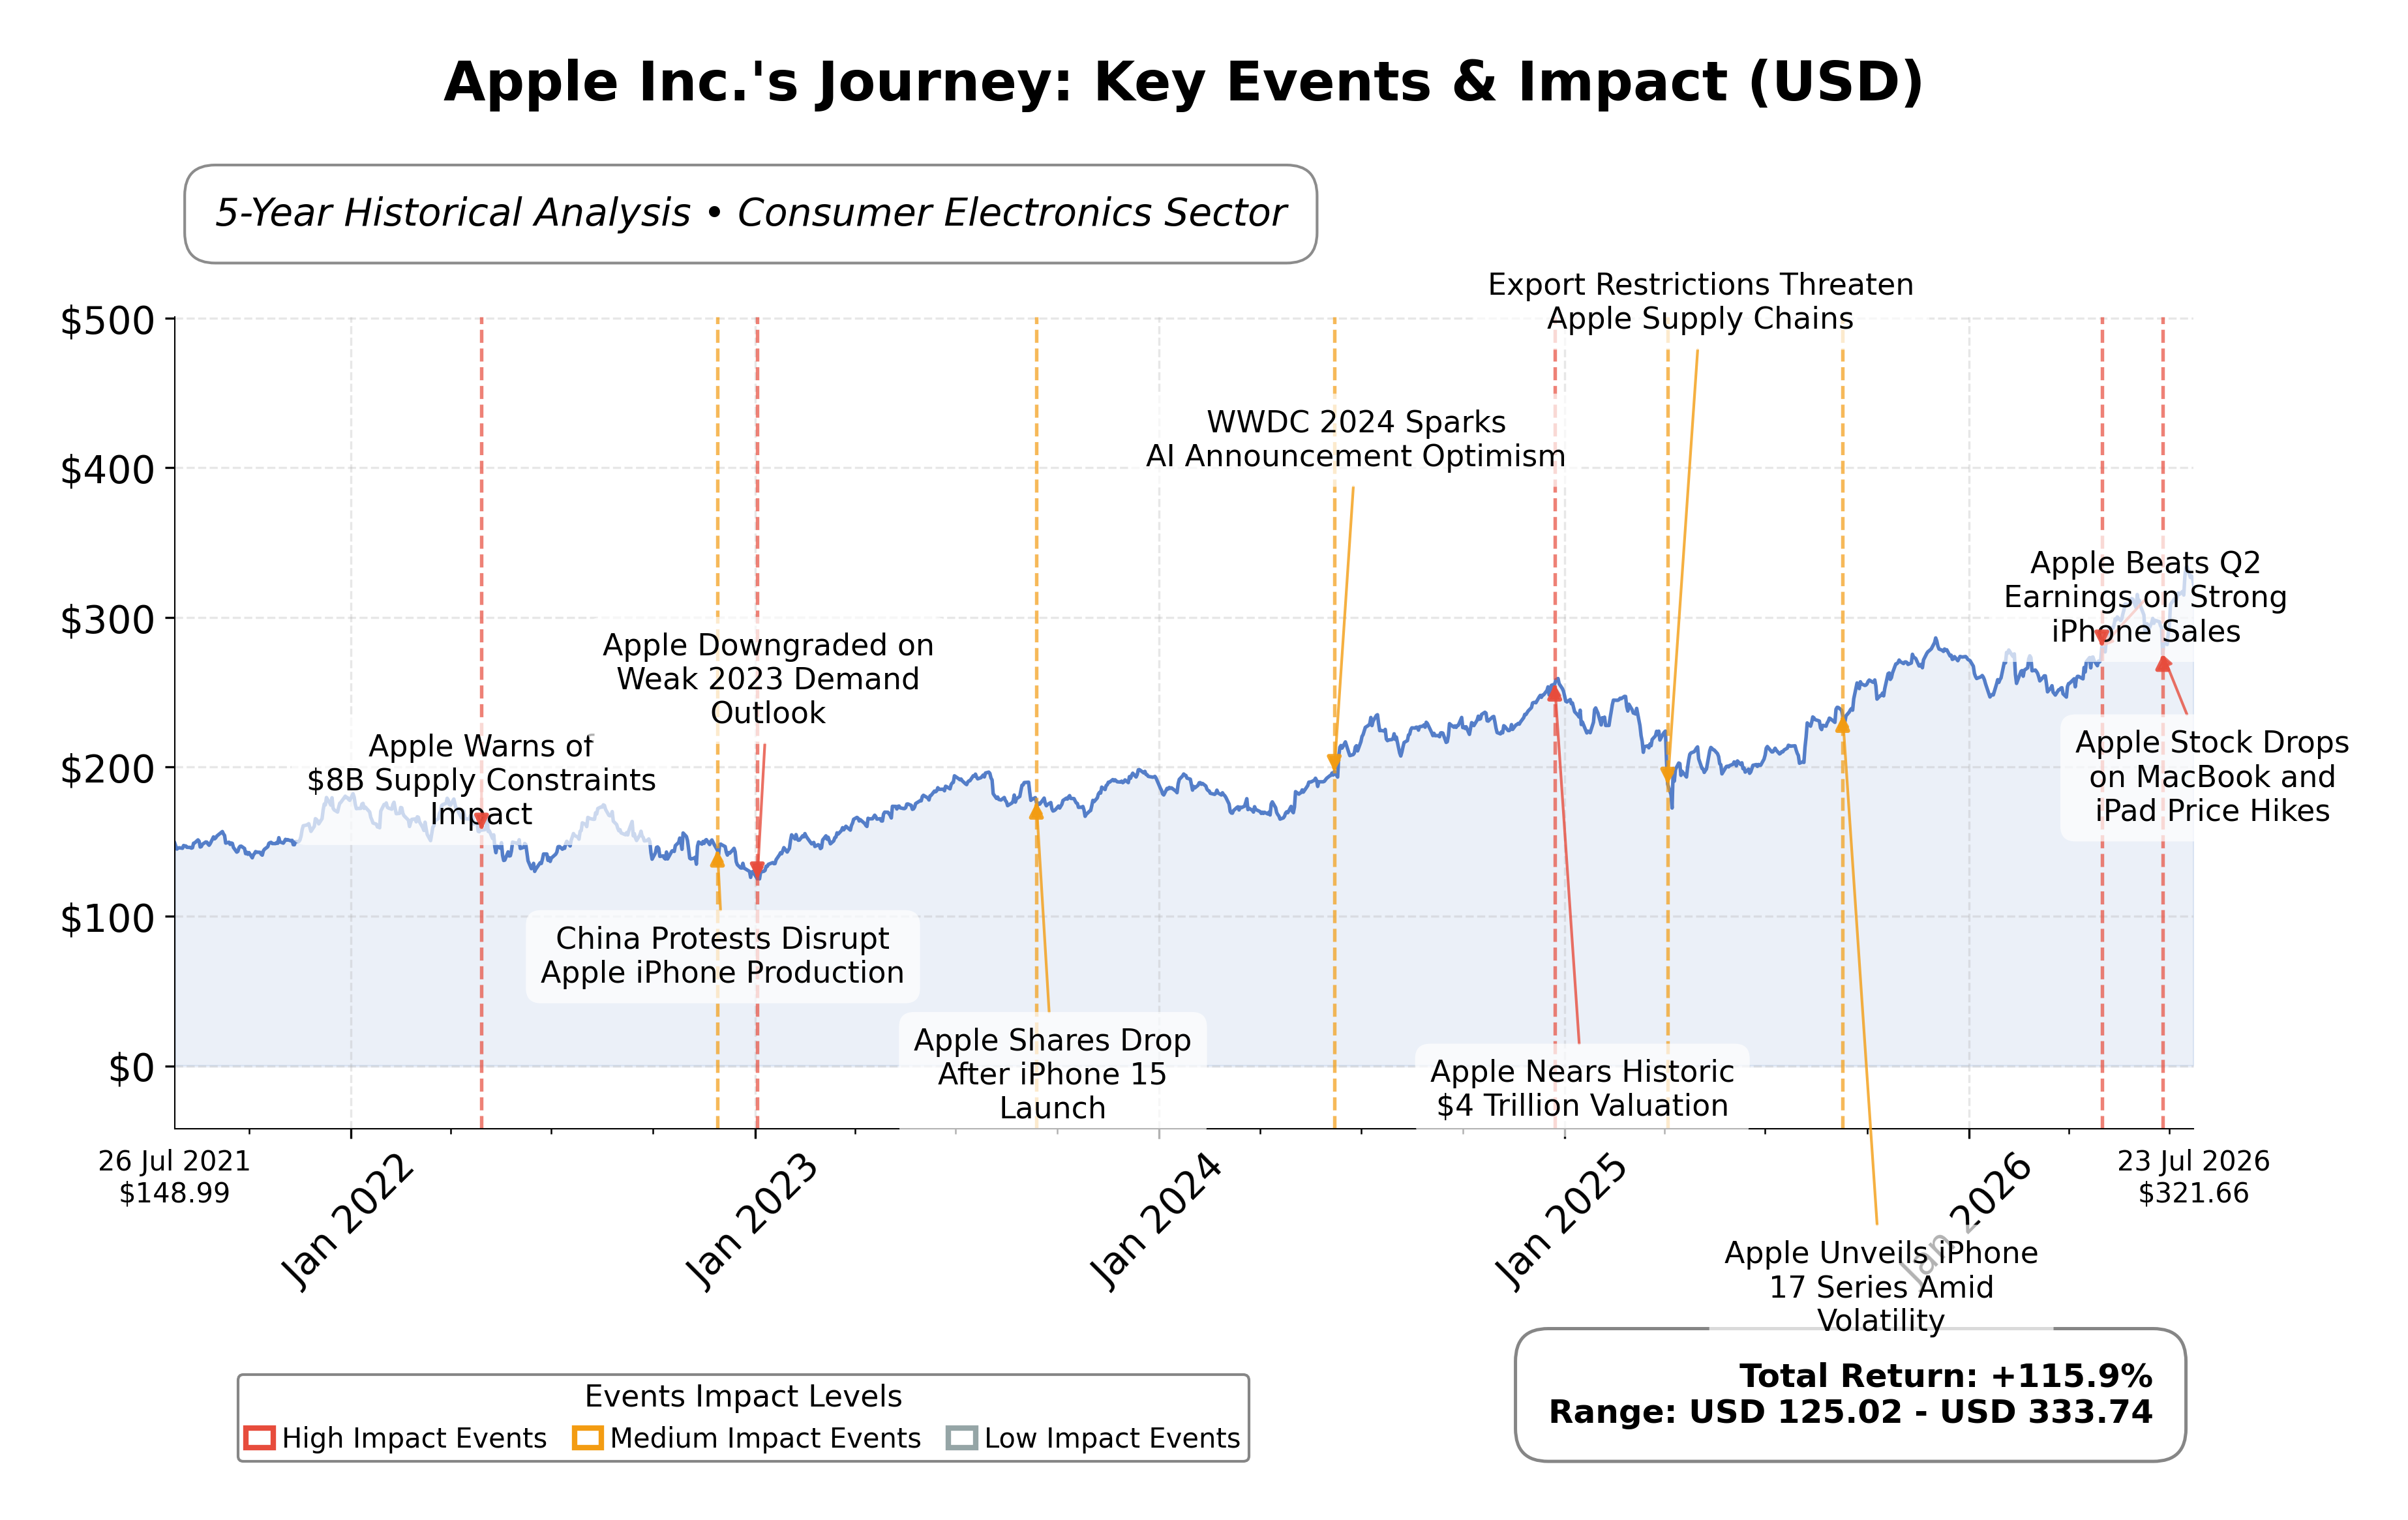
Valuation metrics show Apple’s market capitalization at about $4.9 trillion, with a trailing price-to-earnings (P/E) ratio of 40.3 and a forward P/E of 34.6, suggesting premium valuation relative to earnings expectations. The price-to-book (P/B) ratio is elevated at 45.97, and the enterprise value to EBITDA (EV/EBITDA) multiple is 30.74, indicating the stock is priced at a significant premium to book value and earnings before interest, taxes, depreciation, and amortization. The 52-week trading range spans $201.50 to $334.99, with the current price near the high end, reflecting strong recent price appreciation.
Apple’s strengths include its dominant market position, strong cash flow generation, and a diversified product and service ecosystem. Key risks involve competitive pressures in technology markets, supply chain constraints, and regulatory scrutiny. Recent strategic developments include leadership transition plans with Tim Cook moving to Executive Chairman and John Ternus becoming CEO, alongside new product launches such as the iPhone 17 series and MacBook Neo. Partnerships like the integration of Apple Maps in Ford’s electric vehicles also highlight ongoing ecosystem expansion.
Technically, Apple’s stock shows an upward trend with prices above key moving averages, supported by momentum indicators signaling strength across multiple timeframes. Recent news highlights positive sentiment around earnings growth and strategic initiatives, although valuation multiples remain elevated. Overall, market conditions suggest a cautious stance with attention to valuation and growth dynamics as the company continues to execute its product and service strategies.
Company and Industry Overview
Company Basics
Price Performance
Company Size
Shareholding Pattern
Sector and Industry Analysis
The technology sector, encompassing hardware, software, and services, remains one of the largest and fastest-growing markets globally, driven by continuous innovation and digital transformation across industries. Major players include Apple, Microsoft, Google, and Amazon, which dominate through diversified product portfolios and significant R&D investments. Market growth is propelled by increasing consumer demand for smart devices, cloud computing, and AI-driven solutions.
Within the consumer electronics industry, trends emphasize integration of advanced technologies such as 5G, augmented reality, and enhanced user ecosystems that foster brand loyalty. Competitive dynamics are shaped by high barriers to entry due to substantial capital requirements, intellectual property protections, and established supply chains. Companies like Apple maintain strong positioning through premium product design, proprietary software, and expansive service offerings that create differentiated user experiences.
The regulatory environment for technology firms involves data privacy laws, antitrust scrutiny, and international trade policies that influence operational strategies. Compliance with regulations such as GDPR and CCPA impacts data handling and user consent practices, while antitrust investigations may affect market consolidation and competitive behavior. Ongoing regulatory developments require firms to adapt swiftly to maintain compliance and mitigate legal risks.
Note: Analysis synthesized from industry research, market reports, and regulatory filings. Information is subject to change based on market conditions.
Financial Ratios Dashboard
Illustrative Scenario Analysis
DCF Assumptions:
Method: Two-Stage EPS-Priority Model
Financials
Peer Analysis
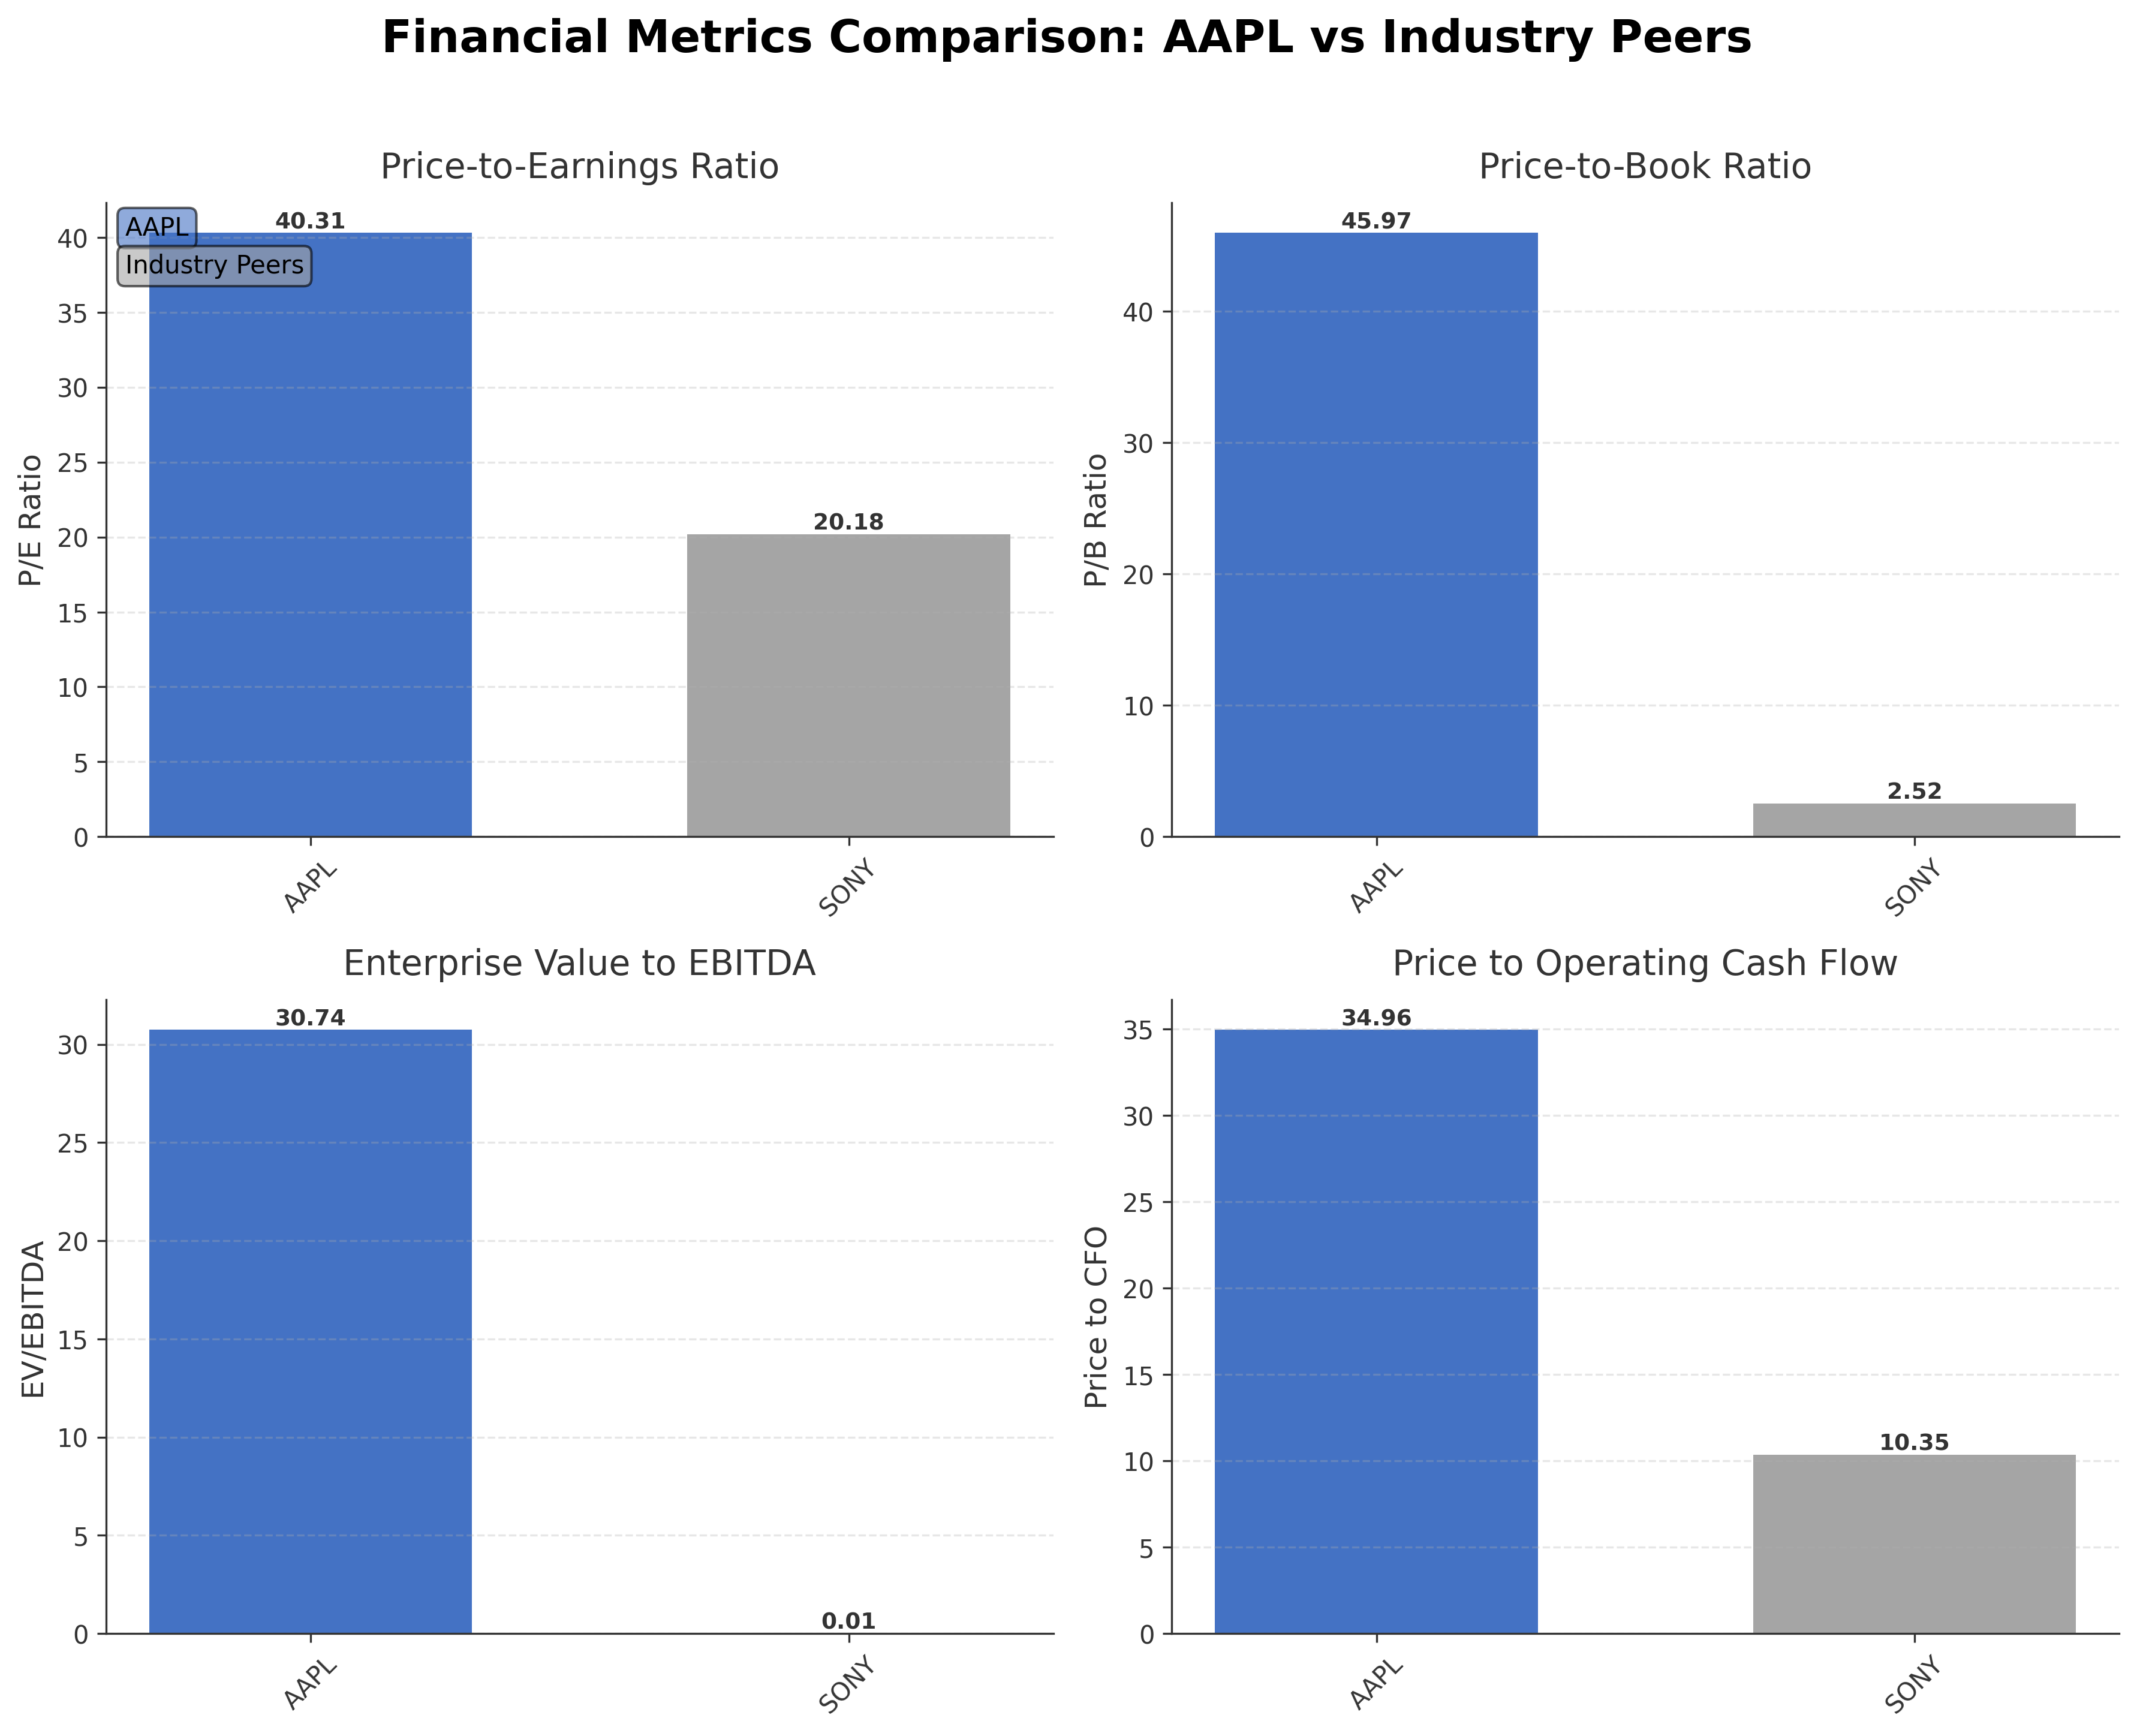
| Company Name | Market Cap | P/E Ratio | P/B Ratio | EV/EBITDA | Price to CFO |
|---|---|---|---|---|---|
| Apple Inc. | $4.90T | 40.31 | 45.97 | 30.74 | 34.96 |
| Sony Group Corporation - Sponsored American Depositary Receipt | $124.03B | 20.18 | 2.52 | 0.01 | 10.35 |
Comparison Analysis: Apple Inc. significantly surpasses its peer Sony Group Corporation in market capitalization, reflecting its status as a global technology leader. However, Apple trades at a much higher valuation with a P/E ratio of 40.31 compared to Sony's 20.18, and a notably elevated P/B ratio of 45.97 versus Sony's 2.52. Apple's EV/EBITDA multiple of 30.74 also exceeds that of Sony, indicating a premium valuation relative to earnings and cash flow. Return on equity for Apple is lower at 1.41% compared to Sony's 12.34%, suggesting differences in capital efficiency. Overall, Apple commands a premium valuation supported by its scale and market position, while peers exhibit more moderate multiples and higher ROE.
Financial Metrics Comparison with Peers
Financial Statements
Comprehensive financial data including income, balance sheet, and cash flow metrics
Income Statement
| fiscal_date | 2025-09-30 | 2024-09-30 | 2023-09-30 | 2022-09-30 | 2021-09-30 |
|---|---|---|---|---|---|
| Sales | 416.16B | 391.04B | 383.29B | 394.33B | 365.82B |
| Cost Of Goods | 220.96B | 210.35B | 214.14B | 223.55B | 212.98B |
| Gross Profit | 195.20B | 180.68B | 169.15B | 170.78B | 152.84B |
| Operating Expense Research And Development | 34.55B | 31.37B | 29.91B | 26.25B | 21.91B |
| Operating Expense Selling General And Administrative | 27.60B | 26.10B | 24.93B | 25.09B | 21.97B |
| Operating Income | 133.05B | 123.22B | 114.30B | 119.44B | 108.95B |
| Other Income Expense | -321.00M | 269.00M | -565.00M | -334.00M | 60.00M |
| Pretax Income | 132.73B | 123.48B | 113.74B | 119.10B | 109.21B |
| Income Tax | 20.72B | 29.75B | 16.74B | 19.30B | 14.53B |
| Net Income | 112.01B | 93.74B | 97.00B | 99.80B | 94.68B |
| Eps Basic | 7.49 | 6.11 | 6.16 | 6.15 | 5.67 |
| Eps Diluted | 7.46 | 6.08 | 6.13 | 6.11 | 5.61 |
| Basic Shares Outstanding | 14.95B | 15.34B | 15.74B | 16.22B | 16.70B |
| Diluted Shares Outstanding | 14.95B | 15.34B | 15.74B | 16.22B | 16.70B |
| Ebit | 133.05B | 123.22B | 114.30B | 119.44B | 111.85B |
| Ebitda | 144.75B | 134.66B | 125.82B | 130.54B | 123.14B |
| Net Income Continuous Operations | 112.01B | 93.74B | 97.00B | 99.80B | 94.68B |
| Non Operating Interest Income | N/A | N/A | 3.75B | 2.83B | 2.84B |
| Non Operating Interest Expense | N/A | N/A | 3.93B | 2.93B | 2.65B |
Data provided by Twelve Data
Balance Sheet
| fiscal_date | 2025-09-30 | 2024-09-30 | 2023-09-30 | 2022-09-30 | 2021-09-30 |
|---|---|---|---|---|---|
| Cash And Cash Equivalents | 35.93B | 29.94B | 29.96B | 23.65B | 34.94B |
| Accounts Receivable | 39.78B | 33.41B | 29.51B | 28.18B | 26.28B |
| Total Assets | 359.24B | 364.98B | 352.58B | 352.75B | 351.00B |
| Total Liabilities | 285.51B | 308.03B | 290.44B | 302.08B | 287.91B |
| Long Term Debt | 78.33B | 85.75B | 95.28B | 109.71B | 119.38B |
| Shareholders Equity | 73.73B | 56.95B | 62.15B | 50.67B | 63.09B |
Data provided by Twelve Data
Cash Flow Statement
| fiscal_date | 2025-09-30 | 2024-09-30 | 2023-09-30 | 2022-09-30 | 2021-09-30 |
|---|---|---|---|---|---|
| Operating Activities Net Income | 112.01B | 93.74B | 97.00B | 99.80B | 94.68B |
| Operating Activities Depreciation | 11.70B | 11.45B | 11.52B | 11.10B | 11.28B |
| Operating Activities Stock Based Compensation | 12.86B | 11.69B | 10.83B | 9.04B | 7.91B |
| Operating Activities Other Non Cash Items | -89.00M | -2.27B | -2.23B | 1.01B | -4.92B |
| Operating Activities Accounts Receivable | -7.03B | -5.14B | -417.00M | -9.34B | -14.03B |
| Operating Activities Accounts Payable | 902.00M | 6.02B | -1.89B | 9.45B | 12.33B |
| Operating Activities Other Assets Liabilities | -18.87B | 2.77B | -4.27B | 1.57B | -1.53B |
| Operating Activities Operating Cash Flow | 111.48B | 118.25B | 110.54B | 123.52B | 100.94B |
| Investing Activities Capital Expenditures | -12.71B | -9.45B | -10.96B | -10.71B | -11.09B |
| Investing Activities Purchase Of Investments | -24.41B | -48.66B | -29.51B | -76.92B | -109.56B |
| Investing Activities Sale Of Investments | 53.80B | 62.35B | 45.51B | 67.36B | 106.48B |
| Investing Activities Other Investing Activity | -1.48B | -1.31B | -1.34B | -2.09B | -385.00M |
| Investing Activities Investing Cash Flow | 15.20B | 2.94B | 3.71B | -22.66B | -14.58B |
| Financing Activities Long Term Debt Issuance | 4.48B | 0.00 | 5.23B | 5.46B | 20.39B |
| Financing Activities Long Term Debt Payments | -10.93B | -9.96B | -11.15B | -9.54B | -8.75B |
| Financing Activities Short Term Debt Issuance | -2.03B | 3.96B | -3.98B | 3.96B | 1.02B |
| Financing Activities Common Stock Repurchase | -90.71B | -94.95B | -77.55B | -89.40B | -85.97B |
| Financing Activities Common Dividends | -15.42B | -15.23B | -15.03B | -14.84B | -14.47B |
| Financing Activities Other Financing Charges | -6.07B | -5.80B | -6.01B | -6.38B | -5.58B |
| Financing Activities Financing Cash Flow | -120.69B | -121.98B | -108.49B | -110.75B | -92.25B |
| End Cash Position | 35.93B | 29.94B | 30.74B | 24.98B | 35.93B |
| Income Tax Paid | 43.37B | 26.10B | 18.68B | 19.57B | 25.39B |
| Free Cash Flow | 98.77B | 108.81B | 99.58B | 111.44B | 92.95B |
| Interest Paid | N/A | N/A | 3.80B | 2.87B | 2.69B |
| Operating Activities Deferred Taxes | N/A | N/A | N/A | 895.00M | -4.77B |
| Investing Activities Net Acquisitions | N/A | N/A | N/A | -306.00M | -33.00M |
| Financing Activities Common Stock Issuance | N/A | N/A | N/A | N/A | 1.10B |
Data provided by Twelve Data
Technical Analysis
Key Insights
- Apple’s stock is currently in a strong uptrend with price action near its 52-week high, showing consistent higher highs and higher lows.
- Key support levels are identified around $302.65 (50-day moving average) and $274.22 (200-day moving average), with resistance near the recent high of $334.99.
- The current price is above the 10-day, 50-day, and 200-day moving averages, indicating bullish momentum across short, medium, and long-term timeframes.
- Momentum indicators show RSI near overbought levels but not extreme, MACD remains positive with a bullish crossover, and stochastic oscillators indicate sustained upward momentum.
- Multi-timeframe analysis confirms strength on daily, weekly, and monthly charts, with no significant bearish divergences observed.
- Potential market scenarios include continuation of the upward trend supported by strong technicals, with possible short-term consolidation near resistance levels before further advances.
Trending News
1. Headline: Ford Turns to Apple Maps, Ford Stock (NYSE:F) Slides - TipRanks.com
Summary: On the surface, it looks like a great idea. Legacy automaker Ford ($F) is turning to Apple ($AAPL) and its Apple Maps tool to fuel Ford’s self-driving car operation...
Sentiment: positive
2. Headline: Ford integrates Apple Maps into its new electric vehicle platform | Fox Business
Summary: Informed Momentum Company founder ... volatile stocks, on Making Money. Ford is planning to integrate Apple software into its next-generation fleet of electric vehicles, which will, in turn, help power hands-free driving technology. Apple and Ford announced Thursday that Apple Maps will be included in the automakers' ...
Sentiment: neutral
3. Headline: Forget Nvidia. Apple May Be the AI Stock Wall Street Is Quietly Betting On.
Summary: Apple briefly overtook Nvidia as the world's most valuable company as investors embraced its AI strategy ahead of earnings.
Sentiment: positive
4. Headline: Apple Q3 2026 earnings preview | IG International
Summary: Find out what to expect from Apple's Q3 2026 earnings, including iPhone 17 demand and Services growth.
Sentiment: neutral
Summary: Buffett missed out on hundreds of billions of dollars in gains by selling early.
Sentiment: positive
Powered by Brave
Recent Updates
News Summary
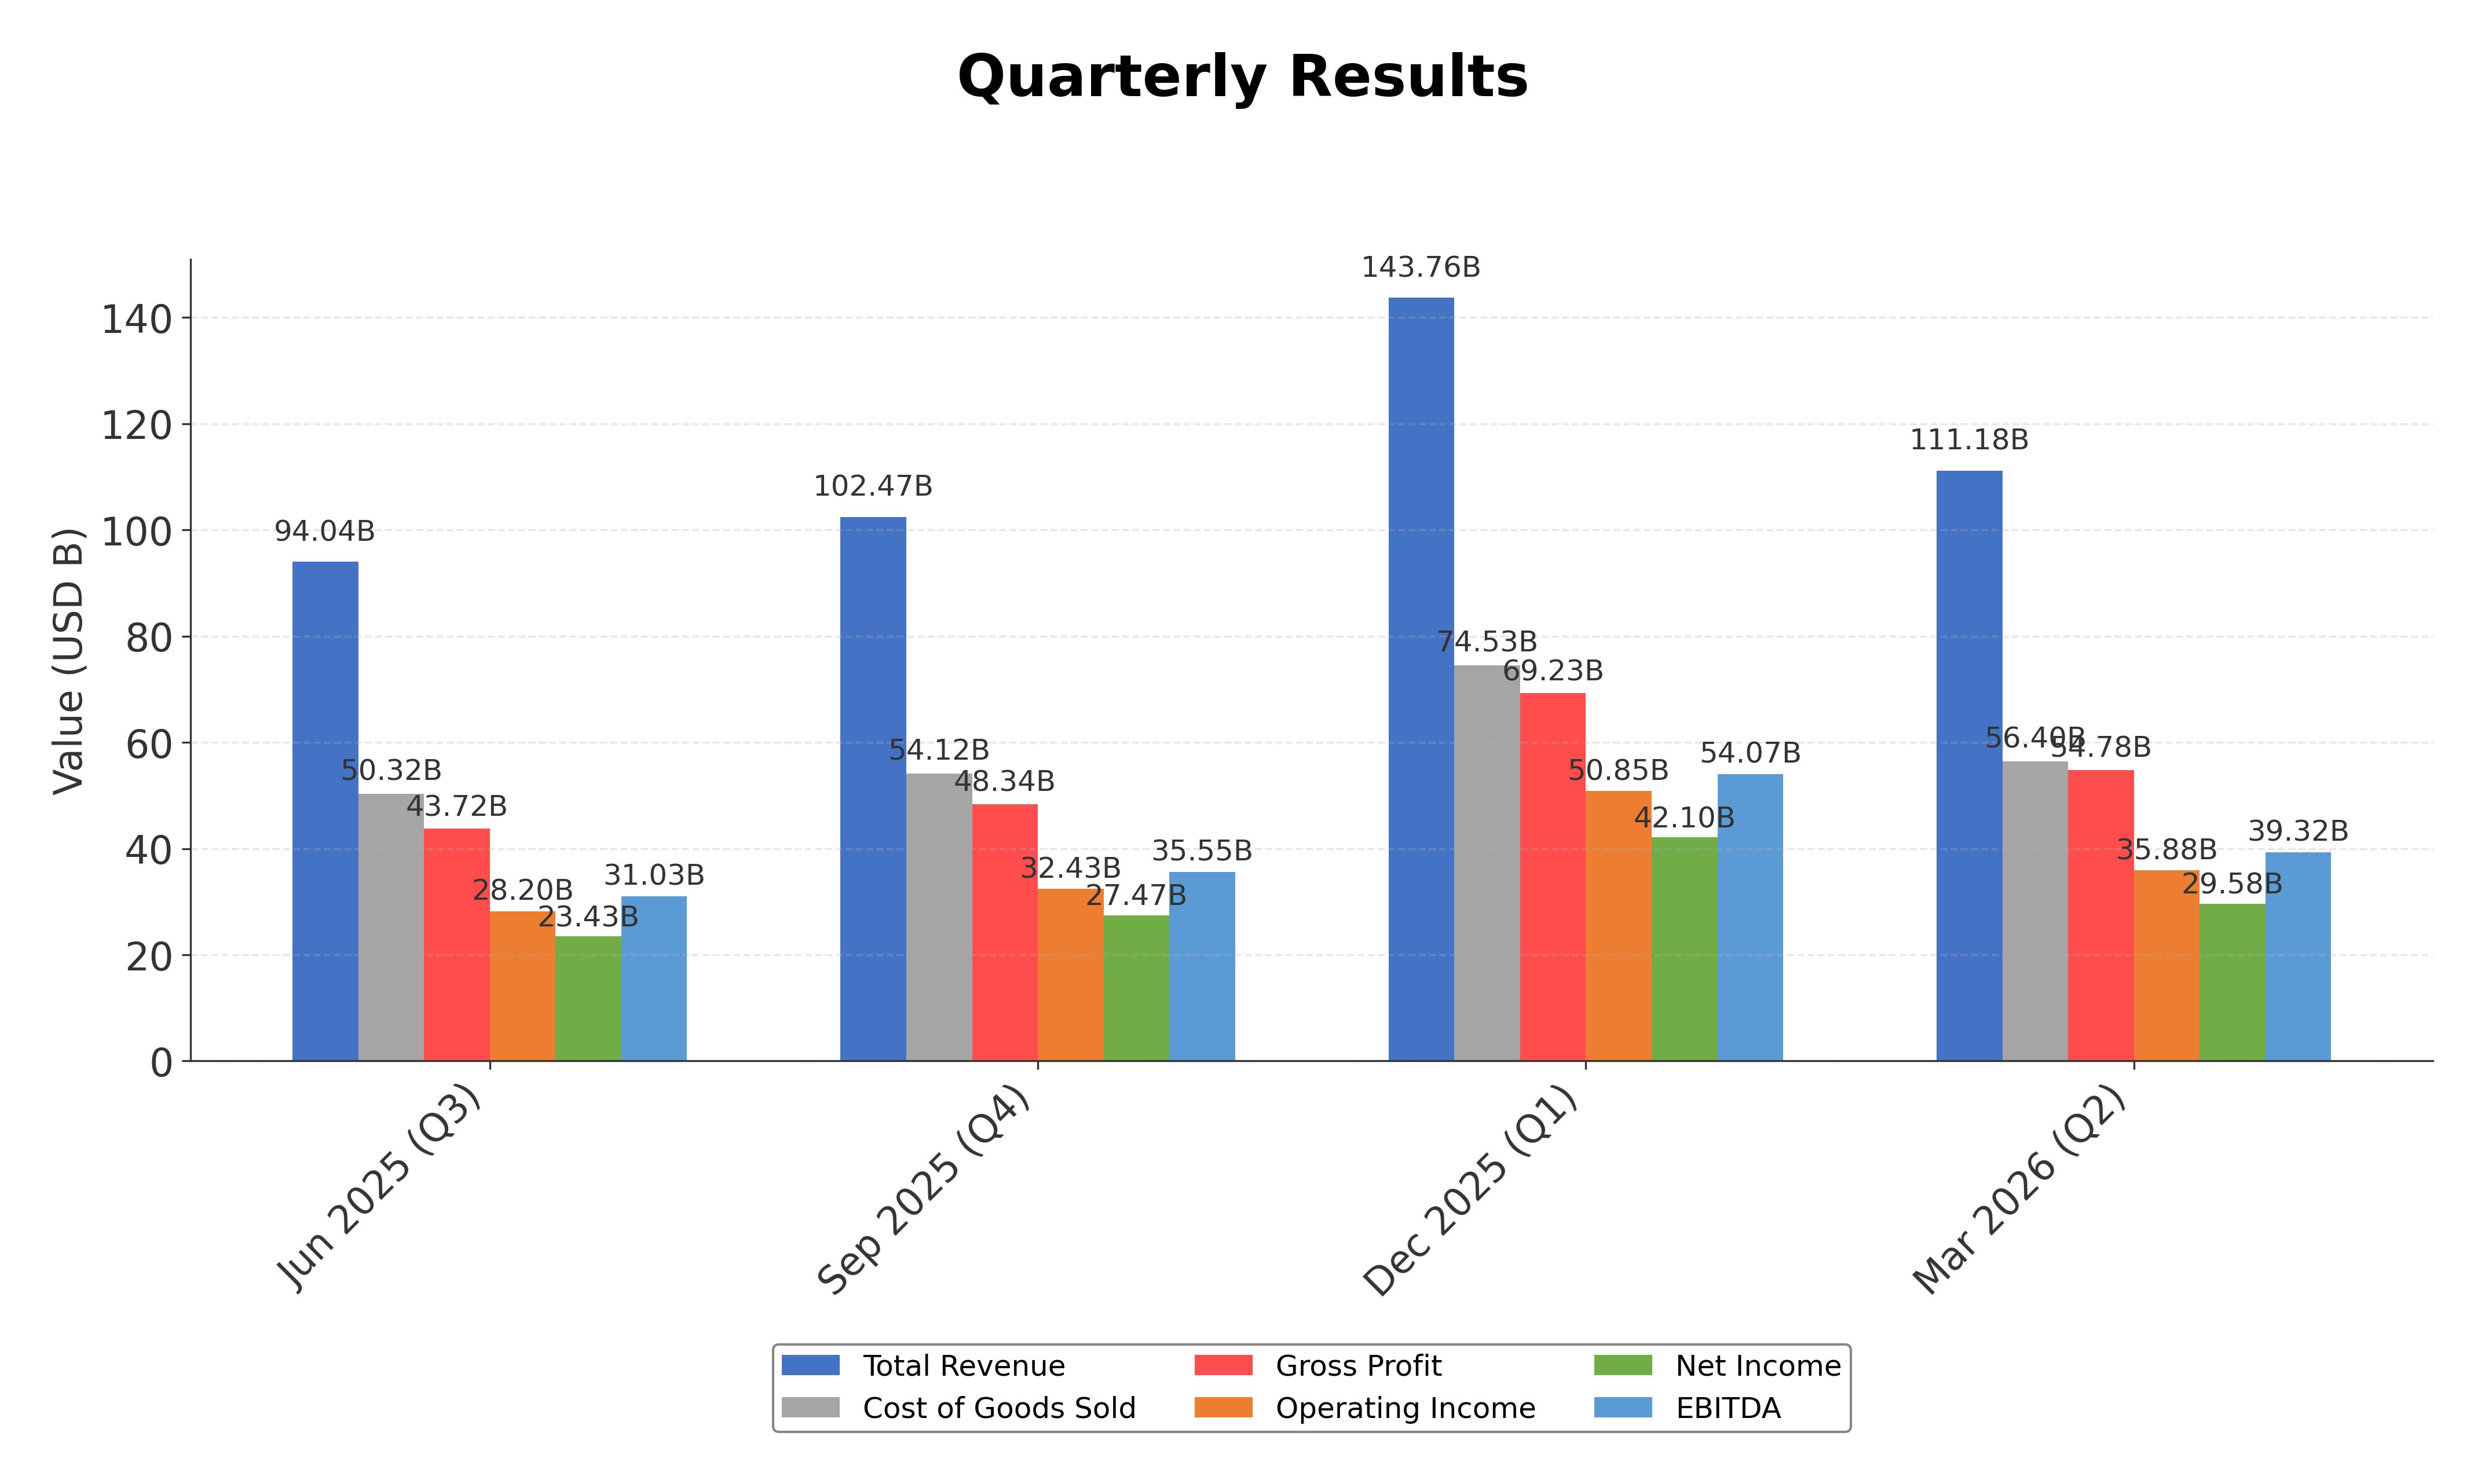
As of April 30, 2026. Apple reported record-breaking financial results for its fiscal second quarter ended March 28, 2026, with revenue reaching $111.2 billion, a 17% year-over-year increase, and diluted earnings per share rising 22% to $2.01. The company achieved new all-time highs in iPhone revenue and Services revenue, supported by strong demand for the iPhone 17 lineup and new product launches including the iPhone 17e, M4-powered iPad Air, and MacBook Neo. Apple’s operating cash flow exceeded $28 billion for the quarter, setting a March quarter record, and the board declared a 4% increase in the quarterly dividend to $0.27 per share while authorizing an additional $100 billion share repurchase program. Leadership transition plans were announced with Tim Cook moving to Executive Chairman and John Ternus assuming the CEO role effective September 1, 2026. Earlier quarters also reflected strong revenue and EPS growth, with consistent record performance across product categories and geographic segments.
News Sentiment
The overall sentiment from recent updates is predominantly positive, driven by strong quarterly earnings results demonstrating robust revenue and profit growth, record cash flow generation, and strategic leadership changes. Positive investor sentiment is supported by new product introductions and expansion of services revenue, alongside capital return initiatives such as dividend increases and share buybacks. Neutral tones arise from cautious outlooks on supply constraints and cost pressures, while no significant negative developments have been reported. The balanced mix of strong financial performance and proactive corporate governance contributes to a constructive market perception.
Source List
Analytical Overview
Analysis Summary
Apple’s valuation metrics, including a trailing P/E of 40.3 and forward P/E of 34.6, exceed industry averages, reflecting a premium pricing consistent with its market leadership and growth prospects. The company’s revenue growth of 16.6% year-over-year and strong cash flow trends, with operating cash flow of $140.2 billion and free cash flow of $101.1 billion, indicate a robust growth trajectory. Financial health is solid, with a manageable debt-to-equity ratio of approximately 79.5%, a current ratio of 1.07, and significant cash reserves of $68.5 billion supporting liquidity and capital allocation flexibility. Sector-specific opportunities include expansion in AI, services, and device leasing programs, while challenges involve supply chain constraints and competitive pressures. Given Apple’s global presence and technology sector positioning, market dynamics and innovation cycles remain key factors influencing future performance.
Overall Business and Market Assessment
Supporting Factors: No data
Risk Factors: Apple’s investment appeal is supported by its strong revenue growth, record profitability, and substantial cash flow generation, alongside strategic initiatives such as leadership transition and new product launches. Key risks to monitor include elevated valuation multiples, supply chain challenges, and intensifying competition in consumer electronics and services. The company’s financial strength and innovation pipeline suggest a medium to long-term investment horizon may be appropriate. Overall, Apple presents a balanced profile with premium valuation justified by growth and market dominance, tempered by external risks and macroeconomic factors.
SWOT Analysis
Strengths
- Market leadership with a diversified product and services ecosystem.
- Strong profitability with high gross and operating margins.
- Robust cash flow generation supporting capital returns and investments.
- Global brand recognition and loyal customer base.
Weaknesses
- High valuation multiples compared to industry peers.
- Significant dependence on iPhone sales for revenue.
- Relatively high debt-to-equity ratio compared to cash reserves.
- Limited diversification outside core technology markets.
Opportunities
- Expansion in artificial intelligence and related technologies.
- Growth in services revenue and subscription models.
- New device leasing programs to increase customer accessibility.
- Strategic partnerships in automotive and other emerging sectors.
Threats
- Supply chain disruptions and rising component costs.
- Intense competition in consumer electronics and software services.
- Regulatory scrutiny and potential legal challenges globally.
- Macroeconomic uncertainties impacting consumer spending.
Company Description
Apple Inc. designs, manufactures, and markets a wide range of technology products worldwide. These include the iPhone, a line of smartphones; Mac, a line of personal computers; iPad, a line of multi-purpose tablets; and wearables, home, and accessories such as AirPods, Apple Vision Pro, Apple TV, Apple Watch, Beats products, HomePod, as well as Apple branded and third-party accessories. The company operates service platforms including the App Store, Apple Music, and subscription models that provide curated content, cloud services, and digital offerings. Apple Inc. serves individual consumers, businesses, and government sectors through online stores, retail outlets, and partnerships with cellular carriers and resellers. Its products span the information technology sector, impacting mobile communication, personal computing, entertainment, and health monitoring. Founded in 1976 and headquartered in Cupertino, California, Apple Inc. plays a pivotal role in the global technology market by integrating hardware, software, and services into seamless ecosystems.