
Apple Inc (AAPL)
Stock Analysis Report
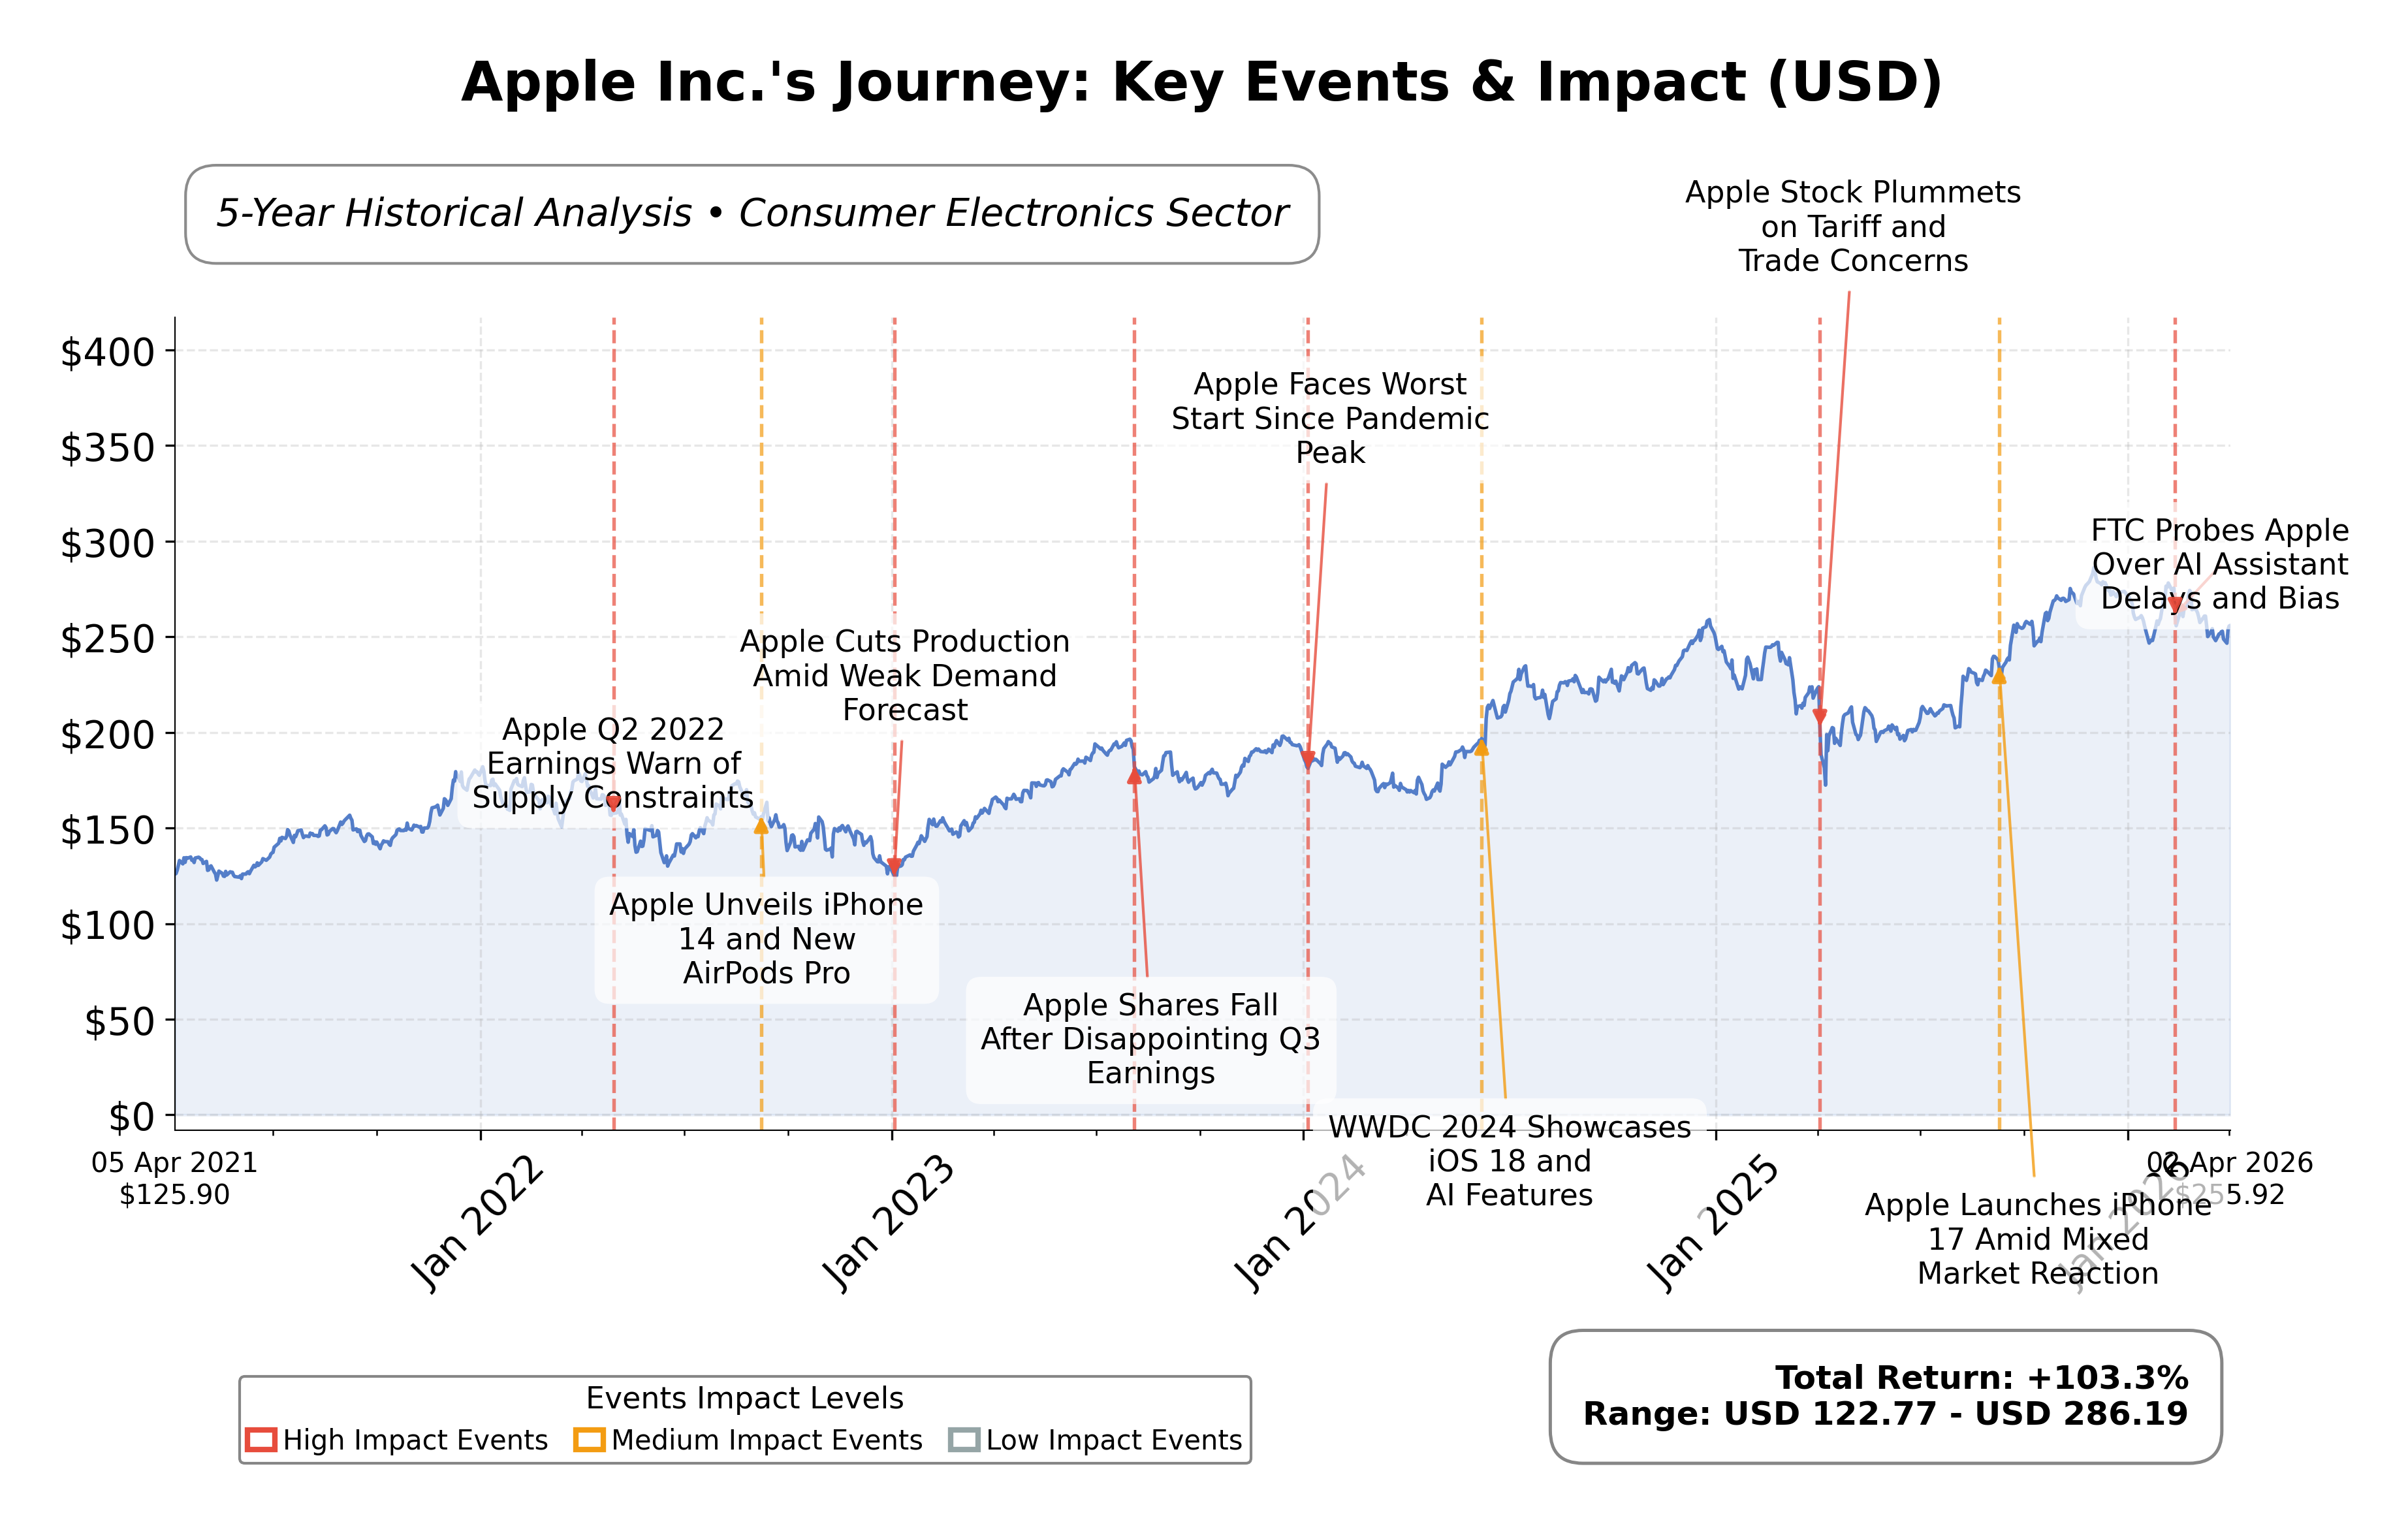
Stock Journey
Key Positives and Key Risks
Pros
- Market capitalization of $3.66 trillion demonstrates dominant industry position and scale.
- Trailing twelve months revenue growth of 15.7% and earnings growth of 15.9% indicate strong growth momentum.
- Operating cash flow of $135.5 billion and free cash flow of $106.3 billion support financial flexibility and innovation.
Cons
- High price-to-book ratio of 42.16 suggests premium valuation that may limit upside potential.
- Debt-to-equity ratio of 102.63% reflects significant leverage requiring monitoring.
- Current ratio of 0.974 indicates tight short-term liquidity, which may pose operational risks.
Disclosure: This information is for general awareness and does not constitute investment advice
Report Summary
Apple Inc. operates as a leading technology company specializing in designing, manufacturing, and marketing consumer electronics and software products globally. Its core offerings include the iPhone, Mac computers, iPad tablets, Apple Watch, and a broad ecosystem of services such as the App Store, Apple Music, and iCloud. Positioned within the consumer electronics industry and technology sector, Apple maintains a significant global presence and is recognized for its innovation and integrated product ecosystem.
Financially, Apple exhibits robust metrics with a market capitalization exceeding $3.65 trillion and a trailing P/E ratio of approximately 32.05, slightly above the industry average. The company reported trailing twelve months (TTM) revenue of $435.6 billion, with a gross margin near 48.16% and a profit margin of 27.04%. Operating cash flow stands strong at $135.5 billion TTM, complemented by a levered free cash flow of $106.3 billion. The dividend yield is modest at 0.42%, reflecting a consistent quarterly payout.
Technical indicators reveal Appleâs current price at $255.89, positioned above its 200-day moving average ($246.82) and 50-day moving average ($261.13), suggesting relative price stability. Recent strategic initiatives include advancements in AI integration and platform enhancements, alongside leadership continuity. Strengths include a diversified product portfolio and strong cash flows, while risks involve high valuation multiples and competitive pressures in the technology sector.
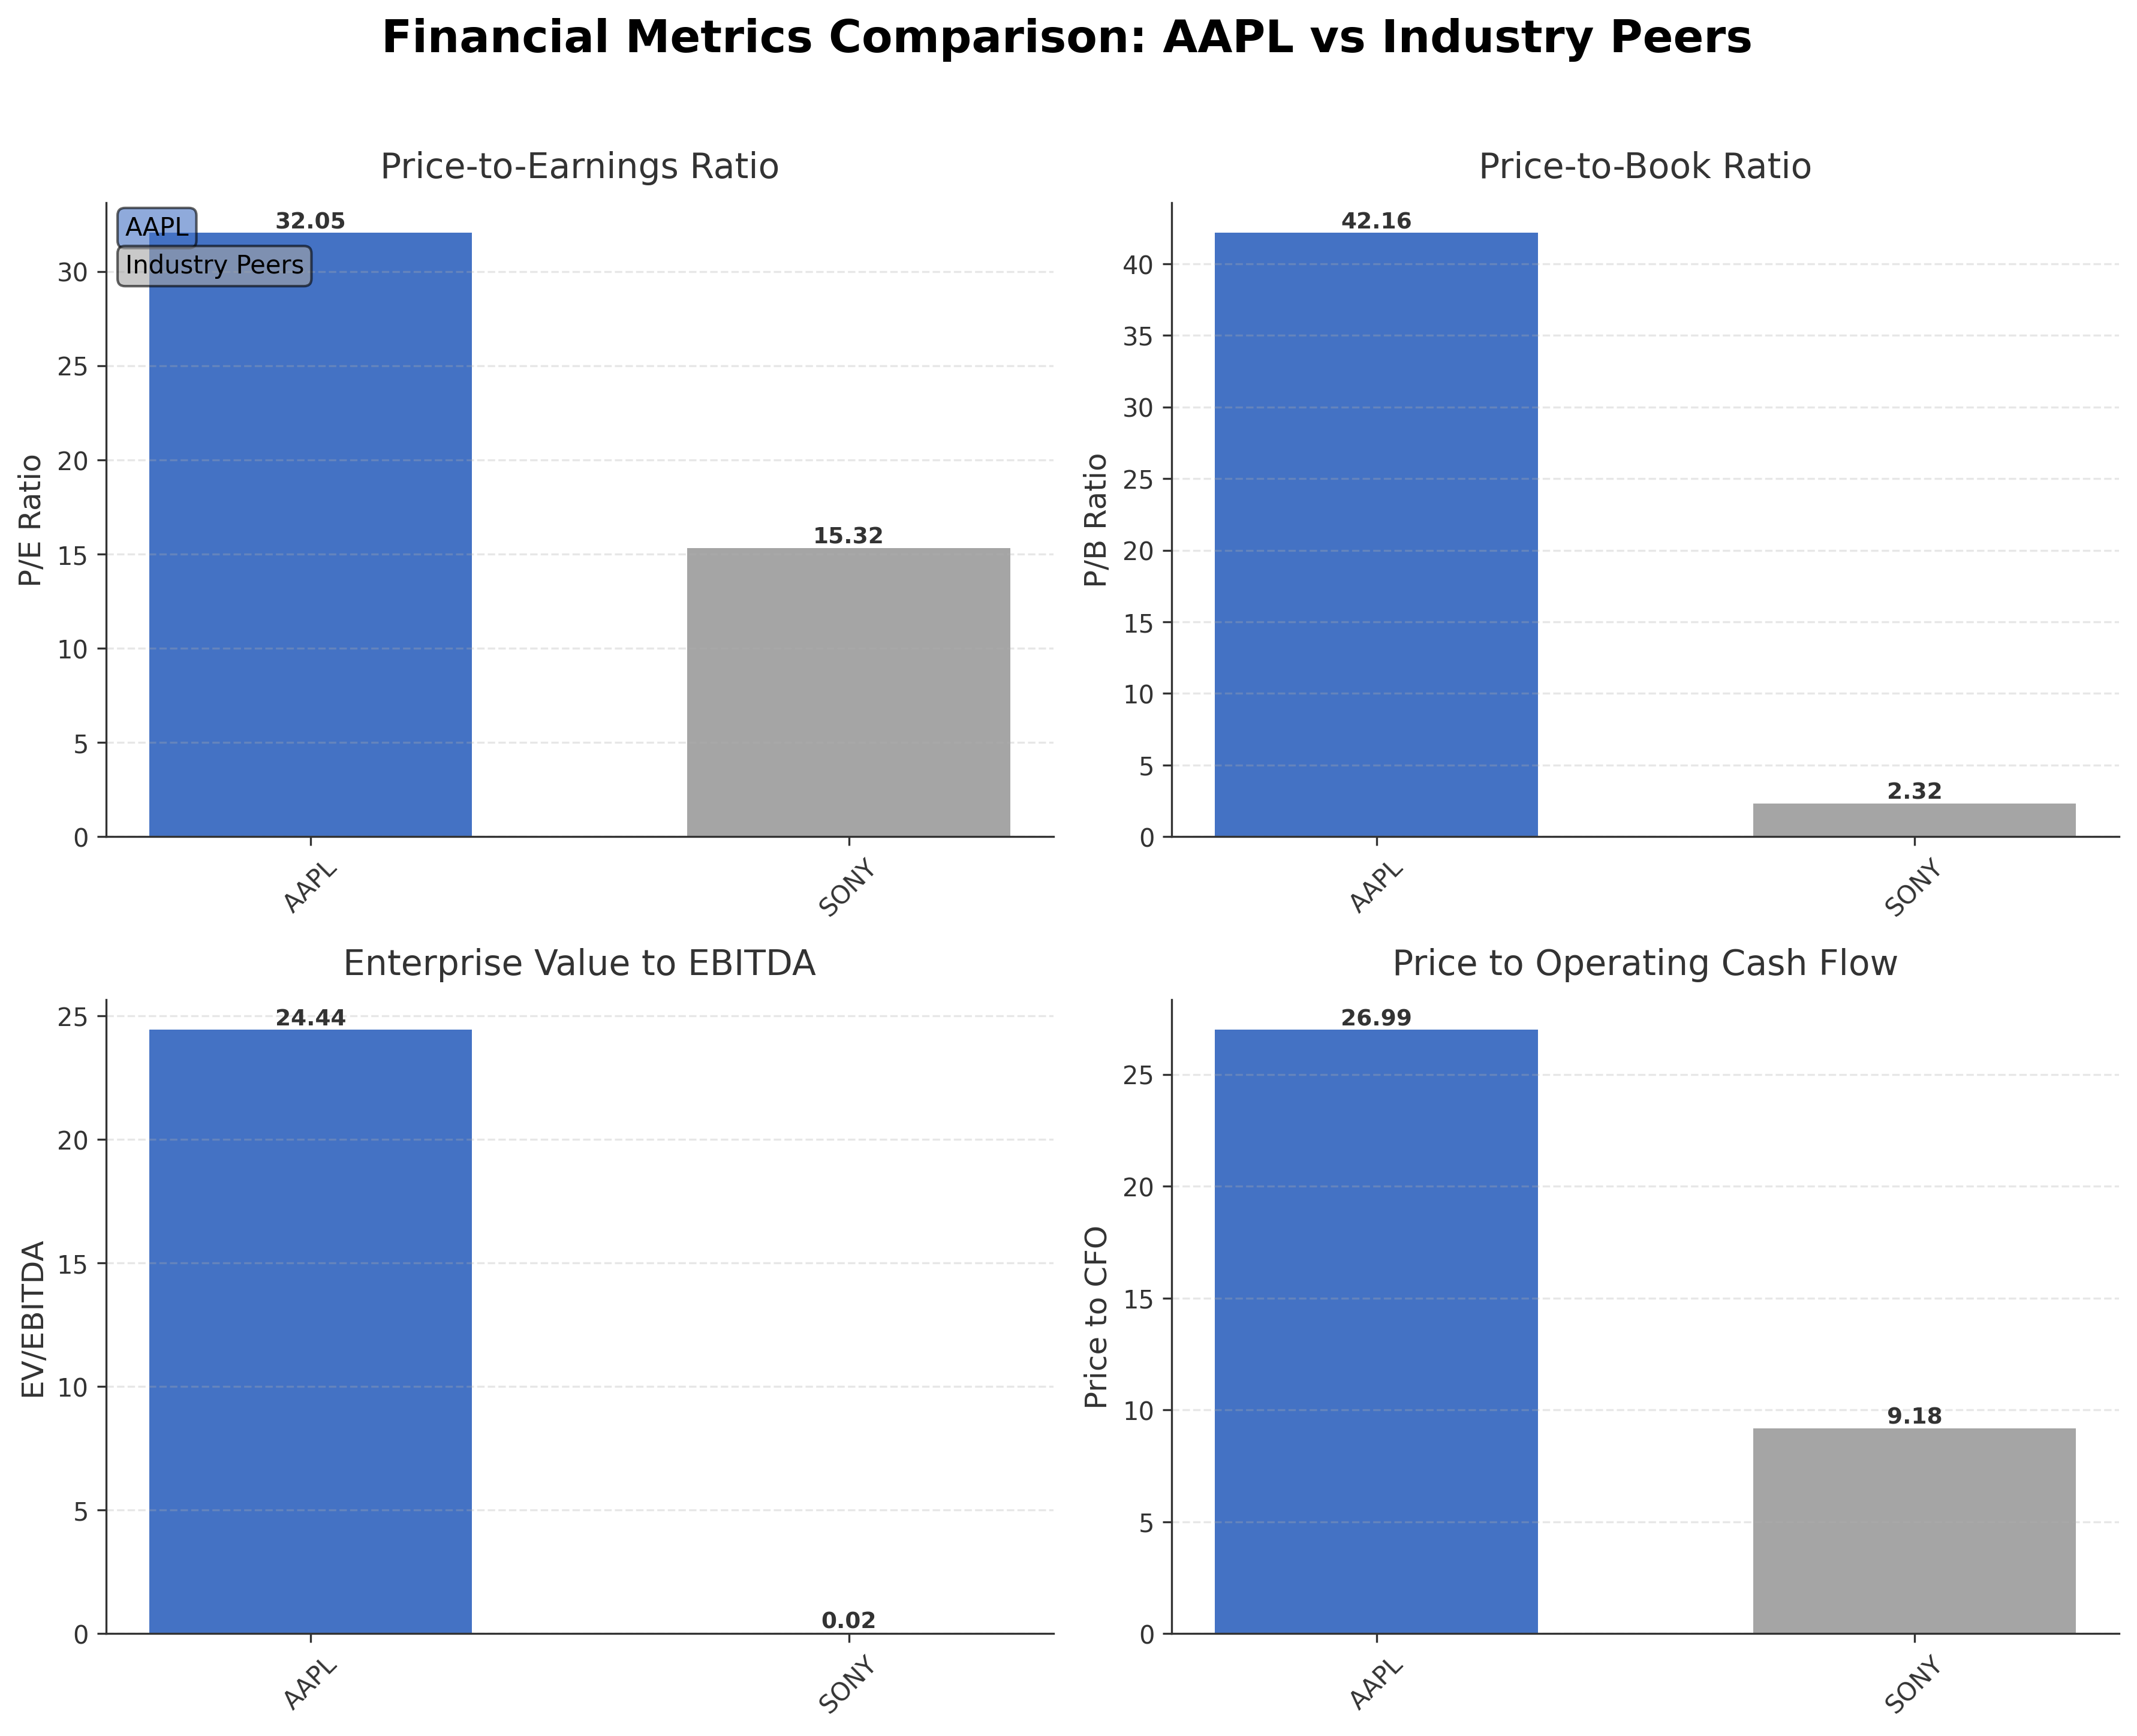
In peer comparison within the consumer electronics industry in the United States, Appleâs valuation metrics notably exceed those of Sony Group Corporation, a key peer with a market cap of $118.28 billion and a P/E ratio of 15.32. Appleâs return on equity (1.52%) also surpasses Sonyâs 0.15%, indicating relatively higher profitability. However, Appleâs price-to-book ratio of 42.16 is significantly higher than Sonyâs 2.32, reflecting premium market positioning.
Apple stands as a dominant protagonist in the evolving technology landscape, celebrating its 50th anniversary with milestones in innovation and market influence. The company faces ongoing challenges such as sustaining growth amid competitive dynamics and adapting to AI-driven transformations. The stakes involve maintaining leadership in consumer electronics and expanding service revenues. Given the current financial and market data, a balanced approach emphasizing observation of valuation and growth trends may be appropriate for those assessing the stockâs position.
Company and Industry Overview
Company Basics
Price Performance
Company Size
Shareholding Pattern
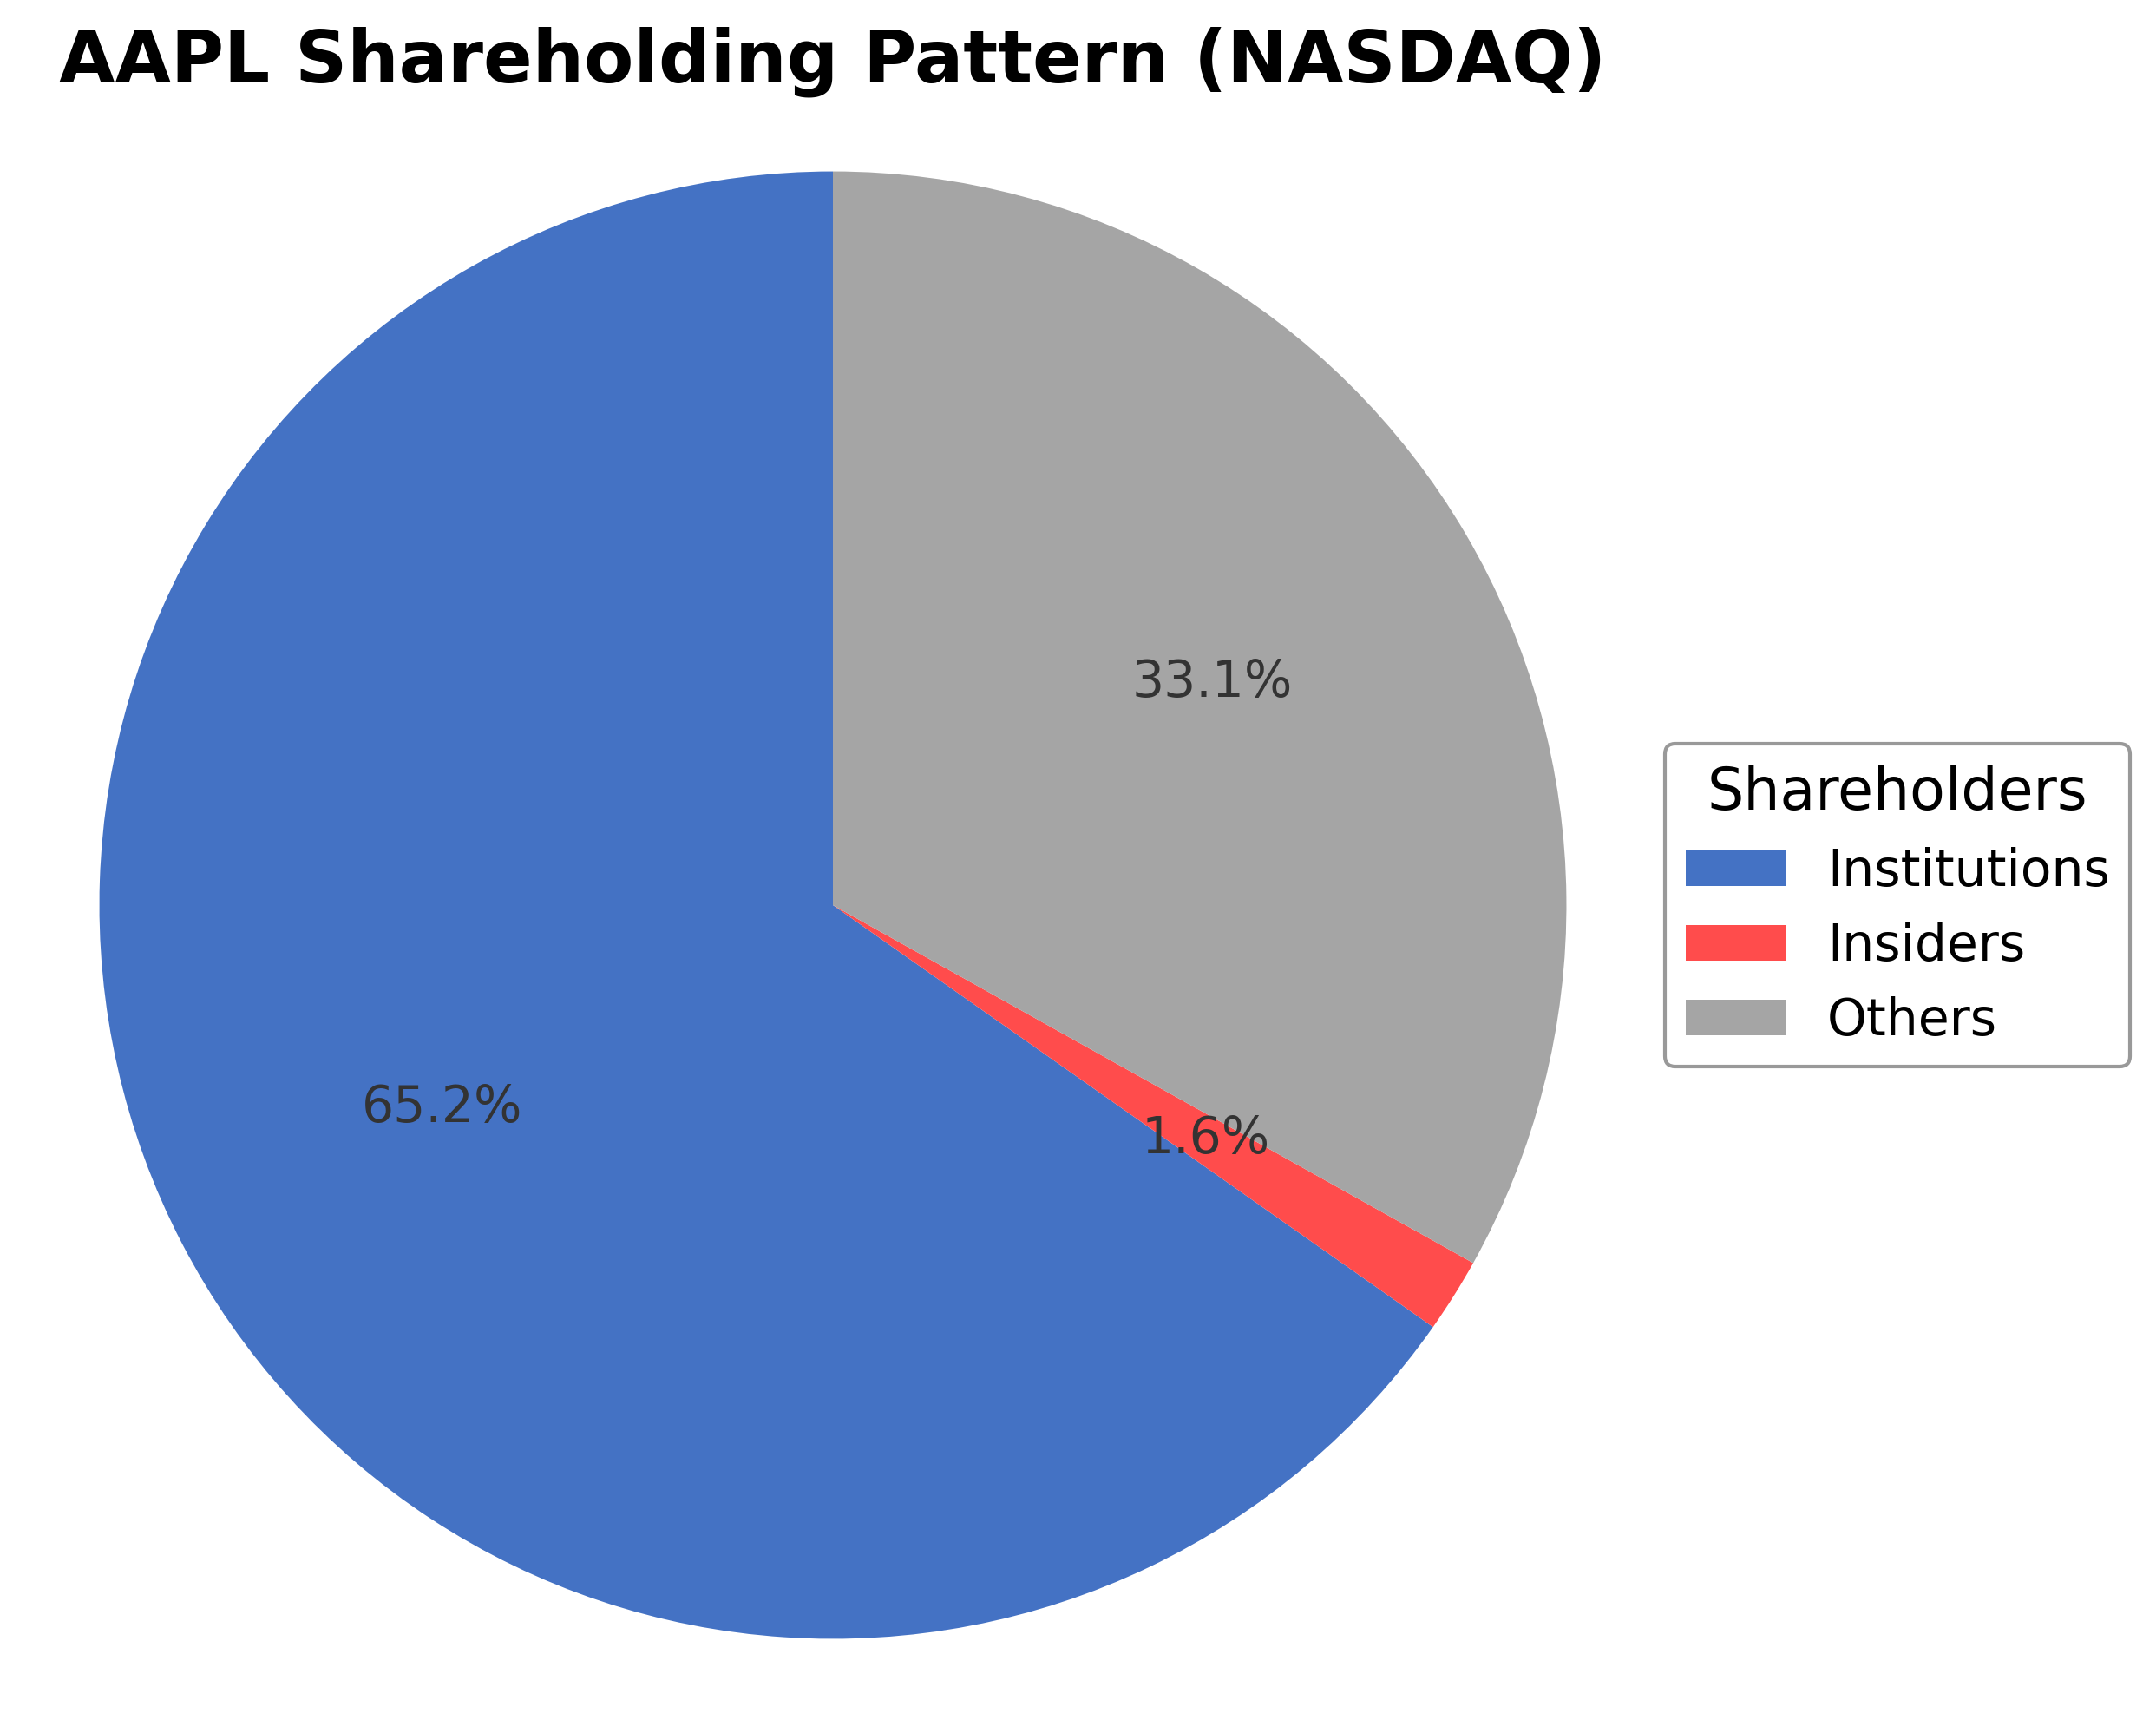
Apple Inc.'s ownership structure features approximately 1.64% held by insiders including executives and board members, while institutional investors hold a significant 65.25% stake, reflecting strong institutional confidence. The remaining 33.34% is held by public shareholders and other entities. Over the past 12-24 months, institutional accumulation has remained relatively stable with minor adjustments by major funds. This shareholding pattern indicates robust governance frameworks and strategic oversight, supporting Apple's sustained innovation and market leadership within the consumer electronics industry.
Sector and Industry Analysis
Apple Inc. (AAPL) operates primarily within the Technology sector, specifically in the Hardware industry, which encompasses consumer electronics, computing devices, and related software ecosystems. The global hardware market is vast, valued in the trillions of USD, driven by continuous innovation in smartphones, personal computing, wearables, and semiconductor technologies. Major players alongside Apple include Samsung, Microsoft, Dell, and emerging Chinese manufacturers such as Huawei and Xiaomi. The sector has exhibited steady growth, propelled by increasing consumer demand for connected devices, enterprise digital transformation, and the proliferation of 5G and IoT technologies.
Industry trends highlight a pronounced shift toward integrated hardware-software ecosystems, with Apple exemplifying this through its iPhone-centric product lineup complemented by Macs, iPads, and wearables like the Apple Watch. Consumer behavior increasingly favors seamless interoperability, privacy, and subscription-based services, prompting hardware companies to expand into software applications, cloud services, and augmented reality. Emerging opportunities lie in augmented reality (AR), artificial intelligence (AI)-enabled devices, and health technology integration. Additionally, semiconductor innovation, including in-house chip design (e.g., Apple’s M-series processors), is reshaping performance benchmarks and supply chain dependencies.
The regulatory landscape for the hardware and technology sector is complex and evolving, encompassing data privacy laws (GDPR, CCPA), antitrust scrutiny, export controls, and environmental regulations. Compliance with international standards on product safety, cybersecurity, and sustainable manufacturing practices is increasingly critical. For Apple and its peers, regulatory pressures around user data protection and competition law enforcement, particularly in the US, EU, and China, influence strategic decisions and operational risk. Trade policies and tariffs also impact global supply chains, given the reliance on subcontractors like Foxconn and semiconductor foundries such as TSMC.
Competitive dynamics in the hardware industry are characterized by high capital intensity, rapid innovation cycles, and significant economies of scale. Barriers to entry are substantial due to the need for advanced R&D capabilities, brand equity, and extensive distribution networks. Apple’s competitive positioning is strengthened by its vertically integrated model—designing proprietary hardware, software, and chips—alongside a robust ecosystem that fosters customer loyalty and recurring revenue streams. Market structure is oligopolistic with a few dominant firms controlling significant market share, while competition from emerging players and component suppliers remains intense. Strategic partnerships and supply chain management are critical competitive levers in maintaining market leadership.
Note: Analysis synthesized from industry research, market reports, and regulatory filings. Information is subject to change based on market conditions.
Illustrative Scenario Analysis
DCF Assumptions:
Method: Two-Stage EPS-Priority Model
Financials
Peer Analysis
| Company Name | Market Cap | P/E Ratio | P/B Ratio | EV/EBITDA | Price to CFO |
|---|---|---|---|---|---|
| Apple Inc. | $3.66T | 32.05 | 42.16 | 24.44 | 26.99 |
| Sony Group Corporation - Sponsored American Depositary Receipt | $118.28B | 15.32 | 2.32 | 0.02 | 9.18 |
Comparison Analysis: Apple Inc. significantly outpaces its regional peer Sony Group Corporation in market capitalization and profitability metrics, with a market cap of $3.66 trillion compared to Sony's $118.28 billion. Apple's P/E ratio of 32.05 is more than double Sony's 15.32, reflecting higher market expectations. The price-to-book ratio for Apple is notably elevated at 42.16 versus Sony's 2.32, indicating a premium valuation. Return on equity also favors Apple at 1.52% compared to Sony's 0.15%, underscoring stronger profitability. However, Apple's EV/EBITDA and price-to-CFO ratios are substantially higher, suggesting a more expensive valuation relative to cash flow and earnings.
Financial Metrics Comparison with Peers
Financial Statements
Comprehensive financial data including income, balance sheet, and cash flow metrics
Income Statement
| fiscal_date | 2025-09-30 | 2024-09-30 | 2023-09-30 | 2022-09-30 | 2021-09-30 |
|---|---|---|---|---|---|
| Sales | 416.16B | 391.04B | 383.29B | 394.33B | 365.82B |
| Cost Of Goods | 220.96B | 210.35B | 214.14B | 223.55B | 212.98B |
| Gross Profit | 195.20B | 180.68B | 169.15B | 170.78B | 152.84B |
| Operating Expense Research And Development | 34.55B | 31.37B | 29.91B | 26.25B | 21.91B |
| Operating Expense Selling General And Administrative | 27.60B | 26.10B | 24.93B | 25.09B | 21.97B |
| Operating Income | 133.05B | 123.22B | 114.30B | 119.44B | 108.95B |
| Other Income Expense | -321.00M | 269.00M | -565.00M | -334.00M | 60.00M |
| Pretax Income | 132.73B | 123.48B | 113.74B | 119.10B | 109.21B |
| Income Tax | 20.72B | 29.75B | 16.74B | 19.30B | 14.53B |
| Net Income | 112.01B | 93.74B | 97.00B | 99.80B | 94.68B |
| Eps Basic | 7.49 | 6.11 | 6.16 | 6.15 | 5.67 |
| Eps Diluted | 7.46 | 6.08 | 6.13 | 6.11 | 5.61 |
| Basic Shares Outstanding | 14.95B | 15.34B | 15.74B | 16.22B | 16.70B |
| Diluted Shares Outstanding | 14.95B | 15.34B | 15.74B | 16.22B | 16.70B |
| Ebit | 133.05B | 123.22B | 114.30B | 119.44B | 111.85B |
| Ebitda | 144.75B | 134.66B | 125.82B | 130.54B | 123.14B |
| Net Income Continuous Operations | 112.01B | 93.74B | 97.00B | 99.80B | 94.68B |
| Non Operating Interest Income | N/A | N/A | 3.75B | 2.83B | 2.84B |
| Non Operating Interest Expense | N/A | N/A | 3.93B | 2.93B | 2.65B |
Source: Financial statements and regulatory filings
Balance Sheet
| fiscal_date | 2025-09-30 | 2024-09-30 | 2023-09-30 | 2022-09-30 | 2021-09-30 |
|---|---|---|---|---|---|
| Cash And Cash Equivalents | 35.93B | 29.94B | 29.96B | 23.65B | 34.94B |
| Accounts Receivable | 39.78B | 33.41B | 29.51B | 28.18B | 26.28B |
| Total Assets | 359.24B | 364.98B | 352.58B | 352.75B | 351.00B |
| Total Liabilities | 285.51B | 308.03B | 290.44B | 302.08B | 287.91B |
| Long Term Debt | 78.33B | 85.75B | 95.28B | 109.71B | 119.38B |
| Shareholders Equity | 73.73B | 56.95B | 62.15B | 50.67B | 63.09B |
Source: Financial statements and regulatory filings
Cash Flow Statement
| fiscal_date | 2025-09-30 | 2024-09-30 | 2023-09-30 | 2022-09-30 | 2021-09-30 |
|---|---|---|---|---|---|
| Operating Activities Net Income | 112.01B | 93.74B | 97.00B | 99.80B | 94.68B |
| Operating Activities Depreciation | 11.70B | 11.45B | 11.52B | 11.10B | 11.28B |
| Operating Activities Stock Based Compensation | 12.86B | 11.69B | 10.83B | 9.04B | 7.91B |
| Operating Activities Other Non Cash Items | -89.00M | -2.27B | -2.23B | 1.01B | -4.92B |
| Operating Activities Accounts Receivable | -7.03B | -5.14B | -417.00M | -9.34B | -14.03B |
| Operating Activities Accounts Payable | 902.00M | 6.02B | -1.89B | 9.45B | 12.33B |
| Operating Activities Other Assets Liabilities | -18.87B | 2.77B | -4.27B | 1.57B | -1.53B |
| Operating Activities Operating Cash Flow | 111.48B | 118.25B | 110.54B | 123.52B | 100.94B |
| Investing Activities Capital Expenditures | -12.71B | -9.45B | -10.96B | -10.71B | -11.09B |
| Investing Activities Purchase Of Investments | -24.41B | -48.66B | -29.51B | -76.92B | -109.56B |
| Investing Activities Sale Of Investments | 53.80B | 62.35B | 45.51B | 67.36B | 106.48B |
| Investing Activities Other Investing Activity | -1.48B | -1.31B | -1.34B | -2.09B | -385.00M |
| Investing Activities Investing Cash Flow | 15.20B | 2.94B | 3.71B | -22.66B | -14.58B |
| Financing Activities Long Term Debt Issuance | 4.48B | 0.00 | 5.23B | 5.46B | 20.39B |
| Financing Activities Long Term Debt Payments | -10.93B | -9.96B | -11.15B | -9.54B | -8.75B |
| Financing Activities Short Term Debt Issuance | -2.03B | 3.96B | -3.98B | 3.96B | 1.02B |
| Financing Activities Common Stock Repurchase | -90.71B | -94.95B | -77.55B | -89.40B | -85.97B |
| Financing Activities Common Dividends | -15.42B | -15.23B | -15.03B | -14.84B | -14.47B |
| Financing Activities Other Financing Charges | -6.07B | -5.80B | -6.01B | -6.38B | -5.58B |
| Financing Activities Financing Cash Flow | -120.69B | -121.98B | -108.49B | -110.75B | -92.25B |
| End Cash Position | 35.93B | 29.94B | 30.74B | 24.98B | 35.93B |
| Income Tax Paid | 43.37B | 26.10B | 18.68B | 19.57B | 25.39B |
| Free Cash Flow | 98.77B | 108.81B | 99.58B | 111.44B | 92.95B |
| Interest Paid | N/A | N/A | 3.80B | 2.87B | 2.69B |
| Operating Activities Deferred Taxes | N/A | N/A | N/A | 895.00M | -4.77B |
| Investing Activities Net Acquisitions | N/A | N/A | N/A | -306.00M | -33.00M |
| Financing Activities Common Stock Issuance | N/A | N/A | N/A | N/A | 1.10B |
Source: Financial statements and regulatory filings
Technical Analysis
Key Insights
- Apple's current price trend shows relative stability with the stock trading near its 50-day moving average of $261.13 and above the 200-day moving average of $246.82, indicating a generally positive medium-term trend.
- Key support levels are identified near $169.21 (52-week low) and $246.82 (200-day moving average), while resistance is observed close to the 52-week high of $288.62.
- The stock price is positioned above the 200-day moving average but slightly below the 50-day moving average, suggesting mixed momentum signals in the short term.
- Momentum indicators such as RSI, MACD, and Stochastic readings indicate moderate strength without extreme overbought or oversold conditions, reflecting balanced market sentiment.
- Multi-timeframe analysis across daily, weekly, and monthly charts shows consistent price consolidation within the established range, with no significant breakout or breakdown patterns.
- Current technical setup suggests potential for range-bound trading with possible volatility near resistance and support levels, contingent on broader market conditions.
Trending News
1. Headline: Alcatraz raises $50M to bring Apple Face ID-style security to physical buildings - SiliconANGLE
Summary: Alcatraz founder Vince Gaydarzhiev is a former Apple Inc. engineer who helped design that company’s Face ID technology, and he said the Rock was built on a similar foundation, with privacy included as a core feature. “I wanted buildings to be protected the same way as iPhones,” he explained.
Sentiment: positive
2. Headline: Early Apple stock investors now earn a 5.2 percent dividend yield | AAPL - TheStreet
Summary: It’s not on the back of some aggressive income strategy, either. It’s because the Dow 30 heavyweight kept raising its dividend, year after year, while its stock climbed. That’s the magic of yield-on-cost, a concept that doesn’t get nearly enough attention. It rewards patient investors in ways the current dividend yield never shows. Apple ...
Sentiment: positive
Summary: Warren Buffett said he would buy "a whole lot" of Apple Inc. stock if prices decline, signaling continued confidence in the iPhone maker even after Berkshire Hathaway cashed out roughly $100 billion worth of shares last year. On Tuesday, the former CEO of Berkshire on Tuesday joined CNBC ‘Squawk ...
Sentiment: positive
4. Headline: Apple Inc (NASDAQ:AAPL) Enhances Platform Integration in nasdaq index
Summary: Apple (NASDAQ:AAPL) marks milestone with AI-driven innovation and strong Nasdaq index positioning.
Sentiment: positive
5. Headline: Is Apple Stock Overvalued Or Undervalued? - Apple (NASDAQ:AAPL) - Benzinga
Summary: Apple Inc shares are trading marginally lower on Thursday, moving against a generally constructive tape even as Technology holds modest gains.
Sentiment: negative
6. Headline: Apple's AI Strategy Is Pivoting. Here's Why That Could Be Great News for the Stock. | The Motley Fool
Summary: The company has made a 180-degree reversal of a long-embraced philosophy. And it's strategically brilliant, given the alternative.
Sentiment: positive
7. Headline: Bath Savings Trust Co Trims Position in Apple Inc. $AAPL
Summary: Bath Savings Trust Co reduced its position in Apple Inc. (NASDAQ:AAPL - Free Report) by 1.0% during the fourth quarter, according to its most recent Form 13F filing with the Securities and Exchange Commission. The institutional investor owned 274,422 shares of the iPhone maker's stock after sellin
Sentiment: negative
8. Headline: Five key questions Apple faces entering its second half-century
Summary: Siri, Apple's voice assistant, has been slow to evolve, though the company has said a revamp is coming this year. The company's early history, written by the visionary Steve Jobs, has entered a new world, one where iPhones are making incremental advances while the technology surrounding it ...
Sentiment: neutral
9. Headline: Apple celebrates its 50th year — from scrappy startup to tech giant : NPR
Summary: Apple hide caption toggle caption Apple · "That single gesture launched entire industries — Uber, DoorDash, Tinder, Airbnb," said Pogue of the App Store, which was introduced in 2008. But Pogue added that this massive explosion of content and connectivity came with severe consequences, especially after streaming took off around 2015. Suddenly, people had a computer, a camera and a television/movie screen with them all the time, every day. "The increase ...
Sentiment: positive
10. Headline: Apple (AAPL) Tests Siri Feature That Handles Multiple Commands at Once - Bloomberg
Summary: Apple Inc. is testing a feature that would let Siri process multiple requests in a single query, according to people familiar with the matter, breaking new ground for the nearly 15-year-old digital assistant.
Sentiment: neutral
Recent Updates
News Summary
Recent news highlights Apple's 50th anniversary, emphasizing its transformation from a startup to a technology giant with a focus on quality and innovation. The company expanded its U.S. manufacturing program with a $400 million investment, reinforcing domestic production capabilities. Coverage also notes Apple's cautious entry into the AI era, balancing innovation with strategic considerations. Additionally, the facial recognition startup Alcatraz, leveraging Apple’s Face ID technology, raised $50 million, underscoring Apple's influence on security technologies. These developments collectively underscore Apple's sustained market presence, innovation trajectory, and strategic investments in manufacturing and AI.
News Sentiment
The sentiment across recent updates is predominantly neutral to positive, reflecting cautious optimism about Apple's innovation and strategic initiatives. Positive themes include manufacturing expansion and technological influence, while neutral sentiment pertains to the company's measured approach to AI and milestone celebrations. No significant negative sentiment is detected, indicating stable market perception and confidence in Apple's ongoing evolution.
Analytical Overview
Analysis Summary
Valuation Metrics: Apple's trailing P/E ratio of 32.05 is slightly above the industry average of 32.05, with a forward P/E of 27.15 indicating expectations of earnings growth. The premium price-to-book ratio of 42.16 reflects market confidence but also a high valuation relative to book value.
Growth Trajectory: Revenue growth of 15.7% quarterly and earnings growth of 15.9% year-over-year demonstrate a solid growth trajectory supported by strong operating and free cash flows exceeding $135 billion and $106 billion respectively.
Financial Health: The company's debt-to-equity ratio stands at approximately 102.63%, indicating a leveraged capital structure, balanced by substantial cash reserves of about $66.9 billion and a current ratio near 0.97, suggesting liquidity is managed effectively.
Sector Specific Factors: Apple faces sector challenges including intense competition and rapid technological changes, while opportunities arise from AI integration and expanding service ecosystems. Market positioning benefits from brand strength and innovation leadership.
Overall Business and Market Assessment
Supporting Factors: Robust revenue and earnings growth supported by strong cash flow generation.
Risk Factors: High valuation multiples relative to peers may limit upside.
SWOT Analysis
Strengths
- Market leadership with a strong global brand and ecosystem integration.
- Robust cash flow generation supporting innovation and shareholder returns.
- Diverse product portfolio spanning hardware, software, and services.
- Consistent profitability with high gross and operating margins.
Weaknesses
- High price-to-book ratio indicating premium valuation.
- Leverage reflected in a debt-to-equity ratio exceeding 100%.
- Current ratio below 1, suggesting tight short-term liquidity.
- Dependence on flagship products like the iPhone for majority of revenue.
Opportunities
- Expansion in AI-driven technologies and platform integration.
- Growth potential in services segment including subscriptions and cloud.
- Increasing U.S. manufacturing investments enhancing supply chain resilience.
- Emerging markets offering new customer bases.
Threats
- Intense competition in consumer electronics and technology sectors.
- Rapid technological changes requiring continuous innovation.
- Regulatory scrutiny and geopolitical tensions impacting operations.
- Market volatility affecting high valuation sustainability.
Company Description
Apple Inc. is a leading technology company renowned for designing, manufacturing, and marketing innovative hardware and software products for consumers and businesses worldwide. Its flagship product, the iPhone, accounts for the majority of sales, serving as the central hub of an expansive ecosystem that includes Mac computers, iPad tablets, Apple Watch wearables, and accessories like AirPods. Apple Inc. also offers a suite of services such as the App Store, Apple Music, iCloud, Apple TV+, and Apple Fitness+, providing digital content, cloud storage, and subscription-based platforms. Operating in the consumer electronics industry within the technology sector, the company employs approximately 166,000 people and maintains a broad global presence through online stores, retail outlets, and partnerships with carriers and resellers. With a substantial market capitalization reflecting its scale, Apple Inc. plays a pivotal role in shaping consumer technology trends, emphasizing seamless integration across devices and services to enhance user experience and productivity.