
Apollo Tyres Ltd (APOLLOTYRE)
Stock Analysis Report
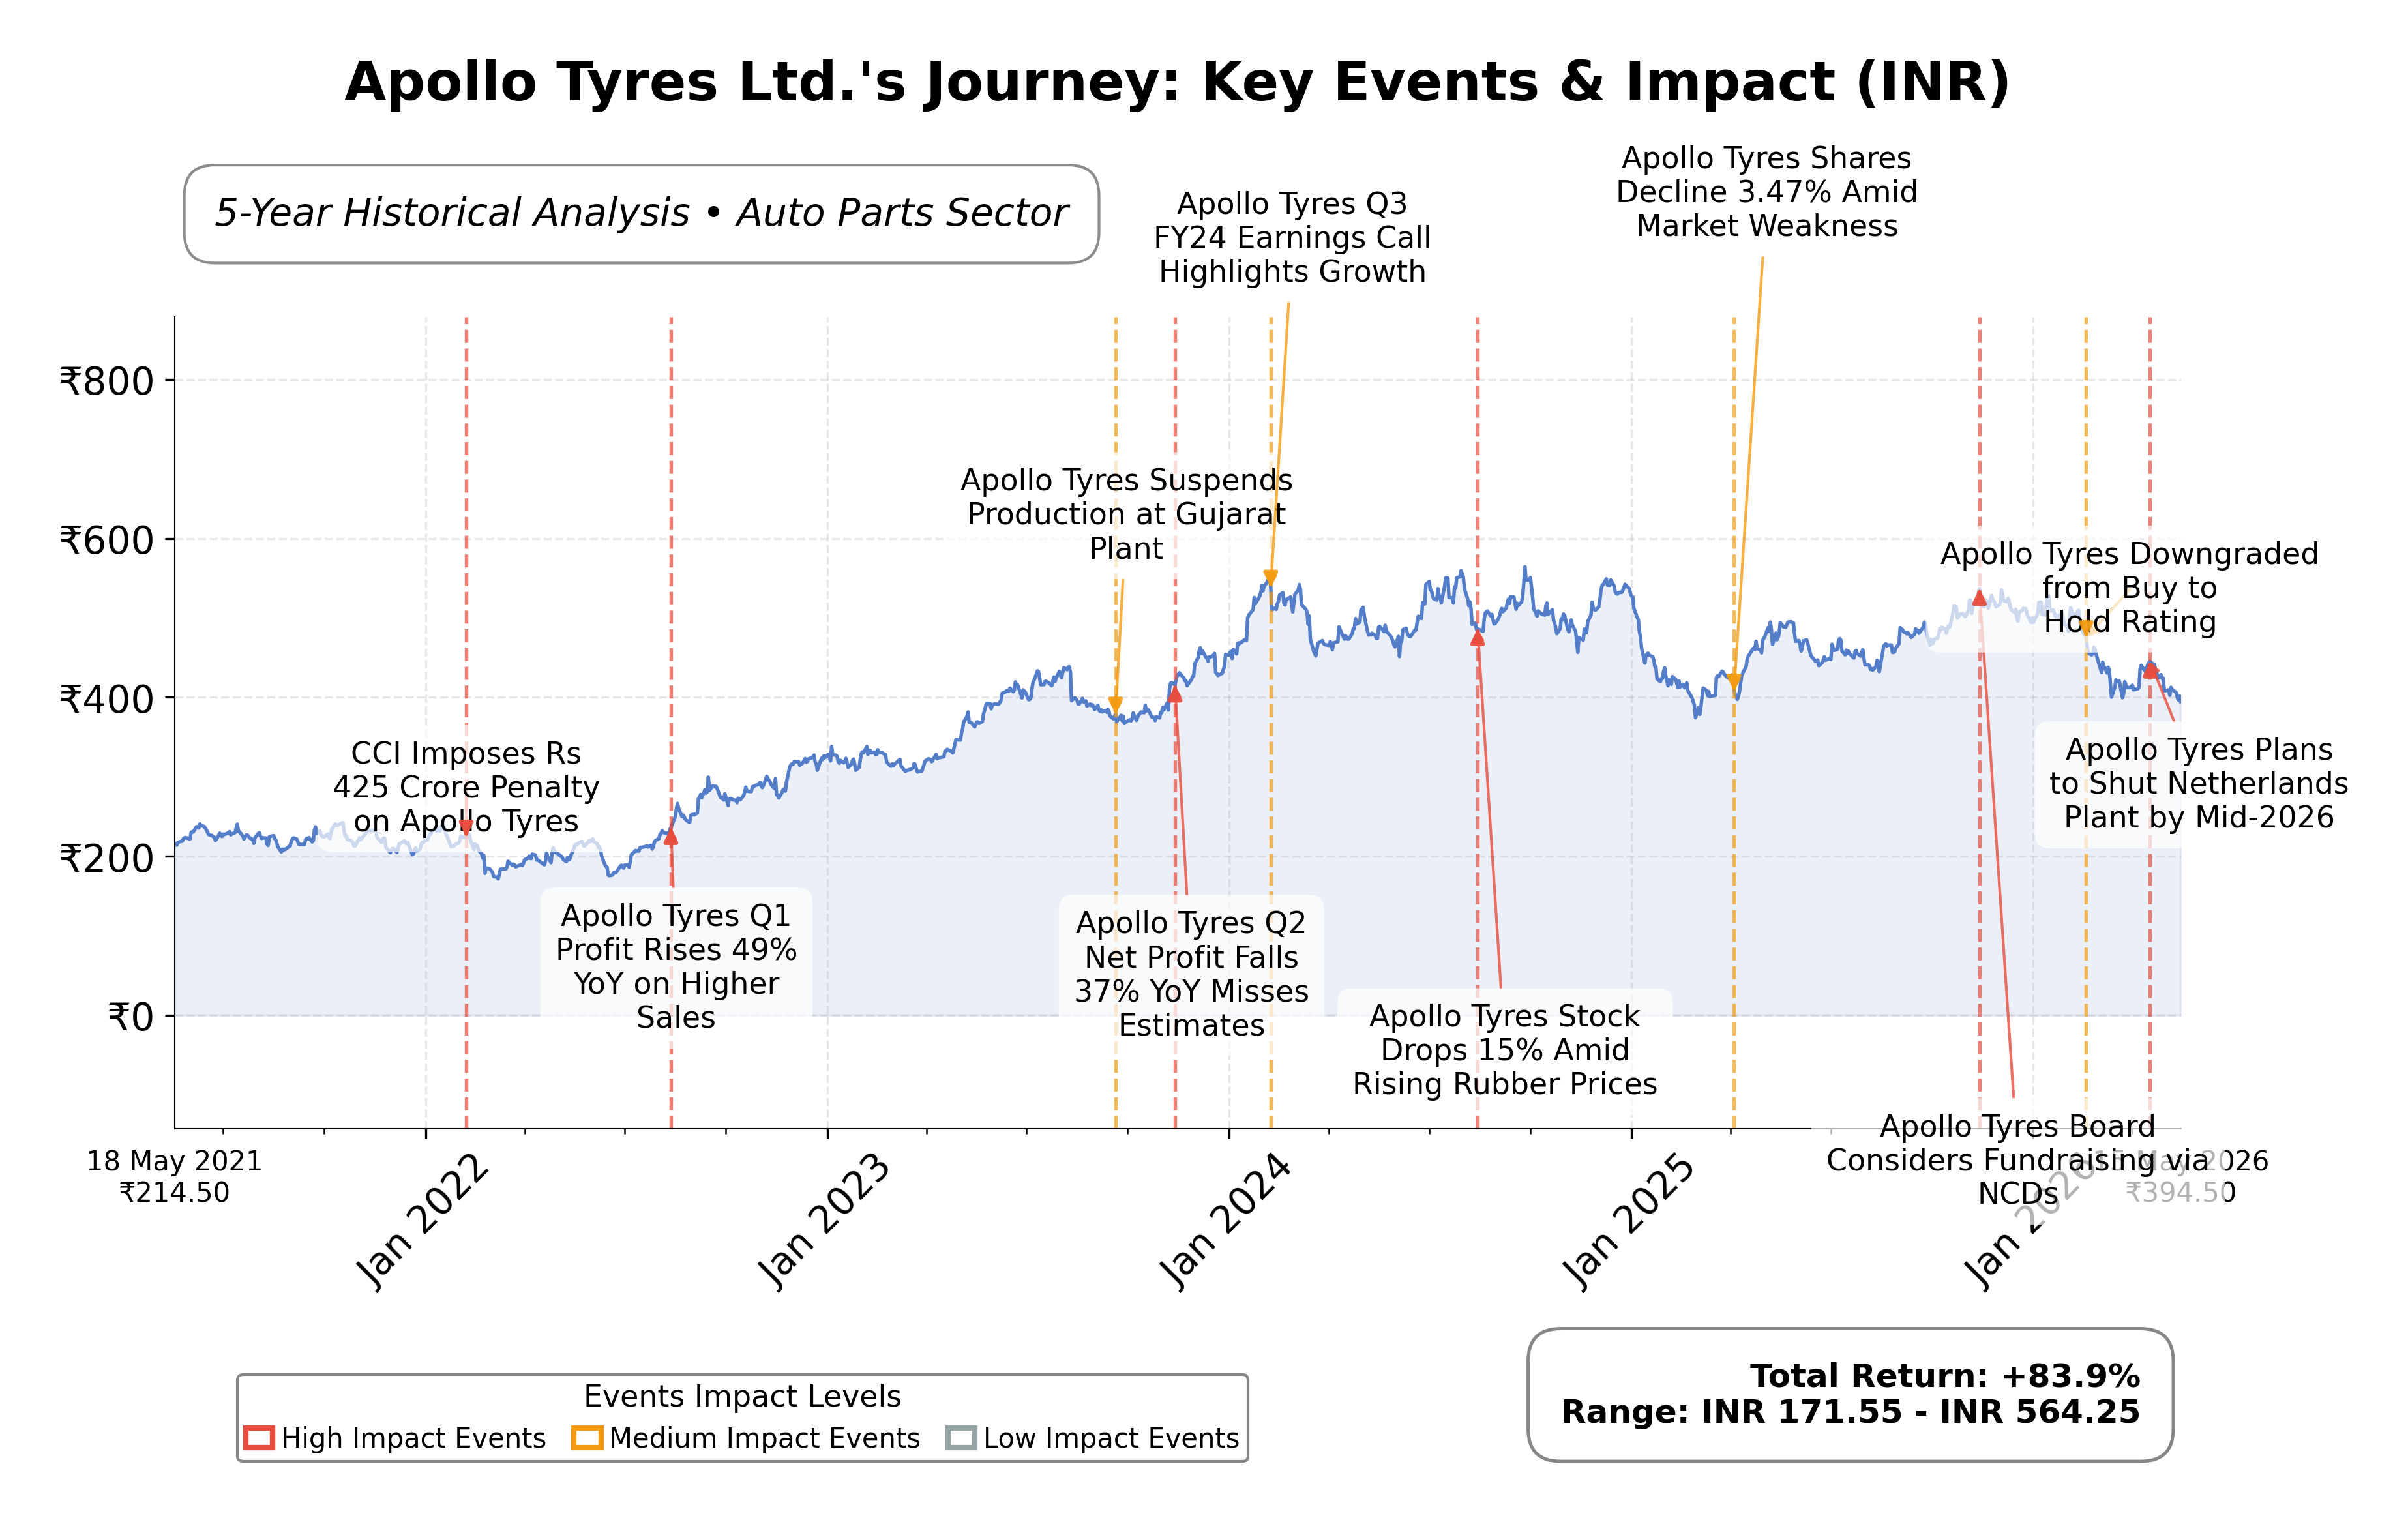
Stock Journey
Key Positives and Key Risks
Pros
- Apollo Tyres’ trailing P/E ratio of 18.21 is lower than many peers, suggesting relatively attractive valuation.
- The company reported a 241% year-on-year increase in quarterly net profit, indicating strong earnings momentum.
- Levered free cash flow of INR 11.2 billion and a debt-to-equity ratio of 0.29 reflect solid financial health.
Cons
- The stock price is trading below the 50-day and 200-day moving averages, indicating recent bearish technical trends.
- Price to cash flow ratio is high at 55.27, which may signal weaker cash flow relative to market price.
- Profit margins are modest with a net margin of 3.36%, lower than some industry competitors.
Disclosure: This information is for general awareness and does not constitute investment advice
Report Summary
Apollo Tyres Ltd. is a leading tire manufacturing company based in India, operating primarily on the NSE exchange within the Consumer Cyclical sector. The company produces a broad range of automotive tires catering to commercial vehicles, passenger cars, and two-wheelers, with notable brands such as Apollo and Vredestein. Its market presence extends beyond India through strategic expansions and acquisitions, positioning it as a significant player in the global tire industry. Apollo Tyres is recognized for its durable and high-performance products, serving diverse road conditions and customer segments.
Financially, Apollo Tyres reported a trailing twelve months (TTM) revenue of approximately INR 275.6 billion with a gross margin of 44.98%, operating margin of 10.34%, and a net profit margin of 3.36%. The company’s return on equity (ROE) stands at 7.59%, return on assets (ROA) at 4.11%, and return on invested capital (ROIC) is reflected in an enterprise value to EBITDA ratio of 8.35, indicating moderate profitability and operational efficiency. Quarterly revenue growth was 11.8%, and quarterly earnings growth year-over-year was 39.5%, signaling positive momentum in earnings performance.
Valuation metrics show a trailing price-to-earnings (P/E) ratio of 18.21 and a forward P/E of 11.00, with a price-to-book (P/B) ratio of 1.61 and an enterprise value to revenue ratio of 1.06. The market capitalization is approximately INR 249.55 billion. The stock price currently trades near INR 394.30, closer to its 52-week low of INR 392 than the high of INR 540.50, reflecting a downside risk of about 37% from the 52-week high. These valuation multiples suggest the stock is priced moderately relative to its earnings and book value, with potential for re-rating based on earnings growth.
Apollo Tyres’ strengths include strong cash flow generation with a levered free cash flow of INR 11.2 billion and a manageable debt-to-equity ratio of 0.29, reflecting prudent financial management. The company has recently reduced net debt by INR 9 billion and reported significant profit growth, supported by operational efficiencies and expanding premium and electric vehicle (EV) tire segments. Key risks involve competitive pressures in global markets, cost inflation, and regulatory challenges. Recent strategic actions include capacity expansions in India and Mexico, aiming to replace production from competitors like Goodyear.
Technically, the stock is trading below its 200-day moving average of INR 475, with momentum indicators showing mixed signals across multiple timeframes. Recent news highlights strong quarterly earnings growth and operational improvements, though some volatility in price action was observed post-earnings release. Overall, the data suggests a cautious stance with attention to earnings momentum and valuation shifts, suitable for monitoring evolving market conditions.
Company and Industry Overview
Company Basics
Price Performance
Company Size
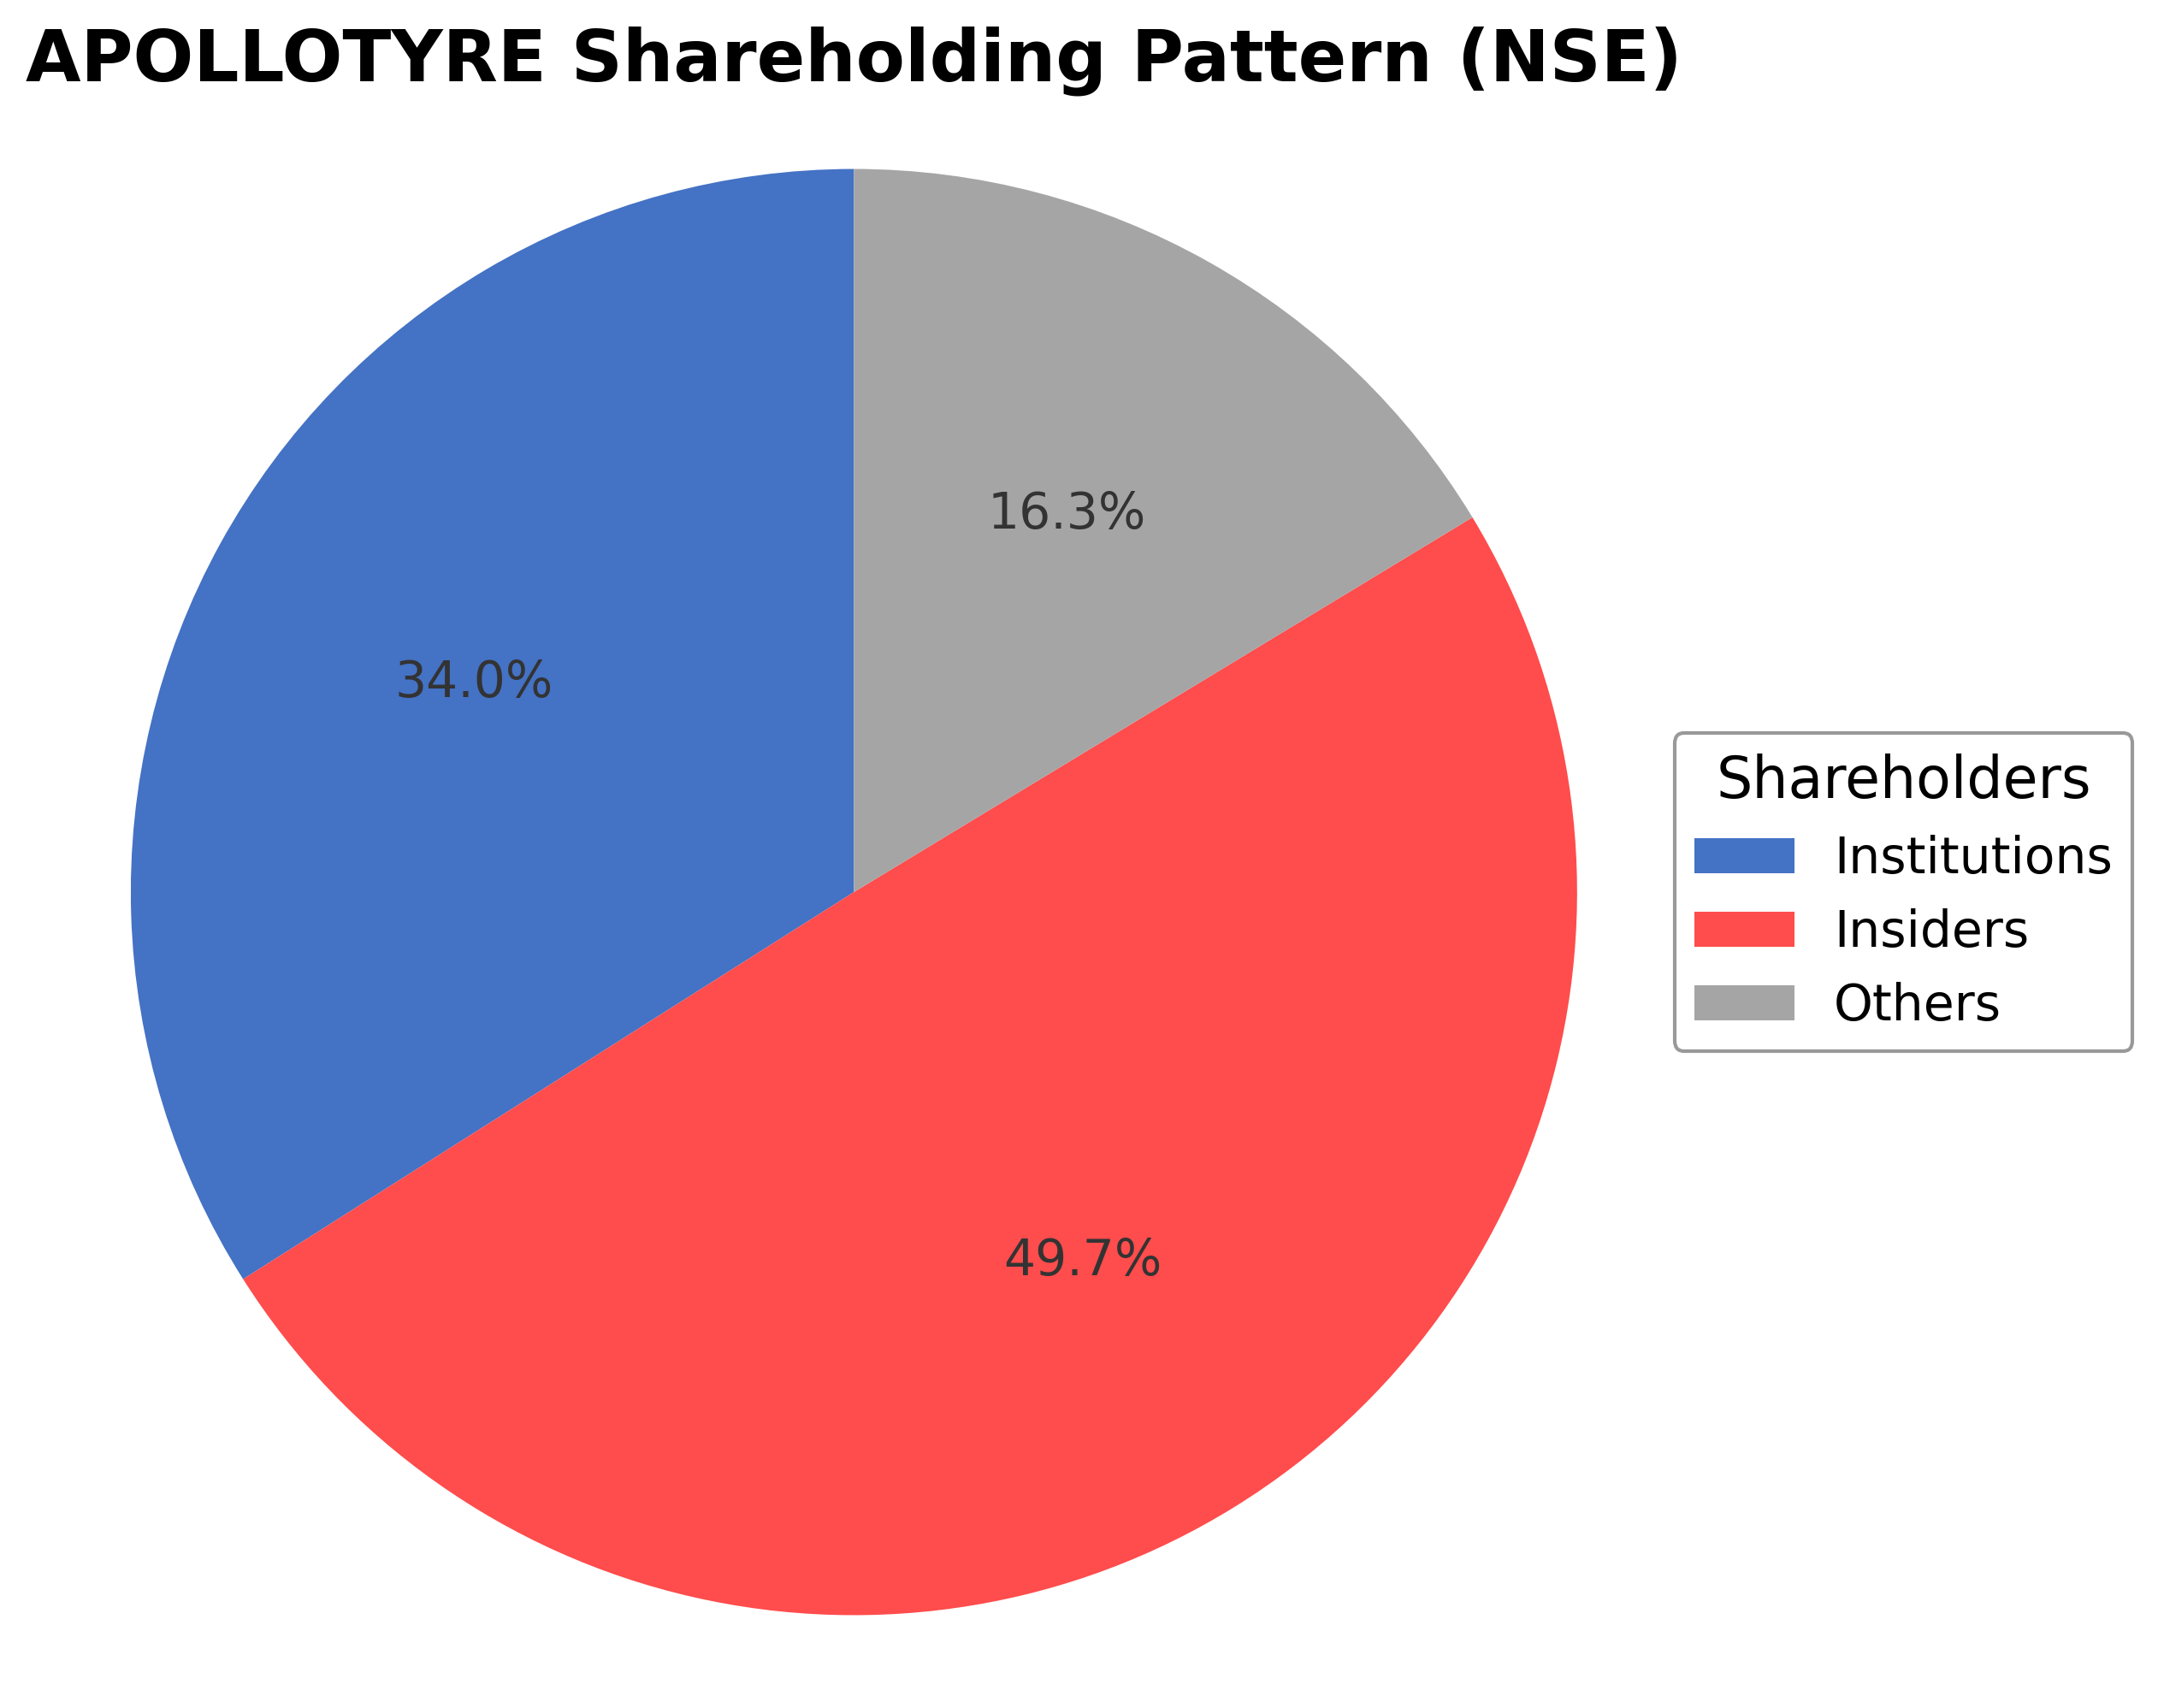
Shareholding Pattern
Sector and Industry Analysis
The global tire sector is a substantial component of the automotive supply chain, encompassing passenger vehicles, commercial trucks, buses, and specialty off-highway tires. The market has demonstrated steady growth, with companies like Apollo Tyres, Bridgestone, Michelin, and Continental leading in scale and innovation. Growth rates have been supported by rising vehicle production, increasing replacement demand, and expanding applications in agriculture and industrial equipment. The sector’s revenue growth typically aligns with automotive industry cycles and infrastructure development trends.
Industry dynamics are shaped by evolving consumer preferences, technological advancements, and competitive pressures. There is a notable shift toward premium and performance tires, including those designed for electric vehicles, which demand specialized features such as low rolling resistance and noise reduction. Barriers to entry remain high due to capital-intensive manufacturing, brand loyalty, and extensive distribution networks. Companies differentiate through product quality, innovation, and geographic reach, with a growing emphasis on sustainability and lifecycle performance to capture emerging market segments.
Regulatory frameworks focus on safety standards, environmental impact, and recycling mandates, influencing product design and manufacturing processes. Governments worldwide are enforcing stricter emissions and fuel efficiency norms, indirectly driving demand for eco-friendly tire technologies. Additionally, regulations on waste management and tire disposal are increasing operational compliance costs but also fostering circular economy initiatives. The outlook suggests continued regulatory tightening, encouraging innovation in materials and production methods to meet evolving legal and consumer expectations.
Note: Analysis synthesized from industry research, market reports, and regulatory filings. Information is subject to change based on market conditions.
Financial Ratios Dashboard
Illustrative Scenario Analysis
DCF Assumptions:
Method: Two-Stage EPS-Priority Model
Financials
Peer Analysis
| Company Name | Market Cap | P/E Ratio | P/B Ratio | EV/EBITDA | Price to CFO |
|---|---|---|---|---|---|
| Apollo Tyres Ltd. | ₹249.55B | 18.21 | 1.61 | 8.35 | 55.27 |
| Exide Industries Ltd. | ₹296.69B | 34.79 | 2.14 | 16.16 | 12.29 |
| Varroc Engineering Ltd. | ₹85.24B | 48.42 | 5.06 | 12.12 | 31.15 |
| Sundram Fasteners Ltd. | ₹178.92B | 30.24 | 4.42 | 18.66 | 21.38 |
| Sona BLW Precision Forgings Ltd. | ₹356.76B | 58.11 | 6.24 | 30.02 | 54.13 |
| Balkrishna Industries Limited | ₹415.30B | 34.12 | 3.87 | 19.52 | 22.07 |
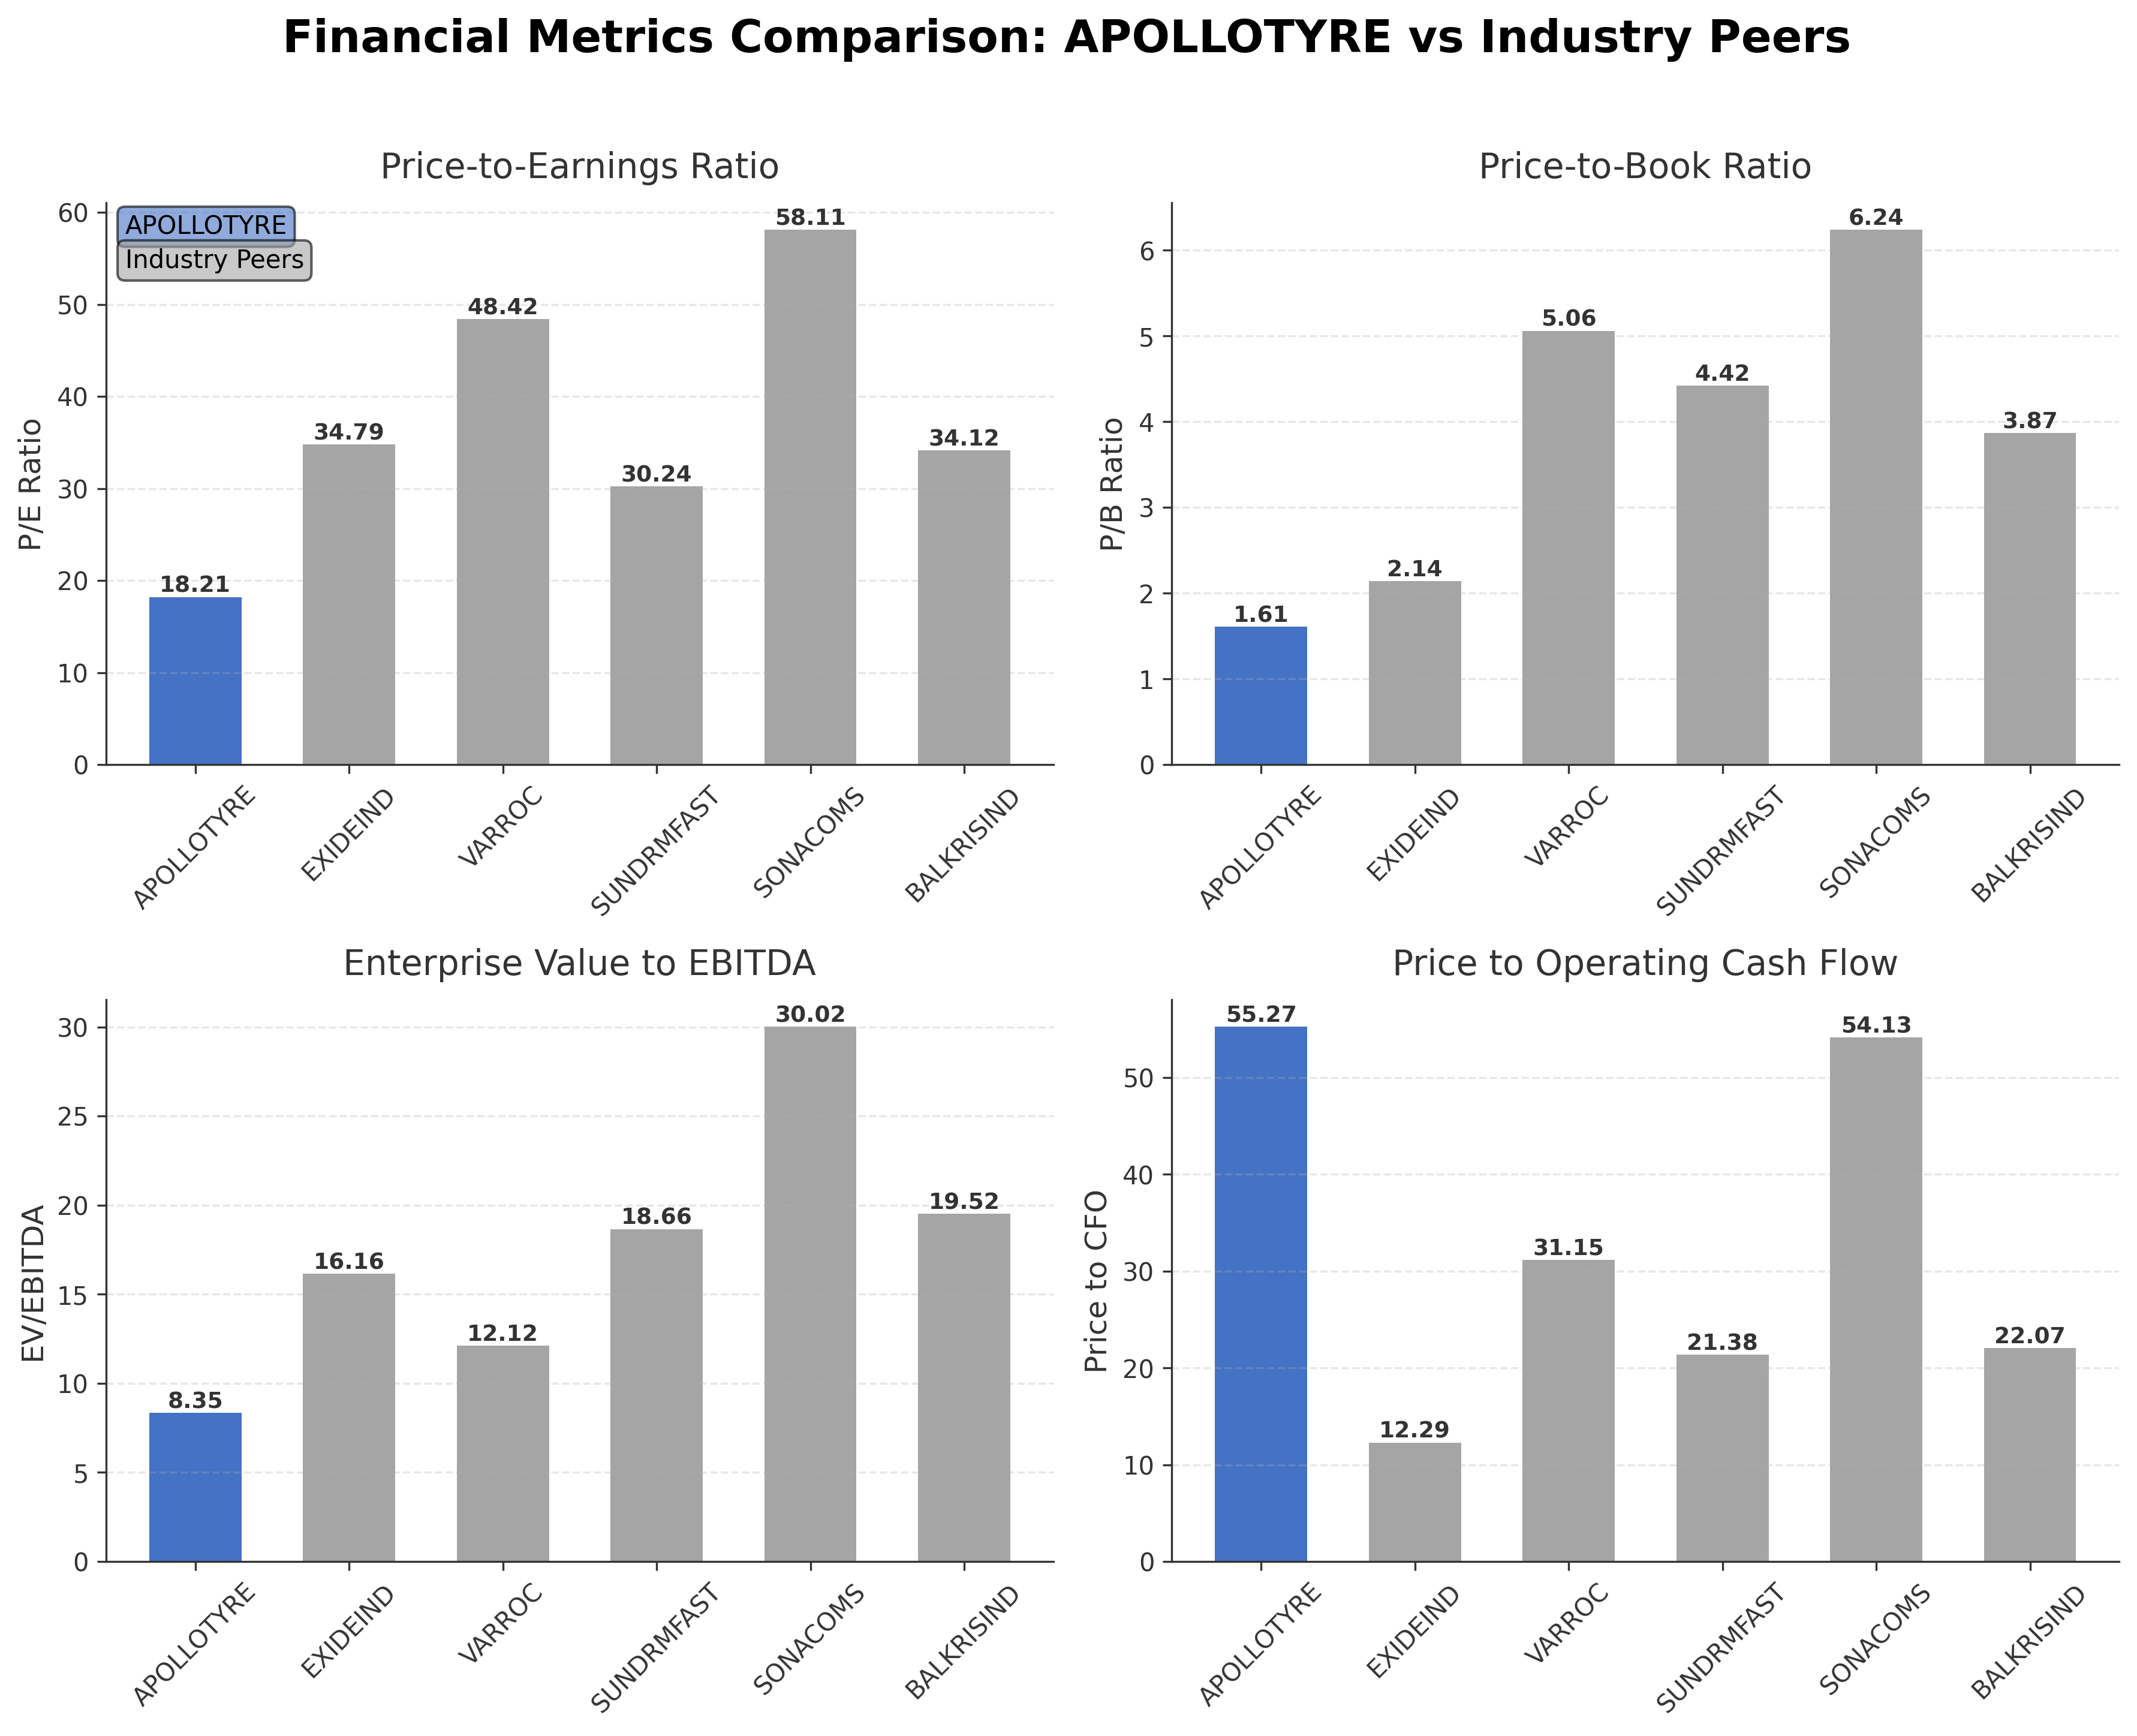
Comparison Analysis: Apollo Tyres Ltd. exhibits a lower P/E ratio of 18.21 compared to its peers, indicating a more attractive valuation relative to companies like Varroc Engineering and Sona BLW Precision Forgings, which have P/E ratios above 48 and 58 respectively. The company also maintains a lower EV/EBITDA multiple of 8.35, suggesting better operational value relative to enterprise value than many peers. However, Apollo Tyres' price to cash flow ratio is significantly higher at 55.27, which may reflect differences in cash flow generation or capital expenditure. Return on equity at 7.59% is moderate but below some peers such as Balkrishna Industries and Sundram Fasteners, which report ROEs above 15%. Overall, Apollo Tyres presents a balanced valuation profile with room for operational improvements relative to its industry peers.
Financial Metrics Comparison with Peers
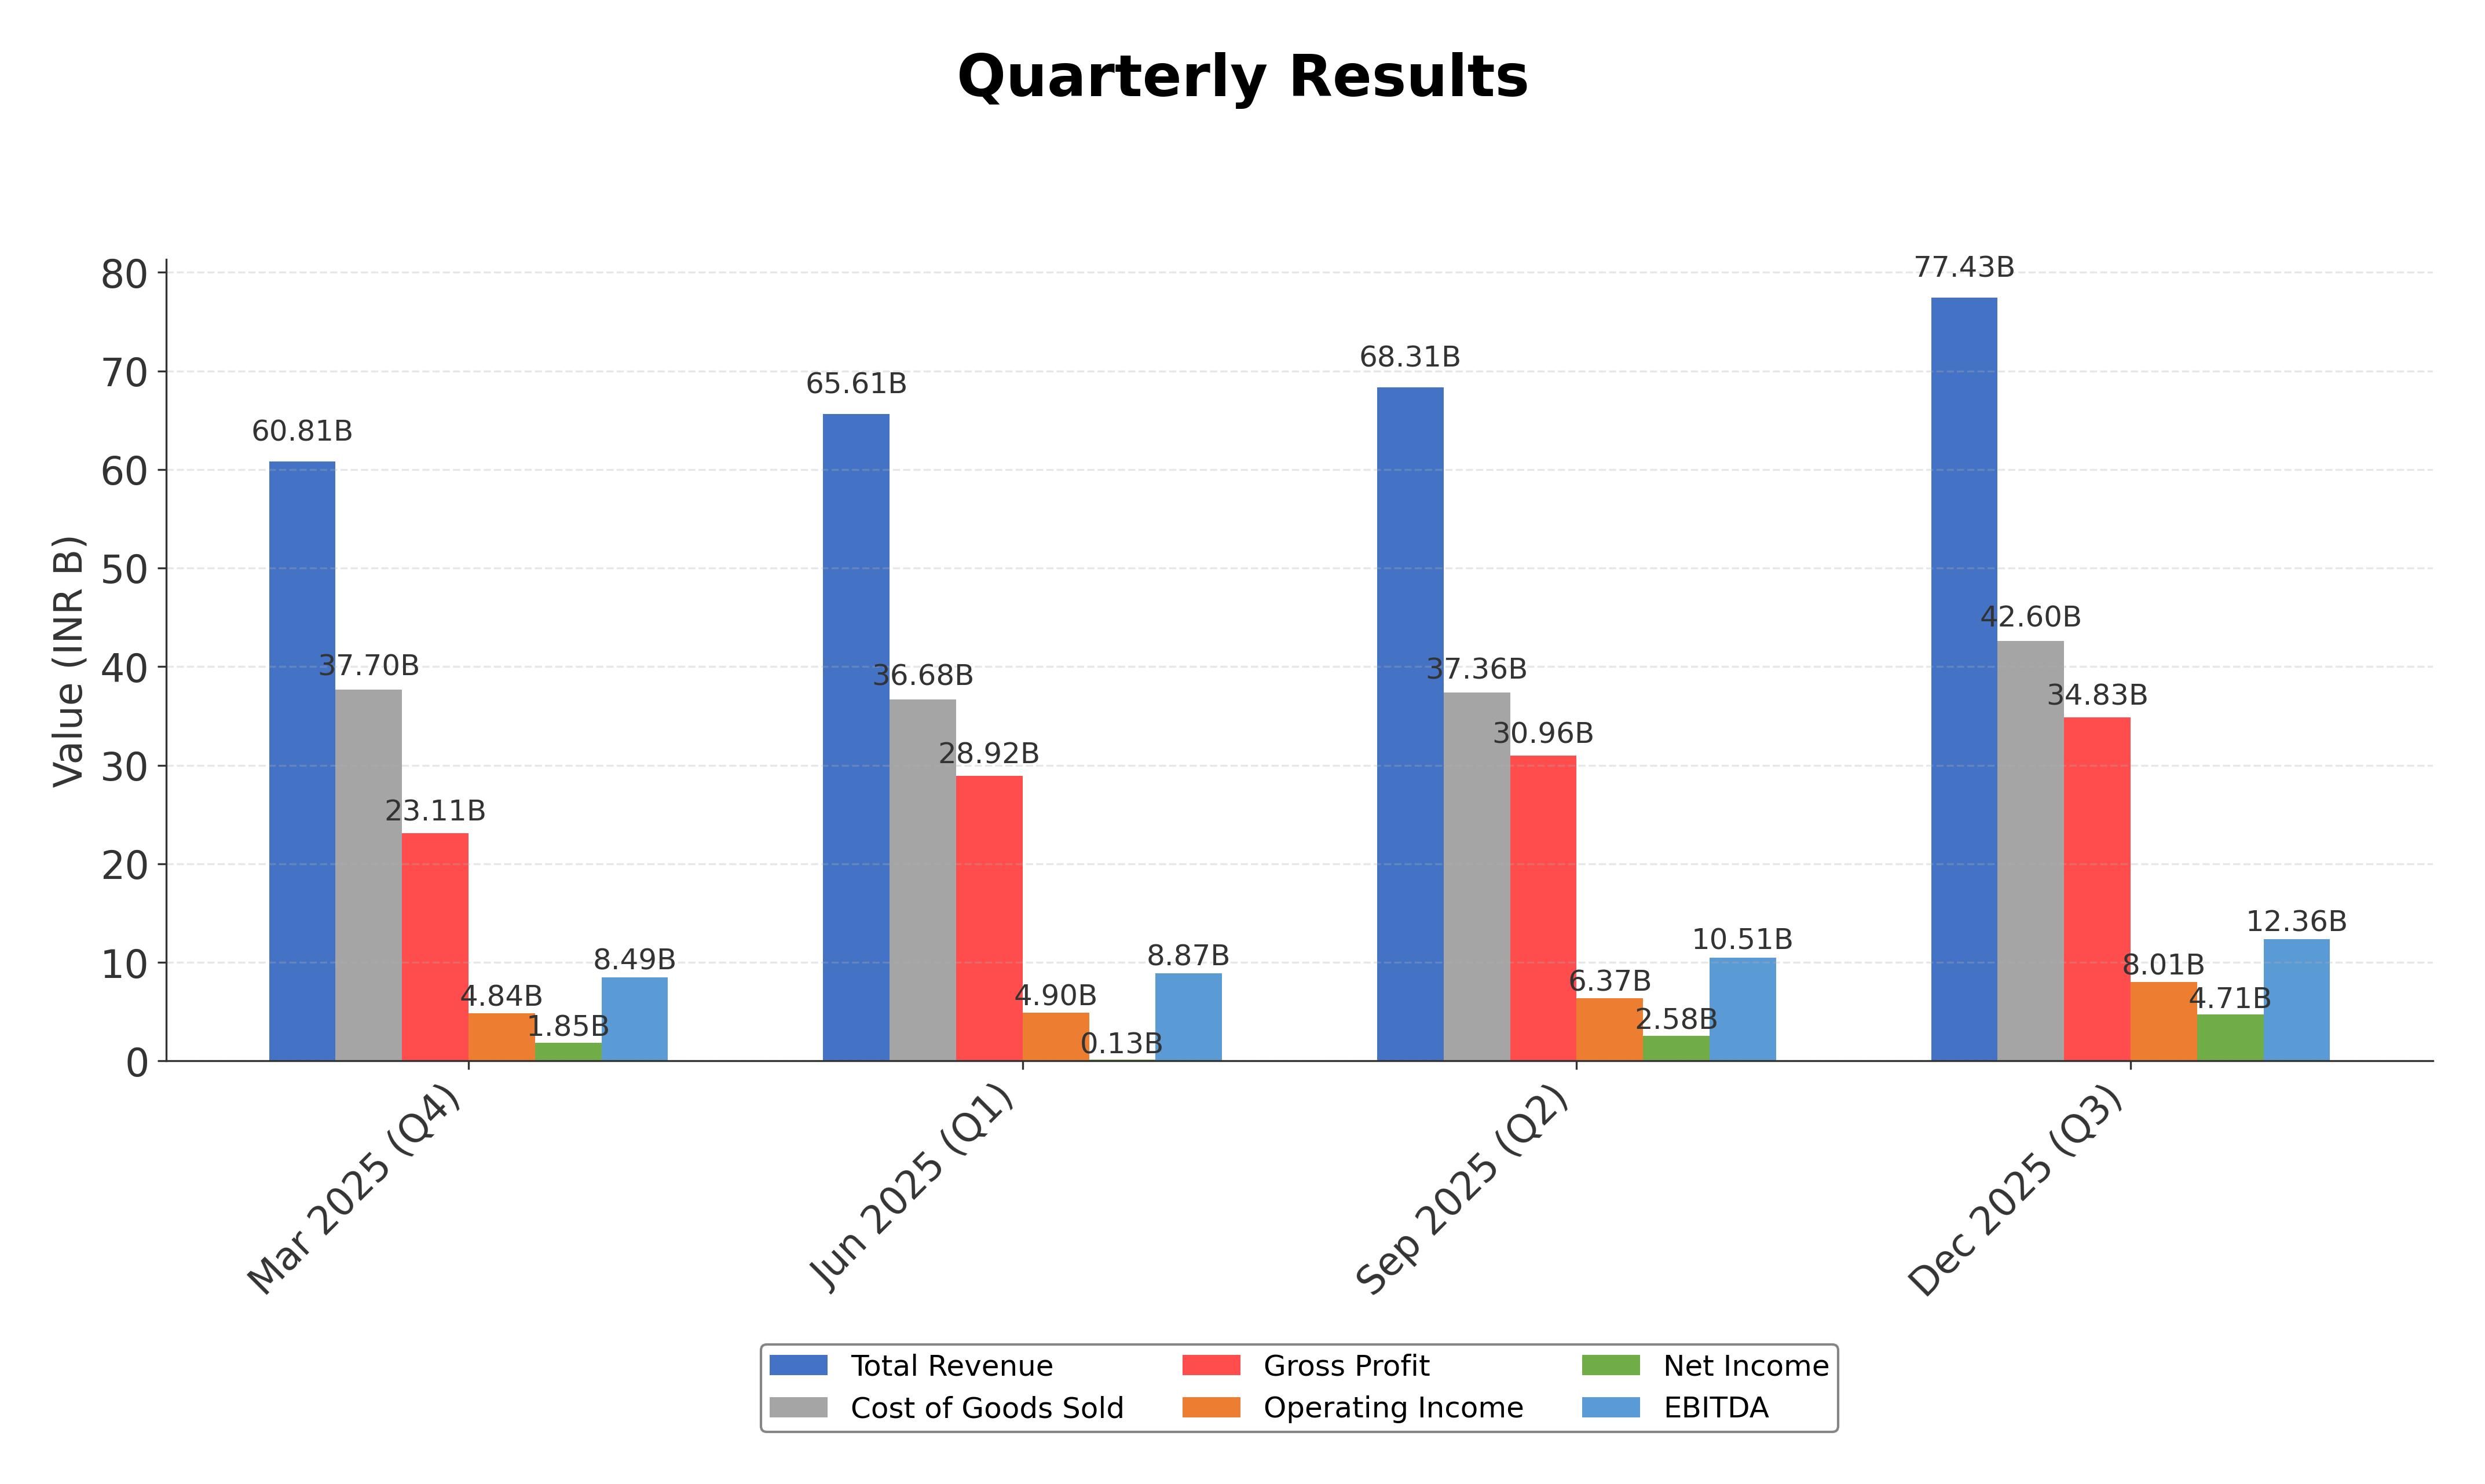
Financial Statements
Comprehensive financial data including income, balance sheet, and cash flow metrics
Income Statement
| fiscal_date | 2025-03-31 | 2024-03-31 | 2023-03-31 | 2022-03-31 | 2021-03-31 |
|---|---|---|---|---|---|
| Sales | 257.81B | 250.20B | 241.22B | 205.81B | 169.55B |
| Cost Of Goods | 148.30B | 137.97B | 147.82B | 125.22B | 95.10B |
| Gross Profit | 109.51B | 112.24B | 93.40B | 80.59B | 74.44B |
| Operating Expense Selling General And Administrative | 22.49B | 20.43B | 20.44B | 17.75B | 13.17B |
| Operating Expense Other Operating Expenses | 22.64B | 20.24B | 17.38B | 14.62B | 12.22B |
| Operating Income | 20.97B | 29.91B | 19.15B | 11.95B | 15.03B |
| Non Operating Interest Income | 309.74M | 347.84M | 257.08M | 402.98M | 821.03M |
| Non Operating Interest Expense | 4.33B | 4.95B | 5.16B | 4.27B | 4.38B |
| Pretax Income | 15.47B | 25.40B | 14.27B | 8.48B | 5.61B |
| Income Tax | 4.25B | 8.18B | 3.81B | 2.09B | 2.11B |
| Net Income | 11.21B | 17.22B | 10.46B | 6.39B | 3.50B |
| Eps Basic | 17.66 | 27.11 | 16.47 | 10.06 | 5.68 |
| Eps Diluted | 17.66 | 27.11 | 16.47 | 10.06 | 5.68 |
| Basic Shares Outstanding | 635.10M | 635.10M | 635.10M | 635.10M | 616.96M |
| Diluted Shares Outstanding | 635.10M | 635.10M | 635.10M | 635.10M | 616.96M |
| Ebit | 19.80B | 30.36B | 19.44B | 12.75B | 9.99B |
| Ebitda | 36.44B | 45.79B | 33.36B | 26.71B | 29.18B |
| Net Income Continuous Operations | 15.47B | 25.40B | 14.27B | 8.48B | 5.61B |
| Preferred Stock Dividends | 0.00 | 0.00 | 0.00 | 0.00 | 0.00 |
Source: Financial statements and regulatory filings
Balance Sheet
| fiscal_date | 2025-03-31 | 2024-03-31 | 2023-03-31 | 2022-03-31 | 2021-03-31 |
|---|---|---|---|---|---|
| Cash And Cash Equivalents | 8.86B | 9.12B | 8.36B | 8.71B | 9.71B |
| Accounts Receivable | 30.62B | 26.65B | 24.89B | 20.51B | 13.81B |
| Total Assets | 273.06B | 269.57B | 273.53B | 271.46B | 260.35B |
| Total Liabilities | 125.40B | 130.55B | 147.75B | 153.94B | 145.92B |
| Long Term Debt | 26.17B | 33.87B | 44.04B | 50.49B | 55.21B |
| Shareholders Equity | 147.66B | 139.02B | 125.78B | 117.52B | 114.43B |
Source: Financial statements and regulatory filings
Cash Flow Statement
| fiscal_date | 2025-03-31 | 2024-03-31 | 2023-03-31 | 2022-03-31 | 2021-03-31 |
|---|---|---|---|---|---|
| Operating Activities Net Income | 15.47B | 25.40B | 14.27B | 8.48B | 5.61B |
| Operating Activities Other Non Cash Items | 3.07B | 3.68B | 2.63B | 2.32B | 3.23B |
| Operating Activities Accounts Receivable | -3.31B | -1.74B | -3.67B | -3.19B | -4.50B |
| Operating Activities Other Assets Liabilities | -10.71B | 1.09B | -1.55B | -6.23B | 4.03B |
| Operating Activities Operating Cash Flow | 4.51B | 28.44B | 11.68B | 1.38B | 8.37B |
| Investing Activities Capital Expenditures | -7.31B | -6.74B | -7.63B | -18.16B | -11.56B |
| Investing Activities Purchase Of Investments | -63.32M | -715.55M | -32.70M | -3.69B | -12.55B |
| Investing Activities Sale Of Investments | 5.04B | 0.00 | 2.54B | 9.65B | N/A |
| Investing Activities Investing Cash Flow | -2.33B | -7.45B | -5.12B | -12.30B | -24.11B |
| Financing Activities Long Term Debt Payments | -10.79B | -13.66B | -9.06B | -21.85B | -3.02B |
| Financing Activities Short Term Debt Issuance | 5.57B | -2.46B | -3.42B | 5.76B | -10.98B |
| Financing Activities Common Dividends | -3.81B | -2.86B | -2.06B | -2.22B | N/A |
| Financing Activities Other Financing Charges | -4.17B | -4.76B | -4.79B | -4.02B | -3.41B |
| Financing Activities Financing Cash Flow | -13.20B | -23.73B | -14.34B | -8.12B | 4.17B |
| End Cash Position | 8.83B | 9.09B | 8.39B | 8.72B | 8.92B |
| Free Cash Flow | 10.55B | 27.09B | 13.60B | 3.07B | 12.57B |
| Financing Activities Long Term Debt Issuance | N/A | 0.00 | 5.00B | 14.21B | 10.78B |
| Investing Activities Net Acquisitions | N/A | N/A | N/A | -93.30M | 0.00 |
| Financing Activities Common Stock Issuance | N/A | N/A | N/A | 0.00 | 10.80B |
| Investing Activities Other Investing Activity | N/A | N/A | N/A | N/A | N/A |
Source: Financial statements and regulatory filings
Technical Analysis
Key Insights
- Apollo Tyres is currently in a consolidation phase with price action fluctuating near the 52-week low of INR 392, indicating a lack of strong upward momentum.
- Key support levels are observed around INR 390 and INR 375, while resistance is noted near the 50-day moving average at INR 420 and the 200-day moving average at INR 475.
- The stock is trading below its 50-day (INR 420) and 200-day (INR 475) moving averages, suggesting a bearish medium to long-term trend.
- Momentum indicators show RSI near 40, indicating mild oversold conditions; MACD is below the signal line, reflecting bearish momentum; Stochastic oscillators are in the lower range, signaling potential for a reversal but no confirmation yet.
- Daily and weekly charts confirm sideways to slightly bearish trends, while monthly charts suggest longer-term support around current price levels.
- Potential scenarios include a continued range-bound movement between INR 390 and INR 420 or a test of lower support if selling pressure intensifies; a break above the 50-day moving average could signal a shift in trend.
Trending News
1. Headline: Apollo Tyres Ltd stock (INE404A01024): earnings jump draws attention to margins and global demand
Summary: Apollo Tyres has reported a sharp year-on-year profit surge in its latest quarter, helped by higher revenue and margins. For US investors, the India-listed tire maker offers exposure to automotive demand in India and Europe but faces cost and competition pressures.
Sentiment: positive
2. Headline: Apollo Tyres Ltd stock (INE404A01024): earnings momentum and EV focus draw attention
Summary: Apollo Tyres has reported steady earnings growth and highlighted expansion in premium and EV-ready tires, while keeping an eye on costs and overseas markets. US investors watch the India-listed stock as a play on global auto and replacement tire demand.
Sentiment: positive
Summary: APL Apollo Share Price: Find the latest news on APL Apollo Stock Price. Get all the information on APL Apollo with historic price charts for NSE / BSE. Experts & Broker view also get the APL Apollo Ltd. buy/sell tips detailed news, announcements, Forecasts, Analysts, Valuation, Earning forecasts, ...
Sentiment: neutral
4. Headline: Apollo Tyres Q4 FY26: Revenue Up 14.2%, EBITDA Jumps 27.6% | Whalesbook Corporate News
Summary: Apollo Tyres reports Q4 FY26 revenue up 14.2% to INR 73,357 Mn and EBITDA up 27.6%. Strong sales drove results, with net debt cut by INR 9 Bn.
Sentiment: positive
5. Headline: Apollo Tyres Ltd Reports Strong Growth in Q4 FY26 Results | InvestyWise
Summary: Apollo Tyres has announced its financial results for Q4 FY26, reflecting significant growth. The company reported a consolidated…
Sentiment: positive
Recent Updates
News Summary
As of 2026-05-15. Apollo Tyres reported a significant 241.1% year-on-year increase in consolidated net profit for Q4 FY26, reaching Rs 631 crore, driven by strong sales and operational efficiencies. Revenue for the quarter rose 14.2% to INR 73,357 million, while EBITDA increased 27.6%, reflecting improved profitability. The company also reduced net debt by INR 9 billion, strengthening its financial position. For the full fiscal year 2025-2026, Apollo Tyres posted a 22.4% increase in consolidated net profit to Rs 1,372 crore and a 9% rise in annual revenue to $3.2 billion. These results underscore the company’s successful market strategies, cost management, and expansion efforts including new production plants in India and Mexico.
News Sentiment
The overall sentiment from recent updates is predominantly positive, driven by robust earnings growth, margin expansion, and effective debt reduction. The 241% surge in quarterly net profit and 27.6% jump in EBITDA highlight operational strength and market demand. However, neutral tones appear in some reports emphasizing cost pressures and competitive challenges in global markets. The balance of strong financial results and cautious commentary on external risks suggests a stable outlook with ongoing focus on profitability and strategic growth.
Source List
Analytical Overview
Analysis Summary
Apollo Tyres' valuation metrics, including a trailing P/E of 18.21 and forward P/E of 11.00, are lower than many industry peers, indicating relatively attractive pricing compared to the sector average P/E of 18.21. The PEG ratio of 0.46 suggests the stock may be undervalued relative to its earnings growth potential. Revenue growth of 11.8% quarterly and positive cash flow trends with levered free cash flow of INR 11.2 billion support a favorable growth trajectory. The company maintains a conservative debt profile with a debt-to-equity ratio of 0.29 and a current ratio of 1.26, reflecting sound financial health. Sector-specific challenges include competitive pressures and cost inflation, while opportunities arise from expanding EV tire demand and capacity expansions in India and Mexico. Considering India-specific factors, regulatory environment stability and growing automotive demand bolster the company’s market positioning.
Overall Business and Market Assessment
Supporting Factors: strong earnings growth with a 241% increase in quarterly net profit, improving margins, and effective debt reduction by INR 9 billion
Risk Factors: competitive intensity in global markets and cost pressures that could impact margins
SWOT Analysis
Strengths
- Apollo Tyres has a diversified product portfolio covering multiple vehicle segments.
- The company demonstrates strong cash flow generation and prudent debt management.
- Operational efficiencies have led to improved profit margins and earnings growth.
- Strategic expansions in India and Mexico enhance global market presence.
Weaknesses
- Profit margins remain modest relative to some industry peers.
- Stock trades below key moving averages indicating recent price weakness.
- Price to cash flow ratio is relatively high compared to competitors.
- Dependence on raw material costs exposes earnings to inflationary pressures.
Opportunities
- Growing demand for premium and electric vehicle tires offers new revenue streams.
- Capacity expansions can capture increased market share domestically and internationally.
- Increasing automotive production in emerging markets supports long-term growth.
- Focus on sustainable and environment-friendly products aligns with regulatory trends.
Threats
- Intense competition from global and local tire manufacturers may pressure pricing.
- Regulatory changes and trade policies could impact international operations.
- Volatility in raw material prices may affect cost structure and profitability.
- Economic slowdowns in key markets could reduce automotive demand.
Company Description
Apollo Tyres Ltd. is a prominent company in the tire manufacturing industry, known for producing a vast range of automotive tires that are used across various vehicle segments, including commercial vehicles, passenger cars, and two-wheelers. Established in India, the company has grown to become a significant player not only domestically but also in international markets through strategic expansions and acquisitions. Apollo Tyres operates through key brands such as Apollo and Vredestein, each catering to different market needs and customer bases. The company's tires are recognized for their durability, performance, and adaptability to diverse road conditions, making them a preferred choice among both consumers and automotive manufacturers. Within the financial markets, Apollo Tyres Ltd. represents a critical component of the industrial sector, particularly impacting transportation and manufacturing industries. Its innovative approach to design and sustainability initiatives, including the development of environment-friendly products, underscores its commitment to leading in tire technology and manufacturing excellence.