


Apollo Micro Systems Ltd (APOLLO)
Stock Analysis Report
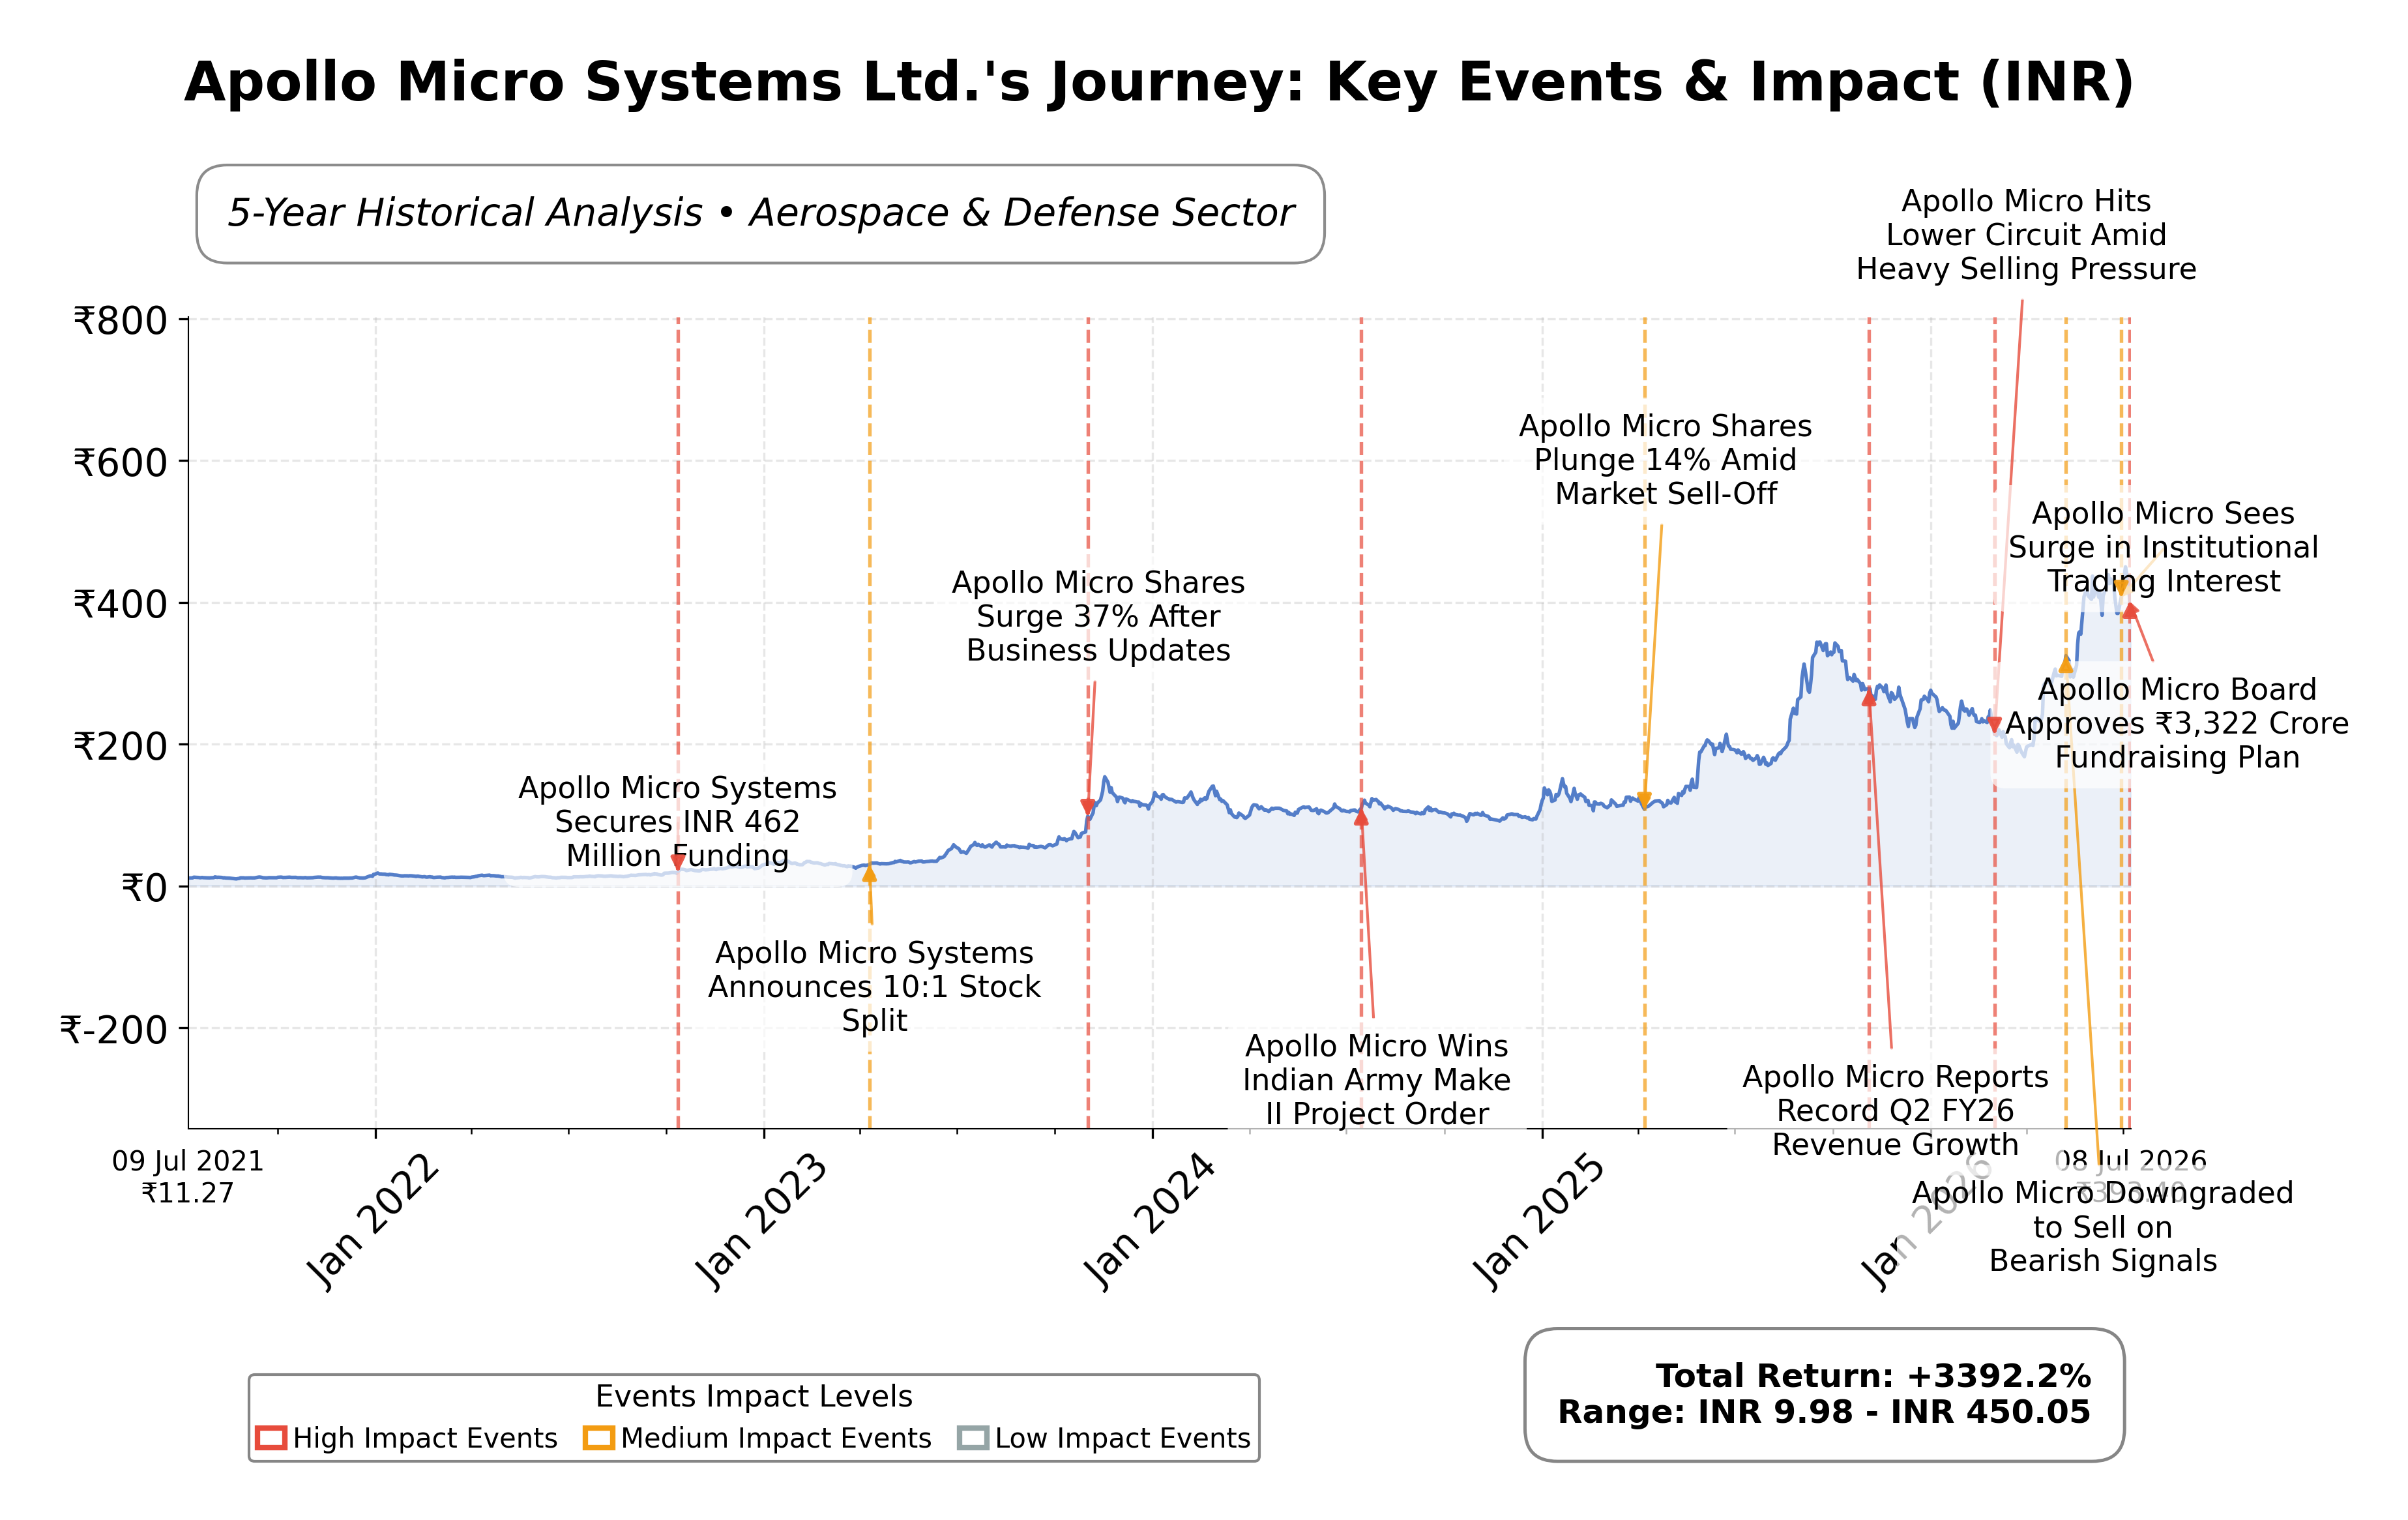
Stock Journey
Key Positives and Key Risks
Pros
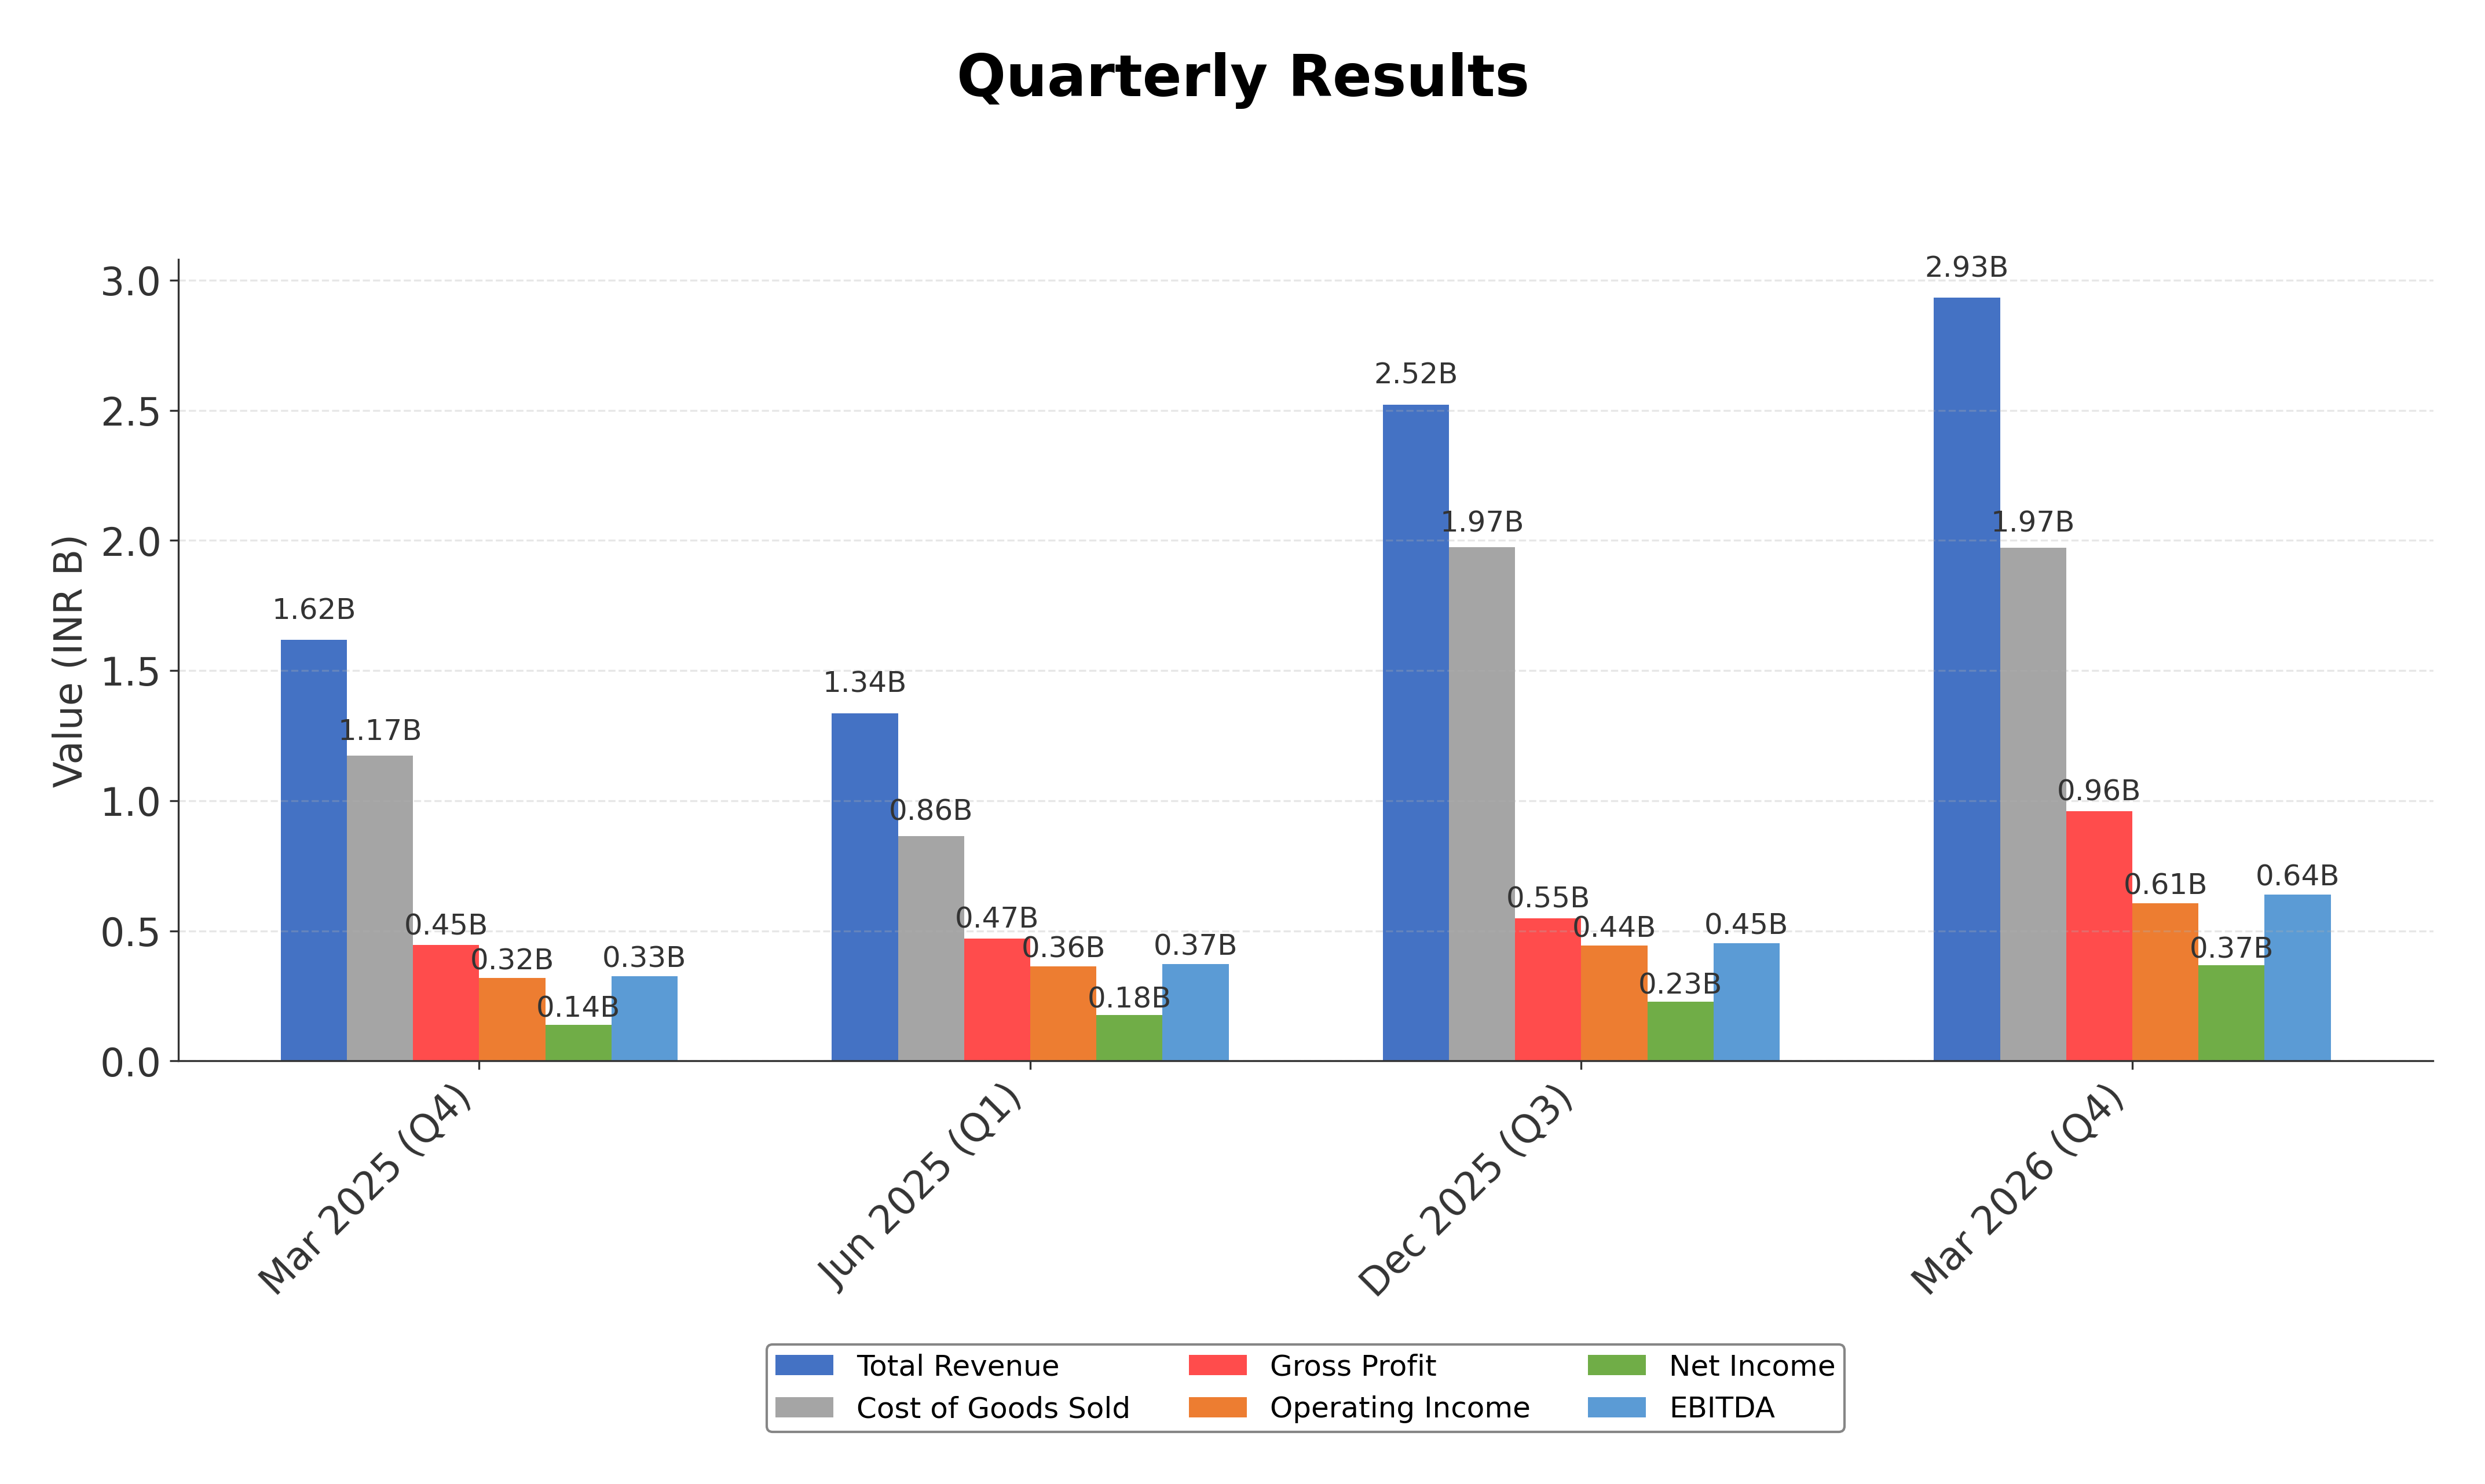
- Apollo Micro Systems exhibits strong revenue growth with quarterly growth of 81.3%, indicating robust top-line expansion.
- The company maintains a healthy current ratio of 1.91, reflecting adequate short-term liquidity to meet obligations.
- The recent preferential fund raise of Rs 3,322 crore strengthens the capital base to support growth and defense order opportunities.
Cons
- The stock trades at a high trailing P/E ratio of 127.82, suggesting premium valuation relative to earnings.
- Negative operating cash flow of INR -1.30 billion and free cash flow of INR -4.89 billion highlight cash generation challenges.
- Return on equity of 11.21% is moderate and below several industry peers, indicating room for improvement in profitability.
Disclosure: This information is for general awareness and does not constitute investment advice
Report Summary
Apollo Micro Systems Ltd. is a specialized technology company operating in the Aerospace & Defense sector, listed on the NSE in India. The company focuses on designing, developing, and manufacturing electronic and electromechanical solutions tailored for mission-critical applications in defense, aerospace, and space industries. It holds a strong market position supported by its extensive R&D capabilities and participation in over 150 indigenous programs and 60 Defence Cybersecurity Procurement Policy (DcPP) programs. Apollo Micro Systems is recognized for its contributions to national defense projects, including missile systems, naval systems, and satellite launch programs, making it a key player in India’s industrial sector.
Financially, Apollo reported trailing twelve months (TTM) revenue of approximately INR 9.04 billion with a gross margin of 32.75%, operating margin of 20.69%, and a net profit margin of 12.49%. The company’s return on equity (ROE) stands at 11.21%, and return on assets (ROA) at 6.67%, indicating moderate profitability and efficient asset utilization. However, the operating cash flow and free cash flow are negative, at INR -1.30 billion and INR -4.89 billion respectively, reflecting cash generation challenges despite profitability. The company’s current ratio of 1.91 suggests a healthy short-term liquidity position.
Valuation metrics show Apollo trading at a high trailing P/E ratio of 127.82 and a forward P/E of 53.16, with a price-to-book ratio of 10.55 and an enterprise value to EBITDA multiple of 65.25. The market capitalization is approximately INR 146.19 billion. The stock price currently trades near INR 392.40, within a 52-week range of INR 162.34 to INR 466.50, indicating significant price volatility and a recent strong upward trend. The PEG ratio of 1.57 suggests valuation relative to growth expectations is elevated compared to typical benchmarks.
Apollo’s strengths include its leadership in defense technology, strong R&D capabilities, and strategic involvement in key national projects. The company has manageable debt levels with a debt-to-equity ratio of 41.53%, and a current ratio indicating adequate liquidity. Key risks encompass regulatory and geopolitical uncertainties inherent in the defense sector, competitive pressures, and recent market reactions to a large preferential fund raise of INR 3,322 crore, which has caused share price volatility. The company’s strategic actions include this significant capital raise aimed at funding growth and upcoming defense order opportunities.
Technically, the stock exhibits a mixed trend with price action near key moving averages and momentum indicators showing neutral to bearish signals on some oscillators. The stock has experienced recent profit booking amid the fund raise announcement. Overall, the data suggests a cautious stance with conditions reflecting both growth potential and valuation risks, warranting close monitoring of operational and market developments.
Company and Industry Overview
Company Basics
Price Performance
Company Size
Shareholding Pattern
Sector and Industry Analysis
The aerospace and defence sector in India is a rapidly expanding market driven by increasing government expenditure and strategic focus on self-reliance. The market size has grown significantly, supported by rising defence budgets and modernization efforts, with projections indicating robust growth over the next decade. Key players include both public sector undertakings and private firms like Apollo Micro Systems, which specialize in mission-critical and technologically advanced defence solutions.
Industry trends highlight a shift towards indigenous technology development and increased private sector participation, propelled by initiatives such as Atmanirbhar Bharat. Competitive dynamics are shaped by the complexity of defence contracts, long product cycles, and the need for specialized capabilities, creating high barriers to entry. Companies that align closely with national priorities and demonstrate strong execution in production and innovation tend to secure a competitive advantage in this evolving landscape.
The regulatory environment is characterized by stringent government oversight, export controls, and policies aimed at fostering domestic manufacturing under the Defence Procurement Procedure and related frameworks. Recent reforms have eased foreign direct investment limits and encouraged technology transfers, enhancing the sector’s growth potential. Continued alignment with national security objectives and compliance with evolving defence standards remain critical for industry participants.
Note: Analysis synthesized from industry research, market reports, and regulatory filings. Information is subject to change based on market conditions.
Financial Ratios Dashboard
Illustrative Scenario Analysis
DCF Assumptions:
Method: Two-Stage EPS-Priority Model
Financials
Peer Analysis
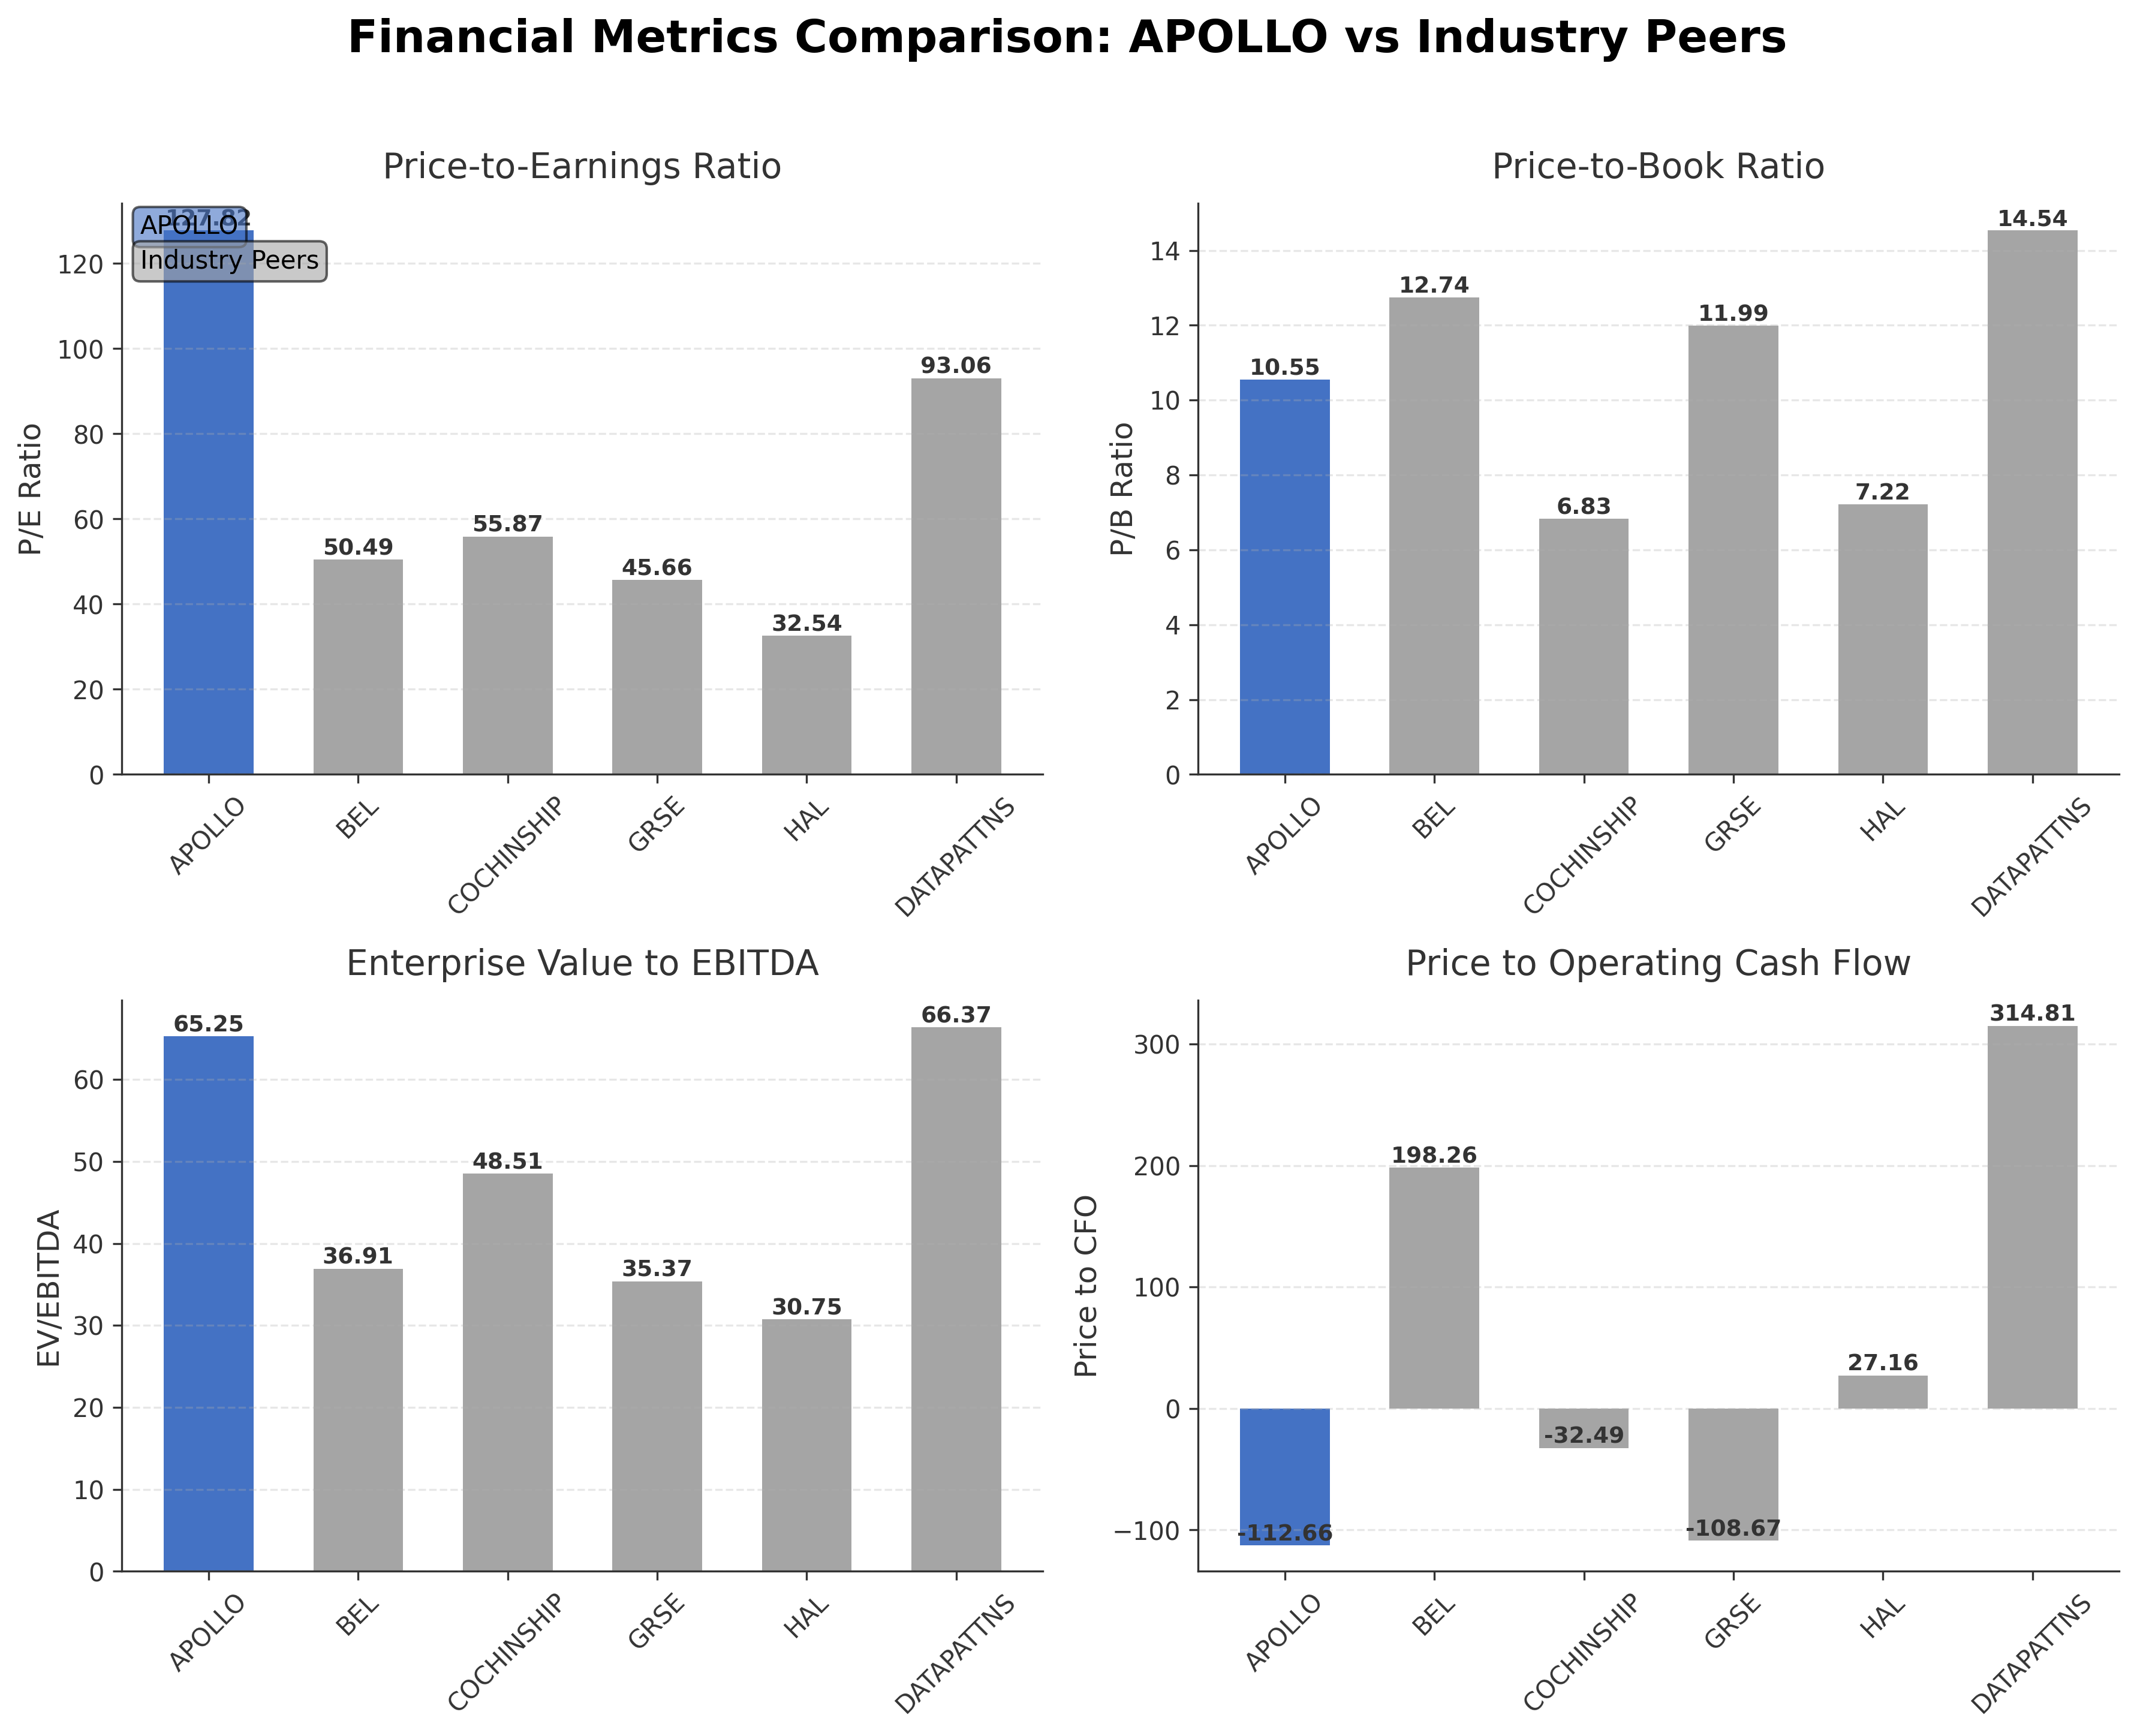
| Company Name | Market Cap | P/E Ratio | P/B Ratio | EV/EBITDA | Price to CFO |
|---|---|---|---|---|---|
| Apollo Micro Systems Ltd. | ₹146.19B | 127.82 | 10.55 | 65.25 | -112.66 |
| Bharat Electronics Limited | ₹3.06T | 50.49 | 12.74 | 36.91 | 198.26 |
| Cochin Shipyard Limited | ₹400.96B | 55.87 | 6.83 | 48.51 | -32.49 |
| Garden Reach Shipbuilders & Engineers Ltd. | ₹314.85B | 45.66 | 11.99 | 35.37 | -108.67 |
| Hindustan Aeronautics Ltd. | ₹2.96T | 32.54 | 7.22 | 30.75 | 27.16 |
| Data Patterns (India) Ltd. | ₹252.32B | 93.06 | 14.54 | 66.37 | 314.81 |
Comparison Analysis: Apollo Micro Systems Ltd. trades at significantly higher valuation multiples compared to its regional aerospace and defense peers, with a trailing P/E of 127.82 versus peer averages ranging from 32.54 to 93.06. Its price-to-book ratio of 10.55 is moderate relative to peers like Data Patterns at 14.54 but higher than Cochin Shipyard and HAL. The enterprise value to EBITDA multiple of 65.25 is elevated compared to peers, indicating a premium valuation. Apollo’s return on equity at 11.21% is lower than industry leaders such as Bharat Electronics and Garden Reach Shipbuilders, which report ROEs above 25%. Negative price to cash flow ratios reflect cash flow challenges relative to some peers with positive cash flow metrics. Overall, Apollo stands out for its high valuation and moderate profitability within the peer group.
Financial Metrics Comparison with Peers
Financial Statements
Comprehensive financial data including income, balance sheet, and cash flow metrics
Income Statement
| fiscal_date | 2026-03-31 | 2025-03-31 | 2024-03-31 | 2023-03-31 | 2022-03-31 |
|---|---|---|---|---|---|
| Sales | 9.04B | 5.62B | 3.72B | 2.98B | 2.43B |
| Cost Of Goods | 6.30B | 4.12B | 2.83B | 2.30B | 2.00B |
| Gross Profit | 2.75B | 1.50B | 884.04M | 680.10M | 433.17M |
| Operating Expense Other Operating Expenses | 415.95M | 141.28M | 67.43M | 66.23M | 66.47M |
| Operating Income | 1.96B | 1.14B | 727.42M | 539.86M | 366.70M |
| Non Operating Interest Expense | 473.24M | 342.16M | 148.42M | 120.24M | 171.78M |
| Pretax Income | 1.55B | 825.46M | 440.94M | 289.58M | 202.51M |
| Income Tax | 474.17M | 261.89M | 129.87M | 102.20M | 56.36M |
| Net Income | 1.07B | 563.58M | 311.07M | 187.38M | 146.15M |
| Eps Basic | 3.18 | 1.86 | 1.24 | 9.03 | 0.70 |
| Eps Diluted | 3.15 | 1.86 | 1.17 | 6.12 | 0.70 |
| Basic Shares Outstanding | 355.09M | 303.21M | 250.07M | 20.76M | 207.70M |
| Diluted Shares Outstanding | 355.09M | 303.21M | 250.07M | 20.76M | 207.70M |
| Ebit | 2.02B | 1.17B | 589.36M | 409.82M | 374.29M |
| Ebitda | 2.24B | 1.32B | 702.31M | 545.70M | 464.06M |
| Net Income Continuous Operations | 1.55B | 825.46M | 440.94M | 289.58M | 202.51M |
| Minority Interests | 55.40M | 387.00K | 128.00K | 127.00K | 31.00K |
| Preferred Stock Dividends | 0.00 | 0.00 | 0.00 | 0.00 | 0.00 |
| Operating Expense Research And Development | N/A | 9.30M | 4.30M | 10.10M | 1.34M |
| Operating Expense Selling General And Administrative | N/A | 46.36M | 48.53M | 30.75M | 12.62M |
| Non Operating Interest Income | N/A | 25.88M | 18.26M | 8.24M | 7.06M |
Data provided by Twelve Data
Balance Sheet
| fiscal_date | 2026-03-31 | 2025-03-31 | 2024-03-31 | 2023-03-31 | 2022-03-31 |
|---|---|---|---|---|---|
| Cash And Cash Equivalents | 895.03M | 402.70M | 1.97M | 2.49M | 3.43M |
| Accounts Receivable | 4.81B | 2.38B | 2.35B | 1.47B | 1.36B |
| Total Assets | 23.69B | 12.99B | 9.56B | 6.93B | 5.99B |
| Total Liabilities | 10.60B | 6.92B | 4.37B | 3.08B | 2.79B |
| Long Term Debt | 1.27B | 724.56M | 106.11M | 27.44M | 6.71M |
| Shareholders Equity | 13.08B | 6.08B | 5.19B | 3.84B | 3.20B |
Data provided by Twelve Data
Cash Flow Statement
| fiscal_date | 2026-03-31 | 2025-03-31 | 2024-03-31 | 2023-03-31 | 2022-03-31 |
|---|---|---|---|---|---|
| Operating Activities Net Income | 1.55B | 825.46M | 440.94M | 289.58M | 202.51M |
| Operating Activities Other Non Cash Items | 431.12M | 316.28M | 284.76M | 215.45M | 164.72M |
| Operating Activities Accounts Receivable | -2.03B | -30.58M | -958.71M | -107.49M | 330.47M |
| Operating Activities Other Assets Liabilities | -2.11B | -2.21B | -1.18B | -478.43M | -838.80M |
| Operating Activities Operating Cash Flow | -2.17B | -1.09B | -1.41B | -80.90M | -141.10M |
| Investing Activities Capital Expenditures | -2.28B | -922.15M | -539.93M | -334.14M | -223.92M |
| Investing Activities Investing Cash Flow | -2.28B | -922.15M | -539.93M | -334.14M | -250.04M |
| Financing Activities Long Term Debt Issuance | 100.00M | 787.04M | N/A | N/A | N/A |
| Financing Activities Long Term Debt Payments | -1.31B | -183.77M | N/A | N/A | N/A |
| Financing Activities Short Term Debt Issuance | 934.16M | 457.81M | N/A | N/A | N/A |
| Financing Activities Common Stock Issuance | 6.01B | 336.67M | 1.04B | 459.66M | 0.00 |
| Financing Activities Common Dividends | -83.38M | -15.32M | -5.82M | -5.19M | -5.19M |
| Financing Activities Financing Cash Flow | 5.65B | 1.38B | 1.04B | 454.46M | -5.19M |
| End Cash Position | 895.03M | 402.70M | 1.97M | 2.49M | 3.43M |
| Free Cash Flow | -3.57B | -819.79M | -1.32B | -497.03M | 205.70M |
| Financing Activities Other Financing Charges | N/A | 1.00K | N/A | -1.00K | N/A |
| Investing Activities Other Investing Activity | N/A | N/A | N/A | 1.00K | 1.00K |
| Investing Activities Purchase Of Investments | N/A | N/A | N/A | N/A | -26.12M |
Data provided by Twelve Data
Technical Analysis
Key Insights
- Apollo Micro Systems is currently exhibiting a mixed trend with price action fluctuating near the 20-day and 50-day moving averages, which are slightly bullish, while the 200-day moving average is bearish, indicating medium-term resistance around ₹399.
- Key support levels are observed near ₹320 and ₹350, with resistance near the recent high of ₹466.50 and intermediate resistance around ₹400.
- The stock price is currently above the 10-day, 20-day, and 50-day moving averages but below the 200-day moving average, suggesting short-term strength amid longer-term caution.
- Momentum indicators show a neutral RSI at 53.02, bearish momentum on MACD and Ultimate Oscillator, and mixed signals from stochastic oscillators, reflecting indecision among traders.
- Analysis across daily, weekly, and monthly timeframes reveals short-term bullishness tempered by medium-term bearish trends, with volume showing recent increases but some profit booking.
- Potential market scenarios include consolidation near current levels with possible retests of support, while a break above the 200-day moving average could signal renewed upward momentum.
Trending News
1. Headline: Apollo Sounds the Alarm: AI Profits Are a No-Show Outside Tech, and AI-Heavy ETFs Could Pay the Price - 24/7 Wall St.
Summary: AI industrial ubiquity has catapulted the Magnificent 7 stocks to trillion dollar valuations, but if the results beyond tech are far off, will investors sell?
Sentiment: positive
Summary: Apollo Micro Systems Ltd. ... Alakh Pandey Portfolio Stock Gains Rs 1,414 Crore In A Single Day as Share Price Jumps 10%; Records Second-Highest Rally Since January 22
Sentiment: negative
3. Headline: Defence Stock Alert: Apollo Micro Systems Board Approves Rs 3,322 Cr Fund Raise | Key Things To Know - Goodreturns
Summary: Defence Stock Alert: Apollo Micro Systems Board Approves Rs 3,322 Cr Fund Raise | Key Things To Know
Sentiment: positive
Summary: Apollo Micro Systems shares fell again today after the defence electronics company approved raising up to Rs 3,322 crore through a preferential issue of equity shares and convertible warrants. The move came after a recent rally in the stock driven by expectations of defence order opportunities.
Sentiment: negative
Summary: Apollo Hospitals stock hits record high following gains in DalalStreet. It has added 2% in the last 1 week, 6.5% in 1 month, 21% in 3 months, and 19% in 6 months. Meanwhile, it has given multibagger returns in thel ong term, soaring 138% in 5 years.
Sentiment: positive
Powered by Brave
Recent Updates
News Summary
As of 2026-07-08. Apollo Micro Systems Ltd. has approved a substantial capital raising plan amounting to Rs 3,322 crore through a preferential issue of equity shares and convertible warrants to strengthen its financial position and support growth initiatives in the defense sector. An Extraordinary General Meeting is scheduled to seek shareholder approval for increasing authorized capital and issuing shares to investors. The fund raise is a critical strategic move as the company prepares for upcoming defense order opportunities. Despite strong revenue growth and profitability, the company faces cash flow challenges with negative operating and free cash flow reported. The share price has experienced volatility, with declines following the fund raise announcement reflecting market concerns about dilution. Overall, the company continues to demonstrate operational growth and strategic capital management efforts amid evolving market conditions.
News Sentiment
The overall sentiment from recent updates is mixed, with positive tones surrounding the company's strategic capital raise aimed at funding growth and defense order readiness, contrasted by negative market reactions reflected in share price declines post-announcement. Positive sentiment is driven by the company's robust revenue growth and expanding order pipeline, while negative sentiment stems from investor concerns over dilution and cash flow challenges. Neutral commentary on quarterly results and financial statements further balance the outlook. This blend of sentiments underscores a transitional phase for the company, balancing growth ambitions with capital structure adjustments.
Source List
- https://www.goodreturns.in/news/defence-stock-alert-apollo-micro-systems-board-approves-rs-3-322-cr-fund-raise-key-things-to-know-1520515.html
- https://www.livemint.com/market/stock-market-news/multibagger-defence-stock-apollo-micro-systems-declares-rs-951-crore-fund-raise-via-preferential-shares-11783395456328.html
Analytical Overview
Analysis Summary
Apollo Micro Systems’ valuation metrics, including a trailing P/E of 127.82 and forward P/E of 53.16, are significantly higher than the industry average P/E of approximately 62.23, indicating a premium valuation relative to peers. The company’s revenue growth rate of 81.3% quarter-over-quarter and strong profit margin of 12.49% demonstrate a robust growth trajectory, although negative operating and free cash flows highlight liquidity challenges. Financial health shows a debt-to-equity ratio of 41.53%, which is moderate, and a current ratio near 1.91, suggesting reasonable short-term solvency. Sector-specific challenges include regulatory scrutiny and competitive pressures in the defense industry, while opportunities arise from increasing government defense spending and indigenous program participation. Considering India-specific factors, Apollo benefits from government initiatives promoting domestic defense manufacturing and increasing budget allocations, which support its strategic positioning.
Overall Business and Market Assessment
Supporting Factors: No data
Risk Factors: No data
SWOT Analysis
Strengths
- Apollo Micro Systems has strong expertise in mission-critical defense and aerospace technology solutions.
- The company maintains a robust R&D capability driving innovation and product development.
- Participation in over 150 indigenous and 60 DcPP defense programs enhances market positioning.
- Healthy current ratio of 1.91 indicates good short-term liquidity.
Weaknesses
- High trailing P/E ratio of 127.82 suggests the stock is trading at a premium valuation.
- Negative operating and free cash flows indicate cash generation challenges.
- Moderate return on equity of 11.21% is lower than some industry peers.
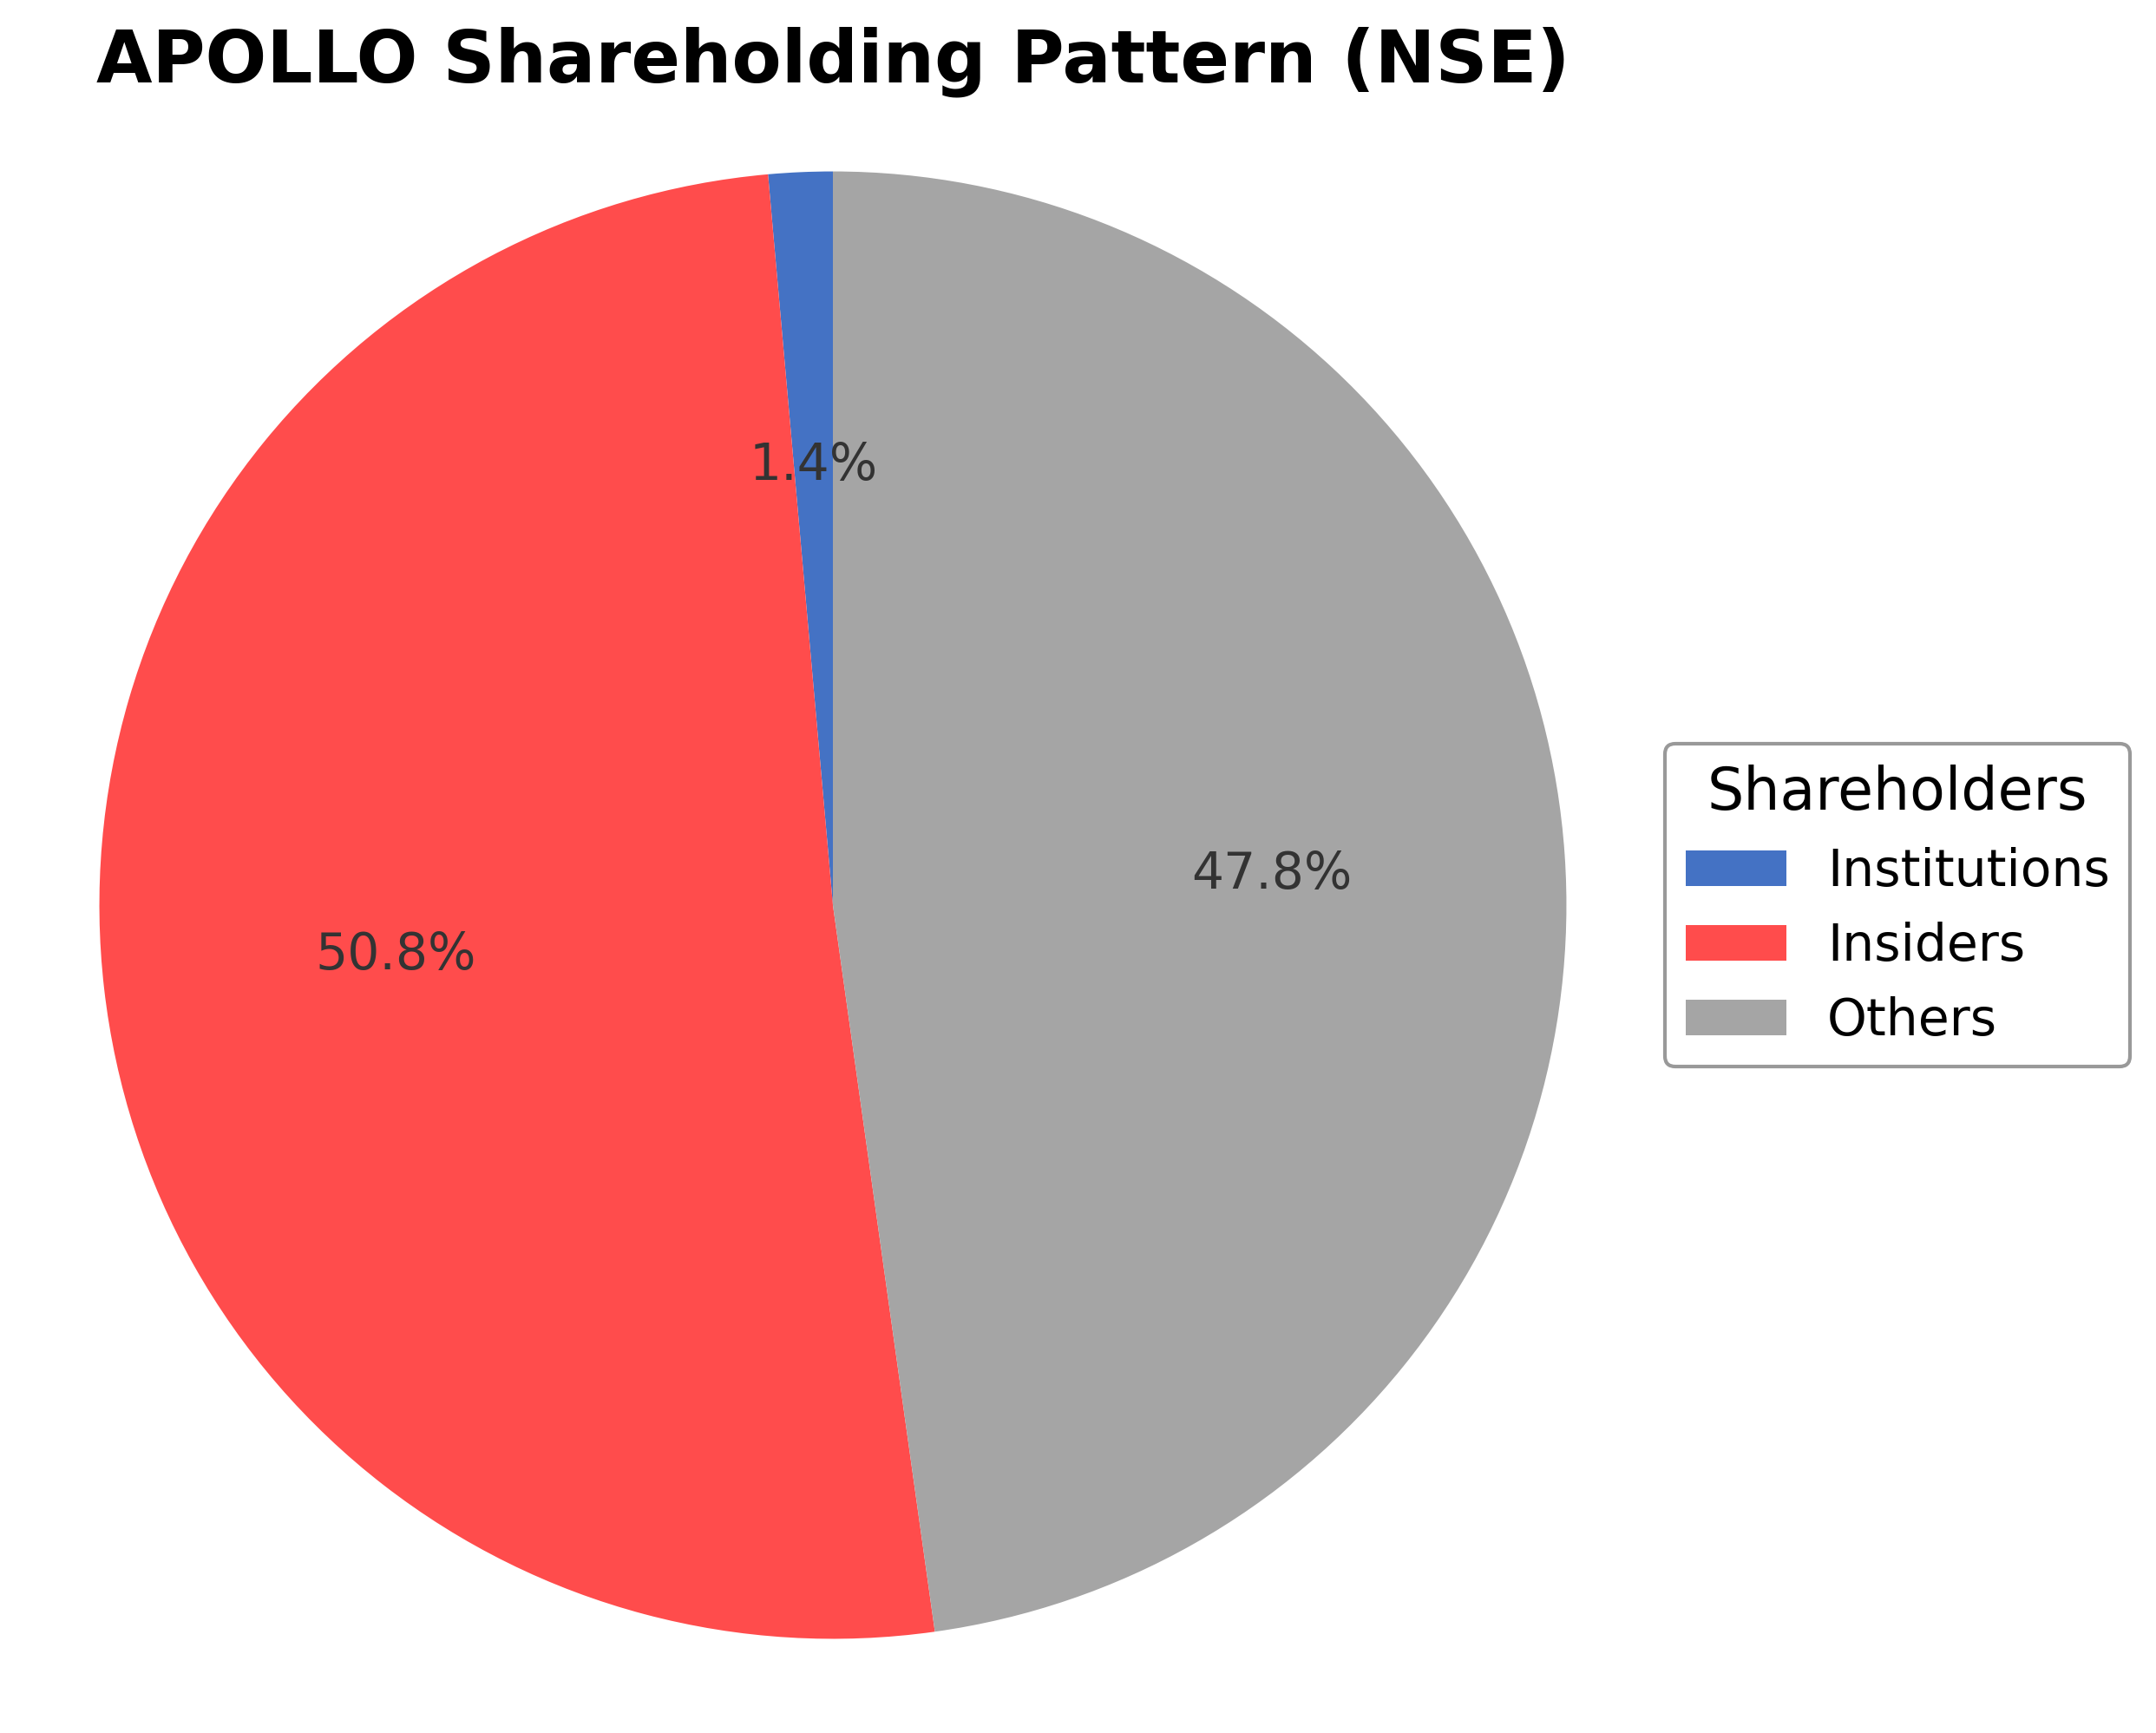
- Promoter holding has slightly decreased recently, with limited institutional investor presence.
Opportunities
- Increasing government defense spending and indigenous manufacturing initiatives support growth.
- Upcoming defense order opportunities could drive revenue expansion.
- Capital raise of Rs 3,322 crore provides funds for strategic investments and scaling operations.
- Growing demand for advanced electronic and electromechanical defense systems.
Threats
- Regulatory and geopolitical risks inherent in the defense sector may impact operations.
- Market volatility and investor concerns over dilution from recent fund raise.
- Competitive pressures from larger and more diversified defense companies.
- Cash flow constraints could limit operational flexibility.
Company Description
Apollo Micro Systems Ltd. is a prominent company specializing in designing, developing, and manufacturing electronic products and solutions in India. The primary function of the company is to cater to the needs of aerospace, defense, and space sectors with advanced technology solutions. Apollo Micro Systems Ltd. is recognized for its expertise in offering custom-built hardware and software solutions that include mission-critical and safety-critical applications, contributing significantly to national defense capabilities. The company's notable features include its strong Research and Development wing, which drives innovation and ensures the delivery of sophisticated automation, data acquisition, and control systems. Apollo Micro Systems Ltd. plays a crucial role in the Indian market by supporting key national projects and contributing to homeland security and satellite launch programs. Its collaborations with various defense organizations underscore its importance in enhancing the efficiency and performance of defense equipment, solidifying its position as a leader in the technology space within the aerospace and defense industries.