


Anjani Portland Cement Ltd (APCL)
Stock Analysis Report
Stock Journey
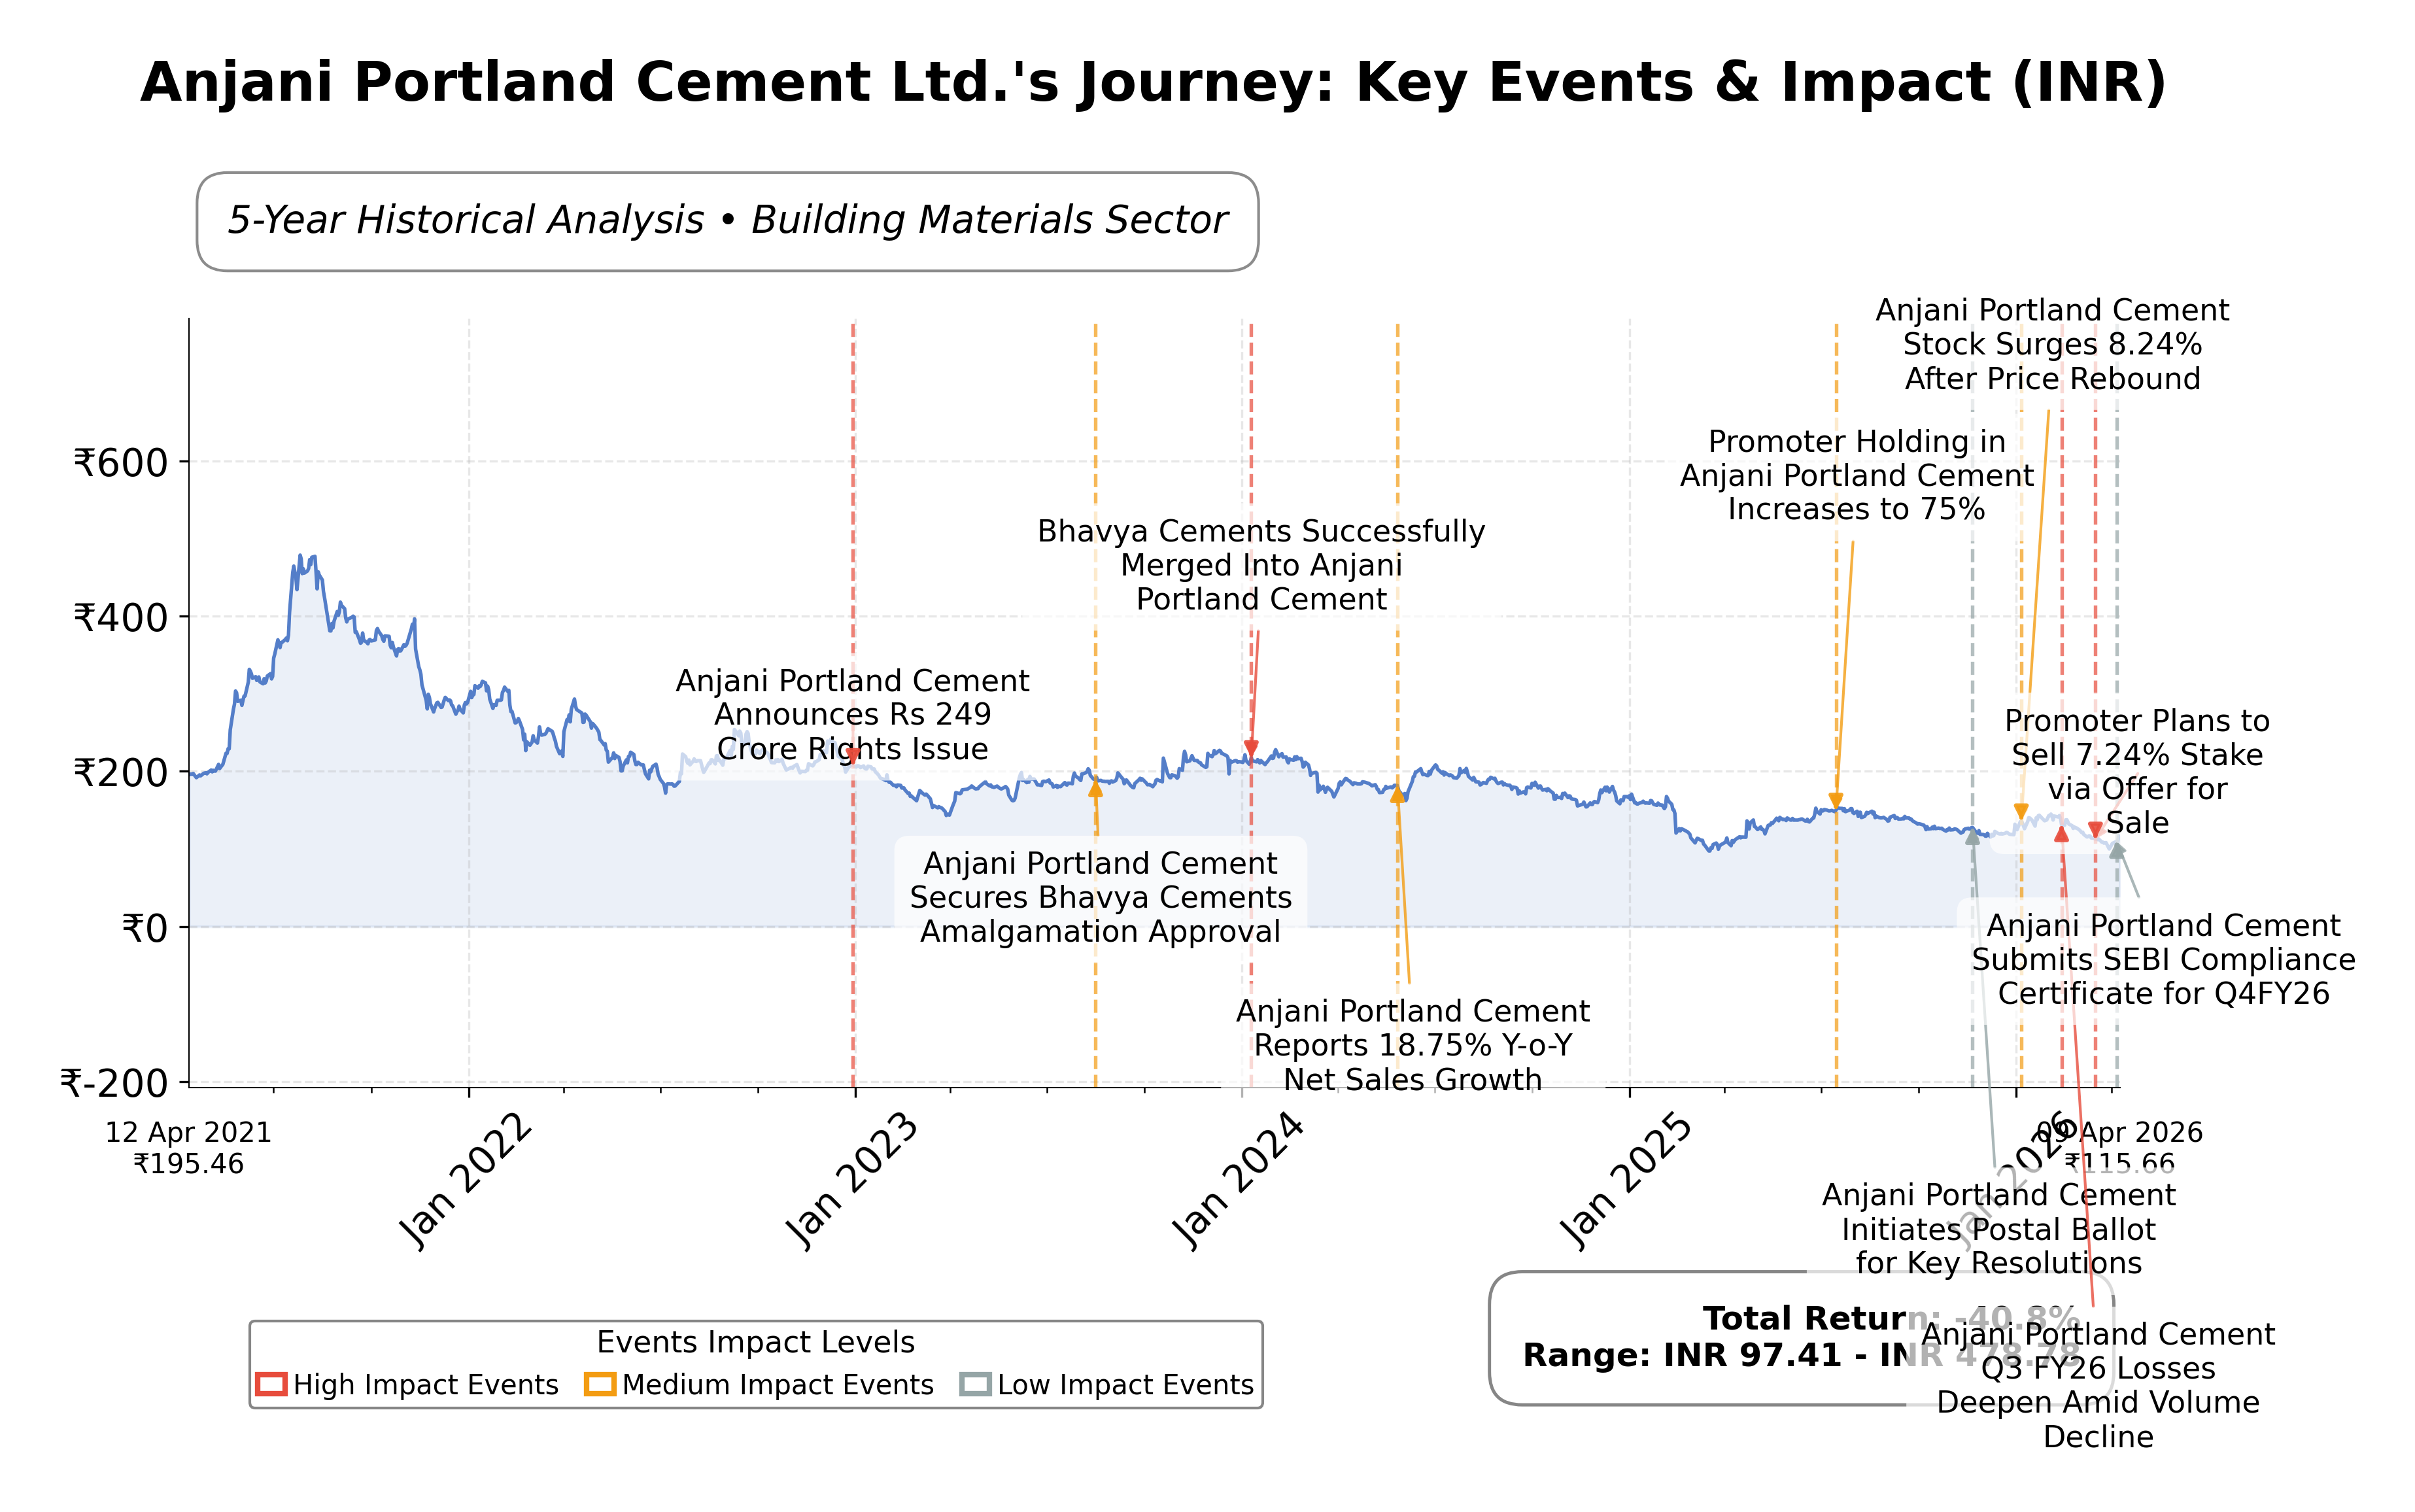
Key Positives and Key Risks
Pros
- Gross margin of 77.37% indicates efficient production processes supporting revenue generation.
- Established market presence with a recognized brand in the Indian cement industry.
- Regulatory compliance and shareholder engagement initiatives demonstrate governance discipline.
Cons
- Negative net profit margin of -8.7% and return on equity of -37.41% reflect ongoing profitability challenges.
- High debt-to-equity ratio of 223.15 signals significant financial leverage and associated risks.
- Negative operating cash flow of INR -478.4 million and free cash flow of INR -808.2 million indicate liquidity constraints.
Disclosure: This information is for general awareness and does not constitute investment advice
Report Summary
Anjani Portland Cement Ltd. (APCL) operates in the building materials industry in India, specializing in the production and sale of ordinary Portland cement. The company caters to diverse construction sectors including residential, commercial, infrastructure, and government projects. Positioned as a reliable supplier with a focus on quality and efficient distribution, APCL plays a significant role in supporting India's urbanization and infrastructure development initiatives.
Financially, APCL reported a trailing twelve months (TTM) revenue of approximately INR 4.7 billion with a gross margin of 77.37%. However, the company is currently experiencing negative profitability metrics, including a net profit margin of -8.7% and a return on equity (ROE) of -37.41%. Its trailing price-to-earnings (P/E) ratio is negative at -4.13, reflecting losses, while the price-to-book (P/B) ratio stands at 1.66. The enterprise value to EBITDA ratio is notably high at 42.72, and the company exhibits a high debt-to-equity ratio of 223.15, indicating significant leverage.
Technically, APCLâs stock price is trading below its 200-day moving average (INR 131.91) and near the 50-day moving average (INR 123.79), with a beta of 0.365 suggesting lower volatility relative to the market. Recent strategic initiatives include compliance with SEBI regulations and shareholder engagement campaigns such as the 'Saksham Niveshak' for unclaimed dividends. Key risks include ongoing negative earnings, high leverage, and cash flow deficits, while strengths lie in its established market presence and product quality.
In comparison to regional peers within the Indian cement industry, APCLâs market capitalization of INR 3.40 billion is substantially smaller than major players like Ultratech Cement Ltd. (INR 3.12 trillion) and JK Cement Ltd. (INR 399.52 billion). APCLâs valuation multiples such as P/E and EV/EBITDA are less favorable, with peers showing positive earnings and more efficient cash flow metrics. Return on equity for APCL is negative, whereas peers maintain marginally positive or near-neutral ROE figures, reflecting relative operational challenges.
Anjani Portland Cement Ltd. navigates a competitive and capital-intensive industry marked by cyclical demand and pricing pressures. Recent achievements include regulatory compliance and shareholder outreach, yet the company faces challenges from negative profitability and high debt levels. The stakes involve balancing operational turnaround efforts with market expectations amid sector growth. Current data suggests a cautious stance may be appropriate for those monitoring the stock, emphasizing observation of financial recovery and market developments without explicit positioning.
Company and Industry Overview
Company Basics
Price Performance
Company Size
Shareholding Pattern
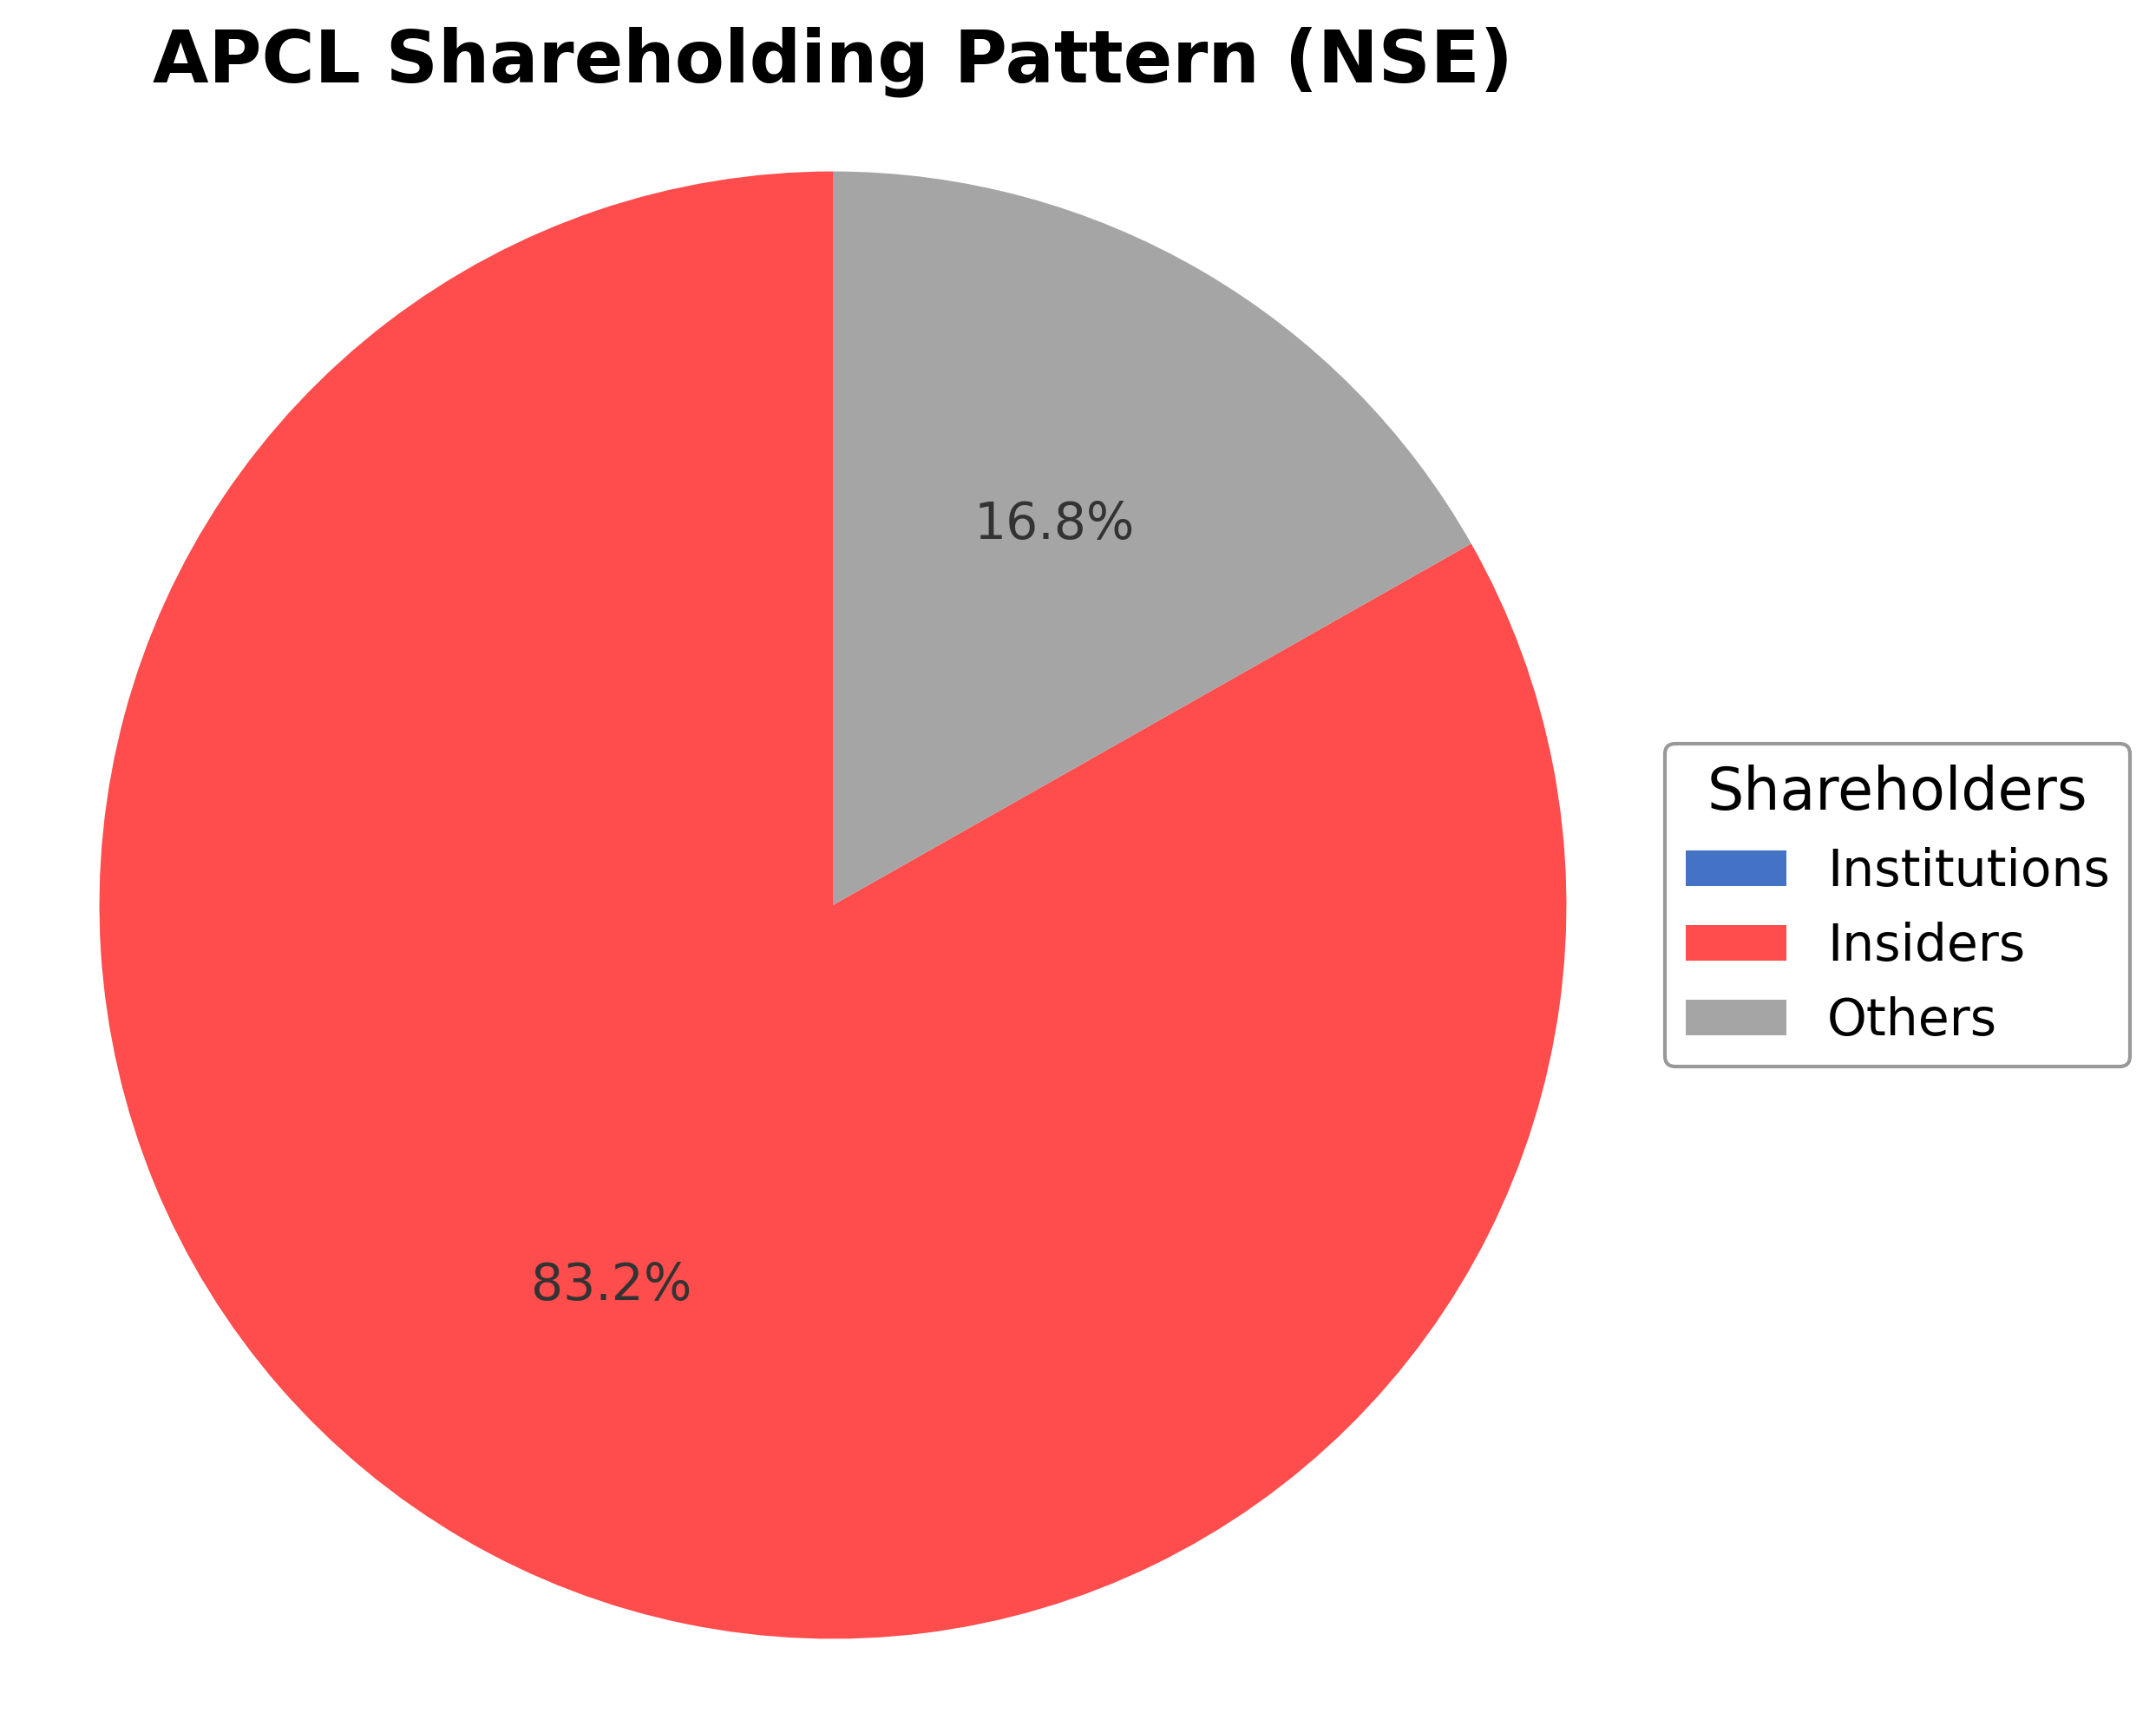
Anjani Portland Cement Ltd.'s shareholding structure is predominantly held by public shareholders at approximately 99.17%, with insiders including executives and board members holding about 0.83%. Institutional investor participation is currently absent, indicating limited institutional accumulation or distribution activity in recent periods. This ownership pattern suggests a dispersed shareholder base with minimal concentrated control, which may influence governance dynamics and strategic decision-making. The lack of significant institutional holdings could reflect market sentiment characterized by cautious engagement, potentially impacting the company's ability to leverage institutional support for future corporate actions.
Sector and Industry Analysis
Anjani Portland Cement Ltd. (APCL) operates within the broader Materials sector, specifically the cement industry, which is a critical component of the construction and infrastructure ecosystem. The global cement market is substantial, valued at several hundred billion USD, with growth driven primarily by urbanization, infrastructure development, and industrialization in emerging economies. India, where APCL is based, represents one of the fastest-growing cement markets globally due to government initiatives such as “Housing for All” and large-scale infrastructure projects. Key players in the Indian cement industry include UltraTech Cement, ACC Ltd, Ambuja Cements, and Shree Cement, alongside regional players like APCL, which compete on capacity, cost efficiency, and distribution reach.
Industry trends in cement manufacturing are increasingly shaped by technological advancements and sustainability imperatives. The sector is witnessing a gradual shift toward the adoption of alternative fuels, waste heat recovery systems, and digitalization of operations to enhance efficiency and reduce carbon footprints. Consumer behavior is indirectly influenced by the demand for green building materials and certifications, prompting manufacturers to innovate in low-carbon cement products. Emerging opportunities lie in blended cements, use of supplementary cementitious materials, and expansion into rural and semi-urban markets where infrastructure development is accelerating. Additionally, the integration of Industry 4.0 technologies for predictive maintenance and supply chain optimization is gaining traction.
The regulatory landscape for the cement industry is complex and increasingly stringent, primarily driven by environmental and safety compliance requirements. Key regulations include emissions standards under the Environment Protection Act, mandates on clinker factor reduction, and adherence to the Bureau of Indian Standards (BIS) for product quality. The government’s focus on reducing carbon emissions has led to policies incentivizing the use of alternative raw materials and fuels, alongside stricter monitoring of particulate matter and greenhouse gas emissions. Compliance with these regulations necessitates capital investment in cleaner technologies and can impact operational costs, but also creates barriers that protect incumbents with established capabilities.
Competitive dynamics in the cement industry are characterized by moderate to high entry barriers due to capital intensity, economies of scale, and regulatory compliance costs. The market structure is oligopolistic with a few large players dominating national markets, while smaller regional companies compete on niche segments or geographic focus. Cost leadership, distribution network strength, and product quality are critical competitive factors. APCL, as a regional player, competes by leveraging local market knowledge and operational efficiencies. The industry’s capital-intensive nature and the need for continuous technological upgrades limit new entrants, while consolidation trends persist as companies seek to enhance scale and geographic reach. Overall, the sector remains competitive but favors established firms with robust balance sheets and strategic adaptability.
Note: Analysis synthesized from industry research, market reports, and regulatory filings. Information is subject to change based on market conditions.
Illustrative Scenario Analysis
DCF Assumptions:
Method: Two-Stage EPS-Priority Model
Financials
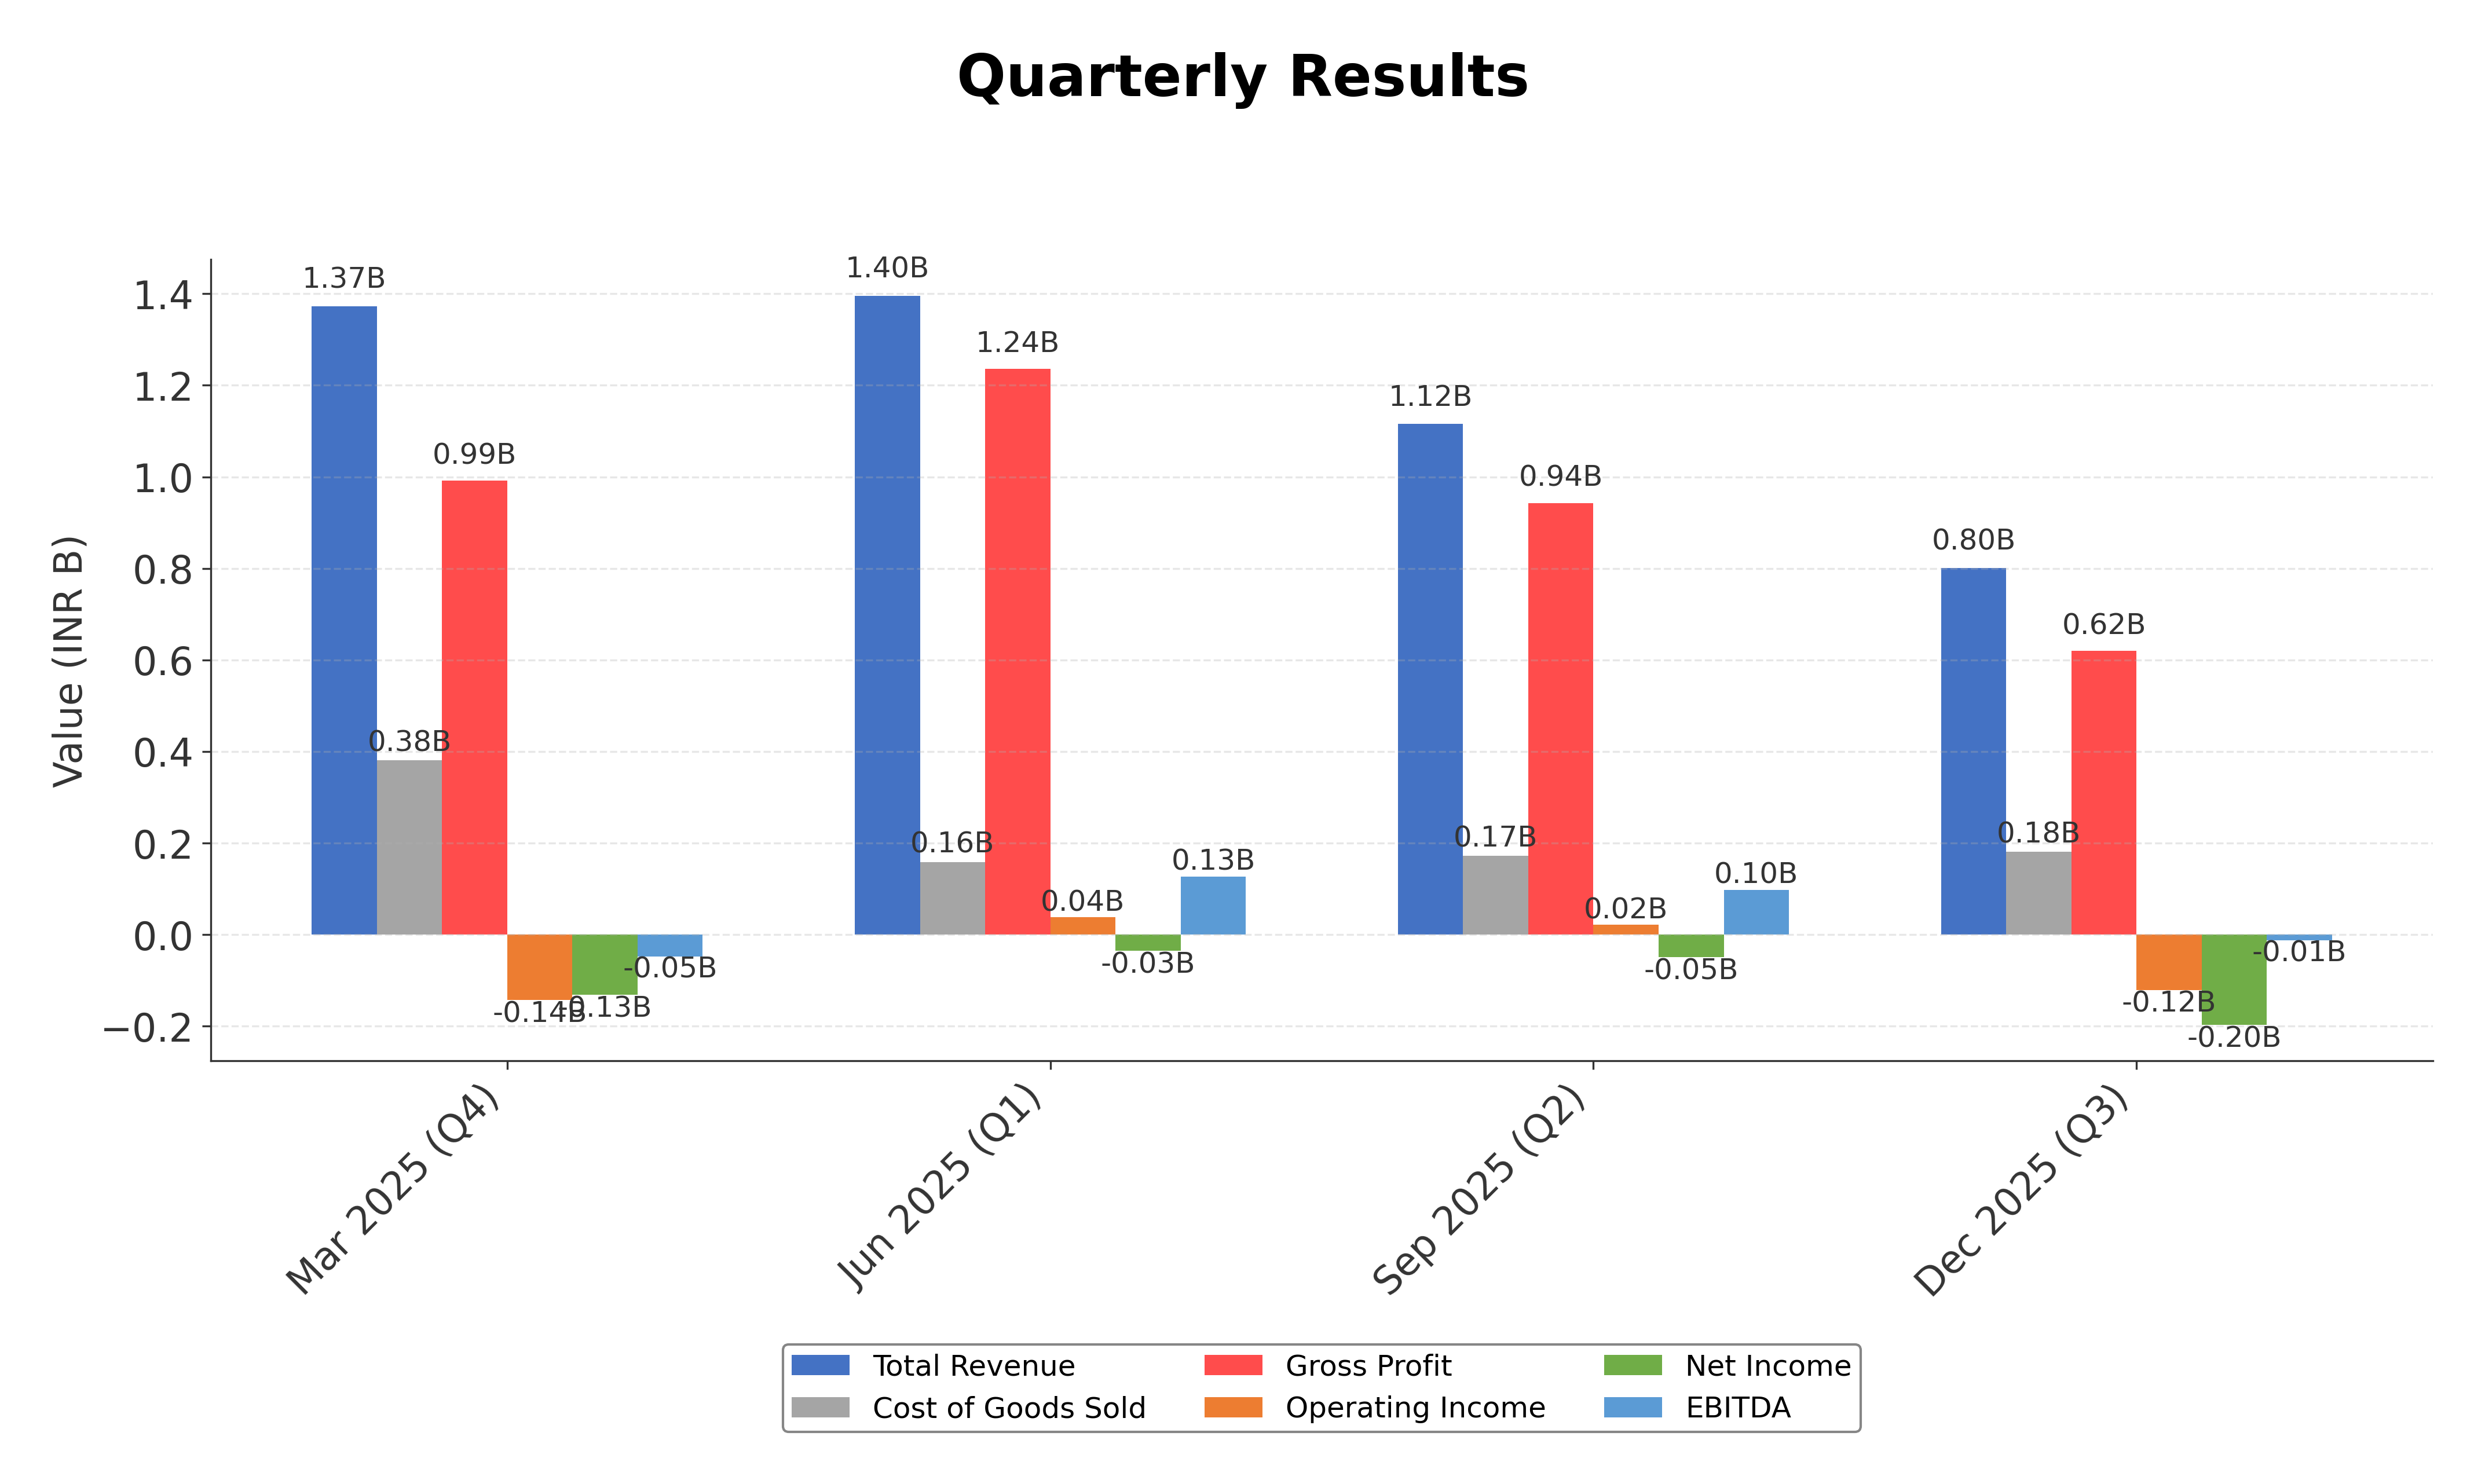
Peer Analysis
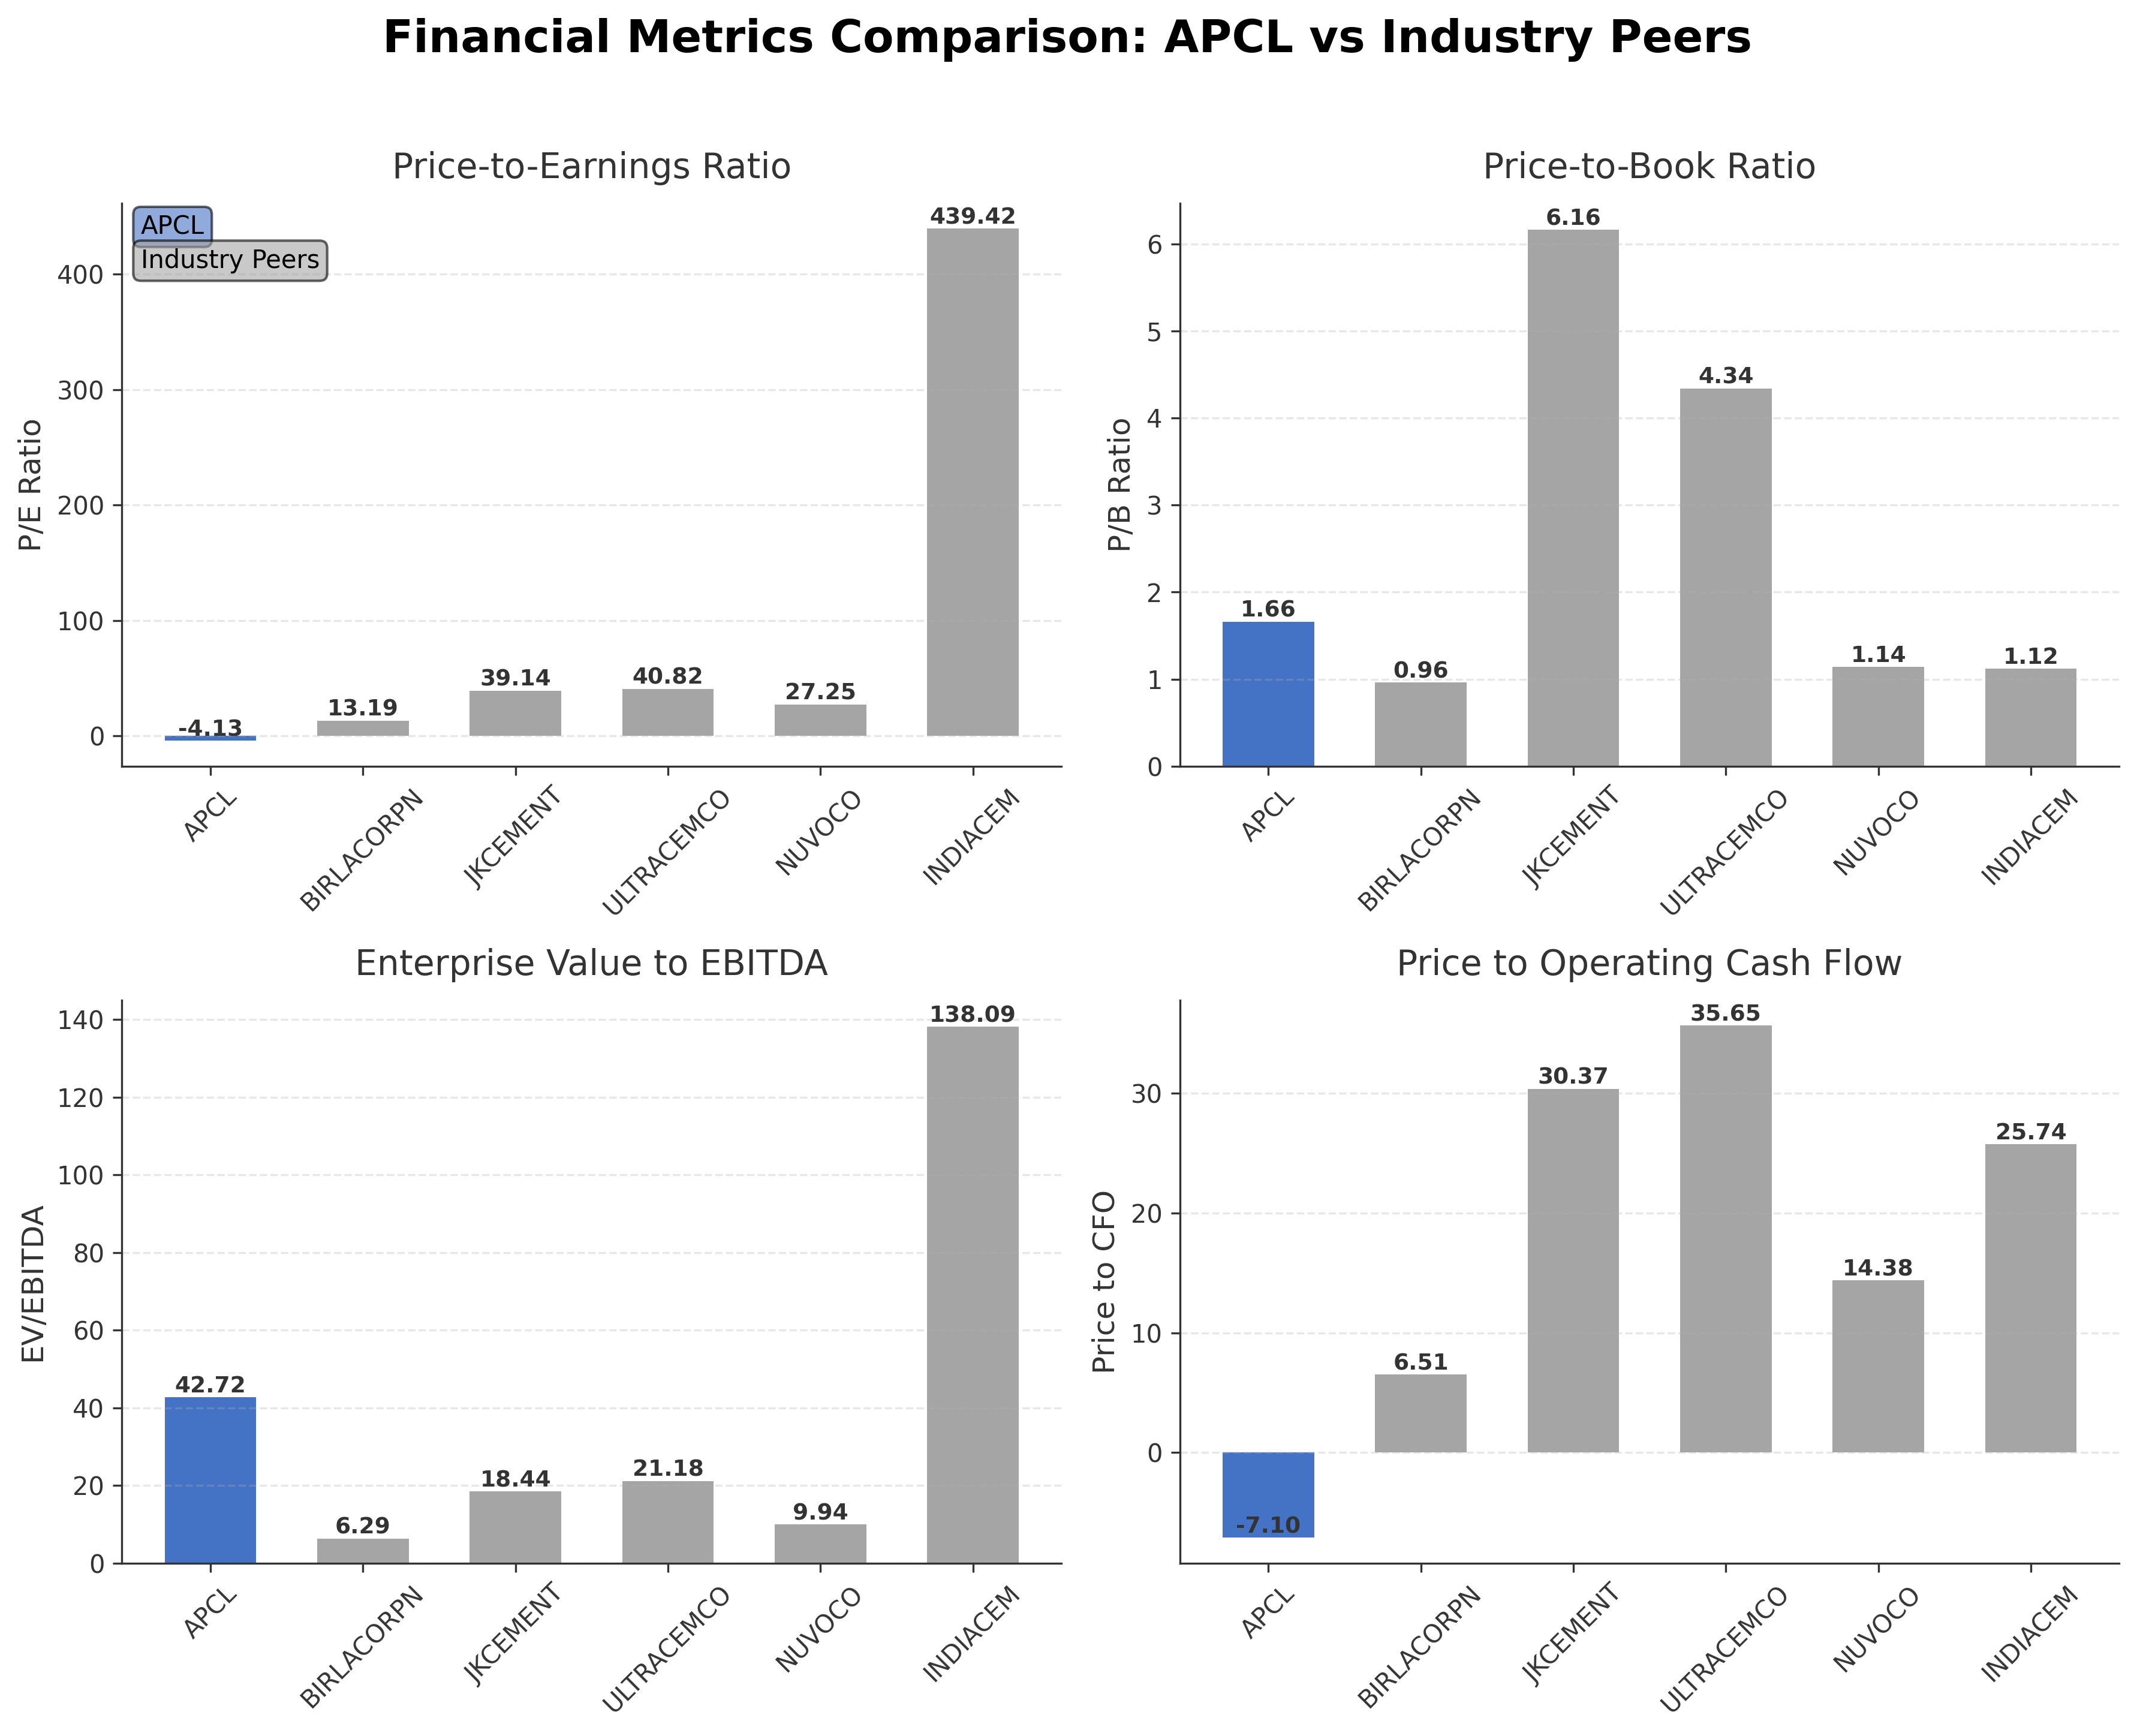
| Company Name | Market Cap | P/E Ratio | P/B Ratio | EV/EBITDA | Price to CFO |
|---|---|---|---|---|---|
| Anjani Portland Cement Ltd. | ₹3.40B | -4.13 | 1.66 | 42.72 | -7.10 |
| Birla Corporation Ltd. | ₹68.56B | 13.19 | 0.96 | 6.29 | 6.51 |
| JK Cement Ltd. | ₹399.52B | 39.14 | 6.16 | 18.44 | 30.37 |
| Ultratech Cement Ltd. | ₹3.12T | 40.82 | 4.34 | 21.18 | 35.65 |
| Nuvoco Vistas Corporation Ltd. | ₹104.69B | 27.25 | 1.14 | 9.94 | 14.38 |
| India Cements Ltd. | ₹166.86B | 439.42 | 1.12 | 138.09 | 25.74 |
Comparison Analysis: Anjani Portland Cement Ltd. exhibits a significantly smaller market capitalization compared to its Indian cement industry peers, with a market cap of ₹3.40 billion versus peers ranging from ₹68.56 billion to ₹3.12 trillion. The company’s negative P/E ratio contrasts with positive earnings multiples among peers, indicating current unprofitability. APCL’s EV/EBITDA ratio of 42.72 is notably higher than peer averages, suggesting less operational efficiency or higher valuation relative to earnings before interest, taxes, depreciation, and amortization. Its price-to-cash-flow ratio is negative, whereas peers maintain positive values, reflecting cash flow challenges. Return on equity for APCL is negative, while peers report marginally positive or neutral ROE, highlighting relative financial performance weaknesses.
Financial Metrics Comparison with Peers
Financial Statements
Comprehensive financial data including income, balance sheet, and cash flow metrics
Income Statement
| fiscal_date | 2025-03-31 | 2024-03-31 | 2023-03-31 | 2022-03-31 | 2021-03-31 |
|---|---|---|---|---|---|
| Sales | 4.28B | 6.23B | 6.61B | 7.98B | 4.06B |
| Cost Of Goods | 935.70M | 1.04B | 1.18B | 1.43B | 777.00M |
| Gross Profit | 3.35B | 5.19B | 5.43B | 6.54B | 3.28B |
| Operating Expense Selling General And Administrative | 1.04B | 1.16B | 1.16B | 1.49B | 847.50M |
| Operating Expense Other Operating Expenses | 2.10B | 3.33B | 3.62B | 3.25B | 1.03B |
| Operating Income | -633.60M | -192.10M | -317.60M | 869.90M | 998.80M |
| Non Operating Interest Income | 6.40M | 900.00K | 21.70M | 21.10M | 64.70M |
| Non Operating Interest Expense | 332.10M | 319.00M | 341.70M | 299.30M | 6.50M |
| Pretax Income | -969.70M | -503.80M | -641.40M | 587.70M | 1.02B |
| Income Tax | -157.50M | -110.60M | -56.40M | 167.80M | 165.40M |
| Net Income | -812.20M | -393.20M | -585.00M | 419.90M | 849.80M |
| Eps Basic | -27.51 | -13.30 | -22.35 | 16.38 | 31.57 |
| Eps Diluted | -27.51 | -13.30 | -22.35 | 16.38 | 31.57 |
| Basic Shares Outstanding | 29.37M | 29.37M | 26.01M | 25.29M | 26.92M |
| Diluted Shares Outstanding | 29.37M | 29.37M | 26.01M | 25.29M | 26.92M |
| Ebit | -637.60M | -184.80M | -299.70M | 887.00M | 1.02B |
| Ebitda | -174.00M | 295.60M | 239.60M | 1.48B | 1.27B |
| Net Income Continuous Operations | -969.70M | -503.80M | -641.40M | 587.70M | 1.02B |
| Minority Interests | 4.00M | 2.50M | 3.60M | -5.70M | N/A |
| Preferred Stock Dividends | 0.00 | 0.00 | 0.00 | 0.00 | 0.00 |
Data provided by Twelve Data
Balance Sheet
| fiscal_date | 2025-03-31 | 2024-03-31 | 2023-03-31 | 2022-03-31 | 2021-03-31 |
|---|---|---|---|---|---|
| Cash And Cash Equivalents | 2.90M | 24.50M | 2.90M | 119.20M | 87.90M |
| Accounts Receivable | 250.90M | 412.90M | 418.00M | 625.60M | 158.00M |
| Total Assets | 9.43B | 10.01B | 10.41B | 11.17B | 4.66B |
| Total Liabilities | 7.27B | 7.04B | 7.04B | 7.95B | 1.20B |
| Long Term Debt | 4.22B | 4.08B | 3.78B | 3.78B | 20.90M |
| Shareholders Equity | 2.16B | 2.97B | 3.37B | 3.22B | 3.46B |
Data provided by Twelve Data
Cash Flow Statement
| fiscal_date | 2025-03-31 | 2024-03-31 | 2023-03-31 | 2022-03-31 | 2021-03-31 |
|---|---|---|---|---|---|
| Operating Activities Net Income | -969.70M | -503.80M | -641.40M | 587.70M | 1.02B |
| Operating Activities Other Non Cash Items | 324.30M | 322.10M | 323.10M | 278.20M | 4.20M |
| Operating Activities Accounts Receivable | 151.00M | 13.60M | 191.60M | -220.90M | 269.80M |
| Operating Activities Other Assets Liabilities | 16.00M | 190.50M | -144.60M | 118.60M | 147.60M |
| Operating Activities Operating Cash Flow | -478.40M | 22.40M | -271.30M | 763.60M | 1.44B |
| Investing Activities Capital Expenditures | -140.90M | -149.40M | -138.10M | -64.20M | -37.20M |
| Investing Activities Other Investing Activity | -6.80M | 24.10M | -11.50M | 1.40M | 7.20M |
| Investing Activities Investing Cash Flow | -147.70M | -124.60M | -141.90M | -11.99B | -1.18B |
| Financing Activities Short Term Debt Issuance | 214.40M | -391.90M | -247.70M | 1.07B | N/A |
| Financing Activities Financing Cash Flow | 214.40M | -391.90M | 107.70M | 450.40M | -124.40M |
| End Cash Position | 2.90M | 24.50M | 2.90M | 119.20M | 93.20M |
| Free Cash Flow | -44.40M | 376.30M | 66.40M | 915.10M | 1.34B |
| Investing Activities Purchase Of Investments | N/A | 0.00 | -900.00K | -6.87B | -1.15B |
| Investing Activities Sale Of Investments | N/A | 700.00K | 8.60M | 1.80B | N/A |
| Financing Activities Common Stock Issuance | N/A | 0.00 | 201.30M | 0.00 | N/A |
| Financing Activities Common Stock Repurchase | N/A | 0.00 | 0.00 | -400.00M | N/A |
| Financing Activities Common Dividends | N/A | N/A | -75.90M | -126.40M | -126.40M |
| Financing Activities Other Financing Charges | N/A | N/A | 230.00M | -91.20M | 2.00M |
| Investing Activities Net Acquisitions | N/A | N/A | N/A | -6.87B | N/A |
| Financing Activities Long Term Debt Payments | N/A | N/A | N/A | N/A | N/A |
Data provided by Twelve Data
Technical Analysis
Key Insights
- The stock is currently in a sideways to slightly bearish trend, trading below its 200-day moving average (₹131.91) and near the 50-day moving average (₹123.79), indicating limited upward momentum.
- Key support levels are observed near the 52-week low at ₹98.35, while resistance is evident around the 52-week high at ₹155 and the 50-day moving average at ₹123.79.
- The price is below the 200-day moving average but close to the 50-day moving average, suggesting mixed signals on medium-term trend strength.
- Momentum indicators such as RSI, MACD, and Stochastic currently reflect neutral to slightly bearish readings, indicating subdued buying pressure and potential consolidation.
- Across daily, weekly, and monthly timeframes, the stock shows limited volatility with a beta of 0.365, and no strong breakout patterns are evident.
- Potential market scenarios include continued consolidation within the current price range or a gradual test of support levels if bearish momentum intensifies.
Trending News
1. Headline: Fiber Cement Market to Reach USD 26.8 Billion by 2033, Driven by 5.9% CAGR
Summary: Fiber Cement Market Overview The fiber cement market is currently positioned as a resilient segment within the global building materials industry valued at USD 17 8 billion in 2026 Its growth trajectory is underpinned by the increasing adoption of fiber ...
Sentiment: positive
2. Headline: Anjani Portland Cement Submits SEBI Compliance Certificate for Q4FY26
Summary: Anjani Portland Cement Limited filed its mandatory SEBI Regulation 74(5) certificate for Q4FY26 with BSE and NSE on April 6, 2026. The certificate, issued by registrar KFin Technologies Limited, confirms compliance with depository regulations and proper reporting of securities transactions ...
Sentiment: neutral
3. Headline: Portland Cement Market to Grow to US$ 299.1 Billion by 2033 - Persistence Market Research
Summary: Market Overview The global Portland cement market is on a steady growth trajectory supported by rapid urbanization expanding infrastructure projects and robust industrial development across emerging economies According to the latest study by Persistence Market Research the market is projected ...
Sentiment: positive
4. Headline: Daily Herald | Classifieds | Legals | LEGAL NOTICE UNITED STATES OF ...
Summary: LEGAL NOTICE UNITED STATES OF AMERICA STATE OF ILLINOIS COUNTY OF DUPAGE IN THE CIRCUIT COURT OF...
Sentiment: neutral
5. Headline: Markets Rally, But Andhra Cements Ltd Sinks to 52-Week Low in Stock-Specific Sell-Off
Summary: Andhra Cements Ltd’s share price declined sharply to hit a new 52-week low of Rs.47.7 on 23 March 2026, marking a significant drop amid broader market weakness and sectoral pressures. The stock underperformed both its sector and the benchmark indices, reflecting ongoing concerns about the ...
Sentiment: negative
6. Headline: Overview of Segmentation, Market Dynamics, and Competitive Landscape in the Fiber Cement Market
Summary: The fiber cement industry is gaining significant attention as sustainable and durable building materials become more crucial in modern construction With advancements in technology and growing urban development the market is set to experience substantial growth in the coming years ...
Sentiment: positive
7. Headline: Growth Patterns, Segment Analysis, and Competitive Approaches Influencing the Blended Cement Market
Summary: The blended cement industry is on track for impressive growth in the coming years driven by increasing environmental concerns and advancements in construction technologies As demand rises for more sustainable and high performance building materials the market is evolving to ...
Sentiment: positive
8. Headline: Cement capacity race with Birla group may ease as Adani shifts focus to margins | Company Business News
Summary: The rivalry between the Adani Group and the Aditya Birla Group’s UltraTech Cement Ltd has resulted in rapid manufacturing capacity expansion. In the last three-and-a-half years, the two conglomerates have added nearly 120 mtpa of cement manufacturing capacity between them.
Sentiment: positive
9. Headline: Kenya: Portland Cement Raises Blue Triangle Price Amid Rising Input Costs - allAfrica.com
Summary: East African Portland Cement Company has raised the price of its Blue Triangle cement by Sh10 per bag, citing rising raw material costs.
Sentiment: negative
10. Headline: Portland Cement raises Blue Triangle price amid rising input costs - Capital Business
Summary: In a notice to customers, the firm said the adjustment affects its 50kg bag of Portland Pozzolanic Cement and took effect on March 11, translating to a 1.39 percent increase in the ex-factory price.
Sentiment: negative
Powered by Brave
Recent Updates
News Summary
Recent updates for Anjani Portland Cement Ltd. highlight the company's active engagement with shareholders through the launch of its second 'Saksham Niveshak' campaign aimed at unclaimed dividend awareness, running from April 1 to July 9, 2026. The company has also complied with SEBI regulations by submitting the mandatory compliance certificate for Q4FY26, reflecting adherence to governance standards. Market sentiment includes mixed signals, with external ratings such as Markets Mojo assigning a 'Strong Sell' rating as of November 2025, indicating concerns about financial performance. These developments underscore the company's focus on regulatory compliance and shareholder communication amidst ongoing financial challenges.
News Sentiment
Sentiment across recent updates is mixed to neutral, with positive undertones from shareholder engagement initiatives and regulatory compliance, contrasted by cautious or negative external assessments reflecting financial and operational concerns. This blend suggests a complex market perception balancing governance diligence against performance headwinds.
Analytical Overview
Analysis Summary
Valuation Metrics: Anjani Portland Cement Ltd. exhibits a negative trailing P/E ratio of -4.13 compared to the industry average, indicating current unprofitability. The price-to-book ratio of 1.66 is moderate but higher than some peers, reflecting valuation relative to net assets.
Growth Trajectory: The company experienced a quarterly revenue decline of approximately 23.9%, with negative earnings growth year-over-year, signaling challenges in sustaining top-line and profitability growth. Operating and free cash flows are negative, indicating cash generation difficulties.
Financial Health: A high debt-to-equity ratio of 223.15 and a current ratio below 1 (0.52) highlight liquidity constraints and significant leverage, which may pressure financial stability. Cash reserves are minimal relative to debt levels.
Sector Specific Factors: The Indian cement sector benefits from ongoing urbanization and infrastructure development, presenting growth opportunities. However, rising input costs and competitive pressures pose challenges. Regulatory compliance and market dynamics also influence operational performance.
Market Positioning And Competitive Advantages: APCL maintains a recognized brand with quality products and established distribution, but faces intense competition from larger, financially stronger peers. Its smaller scale and financial metrics suggest a need for strategic focus to enhance competitiveness.
Overall Business and Market Assessment
Supporting Factors: Established market presence with quality cement products supporting infrastructure growth.
Risk Factors: Negative profitability and declining revenue growth impacting financial performance.
SWOT Analysis
Strengths
- The company has a well-established presence in the Indian cement industry.
- Anjani Portland Cement produces reliable ordinary Portland cement used widely in construction.
- Strong distribution network supports market reach across various sectors.
- Compliance with regulatory requirements demonstrates governance discipline.
Weaknesses
- Negative profitability margins and return on equity indicate operational challenges.
- High debt-to-equity ratio reflects significant financial leverage and risk.
- Negative operating and free cash flows suggest cash generation difficulties.
- Limited institutional investor participation may constrain capital access.
Opportunities
- Growing urbanization and infrastructure development in India drive cement demand.
- Increasing adoption of fiber and blended cement products offers market expansion potential.
- Potential for operational improvements to enhance margins and cash flow.
- Engagement in shareholder awareness campaigns may improve investor relations.
Threats
- Rising raw material and input costs could pressure profitability.
- Intense competition from larger, financially stronger industry peers.
- Economic fluctuations impacting construction activity and cement consumption.
- Regulatory changes and compliance costs may affect operational flexibility.
Company Description
Anjani Portland Cement Ltd. is a prominent player in the construction materials sector, primarily involved in the production and sale of cement. Established with the goal of providing high-quality building materials, the company operates to meet the varying demands of construction markets. It manufactures ordinary Portland cement which is used extensively in residential, commercial, and industrial projects. This cement is recognized for its reliability and strength, making it a preferred choice in the infrastructure industry. Anjani Portland Cement Ltd. serves various sectors including real estate, infrastructure developers, and government projects, contributing to significant developments in urban and rural settings. The company's reputation is built on consistent quality, well-maintained production facilities, and efficient distribution networks. It holds a crucial role in the cement industry, reflecting India’s ongoing growth and urbanization initiatives by supporting construction trends across the country.